Presented by: Stewart Forsyth Agilent Back to Basics Why Spectrum Analysis is Important.

Agilent Technologies
Spectrum Analysis
Back to Basics
Back to Basics Training
1

Agenda
Introduction
Overview:
• What is Spectrum and Signal Analysis?
• What Measurements are available?
Theory of Operation
Specifications
Modern Signal Analyzer Designs & Capabilities
• Wide Bandwidth Vector Measurements
Wrap-up
Appendix
Back to Basics Training
2

Analyzer Definitions
Spectrum Analyzer
– “A spectrum analyzer measures the magnitude of an input signal versus frequency within the full frequency range of the instrument. The primary use is to measure the power of the spectrum of known and unknown signals.”
Vector Signal Analyzer
– “A vector signal analyzer measures the magnitude and phase of an input signal at a single frequency within the IF bandwidth of the instrument. The primary use is to make in-channel measurements, such as error vector magnitude, code domain power, and spectral flatness, on known signals.”
Signal Analyzer
– “A signal analyzer provides the functions of a spectrum analyzer and a vector signal analyzer.”
Back to Basics Training
3

Overview What is Spectrum Analysis?
•Display and measure amplitude versus frequency for RF & MW signals
•Separate or demodulate complex signals into their base components (sine waves)
Spectrum Analysis
Back to Basics Training
4
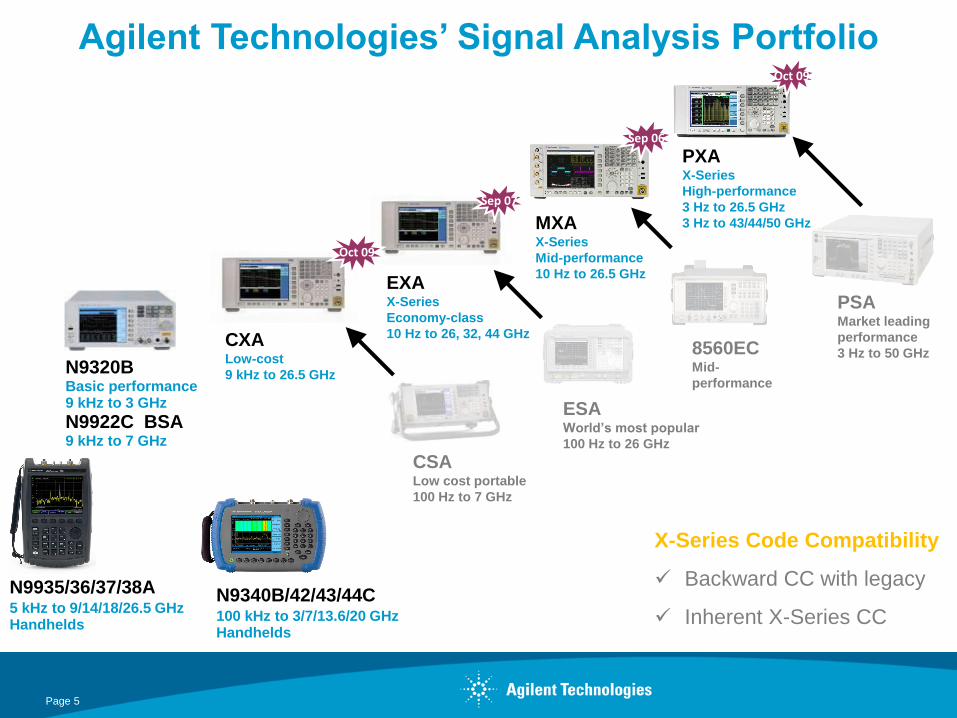
Agilent Technologies’ Signal Analysis Portfolio
ESA World’s most popular
100 Hz to 26 GHz
8560EC Mid-
performance
EXA X-Series
Economy-class
10 Hz to 26, 32, 44 GHz
Sep 07
PSA Market leading
performance
3 Hz to 50 GHz CXA Low-cost
9 kHz to 26.5 GHz
Oct 09
CSA Low cost portable
100 Hz to 7 GHz
MXA X-Series
Mid-performance
10 Hz to 26.5 GHz
Sep 06
X-Series Code Compatibility
Backward CC with legacy
Inherent X-Series CC
Oct 09
PXA X-Series
High-performance
3 Hz to 26.5 GHz
3 Hz to 43/44/50 GHz
Page 5
N9320B Basic performance 9 kHz to 3 GHz
N9922C BSA 9 kHz to 7 GHz
N9340B/42/43/44C 100 kHz to 3/7/13.6/20 GHz Handhelds
N9935/36/37/38A 5 kHz to 9/14/18/26.5 GHz Handhelds
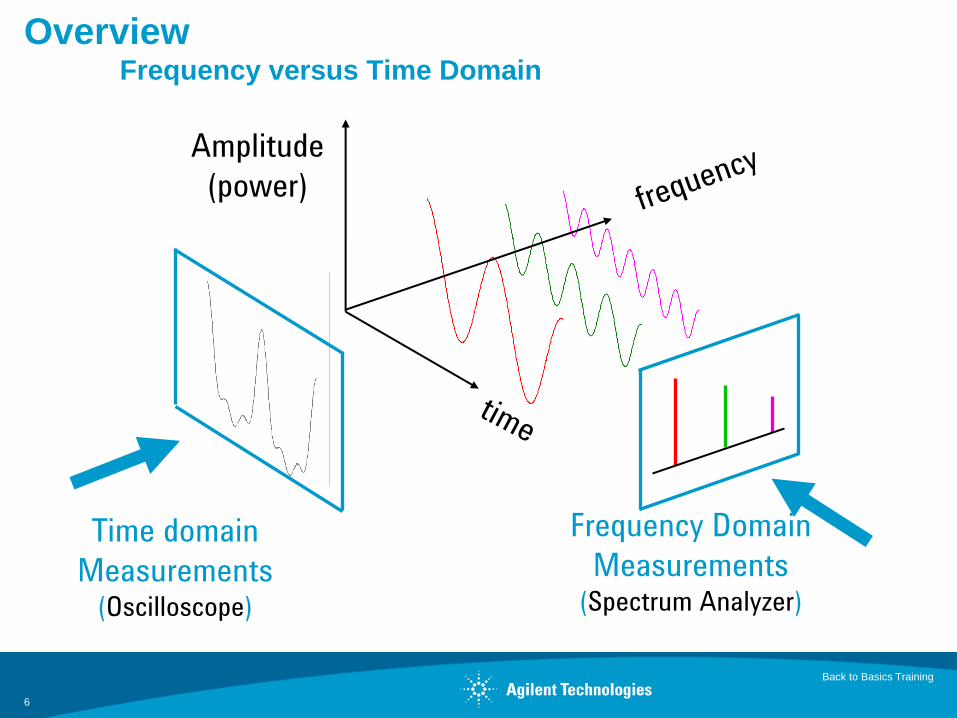
Overview Frequency versus Time Domain
Time domain
Measurements (Oscilloscope)
Frequency Domain
Measurements (Spectrum Analyzer)
Amplitude
(power)
Back to Basics Training
6

Overview Types of Measurements Available
Frequency, power, modulation, distortion
& noise
– Spectrum monitoring – Spurious emissions – Scalar network analysis – Noise figure & phase noise – Harmonic & intermodulation distortion – Analog, digital, burst & pulsed RF Modulation – Wide bandwidth vector analysis – Electromagnetic interference – Measurement range (-172 dBm to +30 dBm) – Frequency range (3 Hz to >>325 GHz)
7
Distortion
Noise
Modulation
Spur Search

Overview Different Types of Analyzers
Parallel filters measured
simultaneously
LCD shows full
spectral display
A
f f 1 f 2
FFT Analyzer
Back to Basics Training
8

Overview Different Types of Analyzers
A
f f 1 f 2
Filter 'sweeps' over range of
interest
LCD shows full
spectral display
Swept Analyzer
Back to Basics Training
9

Agenda
Introduction
Overview
Theory of Operation:
• Swept Spectrum Analyzer Hardware
Specifications
Modern spectrum analyzer designs & capabilities
– Wide Bandwidth Vector Measurements
Wrap-up
Appendix
Back to Basics Training
10

Theory of Operation Swept Spectrum Analyzer Block Diagram
Pre-Selector
Or Low Pass
Input Filter
Crystal
Reference
Oscillator
Log
Amp
RF input
attenuator
mixer
IF filter
(RBW) envelope
detector
video
filter local
oscillator
sweep
generator
IF gain
Input
signal
ADC, Display
& Video
Processing
Back to Basics Training
11
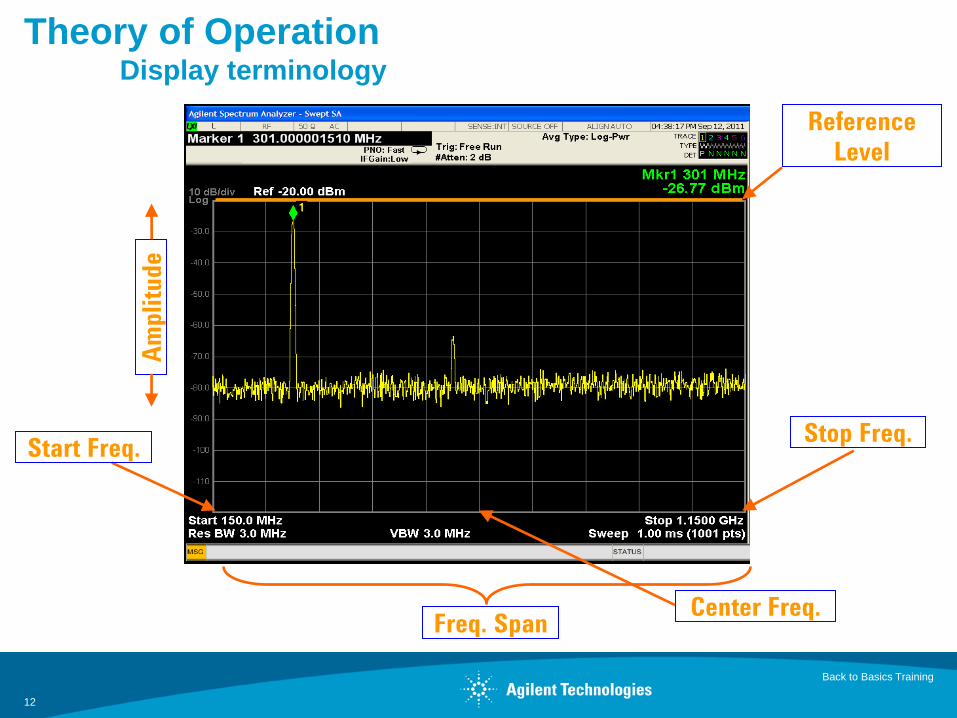
Theory of Operation Display terminology
Freq. Span
Stop Freq.
Center Freq.
Reference
Level A
mpli
tude
Back to Basics Training
12
Start Freq.
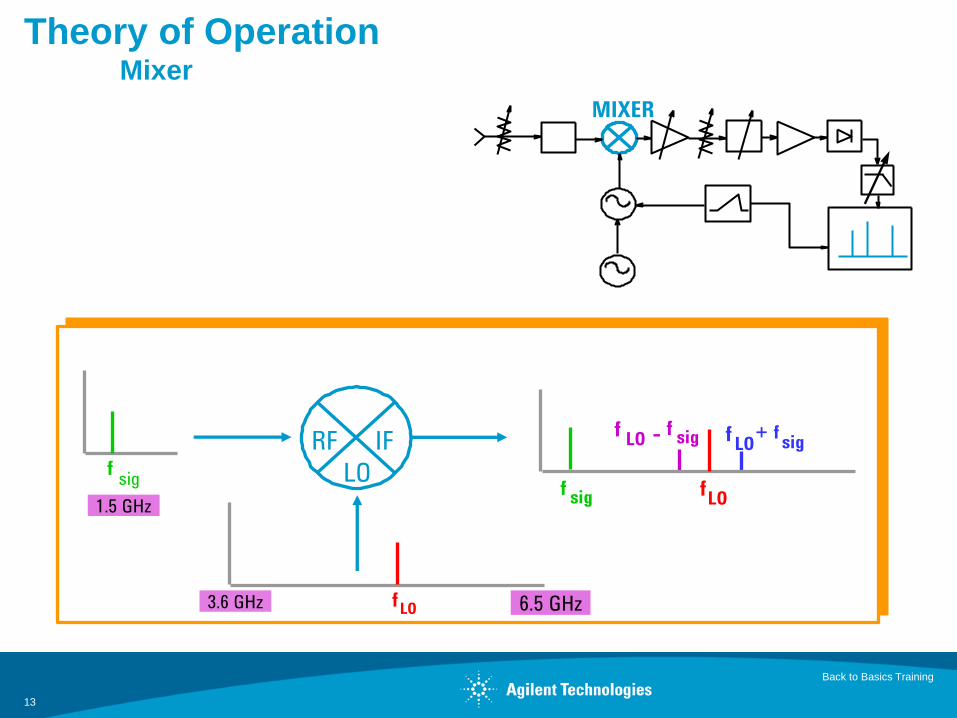
Theory of Operation Mixer
f sig
LO f
f sig LO
f
LO f f sig - LO
f f sig
+ RF
LO
IF
MIXER
1.5 GHz
3.6 GHz 6.5 GHz
Back to Basics Training
13

Theory of Operation IF Filter (Resolution Bandwidth – RBW)
Display
Input
Spectrum
IF Bandwidth
(RBW)
IF Filter
A B C
Back to Basics Training
14
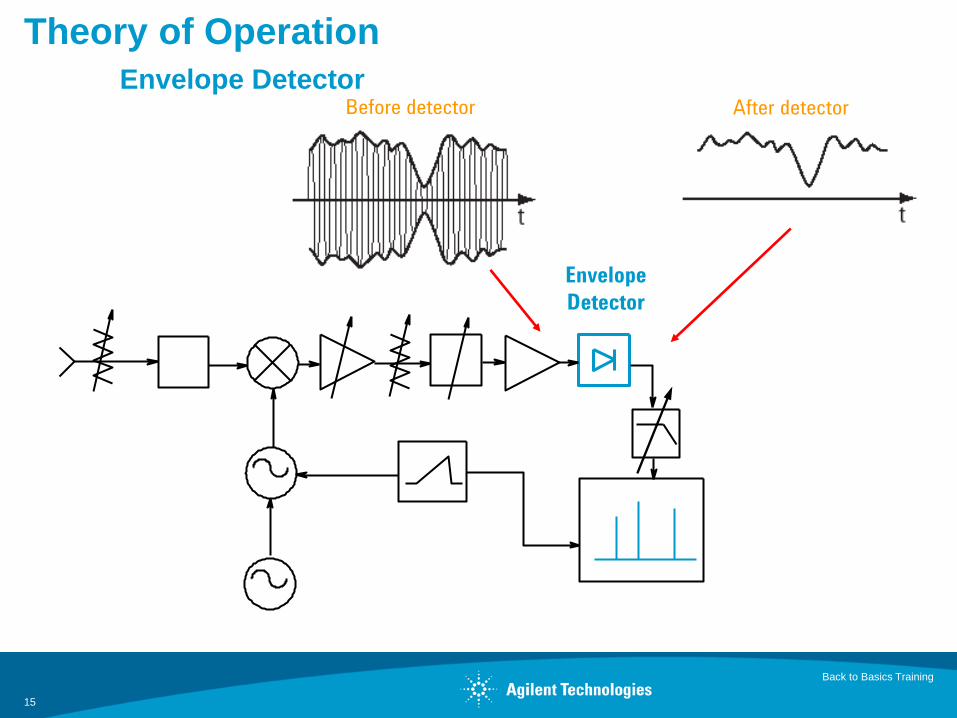
Theory of Operation
Envelope Detector
Envelope
Detector
Before detector After detector
Back to Basics Training
15

Theory of Operation Envelope Detector and Detection Types
Negative detection: smallest value
in bin displayed
Positive detection: largest value
in bin displayed
Sample detection: middle value in bin
displayed
bins/buckets*
Other Detectors: Normal (Rosenfell),
Average (RMS Power)
Digitally Implemented Detection Types
Envelope
Detector
ADC, Display &
Video Processing
*Sweep points
Back to Basics Training
16

Theory of Operation
Average Detector Type
Time
Volts
bin
Sample
detection
Power Average Detection (rms) = Square root of the sum of the
squares of ALL of the voltage data values in the bin /50Ω
x
Neg Peak
detection x
x
Pos Peak
detection
Envelope
Detector
ADC, Display &
Video Processing
Back to Basics Training
17

Theory of Operation Video Filter (Video Bandwidth – VBW)
Video
Filter
Back to Basics Training
18

Theory of Operation Video Filter vs. Trace/Video averaging
• Video Filter operates as the sweep
progresses, sweep time may be required to
slow down by the transient response of the
VBW filter.
• Trace/Video Average takes multiple
sweeps, sweep time for each sweep is not
affected
• Many signals give the same results with
either video filtering or trace averaging Trace averaging for 1, 5, 20, and 100 sweeps, top to
bottom (trace position offset for each set of sweeps)
Video Filter
ADC, Display & Video
Processing
Back to Basics Training
19

LCD Display, ADC
& Video processing
SWEEP
GEN
LO
Theory of Operation Other Components
Back to Basics Training
20
IF GAIN RF INPUT
ATTENUATOR

Theory of Operation How it All Works Together - 3 GHz spectrum analyzer
3.6
(GHz)
(GHz)
0 3 6 1 2 4 5
0 3 1 2
3 6 4 5
3.6 GHz
(GHz) 0 3 1 2
f IF
Signal Range LO Range
sweep generator
LO
LCD display
input
mixer
IF filter
detector
A
f
f LO
f s
f s
f s
f LO
- f
s f
LO +
f LO
3.6 6.5
6.5
Back to Basics Training
21
Agenda
Overview
Theory of Operation
Specifications:
• Which are important and why?
Modern spectrum analyzer designs & capabilities
– Wide Bandwidth Vector Measurements
Wrap-up
Appendix
Back to Basics Training
22

Key Specifications
• Safe spectrum analysis
• Frequency Range
• Accuracy: Frequency & Amplitude
• Resolution
• Sensitivity
• Distortion
• Dynamic Range
Back to Basics Training
23

Specifications? A Definition
Specifications describe the performance of parameters covered by the product warranty (temperature = 0 to 55°C, unless otherwise noted).
Typical values describe additional product performance information that is not covered by the product warranty. It is performance beyond specification that 80 % of the units exhibit with a 95 % confidence level over the temperature range 20 to 30° C. Typical performance does not include measurement uncertainty.
Nominal values indicate expected performance, or describe product performance that is useful in the application of the product, but is not covered by the product warranty.
Back to Basics Training
24

Specifications
Practicing safe spectrum analysis - Safe Hookups to RF Input
!
0 V DC MAX
+30dBm (1W) MAX
•Use best practices to eliminate static discharge to the RF input!
•Do not exceed the Damage Level on the RF Input!
•Do not input signals with DC bias exceeding what the analyzer can tolerate while DC coupled!
Back to Basics Training
25

Specifications Frequency Range
Description Specifications
Internal Mixing
Bands
0 3 Hz to 3.6 GHz
1 3.5 to 8.4 GHz
2 8.3 to 13.6 GHz
3 13.5 to 17.1 GHz
4 17 to 26.5 GHz
5 26.4 to 34.5 GHz
6 34.4 to 50 GHz
Back to Basics Training
26
Page 27
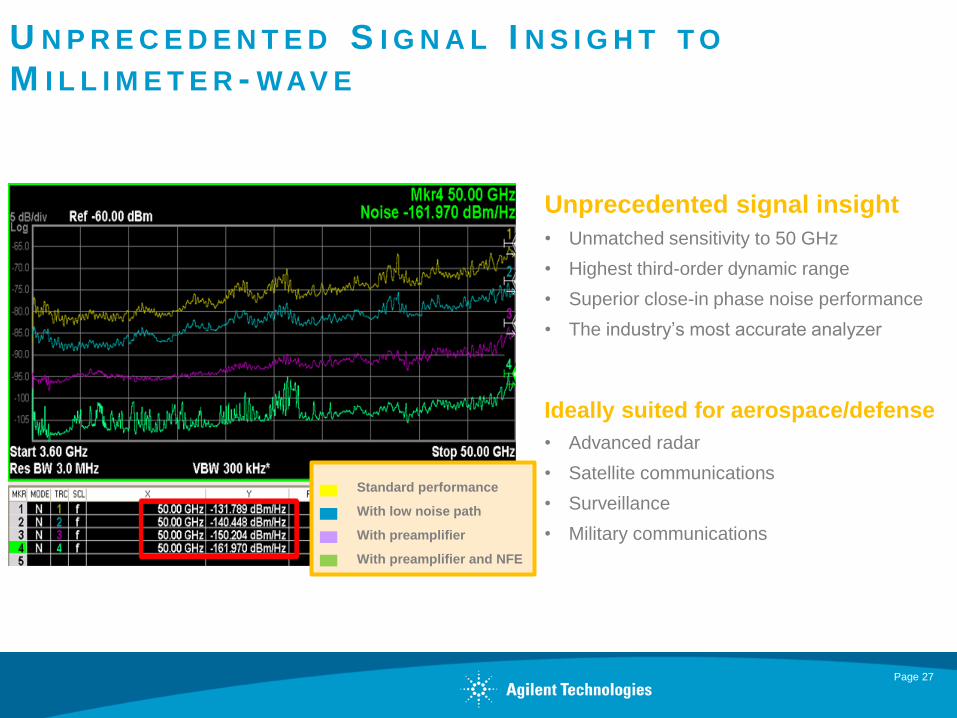
Unprecedented signal insight
• Unmatched sensitivity to 50 GHz
• Highest third-order dynamic range
• Superior close-in phase noise performance
• The industry’s most accurate analyzer
U N P R E C E D E N T E D S I G N A L I N S I G H T T O
M I L L I M E T E R - WAV E
Ideally suited for aerospace/defense
• Advanced radar
• Satellite communications
• Surveillance
• Military communications
• Standard performance
• With low noise path
• With preamplifier
• With preamplifier and NFE

E X T E N D U N M AT C H E D P E R F O R M A N C E W I T H
E X T E R N A L M I X I N G Extend to 325 GHz and beyond
• Supported measurements
• Spectrum analysis
• PowerSuite one-button power
measurements
• N9068A phase noise measurement
application
• 89600A VSA
• Supported external mixers
• M1970V, M1970E and M1970W
• 11970 Series
• OML Inc.
• VDI
• And other third-party external mixers
Page 28
Better close-in phase noise
performance than internally-
mixed 67 GHz analyzers!

Specifications Accuracy: Frequency & amplitude
Components which contribute to uncertainty are:
• Input mismatch (VSWR)
• RF Input attenuator (Atten. switching uncertainty)
• Mixer and input filter (frequency response)
• IF gain/attenuation (reference level accuracy)
• RBW filters (RBW switching uncertainty)
• Log amp (display scale fidelity)
• Reference oscillator (frequency accuracy)
• Calibrator (amplitude accuracy)
Back to Basics Training
29
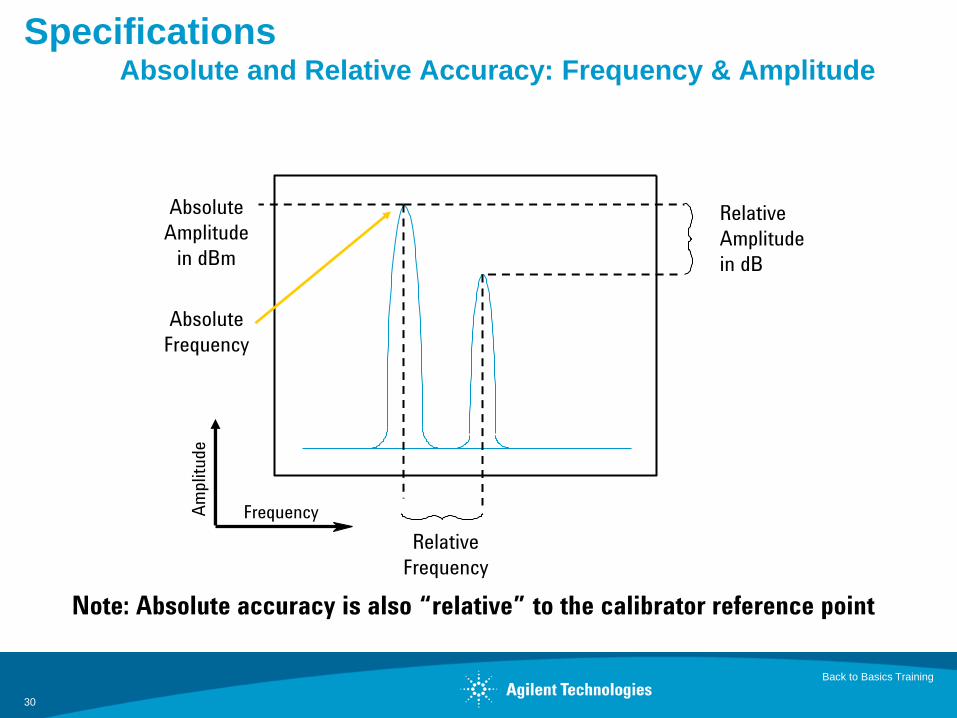
Specifications Absolute and Relative Accuracy: Frequency & Amplitude
Absolute
Amplitude
in dBm
Relative
Amplitude
in dB
Relative
Frequency
Frequency
Absolute
Frequency
Am
plit
ude
Note: Absolute accuracy is also “relative” to the calibrator reference point
Back to Basics Training
30

Specifications Accuracy: Frequency Readout Accuracy
• From the PXA Data Sheet:
RBW Error IF filter center frequency error
Span Accuracy Residual Error
Determined by Reference
Accuracy
± (marker frequency x freq reference accuracy +
0.1%*span + 5% of RBW + 2Hz + 0.5 x Horiz. Res.*)
*Horizontal resolution is span/(sweep points – 1)
Back to Basics Training
31

Specifications Accuracy: Frequency Readout Accuracy Example
Frequency: 1 GHz
Span: 400 kHz
RBW: 3 kHz
Sweep points: 1000
Calculation: (1x10⁹Hz) x (±1.55x10⁻⁷/Year ref. Error) = 155Hz
400kHz Span x 0.1% = 400Hz
3kHz RBW x 5% = 150Hz
2Hz + 0.5 x 400kHz/(1000-1) = 202Hz
Total uncertainty = ±907Hz
*Utilizing internal frequency counter improves accuracy to ±155Hz
Back to Basics Training
32
** The Maximum # of sweep points for the X-Series is 40,001 which helps to
achieve the best frequency readout accuracy
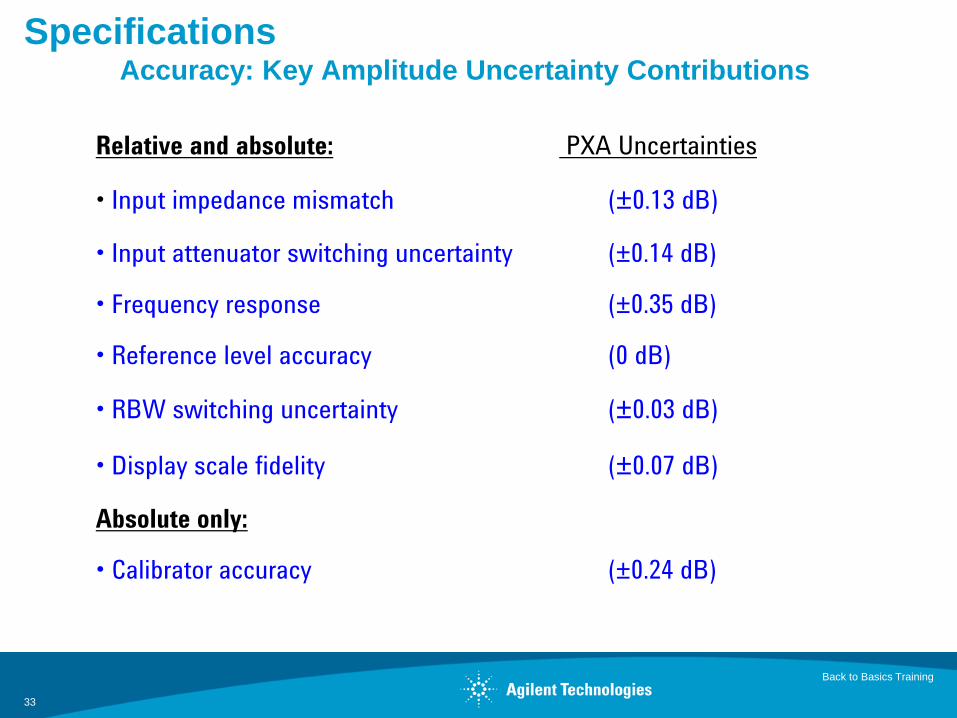
Specifications Accuracy: Key Amplitude Uncertainty Contributions
Relative and absolute: PXA Uncertainties
• Input impedance mismatch (±0.13 dB)
• Input attenuator switching uncertainty (±0.14 dB)
• Frequency response (±0.35 dB)
• Reference level accuracy (0 dB)
• RBW switching uncertainty (±0.03 dB)
• Display scale fidelity (±0.07 dB)
Absolute only:
• Calibrator accuracy (±0.24 dB)
Back to Basics Training
33
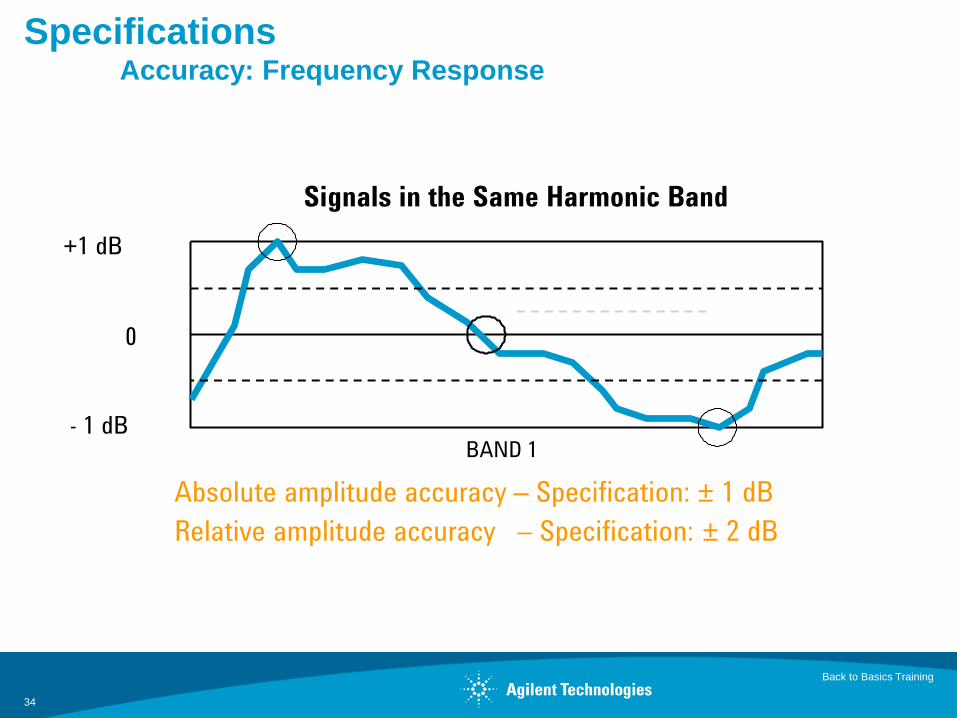
Specifications Accuracy: Frequency Response
- 1 dB
+1 dB
0
BAND 1
Absolute amplitude accuracy – Specification: ± 1 dB
Relative amplitude accuracy – Specification: ± 2 dB
Signals in the Same Harmonic Band
Back to Basics Training
34
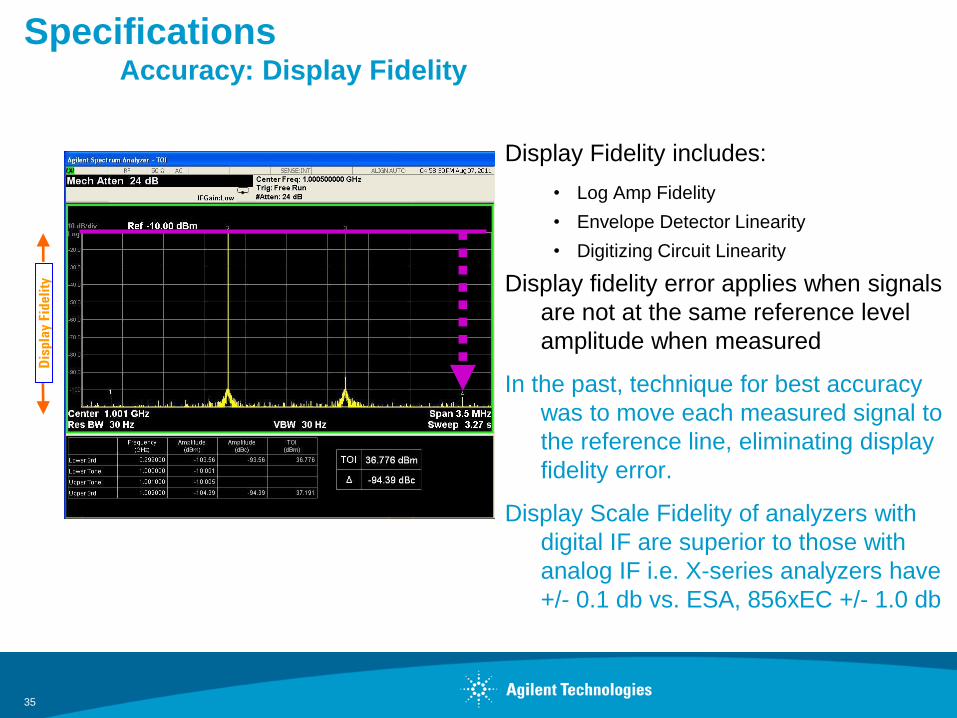
Specifications Accuracy: Display Fidelity
Display Fidelity includes:
• Log Amp Fidelity
• Envelope Detector Linearity
• Digitizing Circuit Linearity
Display fidelity error applies when signals
are not at the same reference level
amplitude when measured
In the past, technique for best accuracy
was to move each measured signal to
the reference line, eliminating display
fidelity error.
Display Scale Fidelity of analyzers with
digital IF are superior to those with
analog IF i.e. X-series analyzers have
+/- 0.1 db vs. ESA, 856xEC +/- 1.0 db
35
Dis
pla
y Fid
eli
ty
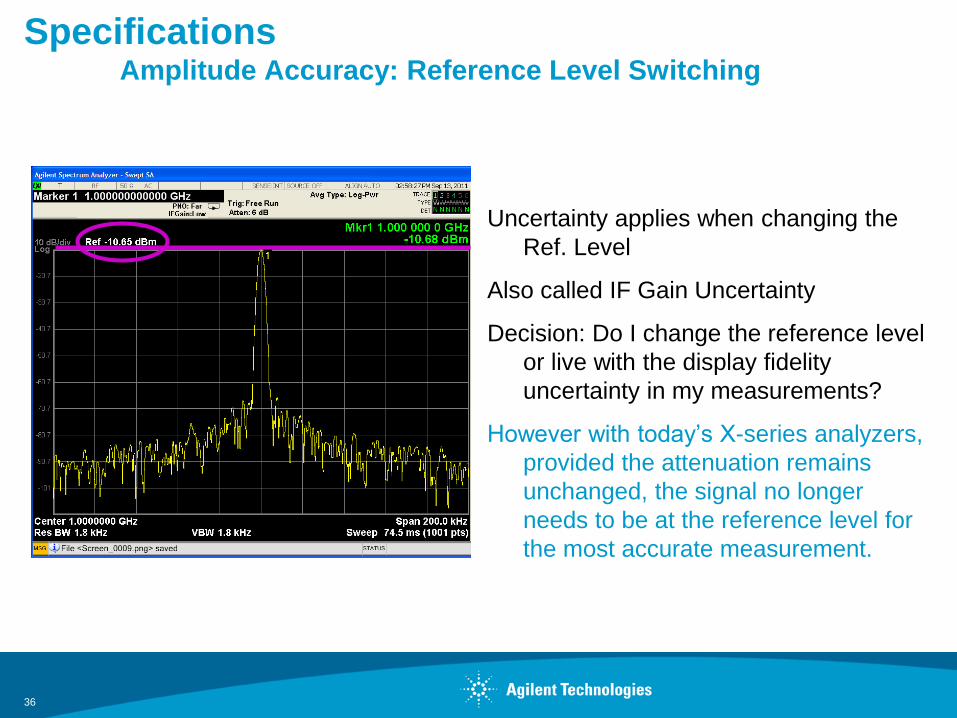
Specifications Amplitude Accuracy: Reference Level Switching
Uncertainty applies when changing the
Ref. Level
Also called IF Gain Uncertainty
Decision: Do I change the reference level
or live with the display fidelity
uncertainty in my measurements?
However with today’s X-series analyzers,
provided the attenuation remains
unchanged, the signal no longer
needs to be at the reference level for
the most accurate measurement.
36
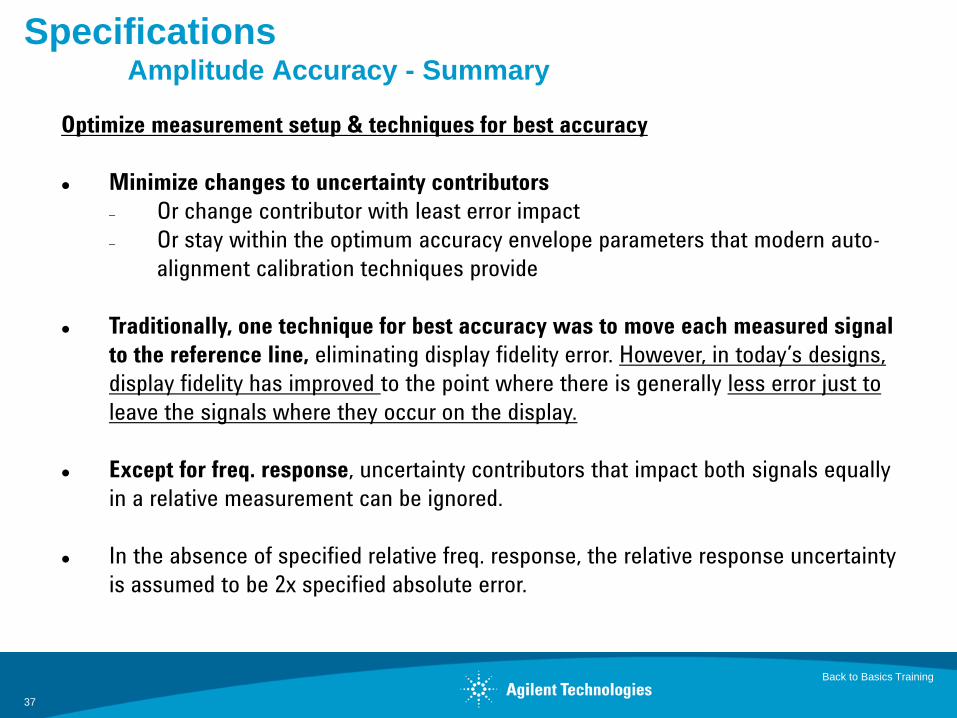
Specifications Amplitude Accuracy - Summary
Optimize measurement setup & techniques for best accuracy
Minimize changes to uncertainty contributors
– Or change contributor with least error impact
– Or stay within the optimum accuracy envelope parameters that modern auto-
alignment calibration techniques provide
Traditionally, one technique for best accuracy was to move each measured signal
to the reference line, eliminating display fidelity error. However, in today’s designs,
display fidelity has improved to the point where there is generally less error just to
leave the signals where they occur on the display.
Except for freq. response, uncertainty contributors that impact both signals equally
in a relative measurement can be ignored.
In the absence of specified relative freq. response, the relative response uncertainty
is assumed to be 2x specified absolute error.
Back to Basics Training
37
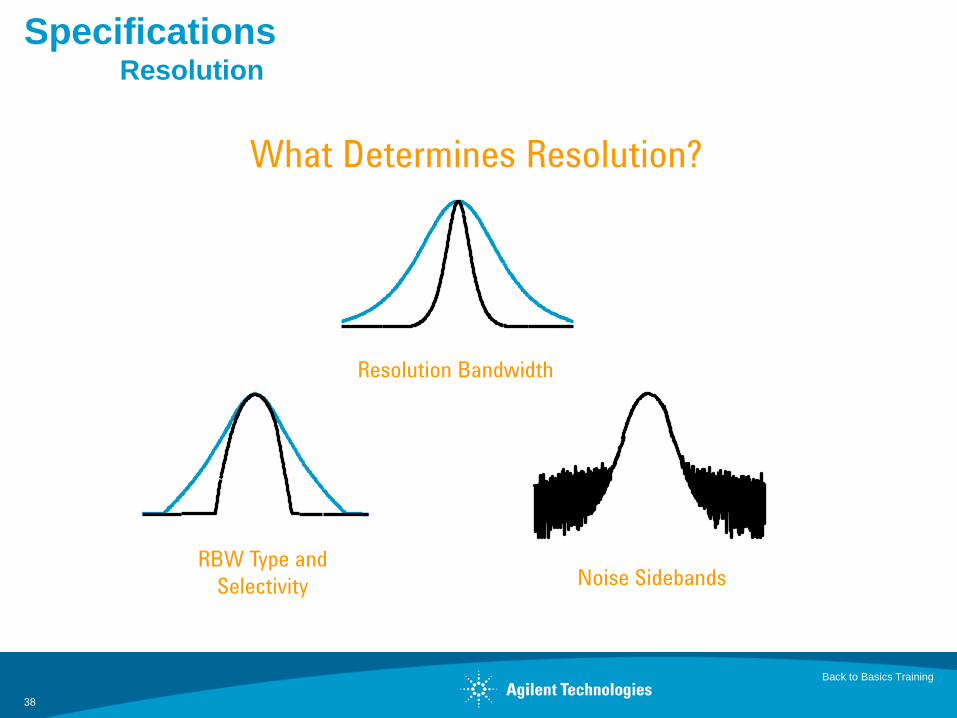
Specifications Resolution
Resolution Bandwidth
Noise Sidebands
What Determines Resolution?
RBW Type and
Selectivity
Back to Basics Training
38

Specifications Resolution: Resolution Bandwidth
3 dB 3 dB BW
LO
Mixer
IF Filter/
Resolution Bandwidth Filter (RBW)
Sweep
Envelope
Detector
Input
Spectrum
Display
RBW
Back to Basics Training
39
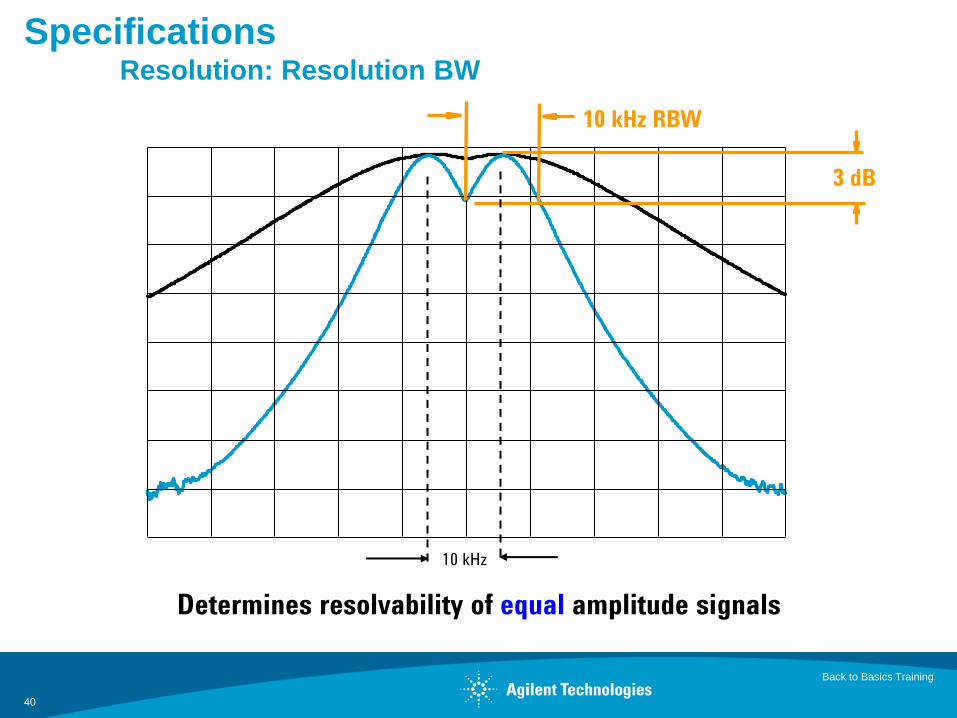
Specifications Resolution: Resolution BW
3 dB
10 kHz
10 kHz RBW
Determines resolvability of equal amplitude signals
Back to Basics Training
40

Specifications Resolution BW Selectivity or Shape Factor
3 dB
60 dB
60 dB BW
60 dB BW
3 dB BW
3 dB BW
Selectivity =
Determines resolvability of unequal amplitude signals
Back to Basics Training
41

10 kHz
RBW = 10 kHz RBW = 1 kHz
Selectivity 15:1
10 kHz
distortion
products
60 dB BW =
15 kHz
7.5 kHz
3 dB
60 dB
Specifications Resolution BW Selectivity or Shape Factor
Back to Basics Training
42
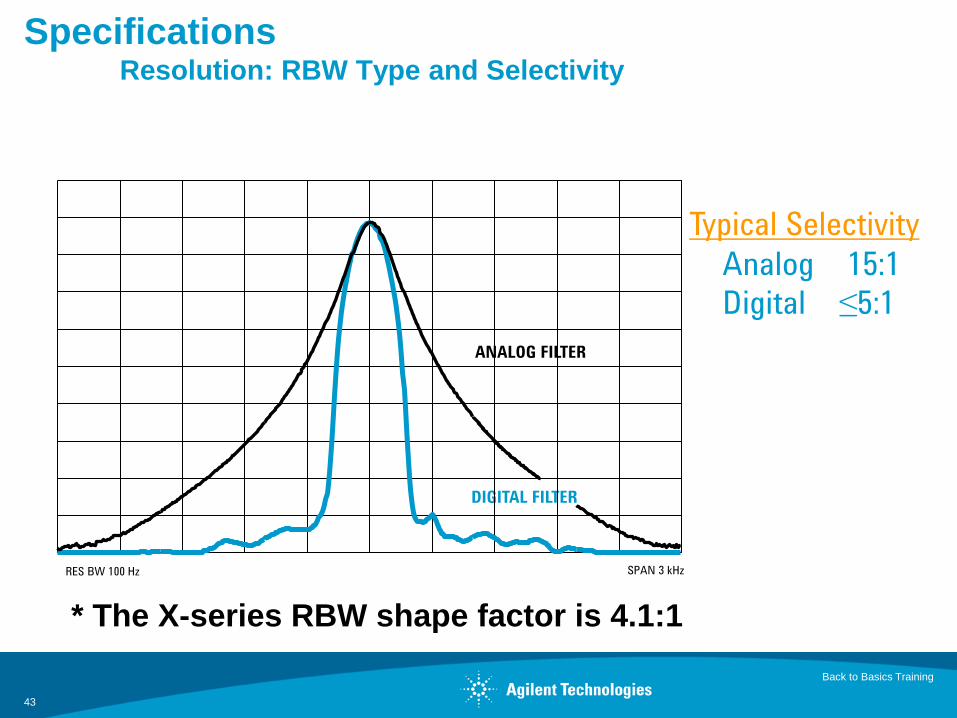
Specifications Resolution: RBW Type and Selectivity
DIGITAL FILTER
ANALOG FILTER
SPAN 3 kHz RES BW 100 Hz
Typical Selectivity
Analog 15:1
Digital ≤5:1
Back to Basics Training
43
* The X-series RBW shape factor is 4.1:1

Specifications Resolution: Noise Sidebands
Noise Sidebands can prevent
resolution of unequal signals
Phase Noise
Back to Basics Training
44

Specifications Resolution: RBW Determines Sweep Time
Penalty For Sweeping Too Fast
Is An Uncalibrated Display
Swept too fast
Meas Uncal
Back to Basics Training
45
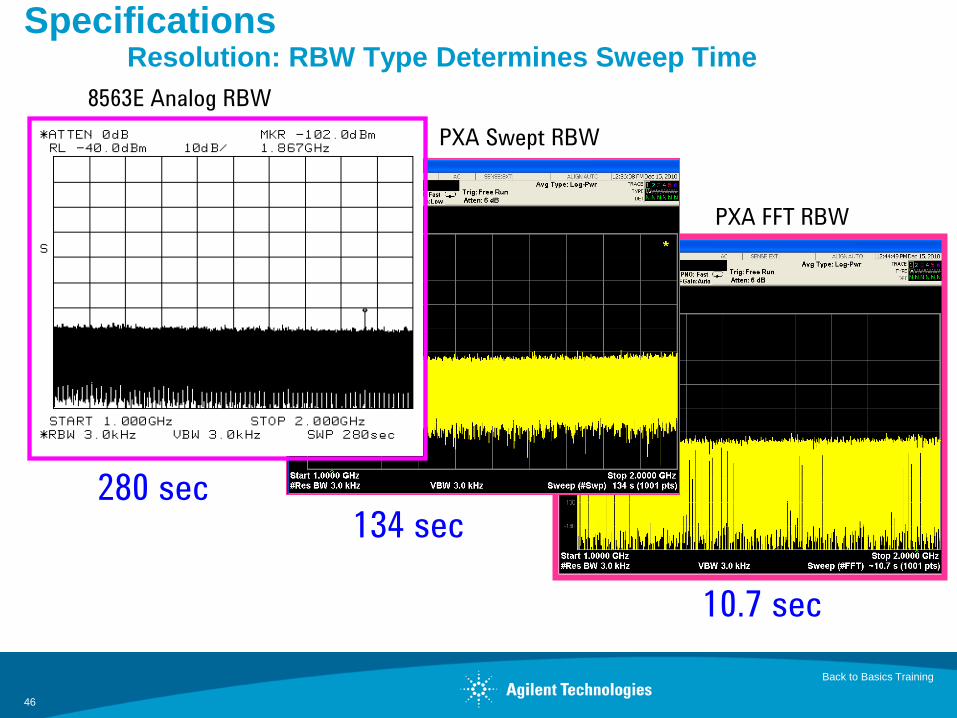
Specifications Resolution: RBW Type Determines Sweep Time
280 sec 134 sec
10.7 sec
8563E Analog RBW
PXA Swept RBW
PXA FFT RBW
Back to Basics Training
46

Specifications Sensitivity/DANL
Sweep
LO
Mixer RF
Input
Res BW Filter
Detector
A Spectrum Analyzer Generates and Amplifies Noise Just
Like Any Active Circuit
Back to Basics Training
47
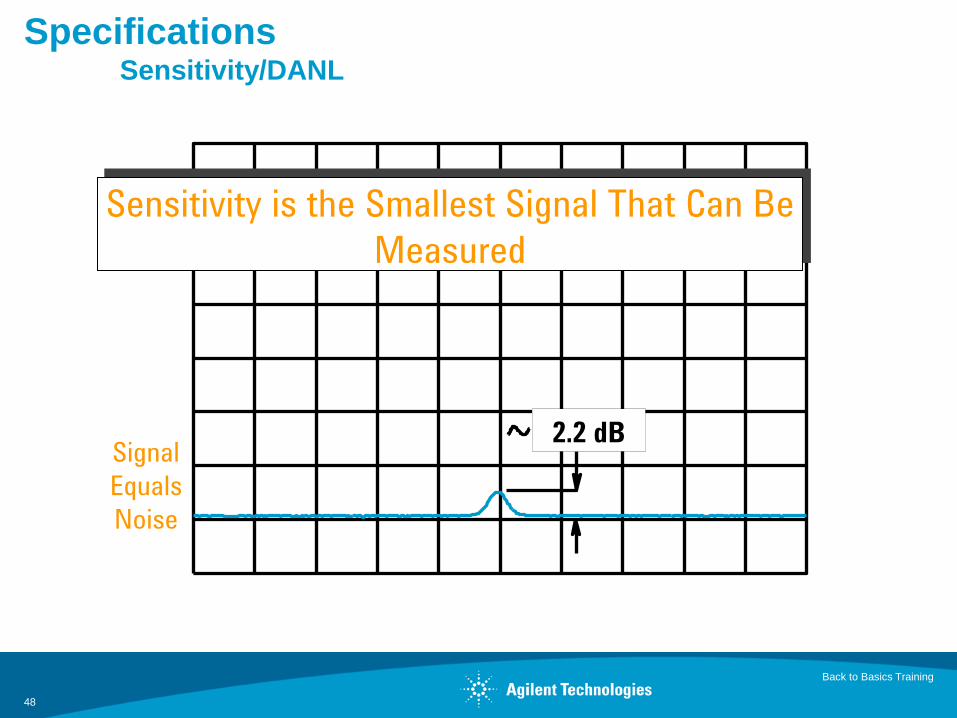
Specifications Sensitivity/DANL
Signal
Equals
Noise
Sensitivity is the Smallest Signal That Can Be
Measured
2.2 dB
Back to Basics Training
48

Specifications Sensitivity/DANL
10 dB
Attenuation = 10 dB Attenuation = 20 dB
signal level
Effective Level of Displayed Noise is a Function
of RF Input Attenuation
Signal To Noise Ratio Decreases as
RF Input Attenuation is Increased
Back to Basics Training
49
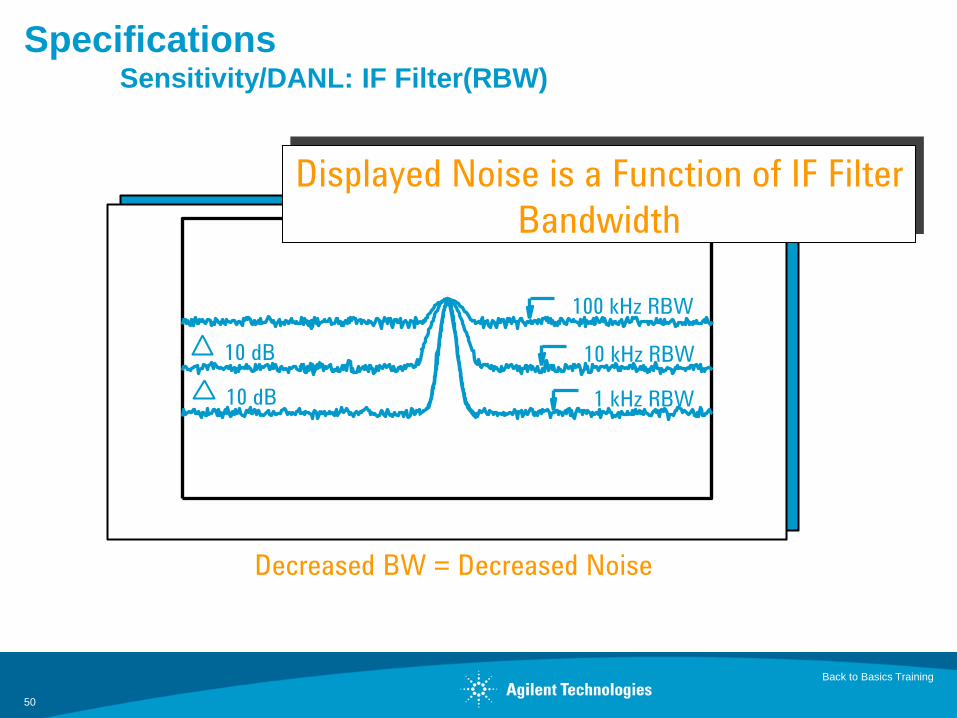
Specifications Sensitivity/DANL: IF Filter(RBW)
Decreased BW = Decreased Noise
100 kHz RBW
10 kHz RBW
1 kHz RBW
10 dB
10 dB
Displayed Noise is a Function of IF Filter
Bandwidth
Back to Basics Training
50

Specifications Sensitivity/DANL: Video BW filter (or Trace Averaging)
Video BW or Trace Averaging Smoothes Noise for Easier
Identification of Low Level Signals
Back to Basics Training
51
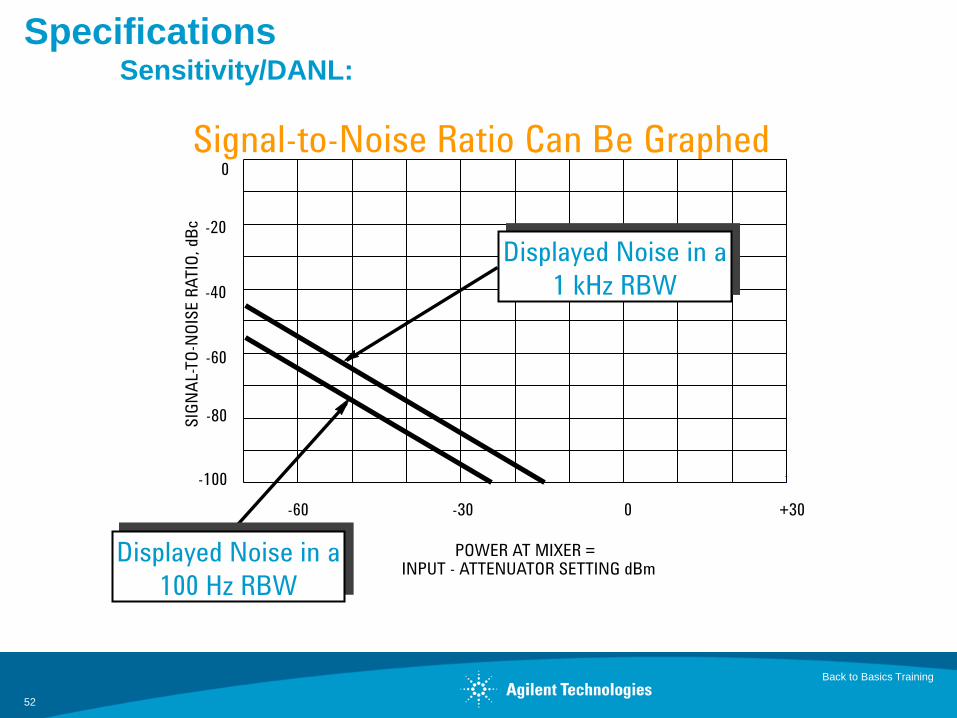
Specifications Sensitivity/DANL:
POWER AT MIXER = INPUT - ATTENUATOR SETTING dBm
SIG
NA
L-T
O-N
OIS
E R
ATIO
, dB
c
0
-20
-40
-60
-80
-100
-60 -30 0 +30
.
Displayed Noise in a
1 kHz RBW
Displayed Noise in a
100 Hz RBW
Signal-to-Noise Ratio Can Be Graphed
Back to Basics Training
52

N O I S E F L O O R E X T E N S I O N ( N F E )
Page 53
Standard feature that improves DANL for the PXA
Noise Floor Extension
• The PXA combines real-time measurement processing with an unprecedented characterization of
the analyzer’s own noise to allow that noise to be accurately removed from measurements.
• The improvement from noise floor extension varies from RF to millimeter wave. At RF, from about
3.5 dB for CW and pulsed signals to approximately 8 dB for noise-like signals, and up to 12 dB or
more in some applications.
• DANL at 2 GHz is –161 dBm without a preamp and –172 dBm with the preamp.
• Standard
• With NFE
• Standard
• With LNP
• With NFE

Hardware Option that improves DANL for the PXA
L O W N O I S E P A T H ( L N P )
Page 54
• At microwave frequencies any sort of signal routing or switching results in signal path loss.
• Preamplifiers can compensate for this loss and improve signal/noise for small signals, but
they can cause distortion in the presence of larger signals
• LNP allows the “lossy” elements normally found in the RF input chain to be completely
bypassed for highest sensitivity without a preamplifier
• LNP allows measurements of small spurs w/o speed penalty imposed by narrow RBW that
would otherwise be needed for adequate noise level

L N P B L O C K D I A G R A M
Page 55

Specifications Sensitivity/DANL: Summary
Narrowest Resolution BW
Minimum RF Input Attenuation
Sufficient Averaging (video or trace)
Using the Preamp also improves sensitivity
Low Noise Path (PXA only)
Noise Floor Extension (PXA only)
For Best Sensitivity Use:
Back to Basics Training
56
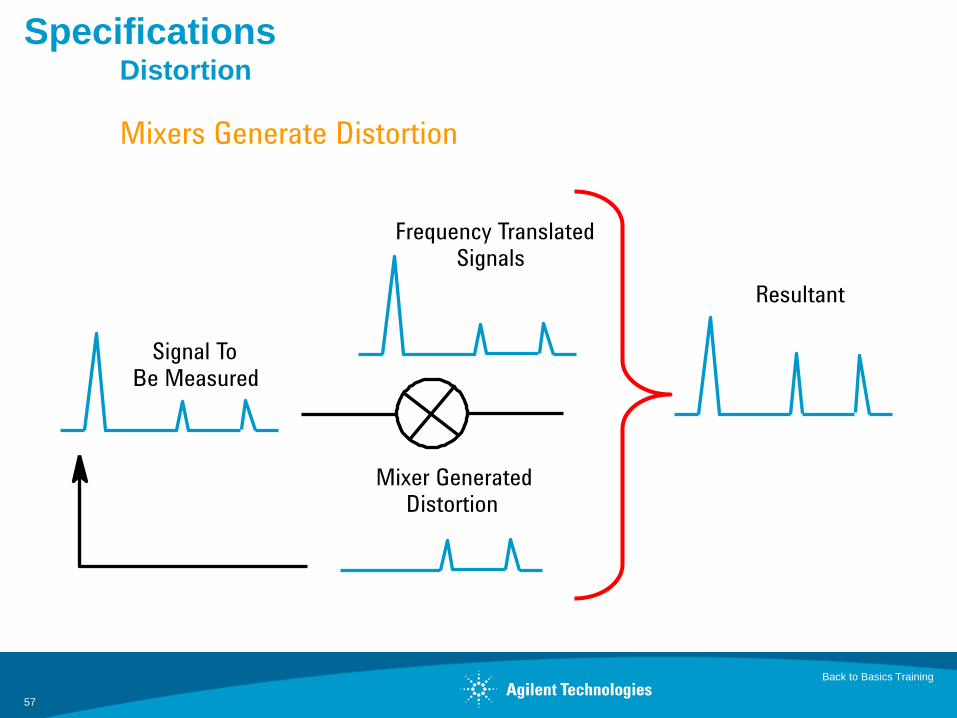
Specifications Distortion
Frequency Translated Signals
Signal To Be Measured
Resultant
Mixer Generated Distortion
Mixers Generate Distortion
Back to Basics Training
57
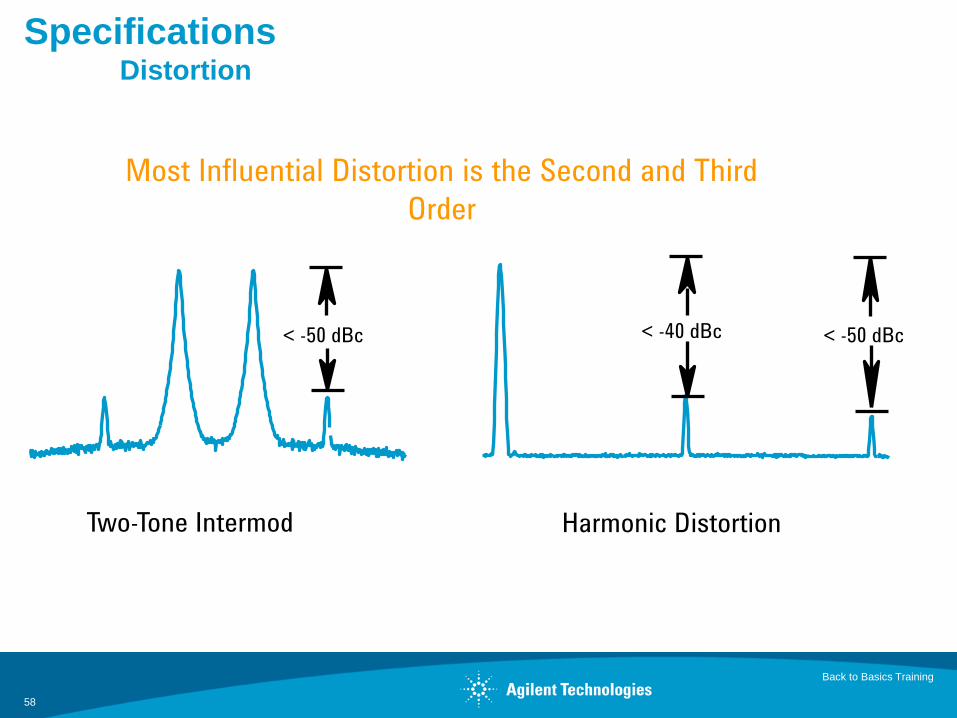
Specifications Distortion
Two-Tone Intermod Harmonic Distortion
Most Influential Distortion is the Second and Third
Order
< -50 dBc < -50 dBc < -40 dBc
Back to Basics Training
58

Specifications Distortion
Distortion Products Increase as a Function of
Fundamental's Power
3
f 2f 3f
Power
in dB
2
f f 2f - f 1 2 1 2
Power
in dB
3 3
2 1 2f - f
Two-Tone Intermod
Harmonic Distortion
Third-order distortion
Second-order distortion
Second Order: 2 dB/dB of Fundamental Third Order: 3 dB/dB of Fundamental
Back to Basics Training
59

Specifications Distortion
Distortion is a Function of
Mixer Level
POWER AT MIXER = INPUT - ATTENUATOR SETTING dBm
DIS
TO
RTIO
N, dB
c
0
-20
-40
-60
-80
-100
-60 -30 0 +30
TOI
Second
Order
Third
Order
SHI
Back to Basics Training
60

Attenuator Test:
Change power to the mixer
No change in amplitude: distortion
is part of input signal (external)
Change input attenuator
by 10 dB 1
Watch distortion amplitude on
screen 2
Change in amplitude:
at least some of the distortion is being
generated inside the analyzer (internal)
Specifications Distortion – Internal or External?
Back to Basics Training
Original distortion signal
Signal with 10dB input attenuation
61
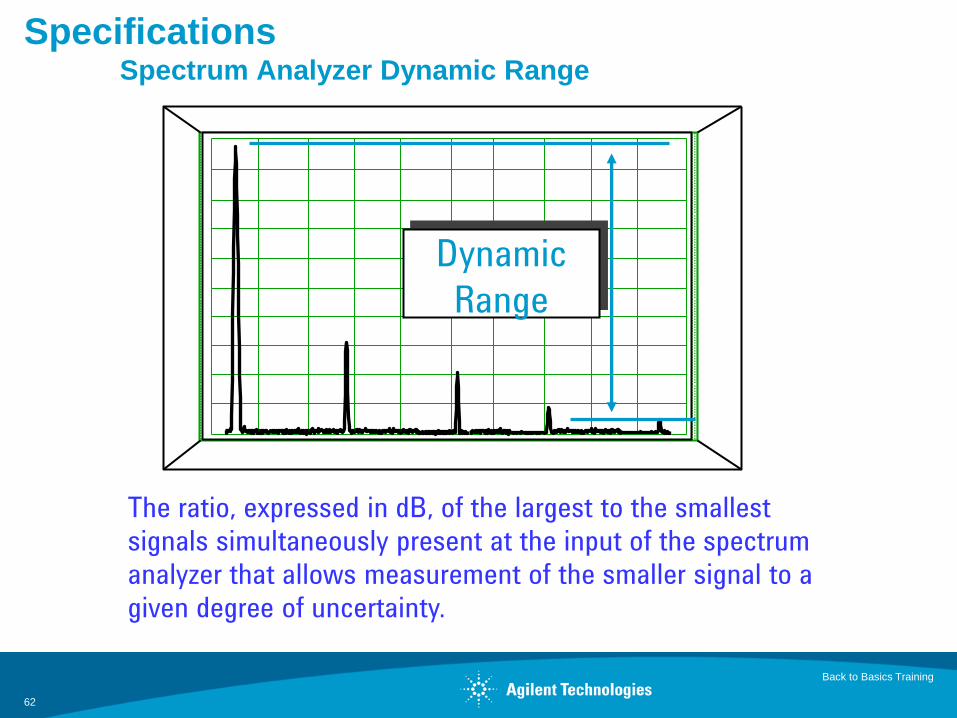
Specifications Spectrum Analyzer Dynamic Range
Dynamic
Range
The ratio, expressed in dB, of the largest to the smallest
signals simultaneously present at the input of the spectrum
analyzer that allows measurement of the smaller signal to a
given degree of uncertainty.
Back to Basics Training
62

Specifications Dynamic Range
Dynamic Range Can Be Presented Graphically
POWER AT MIXER = INPUT - ATTENUATOR SETTING dBm
SIG
NA
L-T
O-N
OIS
E R
ATIO
, dB
c -20
-40
-60
-80
-100
-60 -30 0 +30
. .
TOI
Optimum Mixer Levels
Maximum 2nd Order
Dynamic Range
Maximum 3rd Order
Dynamic Range
SOI
Back to Basics Training
63

Specifications Dynamic Range
Noise Sidebands
Dynamic Range Limited By Noise Sidebands
dBc/Hz
Displayed Average
Noise Level
Dynamic Range
Compression/Noise Limited By
100 kHz to
1 MHz
Dynamic Range for Spur Search Depends on Closeness to
Carrier
Back to Basics Training
64
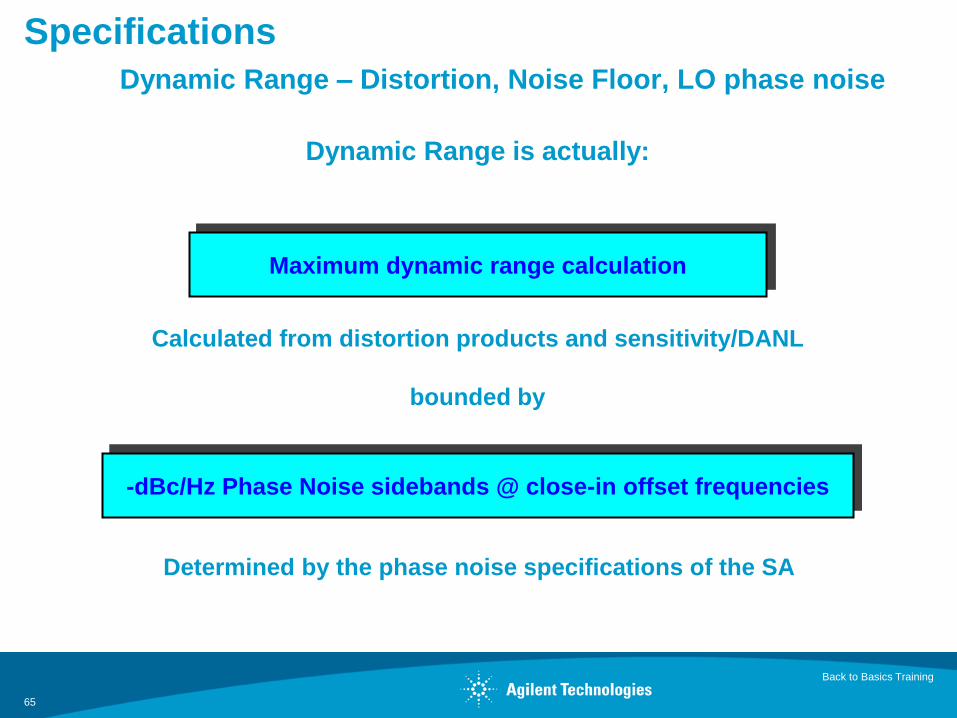
Dynamic Range is actually:
-dBc/Hz Phase Noise sidebands @ close-in offset frequencies
Maximum dynamic range calculation
Calculated from distortion products and sensitivity/DANL
Specifications
Dynamic Range – Distortion, Noise Floor, LO phase noise
bounded by
Determined by the phase noise specifications of the SA
Back to Basics Training
65

+30 dBm
-155 dBm (1 Hz BW & 0 dB ATTENUATION)
MAXIMUM POWER LEVEL
DISPLAY RANGE
100 dB @ 10 dB/Div
(200 dB @ 20dB/Div)
+3 dBm
-40 dBm
-50 dBm SECOND-ORDER DISTORTION
MIXER COMPRESSION
THIRD-ORDER DISTORTION
SIGNAL/NOISE
RANGE
158 dB
MEASUREMENT
RANGE
195 dB
MINIMUM NOISE FLOOR (DANL)
0 dBc NOISE SIDEBANDS SIGNAL /3rd ORDER
DISTORTION
115 dB range SIGNAL/ 2nd ORDER
DISTORTION
105 dB RANGE SIGNAL/NOISE SIDEBANDS
-129 dBc @ 10kHz OFFSET
-165 dBm with preamp
INCREASING
RBW OR
ATTENUATION
Specifications Dynamic Range vs. Measurement Range
(Dynamic Range)
(Dynamic Range)
(Dynamic Range)
Back to Basics Training
66
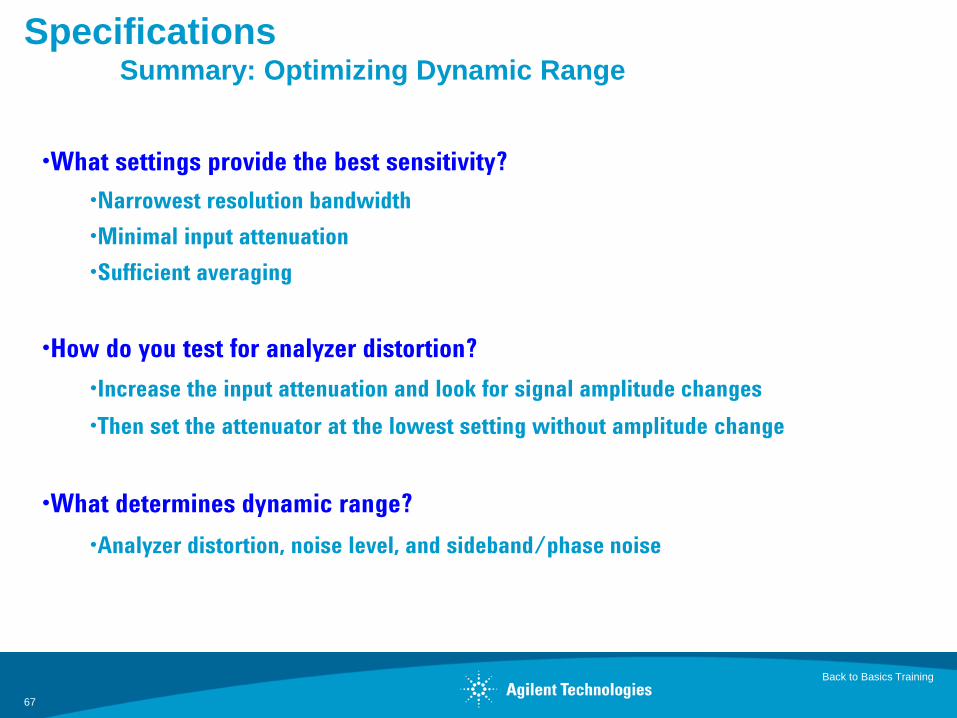
Specifications Summary: Optimizing Dynamic Range
•What settings provide the best sensitivity?
•Narrowest resolution bandwidth
•Minimal input attenuation
•Sufficient averaging
•How do you test for analyzer distortion?
•Increase the input attenuation and look for signal amplitude changes
•Then set the attenuator at the lowest setting without amplitude change
•What determines dynamic range?
•Analyzer distortion, noise level, and sideband/phase noise
Back to Basics Training
67

Agenda
Introduction
Overview
Theory of Operation
Specifications
Modern spectrum analyzer designs & capabilities
• Wide Analysis Bandwidth Measurements
Wrap-up
Appendix
Back to Basics Training
68
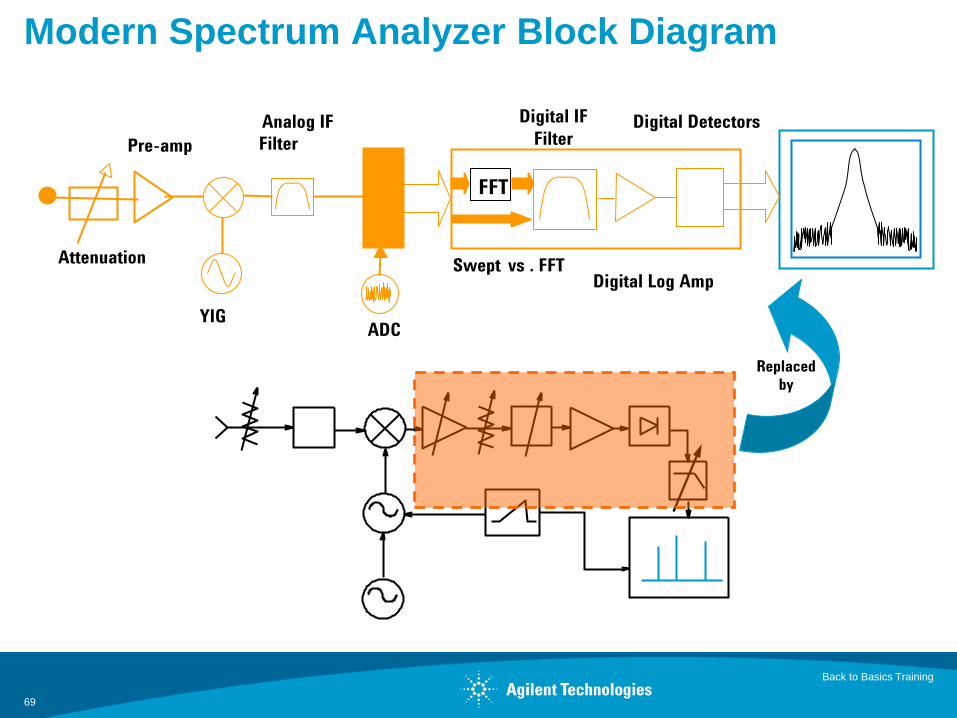
Modern Spectrum Analyzer Block Diagram
YIG
ADC
Analog IF
Filter
Digital IF
Filter
Digital Log Amp
Digital Detectors
FFT
Swept vs . FFT Attenuation
Pre-amp
Replaced
by
Back to Basics Training
69

Modern Spectrum Analyzer Block Diagram
Digitally Synthesized LO
• Fast tuning
• Close-in phase noise
• Far-out phase noise
16 bit ADC
• Wider dynamic range
with autoranging
• Dither on/off
Analog Pre-Filter
(Single Pole)
Digital IF Filters
• 160 RBW filters
• 1 Hz to 8 MHz
• ±0.03 dB
switching error
Digital Log Amp
• ±0.07 dB Scale Fidelity
• >100 dB Dynamic range
• ±0.0 dB reference level error
Digital Detectors
•Normal
•Peak
•Min
•Sample
FFT
FFT vs Swept RBW • Faster Sweep
w/Max DR
Attenuation
2 dB step
to 50 GHz
DANL -155dBm
3 to 50 GHz Pre-amp
Improve 1 GHz
to -165dBm
•RMS
•Avg
Frequency Counter
• Fast (0.1s)
• High resolution (mHz)
Digital Video Filters
• Power, voltage,
log filtering
• 4.1:1 Shape factor
• Fast sweep
• EMI RBW’s (Opt. EMC)
Auto Alignment
• Temp & time calibration
Back to Basics Training
•QPD (Opt. EMC)
70

Modern Spectrum Analyzer - Specifications Digital IF provides improved accuracy
PXA vs. Traditional
• Input impedance mismatch ±0.13 ±0.29 dB • Input attenuator switching uncertainty ±0.14 ±0.6 dB • Frequency response ±0.35 ±1.8 dB • Reference level accuracy ±0.0 ±1.0 dB • RBW switching uncertainty ±0.03 ±0.5 dB • Display scale fidelity ±0.07 ±0.85 dB • Calibrator accuracy ±0.24 ±0.34 dB
Total accuracy (up to 3 GHz) 0.59 dB vs. 1.8 dB
95% Confidence 0.19 dB
Back to Basics Training
71

Format Setups include:
Modern Spectrum Analyzer Features Built-in One-Button Power Measurements
Back to Basics Training
Power Measurements:
Occupied Bandwidth
Channel Power
ACP
Multi-carrier ACP
CCDF
Harmonic Distortion
Burst Power
TOI
Spurious Emissions
Spectral Emissions Mask
72

Modern Spectrum Analyzer Features Application Focused Internal Software (one-button measurements)
Phase noise
Ext. source control
Noise figure
Code compatibility suite
EMI pre-compliance
Analog demod
Flexible demod
LTE FDD, TDD
W-CDMA/HSPA/HSPA+
GSM/EDGE/EDGE Evo
cdma2000 & 1xEV-DO
cdmaOne
DVB-T/H/C/T2
TD-SCDMA/HSPA
WLAN (802.11a/b/g/p/j)
802.16 OFDMA
Bluetooth
General purpose
applications
Power & digital
modulation
measurements for
wireless comms
formats
Flexible digital
modulation analysis
ACPR, Multi-carrier Power
Code Domain Power
EVM
Phase and Freq. (PFER)
Mod Accuracy (Rho)
CCDF
ORFS (GSM/EDGE)
Occupied Bandwidth (OBW)
IM distortion
SEM
Spectral Emissions Mask
Power vs Time
Channel power
Spurious Emissions
ACPR
73

F E AT U R E S / O P T I O N E D P – E N H A N C E D
D I S P L AY PA C K A G E
• Spectrogram
• Trace zoom
• Zone span
Enhances Swept SA measurements and complements N6141A for EMI users
Page 74
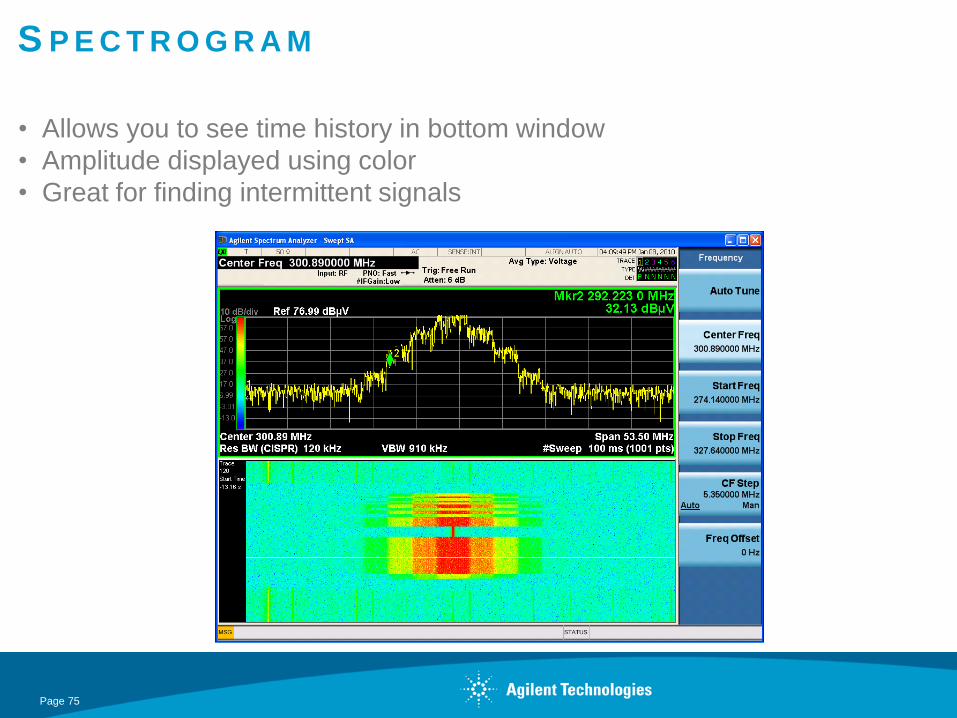
S P E C T R O G R A M
• Allows you to see time history in bottom window
• Amplitude displayed using color
• Great for finding intermittent signals
Page 75

T R A C E Z O O M
• Allows you to zoom in on your trace data
• Same trace in both screens but bottom screen shows “close up” view
with fewer points
• Great to look more closely at high-density traces
Page 76
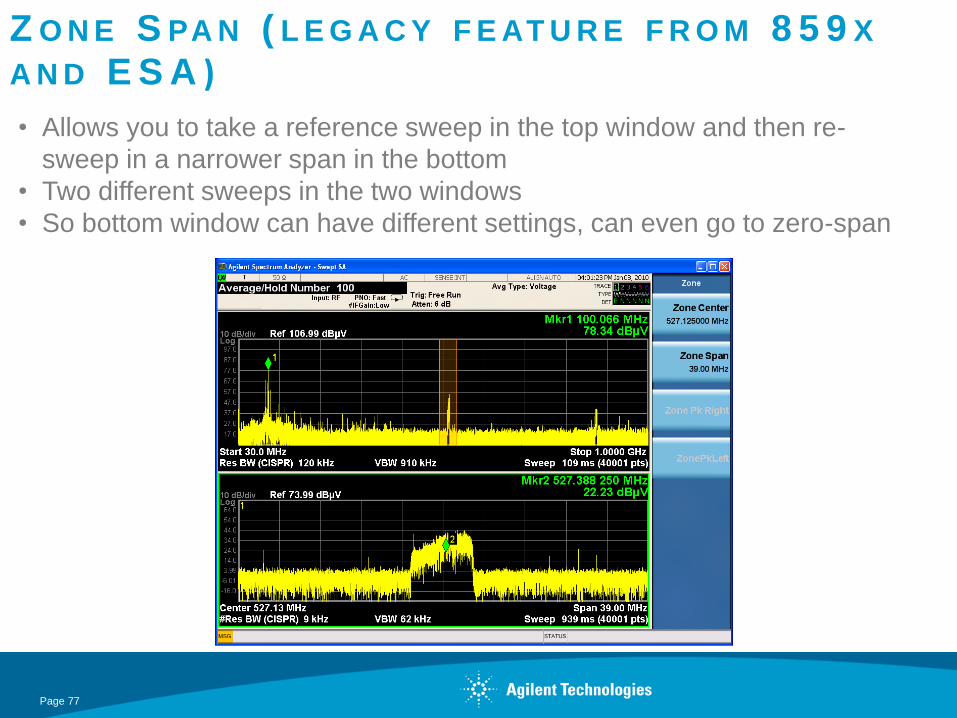
Z O N E S PA N ( L E G A C Y F E AT U R E F R O M 8 5 9 X A N D E S A )
• Allows you to take a reference sweep in the top window and then re-
sweep in a narrower span in the bottom
• Two different sweeps in the two windows
• So bottom window can have different settings, can even go to zero-span
Page 77
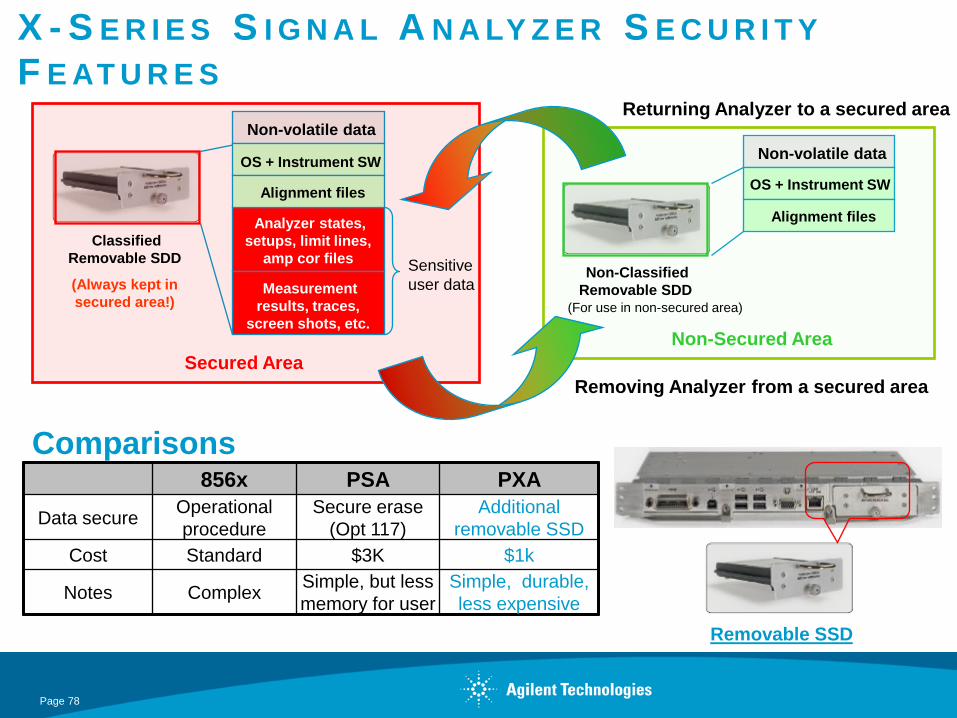
856x PSA PXA
Data secure Operational
procedure
Secure erase
(Opt 117)
Additional
removable SSD
Cost Standard $3K $1k
Notes Complex Simple, but less
memory for user
Simple, durable,
less expensive
Comparisons
Non-volatile data
OS + Instrument SW
Alignment files
Analyzer states,
setups, limit lines,
amp cor files
Measurement
results, traces,
screen shots, etc.
Sensitive
user data
Secured Area
Classified
Removable SDD
(Always kept in
secured area!)
Non-volatile data
OS + Instrument SW
Alignment files
Non-Secured Area
Non-Classified
Removable SDD
Removing Analyzer from a secured area
Returning Analyzer to a secured area
(For use in non-secured area)
Removable SSD
X - S E R I E S S I G N A L A N A LY Z E R S E C U R I T Y
F E AT U R E S
Page 78

Supports > 70 signal formats
• GSM to WiFi, WiMAX & LTE
• 2FSK to 1024QAM
• AM/FM/PM
• SISO and MIMO (4x4)
• Custom OFDM
High resolution (409K line) FFT based
spectrum
High quality time measurements
SCPI Programming
Premier frequency, time & modulation
analysis for Wireless R&D
8 9 6 0 0 B V E C T O R S I G N A L A N A LY S I S
S O F T WA R E
Page 79
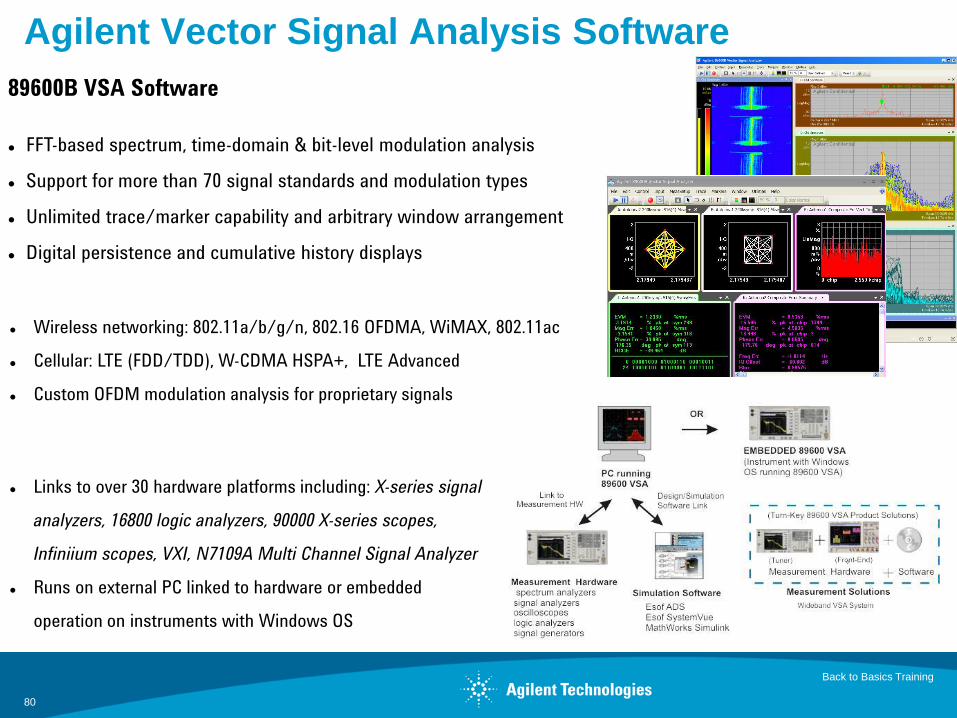
Agilent Vector Signal Analysis Software
Back to Basics Training
89600B VSA Software
FFT-based spectrum, time-domain & bit-level modulation analysis
Support for more than 70 signal standards and modulation types
Unlimited trace/marker capability and arbitrary window arrangement
Digital persistence and cumulative history displays
Wireless networking: 802.11a/b/g/n, 802.16 OFDMA, WiMAX, 802.11ac
Cellular: LTE (FDD/TDD), W-CDMA HSPA+, LTE Advanced
Custom OFDM modulation analysis for proprietary signals
Links to over 30 hardware platforms including: X-series signal
analyzers, 16800 logic analyzers, 90000 X-series scopes,
Infiniium scopes, VXI, N7109A Multi Channel Signal Analyzer
Runs on external PC linked to hardware or embedded
operation on instruments with Windows OS
80
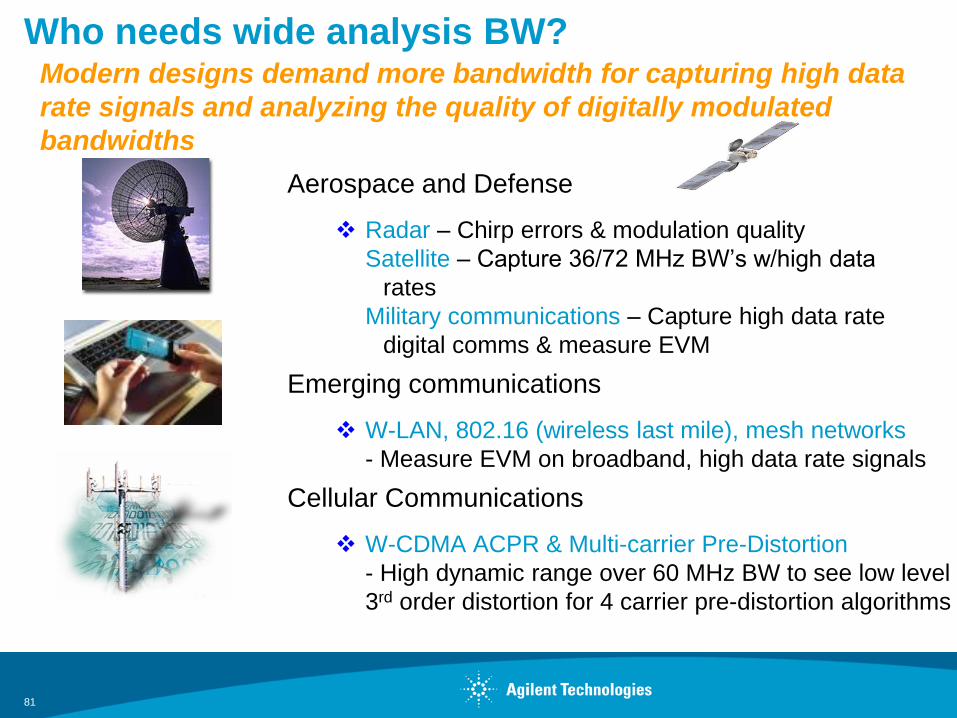
Modern designs demand more bandwidth for capturing high data
rate signals and analyzing the quality of digitally modulated
bandwidths
Aerospace and Defense
Radar – Chirp errors & modulation quality
Satellite – Capture 36/72 MHz BW’s w/high data
rates
Military communications – Capture high data rate
digital comms & measure EVM
Emerging communications
W-LAN, 802.16 (wireless last mile), mesh networks
- Measure EVM on broadband, high data rate signals
Cellular Communications
W-CDMA ACPR & Multi-carrier Pre-Distortion
- High dynamic range over 60 MHz BW to see low level
3rd order distortion for 4 carrier pre-distortion algorithms
Who needs wide analysis BW?
81

PXA Simplified Block Diagram (160 MHz BW)
0-3.6 GHz low band
3 Hz-50 GHz
Input
Cal input
8.3-14 GHz LO
10.9M
.3M
4.8 GHz LO
RF converter
2nd converter
FPGA
300 MHz LO
200 MHz CK
100 MHz CK
ADC
ADC
Switched filters,
F0=22.5 MHz
140 MHz
3.5-50 GHz high band
FPGA
160 MHz
Front End
Swept IF,
10 MHz & 25 MHz BW (option B25)
25 MHz
966K
303K
79K
9K
Switched filters,
F0=322.5 MHz
160 MHz BW (option B1X)
2 2 6 10 20 30
RF preamp
40 MHz
400 MHz CK
40 MHz BW (option B40)
ADC
F0=250 MHz
F0=322.5 MHz
Linearity
Corrections
1 dB-step electronic atten
4 GHz
ASIC
2Gbyte
SDRAM
ASIC
2Gbyte
SDRAM
DA
C
Aux IF Out
.SAW
ACP
Electronic Preamp, e-attenuator and calibrator switches
160 MHz Path
ADC Nominal bits: 14
ADC Effective bits: 11.2
SFDR: up to 75 dBc
PXA Wideband analysis
Back to Basics Training
82
F0=300 MHz

Measurement of Analog IQ Signals
Oscilloscope for baseband has some limitations
RF Analog Baseband
X-Series Spectrum Analyzer PXA/MXA BBIQ
89600B VSA
Software in both
domains
Back to Basics Training
83

16-bit ADC, 100 MS/s Analog BB inputs
Switched
Gain
amplifier
1 M Ω /
50 Ω
Z Select
Real-time IQ
corrections
Re-sampling/
Decimation
500 MSa
Capture Memory
Single
ended/
Differential
Select
Probe
Interface
Cal Baseband
Calibrator Out
Baseband to 40
MHz (for 1ch/2ch)
10, 25 or 40 MHz
BW
500 MSa memory
PXA/MXA Baseband and RF
Back to Basics Training
84
PXA 900MHz Wideband IF Output
• This capability is useful for customers looking to make wideband radar
and communication measurements of bandwidths less than 900 MHz.
• The IF bandwidth tends to be much greater than currently-available
downconverters.
• This utilizes options “MPB” (microwave preselector bypass) and “CR3”
(connector rear, 2nd IF output).
• See PXA configuration guide for information on retrofitting option MPB
• Wideband IF output is achieved by bypassing the microwave preselector
and moving the first microwave IF higher depending on the desired
bandwidth.
November 8, 2012 Confidentiality Label
85

Configuring the PXA for 900 MHz of IF output
November 8, 2012 Confidentiality Label
86
Creating the proper frequency offset
foffset = fnormal IF – fdesired IF
• In our case, fnormal IF is always 322.5 MHz
• Agilent recommends an desired IF of no greater than 700 MHz for a
maximum IF bandwidth of 1 GHz.
• If the required IF bandwidth is 500 MHz or less, we recommend using the
standard 322.5 MHz IF with no frequency offset.
• In our example, we’re using an offset of -377.5 MHz, (322.5 – 700 MHz),
for an IF center frequency of 700 MHz and an IF bandwidth of 900 MHz.
87

Configuring the PXA for 900 MHz of IF output
1
.
3
.
2
.
6
.
4
.
5
.
88

Agenda
Introduction
Overview
Theory of Operation
Specifications
Modern spectrum analyzer designs & capabilities
• Wide Analysis Bandwidth Measurements
Wrap-up
Appendix
Back to Basics Training
89

Agilent Technologies’ Signal Analysis Portfolio
ESA World’s most popular
100 Hz to 26 GHz
8560EC Mid-
performance
EXA X-Series
Economy-class
10 Hz to 26, 32, 44 GHz
Sep 07
PSA Market leading
performance
3 Hz to 50 GHz CXA Low-cost
9 kHz to 26.5 GHz
Oct 09
CSA Low cost portable
100 Hz to 7 GHz
MXA X-Series
Mid-performance
10 Hz to 26.5 GHz
Sep 06
X-Series Code Compatibility
Backward CC with legacy
Inherent X-Series CC
Oct 09
PXA X-Series
High-performance
3 Hz to 26.5 GHz
3 Hz to 43/44/50 GHz
Page 90
N9320B Basic performance 9 kHz to 3 GHz
N9922C BSA 9 kHz to 7 GHz
N9340B, N9342/43/44C 100 kHz to 3/7/13.6/20 GHz Handhelds
N9935/36/37/38A 5 kHz to 9/14/18/26.5 GHz Handhelds
Agilent Spectrum Analyzer Families (X-Series)
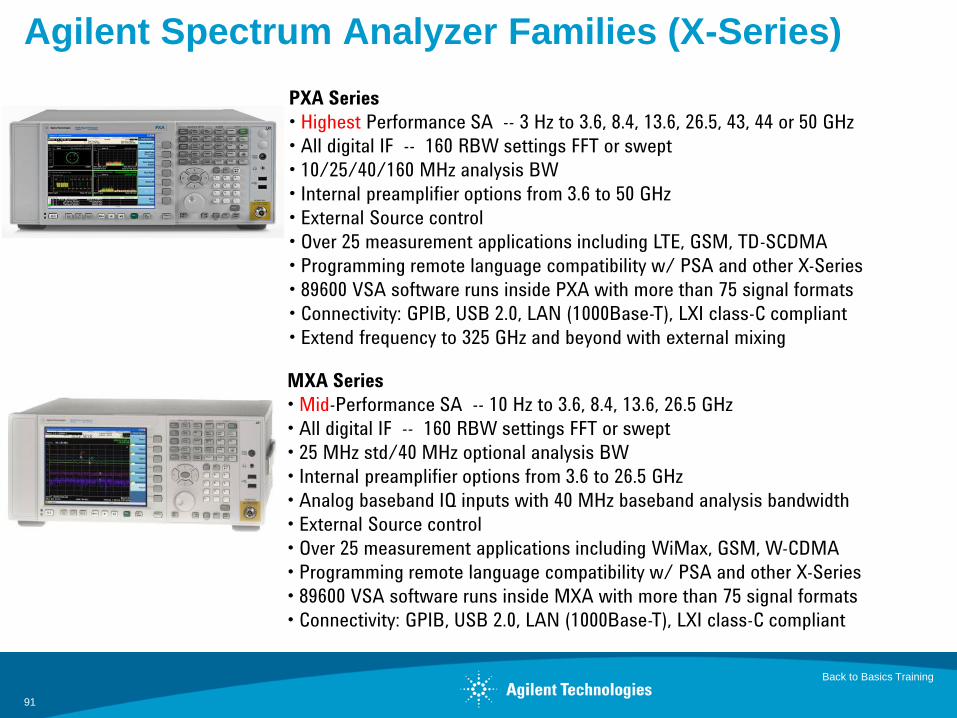
MXA Series
• Mid-Performance SA -- 10 Hz to 3.6, 8.4, 13.6, 26.5 GHz
• All digital IF -- 160 RBW settings FFT or swept
• 25 MHz std/40 MHz optional analysis BW
• Internal preamplifier options from 3.6 to 26.5 GHz
• Analog baseband IQ inputs with 40 MHz baseband analysis bandwidth
• External Source control
• Over 25 measurement applications including WiMax, GSM, W-CDMA
• Programming remote language compatibility w/ PSA and other X-Series
• 89600 VSA software runs inside MXA with more than 75 signal formats
• Connectivity: GPIB, USB 2.0, LAN (1000Base-T), LXI class-C compliant
Back to Basics Training
PXA Series
• Highest Performance SA -- 3 Hz to 3.6, 8.4, 13.6, 26.5, 43, 44 or 50 GHz
• All digital IF -- 160 RBW settings FFT or swept
• 10/25/40/160 MHz analysis BW
• Internal preamplifier options from 3.6 to 50 GHz
• External Source control
• Over 25 measurement applications including LTE, GSM, TD-SCDMA
• Programming remote language compatibility w/ PSA and other X-Series
• 89600 VSA software runs inside PXA with more than 75 signal formats
• Connectivity: GPIB, USB 2.0, LAN (1000Base-T), LXI class-C compliant
• Extend frequency to 325 GHz and beyond with external mixing
91
Agilent Spectrum Analyzer Families (X-Series)
Back to Basics Training
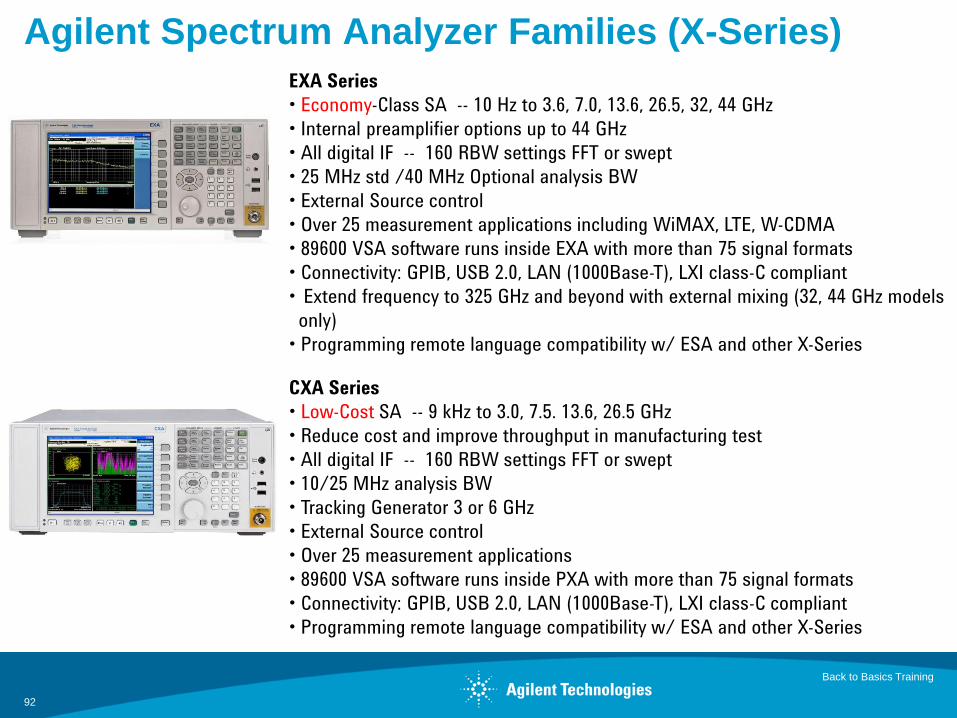
CXA Series
• Low-Cost SA -- 9 kHz to 3.0, 7.5. 13.6, 26.5 GHz
• Reduce cost and improve throughput in manufacturing test
• All digital IF -- 160 RBW settings FFT or swept
• 10/25 MHz analysis BW
• Tracking Generator 3 or 6 GHz
• External Source control
• Over 25 measurement applications
• 89600 VSA software runs inside PXA with more than 75 signal formats
• Connectivity: GPIB, USB 2.0, LAN (1000Base-T), LXI class-C compliant
• Programming remote language compatibility w/ ESA and other X-Series
92
EXA Series
• Economy-Class SA -- 10 Hz to 3.6, 7.0, 13.6, 26.5, 32, 44 GHz
• Internal preamplifier options up to 44 GHz
• All digital IF -- 160 RBW settings FFT or swept
• 25 MHz std /40 MHz Optional analysis BW
• External Source control
• Over 25 measurement applications including WiMAX, LTE, W-CDMA
• 89600 VSA software runs inside EXA with more than 75 signal formats
• Connectivity: GPIB, USB 2.0, LAN (1000Base-T), LXI class-C compliant
• Extend frequency to 325 GHz and beyond with external mixing (32, 44 GHz models
only)
• Programming remote language compatibility w/ ESA and other X-Series

Agilent Spectrum Analyzer Families (Basic)
Back to Basics Training
N9322C Basic Performance Bench Top
• 9 kHz - 7 GHz frequency range
• Sensitivity: Typical –160dBm DANL (preamp on)
• ±0.4 dB absolute amplitude accuracy
• 7 GHz tracking generator, with built in VSWR bridge
• AM/FM, ASK/FSK demodulation; Task planner for automation
• 7.6 kg weight, 132x320x400 (mm) dimension, 3U height
93
N9320B Basic Performance Bench Top
• 9 kHz to 3 GHz
•Minimum non-zero span sweep time: < 10 ms
•Resolving power RBW: 10 Hz to 1 MHz
•Sensitivity DANL: -130 dBm, -148 dBm with preamp on
•Overall amplitude accuracy: ±0.5 dB
Page 94
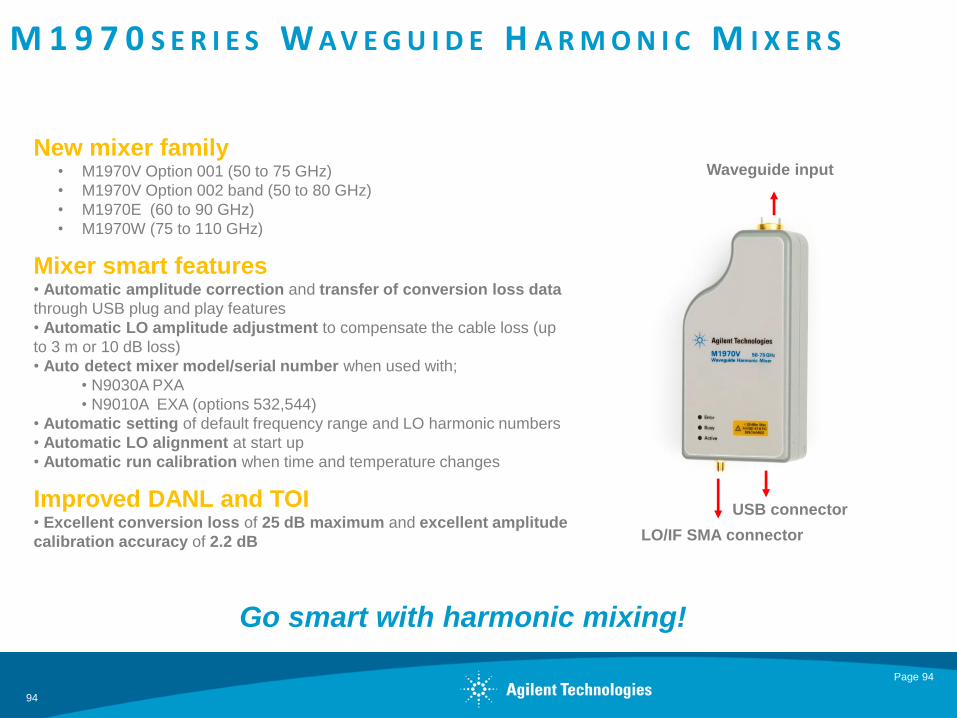
New mixer family • M1970V Option 001 (50 to 75 GHz)
• M1970V Option 002 band (50 to 80 GHz)
• M1970E (60 to 90 GHz)
• M1970W (75 to 110 GHz)
Mixer smart features • Automatic amplitude correction and transfer of conversion loss data
through USB plug and play features
• Automatic LO amplitude adjustment to compensate the cable loss (up
to 3 m or 10 dB loss)
• Auto detect mixer model/serial number when used with;
• N9030A PXA
• N9010A EXA (options 532,544)
• Automatic setting of default frequency range and LO harmonic numbers
• Automatic LO alignment at start up
• Automatic run calibration when time and temperature changes
Improved DANL and TOI • Excellent conversion loss of 25 dB maximum and excellent amplitude
calibration accuracy of 2.2 dB
M 1 9 7 0 S E R I E S W A V E G U I D E H A R M O N I C M I X E R S
Go smart with harmonic mixing!
LO/IF SMA connector
Waveguide input
USB connector
94
Agilent Spectrum Analyzer Families (Handhelds)
Back to Basics Training
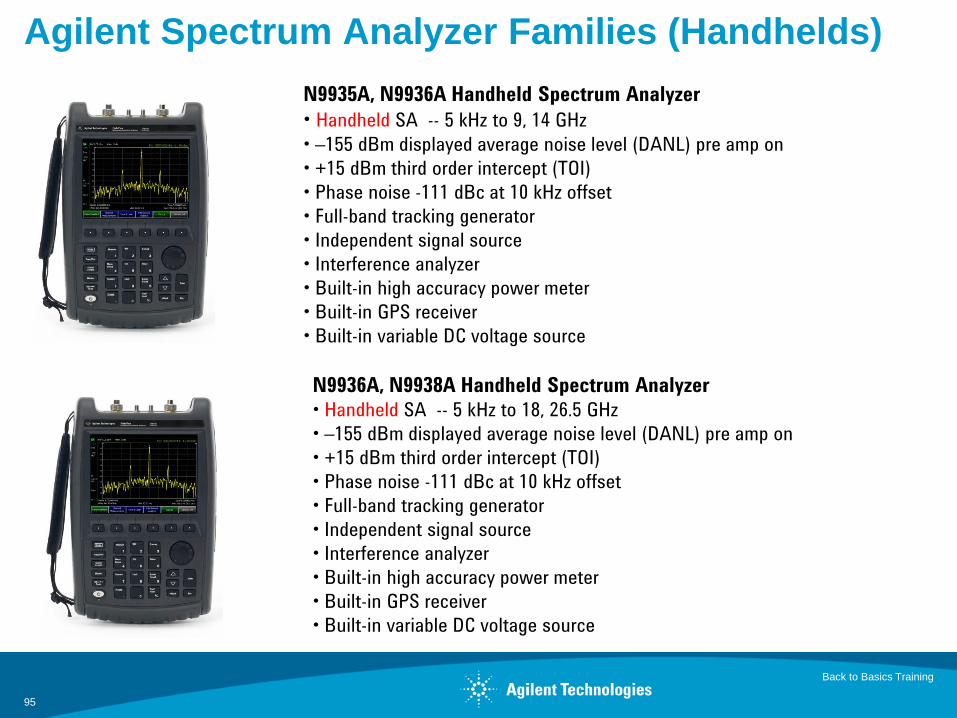
N9935A, N9936A Handheld Spectrum Analyzer
• Handheld SA -- 5 kHz to 9, 14 GHz
• –155 dBm displayed average noise level (DANL) pre amp on
• +15 dBm third order intercept (TOI)
• Phase noise -111 dBc at 10 kHz offset
• Full-band tracking generator
• Independent signal source
• Interference analyzer
• Built-in high accuracy power meter
• Built-in GPS receiver
• Built-in variable DC voltage source
95
N9936A, N9938A Handheld Spectrum Analyzer
• Handheld SA -- 5 kHz to 18, 26.5 GHz
• –155 dBm displayed average noise level (DANL) pre amp on
• +15 dBm third order intercept (TOI)
• Phase noise -111 dBc at 10 kHz offset
• Full-band tracking generator
• Independent signal source
• Interference analyzer
• Built-in high accuracy power meter
• Built-in GPS receiver
• Built-in variable DC voltage source

Agilent Spectrum Analyzer Families (Handhelds)
Back to Basics Training
N9343C Handheld Spectrum Analyzer
• Handheld SA -- 100 kHz to 13.6 GHz
• 10 ms non-zero span sweep time
• –144 dBm displayed average noise level (DANL) with pre-amplifier
• +15 dBm third order intercept (TOI)
• Built-in GPS receiver and GPS antenna
• Built-in tracking generator
• Light weight, rugged and portable
• four hours battery life
N9344C Handheld Spectrum Analyzer
• Handheld SA -- 100 kHz to 20 GHz
• Fastest sweep – minimum sweep time < 2ms
• –144 dBm displayed average noise level (DANL) typical
• +15 dBm third order intercept (TOI)
• Built-in GPS receiver and GPS antenna
• Built-in tracking generator
• Light weight, rugged and portable
• four hours battery life
96

Agilent Spectrum Analyzer Families (Handhelds)
Back to Basics Training
N9340B Handheld Spectrum Analyzer
• Handheld SA -- 100 kHz to 3.0 GHz
• 10 ms non-zero span sweep time
• –144 dBm displayed average noise level (DANL) with pre-amplifier
• +10 dBm third order intercept (TOI)
• Built-in GPS receiver and GPS antenna
• Built-in tracking generator
• Light weight, rugged and portable
• four hours battery life
N9342C Handheld Spectrum Analyzer
• Handheld SA -- 100 kHz to 7.0 GHz
• Fastest sweep – minimum sweep time < 2ms
• –152 dBm displayed average noise level (DANL) typical
• +10 dBm third order intercept (TOI)
• Built-in GPS receiver and GPS antenna
• Built-in tracking generator
• Light weight, rugged and portable
• four hours battery life
97
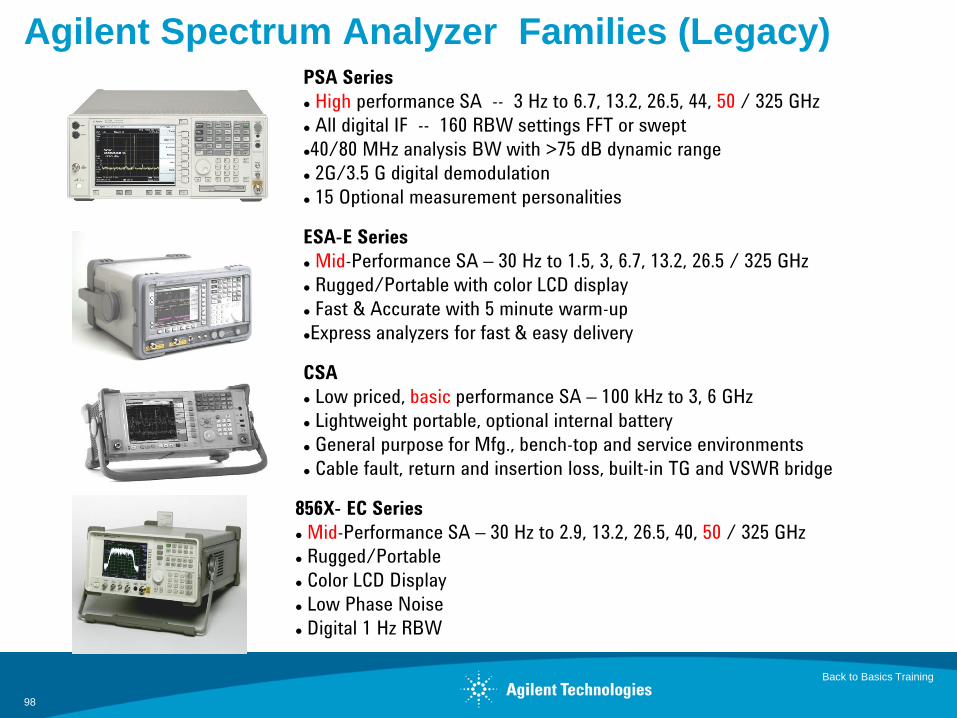
Agilent Spectrum Analyzer Families (Legacy)
Back to Basics Training
ESA-E Series
Mid-Performance SA – 30 Hz to 1.5, 3, 6.7, 13.2, 26.5 / 325 GHz
Rugged/Portable with color LCD display
Fast & Accurate with 5 minute warm-up
Express analyzers for fast & easy delivery
PSA Series
High performance SA -- 3 Hz to 6.7, 13.2, 26.5, 44, 50 / 325 GHz
All digital IF -- 160 RBW settings FFT or swept
40/80 MHz analysis BW with >75 dB dynamic range
2G/3.5 G digital demodulation
15 Optional measurement personalities
CSA
Low priced, basic performance SA – 100 kHz to 3, 6 GHz
Lightweight portable, optional internal battery
General purpose for Mfg., bench-top and service environments
Cable fault, return and insertion loss, built-in TG and VSWR bridge
856X- EC Series
Mid-Performance SA – 30 Hz to 2.9, 13.2, 26.5, 40, 50 / 325 GHz
Rugged/Portable
Color LCD Display
Low Phase Noise
Digital 1 Hz RBW
98

Agenda
Introduction
Overview
Theory of Operation
Specifications
Modern spectrum analyzer designs & capabilities
• Wide Analysis Bandwidth Measurements
Wrap-up
Appendix
Back to Basics Training
99

Basic Spectrum Analyzer Application & Product
Notes A.N. 150 – Spectrum Analysis Basics: #5952-0292EN
A.N. 150-15 - Vector Signal Analysis Basics: #5989-1121EN
Spectrum Analyzer & Signal Analyzer Selection Guide: #5968-3413E
N9030A PXA Brochure: 5990-3951EN
N9020A MXA Brochure: 5989-5047EN
N9010A EXA Brochure: 5989-6527EN
N9000A CXA Brochure: 5990-3927EN
89600B VSA Brochure: 5990-6553EN
N9342,43,44C Brochure: 5990-8024EN
N9935,36,37,38A Brochure: 5990-9779EN
www.agilent.com/find/sa
Back to Basics Training
100

THANK YOU!
Back to Basics Training
101