Leaf Epidermal and Pollen Morphological Studies of Genus Jatropha L Euphorbiaceae in Nigeria

Ecological Applications, 24(7), 2014, pp. 1651–1669! 2014 by the Ecological Society of America
Spectroscopic determination of leaf morphologicaland biochemical traits for northern temperate and boreal tree speciesSHAWN P. SERBIN,1,3 ADITYA SINGH,1 BRENDEN E. MCNEIL,2 CLAYTON C. KINGDON,1 AND PHILIP A. TOWNSEND
1
1Department of Forest and Wildlife Ecology, University of Wisconsin, Madison, Wisconsin 53706 USA2Department of Geology and Geography, West Virginia University, Morgantown, West Virginia 26506 USA
Abstract. The morphological and biochemical properties of plant canopies are strongpredictors of photosynthetic capacity and nutrient cycling. Remote sensing research at the leafand canopy scales has demonstrated the ability to characterize the biochemical status ofvegetation canopies using reflectance spectroscopy, including at the leaf level and canopy levelfrom air- and spaceborne imaging spectrometers. We developed a set of accurate and precisespectroscopic calibrations for the determination of leaf chemistry (contents of nitrogen,carbon, and fiber constituents), morphology (leaf mass per area, Marea), and isotopiccomposition (d15N) of temperate and boreal tree species using spectra of dried and ground leafmaterial. The data set consisted of leaves from both broadleaf and needle-leaf conifer speciesand displayed a wide range in values, determined with standard analytical approaches: 0.7–4.4% for nitrogen (Nmass), 42–54% for carbon (Cmass), 17–58% for fiber (acid-digestible fiber,ADF), 7–44% for lignin (acid-digestible lignin, ADL), 3–31% for cellulose, 17–265 g/m2 forMarea, and !9.4% to 0.8% for d15N. The calibrations were developed using a partial least-squares regression (PLSR) modeling approach combined with a novel uncertainty analysis.Our PLSR models yielded model calibration (independent validation shown in parentheses)R2 and the root mean square error (RMSE) values, respectively, of 0.98 (0.97) and 0.10%(0.13%) for Nmass, R
2¼ 0.77 (0.73) and RMSE¼ 0.88% (0.95%) for Cmass, R2¼0.89 (0.84) and
RMSE¼2.8% (3.4%) for ADF, R2¼0.77 (0.69) and RMSE¼2.4% (3.9%) for ADL, R2¼0.77(0.72) and RMSE¼1.4% (1.9%) for leaf cellulose, R2¼0.62 (0.60) and RMSE¼0.91% (1.5%)for d15N, and R2 ¼ 0.88 (0.87) with RMSE ¼ 17.2 g/m2 (22.8 g/m2) for Marea. This studydemonstrates the potential for rapid and accurate estimation of key foliar traits of forestcanopies that are important for ecological research and modeling activities, with a singlecalibration equation valid over a wide range of northern temperate and boreal species and leafphysiognomies. The results provide the basis to characterize important variability between andwithin species, and across ecological gradients using a rapid, cost-effective, easily replicatedmethod.
Key words: foliar chemistry; forests; partial least-squares regression, PLSR; plant functional traits;reflectance spectroscopy; remote sensing.
INTRODUCTION
The nutritional and morphological properties ofleaves within plant canopies are strong predictors ofphotosynthetic capacity and biogeochemical cycling inecosystems (Aber and Melillo 1982, Green et al. 2003,Wright et al. 2004, Shipley et al. 2005, Santiago 2007,Cornwell et al. 2008). Variations in foliar morphology,quantified as the leaf dry mass per leaf area (Marea; g/m2) or the reciprocal (specific leaf area, SLA), corre-spond to the fundamental tradeoff in leaf constructioncosts vs. light-intercepting surface area and are driven bya range of environmental controls (Niinemets 2007,Poorter et al. 2009). Foliar nitrogen, on a mass (Nmass;
%) or area (Narea; g/m2) basis, is strongly related to the
photosynthetic capacity of leaves, because it is afundamental component of light-harvesting pigmentsand photosynthetic machinery, including the enzymeRuBisCo (Field and Mooney 1986, Evans 1989). Inparticular, nitrogen represents a primary limitingnutrient in temperate and boreal tree species (LeBauerand Treseder 2008).
Other chemical compounds such as lignin andcellulose are invested in leaf structural componentsand, along with leaf carbon concentration (Cmass; %),determine the recalcitrant characteristics of canopyfoliage (Aber and Melillo 1982, Santiago 2007, Fortunelet al. 2009), thereby influencing the nutrient cyclingpotential of ecosystems. There has also been anincreasing interest in the use of stable isotopes as asource of important information on the relationshipsbetween plants and their environment (e.g., Hobbie andHobbie 2006, Compton et al. 2007, Bowling et al. 2008,
Manuscript received 12 November 2013; revised 21 February2014; accepted 7 March 2014; final version received 1 April2014. Corresponding Editor: W. J. D. van Leeuwen.
3 Present address: Biological, Environmental and ClimateSciences Department, Brookhaven National Laboratory,Upton, New York 11973 USA. E-mail: [email protected]
//TITAN/Production/e/ecap/live_jobs/ecap-24-07/ecap-24-07-08/layouts/ecap-24-07-08.3d ! Monday, 22 September 2014 ! 1:42 pm ! Allen Press, Inc. ! Page 1651 MS 13-2110
1651

Helliker and Richter 2008, Craine et al. 2009). In thecase of nitrogen, d15N provides an integrated assessmentof the nitrogen cycling properties of a stand (Robinson2001, Compton et al. 2007) and especially the associatedmicrobial communities that preferentially assimilatedifferent isotopes at different rates (Hobbie and Hobbie2006, Craine et al. 2009). Thus, the ability to character-ize variation in key leaf functional traits among speciesand across ecosystems is central to improving ourunderstanding of nutrient cycling and carbon assimila-tion by plants.In the last few decades, remote sensing has played an
increasingly important role in the study of plantchemistry (e.g., Curran 1989, Asner and Martin 2009,Kokaly et al. 2009, Ustin et al. 2009). Reflectancespectroscopy of fresh leaves or dried and ground leafmaterial has shown the potential to link leaf opticalproperties with a range of foliar traits, includingpigments, water content, nitrogen, dry matter, cellulose,and lignin (e.g., Card et al. 1988, McLellan et al.1991a, b, Bolster et al. 1996, Richardson and Reeves2005, Petisco et al. 2006). These studies led to thedevelopment of a number of leaf-level radiative transfermodels, including PROSPECT (Jacquemoud and Baret1990, Feret et al. 2008), Liberty (Dawson et al. 1998),and LEAFMOD (Ganapol et al. 1998), which provide amechanistic understanding of the coordination betweenleaf properties and spectral reflectance. At the canopyscale, early research into the use of imaging spectrom-eters (Peterson et al. 1988, Wessman et al. 1988b,Matson et al. 1994) illustrated the potential forquantifying select canopy chemical properties, includingnitrogen and lignin, but with some sensor and statisticallimitations (Grossman et al. 1996). Later studiesdetermined that a range of foliar traits could be remotelysensed through the use of improved imaging spectrom-eters (Curran et al. 1997, Martin and Aber 1997, Smithet al. 2003, Townsend et al. 2003), providing a means tostudy ecosystem functioning in a spatial context(Ollinger et al. 2002, Smith et al. 2002, Ollinger andSmith 2005, McNeil et al. 2008, Deel et al. 2012, Dahlinet al. 2013). Recently, it has been demonstrated thatspectroscopy can simultaneously provide estimates of arange of foliar nutrients and morphology at the leaf andcanopy scales within diverse tropical ecosystems (e.g.,Asner and Martin 2008, Asner et al. 2011a, Doughty etal. 2011).Refinement of generalized algorithms measuring
foliar traits from reflectance spectroscopy of dried andground leaf material can not only aid further develop-ment of generalized algorithms capable of using imagingspectrometer data to make canopy-level trait measure-ments, but it can also catalyze spatially extensiveecological research by providing a rapid and inexpensivemeans for measuring trait variation across multiplecanopy heights, diverse species, and distinct geographicsettings. In this study, we examine the ability to makegeneralized estimates of a suite of key leaf biochemical,
nutritional, and morphological properties, namely leafCmass, Nmass, the relative abundance of stable nitrogenisotopes (d15N),Marea (LMA), lignin, cellulose, and fiber(lignin and cellulose), using leaf-level reflectance spec-troscopy of dried and ground (i.e., homogenized) leafmaterial. Our primary goal is to demonstrate ageneralized approach for estimating each leaf property,along with its variation, among species and functionalgroups, as it relates to within-canopy radiation levels.Specifically, we (1) evaluate the capacity to accuratelyestimate seven leaf traits using reflectance spectroscopyat the leaf level; (2) identify regions of the spectrumimportant to retrieval of these traits; and (3) test theextent to which we can generalize the predictions of leaftraits across species and geographic locations.
MATERIALS AND METHODS
Study sites
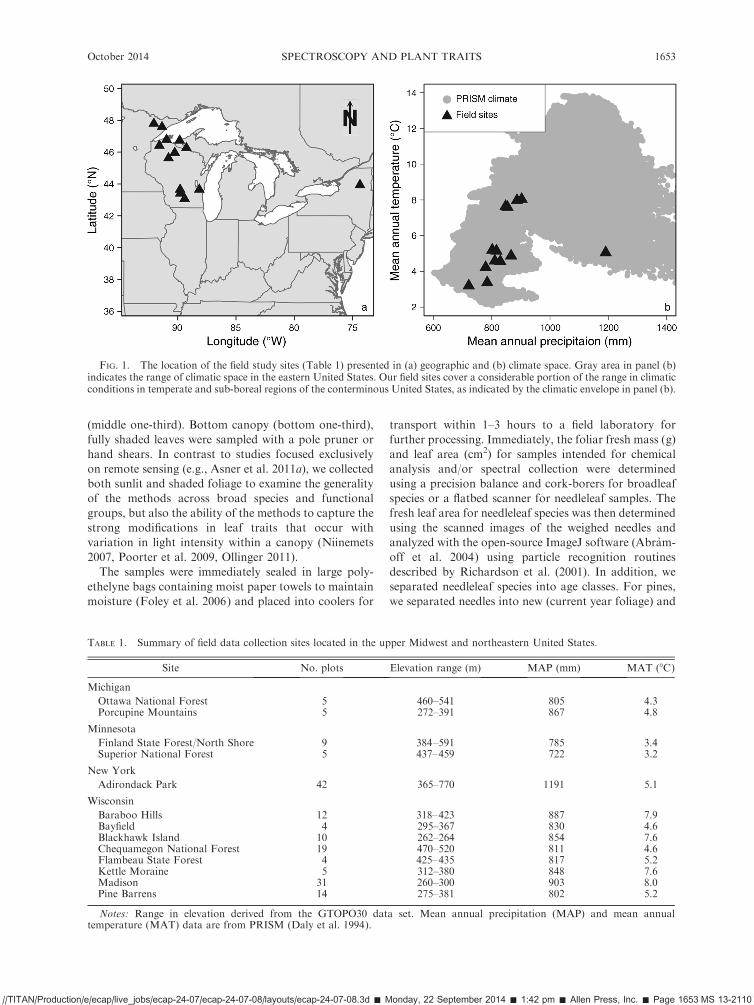
We sampled a broad range of canopy dominant treespecies in natural forests of the north central andnortheastern United States (Fig. 1a, Table 1) during the2008–2011 growing seasons (i.e., June–September). Thedata set comprises the most common tree species foundwithin the forests of this region (Appendix A), and thesample locations span a large range in climaticconditions (Fig. 1, Table 1). The forests in this regionare of high environmental, societal, and economicimportance (White et al. 2005) and have been the focusof many important ecological and global changeresearch projects over the last few decades (e.g., Curtis1959, Pastor et al. 1984, Frelich and Reich 1995,Mitchell et al. 1996, Fassnacht and Gower 1999, Schulteet al. 2005, Wolter et al. 2008, Burton et al. 2011,Couture et al. 2011). The study region includes theChequamegon Ecosystem Atmosphere Study (ChEAS),the goal of which is to characterize the environmentalcontrols and disturbance impacts on forest carbon andwater fluxes within northern temperate forests (e.g.,Burrows et al. 2003, Ahl et al. 2004, Cook et al. 2008,Desai et al. 2008, Ewers et al. 2008). In addition, theBlackhawk Island, Wisconsin, USA study site is thelocation of several pioneering studies illustrating thepotential for imaging spectroscopy to successfully mapecosystem properties related to carbon and nutrientcycling (e.g., Wessman et al. 1988b, Martin and Aber1997). Finally, two of our sites contained old-growthhemlock (Tsuga canadensis), both hardwood forestscomprising the few remnant forests in the region that didnot experience major logging during the last century(Frelich and Lorimer 1991).
Field methods
Samples were collected from 165 plots across thestudy region. At each plot, individual canopies weresampled using a shotgun or line launcher (CascadeRescue, Sandpoint, Idaho, USA) outfitted with a ropesaw to retrieve sunlit foliage from the upper canopy (topone-third) and mid-canopy partially shaded leaves
//TITAN/Production/e/ecap/live_jobs/ecap-24-07/ecap-24-07-08/layouts/ecap-24-07-08.3d ! Monday, 22 September 2014 ! 1:42 pm ! Allen Press, Inc. ! Page 1652 MS 13-2110
SHAWN P. SERBIN ET AL.1652 Ecological ApplicationsVol. 24, No. 7
(middle one-third). Bottom canopy (bottom one-third),fully shaded leaves were sampled with a pole pruner orhand shears. In contrast to studies focused exclusivelyon remote sensing (e.g., Asner et al. 2011a), we collectedboth sunlit and shaded foliage to examine the generalityof the methods across broad species and functionalgroups, but also the ability of the methods to capture thestrong modifications in leaf traits that occur withvariation in light intensity within a canopy (Niinemets2007, Poorter et al. 2009, Ollinger 2011).The samples were immediately sealed in large poly-
ethelyne bags containing moist paper towels to maintainmoisture (Foley et al. 2006) and placed into coolers for
transport within 1–3 hours to a field laboratory forfurther processing. Immediately, the foliar fresh mass (g)and leaf area (cm2) for samples intended for chemicalanalysis and/or spectral collection were determinedusing a precision balance and cork-borers for broadleafspecies or a flatbed scanner for needleleaf samples. Thefresh leaf area for needleleaf species was then determinedusing the scanned images of the weighed needles andanalyzed with the open-source ImageJ software (Abram-off et al. 2004) using particle recognition routinesdescribed by Richardson et al. (2001). In addition, weseparated needleleaf species into age classes. For pines,we separated needles into new (current year foliage) and
TABLE 1. Summary of field data collection sites located in the upper Midwest and northeastern United States.
Site No. plots Elevation range (m) MAP (mm) MAT (8C)
Michigan
Ottawa National Forest 5 460–541 805 4.3Porcupine Mountains 5 272–391 867 4.8
Minnesota
Finland State Forest/North Shore 9 384–591 785 3.4Superior National Forest 5 437–459 722 3.2
New York
Adirondack Park 42 365–770 1191 5.1
Wisconsin
Baraboo Hills 12 318–423 887 7.9Bayfield 4 295–367 830 4.6Blackhawk Island 10 262–264 854 7.6Chequamegon National Forest 19 470–520 811 4.6Flambeau State Forest 4 425–435 817 5.2Kettle Moraine 5 312–380 848 7.6Madison 31 260–300 903 8.0Pine Barrens 14 275–381 802 5.2
Notes: Range in elevation derived from the GTOPO30 data set. Mean annual precipitation (MAP) and mean annualtemperature (MAT) data are from PRISM (Daly et al. 1994).
FIG. 1. The location of the field study sites (Table 1) presented in (a) geographic and (b) climate space. Gray area in panel (b)indicates the range of climatic space in the eastern United States. Our field sites cover a considerable portion of the range in climaticconditions in temperate and sub-boreal regions of the conterminous United States, as indicated by the climatic envelope in panel (b).
//TITAN/Production/e/ecap/live_jobs/ecap-24-07/ecap-24-07-08/layouts/ecap-24-07-08.3d ! Monday, 22 September 2014 ! 1:42 pm ! Allen Press, Inc. ! Page 1653 MS 13-2110
October 2014 1653SPECTROSCOPY AND PLANT TRAITS

old (previous years foliage), while for spruce, fir, andhemlock trees, we maintained three separate classes ofnew, previous year, and older foliage. In the lab, thesame leaf discs and needle samples, separated by age andposition within the canopy, were oven dried at 708C for72 h to obtain oven-dry mass (g). These data, combinedwith the area measurements, were then used to calculatethe specific leaf area (SLA; m2/kg) and leaf mass perarea (1/SLA, Marea; g/m
2).
Tissue chemistry
Oven-dried samples were ground and homogenizedusing a blade grinder and stored in a desiccator. Sampleswere again oven dried the night before sample prepara-tion and allowed to cool for 1 h prior to preparation toensure proper measurement of material dry mass. Wedetermined foliar nitrogen concentration (Nmass; %) viaDumas combustion using the Vario Macro CHN(Elementar, Hanau, Germany). Results are reportedon a dry-mass ash-included basis.Leaf 15N:14N ratio was determined on a subset of
samples via isotope ratio mass spectrometry (IRMS) atthe UC Davis Stable Isotope Facility (SIF; Davis,California, USA). Results were expressed in standard dnotation where foliar 15N:14N ratios are reportedrelative to the atmospheric N2 ratio as d15N (%) ¼(Rsample/Ratmo ! 1) 3 1000, where Ratmo ¼ 0.0036765.The d15N of atmospheric N2 is by definition 0.0%. Theconcentrations of leaf fiber (acid detergent fiber,determined as cellulose þ lignin) and lignin weredetermined gravimetrically using sequential extractionin a hot acid-detergent solution in an Ankom 200 FiberAnalyzer (Ankom Technology, Macedon, New York,USA) and incubation in 72% H2SO4. Cellulose wascalculated as the difference between fiber and lignin.While this method may not be precise for isolating fiber/lignin (Brinkmann et al. 2002), it was deemed sufficientfor examining relative variation in recalcitrance proper-ties among species and sites.
Spectroscopy of the dried and ground leaf material
We collected leaf reflectance spectra on dried, ground,and homogenized leaf material using an ASD FieldSpec3 full-range spectroradiometer (Analytical SpectralDevices, Boulder, Colorado, USA) configured for fastand consistent collection of spectra. We designed andbuilt a ‘‘probe press’’ apparatus; a Dremel Workstation(Dremel, Racine, Wisconsin, USA) drill press modifiedfor use with an ASD plant-probe fore optic, a fittedaluminum sample cup painted matte black with KrylonUltra-Flat Black (Krylon Industrial, Cleveland, Ohio,USA), and an integrated Effetto Mariposa, GiustaforzaProfessional precision torque wrench handle (EffettoMariposa, Bra, Italy), which was used to collect spectraon the dried leaf material. The plant probe contains alight source which is perpendicular to the contactsurface, and the end of a bare fiber-optic cable bundle
mounted at 428 to perpendicular; this configurationminimizes specular reflectance.Through trial-and-error, it was determined that 800
mg of leaf material provided the most consistent andstable results between sample replicates (,0.1% varia-tion, data not shown). The loosely packed dry leafmaterial was weighed and poured into the sample cup,leveled, then the probe was depressed into the samplematerial with 2 N$m of torque. On a single sample, wecollected three spectra, loosened and mixed the samplein the cup, and then collected another three spectra.Between each of the six scans, we turned the sample cupto minimize systematic bias that could arise fromorientation of the material and/or due to probecharacteristics. All spectral observations underwentautomated quality assurance/quality control, as well asa splice correction to ensure continuous spectra acrossdetectors in the spectrometer before averaging in R,using package FieldSpectra to produce a single spectrumper sample (package available online).4
Leaf chemometric analysis
We utilized a partial least-squares regression (PLSR)modeling approach (Wold 1984, 2001, Geladi andKowalski 1986, Serbin et al. 2012) using the PLSpackage (Mevik and Wehrens 2007) in the R open-source statistical environment (R Development CoreTeam 2013) to predict the target leaf traits from ASDspectra. PLSR is a standard statistical approach utilizedin chemometric analyses and is superior to stepwiseregression because it is designed to handle high predictorcollinearity and/or situations where the number ofpredictor variables is equal to or higher than the numberof observations. These situations lead to erroneousresults with standard stepwise linear regression (Gross-man et al. 1996). PLSR reduces the large predictormatrix (i.e., spectral reflectance data) down to arelatively few, noncorrelated latent components.We split our data (Table 2 lists the number of
observations for each trait) for model calibration (80%)and independent validation (20%), ensuring that bothsets spanned the range of measured values for each trait.The calibration data were further split 70% to 30% via1000 permutations to conduct uncertainty analysis (seeMaterials and methods, evaluation of PLSR modelperformance and uncertainty analysis), meaning that forany one of the 1000 permutations, a random 56% of thedata were used for model development and 24% formodel assessment and uncertainty analysis, while anunchanging 20% of the data were withheld entirely untilthe end of the process to evaluate the final models. Weused a set percentage for validation for all traits toensure consistency in the application of our analyses,with 20% specifically selected to ensure that trait withthe lowest number of samples (d15N, n ¼ 178) had
4 https://github.com/serbinsh/R-FieldSpectra
//TITAN/Production/e/ecap/live_jobs/ecap-24-07/ecap-24-07-08/layouts/ecap-24-07-08.3d ! Monday, 22 September 2014 ! 1:42 pm ! Allen Press, Inc. ! Page 1654 MS 13-2110
SHAWN P. SERBIN ET AL.1654 Ecological ApplicationsVol. 24, No. 7
enough samples for calibration and uncertainty analysis.To avoid the potential to over-fit the calibration models,we optimized the number of PLSR components byminimizing the prediction residual sum of squares(PRESS) statistic (Chen et al. 2004). We calculated thePRESS statistic of successive model componentsthrough a cross-validation analysis. For the larger datasets (Nmass, Cmass, and Marea) we used a 10-fold cross-validation, while for the other variables (acid-digestiblefiber [ADF], acid-digestible lignin [ADL], cellulose,d15N), we used leave-one-out cross-validation. Finally,the optimal number of components for each model wasdetermined where the root mean square error (RMSE)of the PRESS statistics achieved a minimum (Wold et al.2001), and successive PLSR components did notimprove RMSE as assessed using a t test. Lastly, wecalculated the variable importance of projections metric(VIP; Wold et al. 1994) on the final models to identifythe regions of the spectrum that were significant to theprediction of the seven leaf traits.We reviewed past studies (e.g., Curran 1989, Elvidge
1990, Fourty et al. 1996, Richardson and Reeves 2005,Petisco et al. 2006, Kleinebecker et al. 2009, Asner et al.2011a, b), to select regions of the spectrum as a basis forpredicting each foliar trait. For Marea, we incorporatedthe visible (VIS, 500–700 nm), near-infrared (NIR, 700–1300 nm), and shortwave-infrared (SWIR, 1300–2400
nm) spectrum, given the coordination of leaf structurewith pigment and water absorption features that co-varywith Marea (Baret and Fourty 1997, Niinemets 2007).For ADF, ADL, cellulose, and d15N, we used a portionof the shortwave-infrared spectrum (SWIR, 1200–2400nm) with well-documented lignocellulose and nitrogenabsorption characteristics (Curran 1989). The Nmass andCmass models used a slightly smaller range of wave-lengths (1500–2400 nm) corresponding to the dominantstructural and nitrogen absorption features (Curran1989, Elvidge 1990). The body of literature indicates thatthe SWIR contains the salient spectral info for mosttraits (Curran 1989, Elvidge 1990, Kokaly et al. 2009),with the NIR being useful for Marea (Asner et al. 2011b)and d15N (Wang et al. 2007). Moreover, we usedpseudo-absorption (A ¼ log[1/R]) for ADF, ADL,cellulose, and d15N rather than reflectance (R) basedon results of previous studies (Table 4).
Evaluation of PLSR model performance and uncertaintyanalysis
We quantified the performance of each PLSR modelusing three main metrics: the coefficient of determina-tion (R2), the root mean square error (RMSE), and themodel bias. We provide the RMSE value for each leaftrait in the units of measure as well as a percentage of
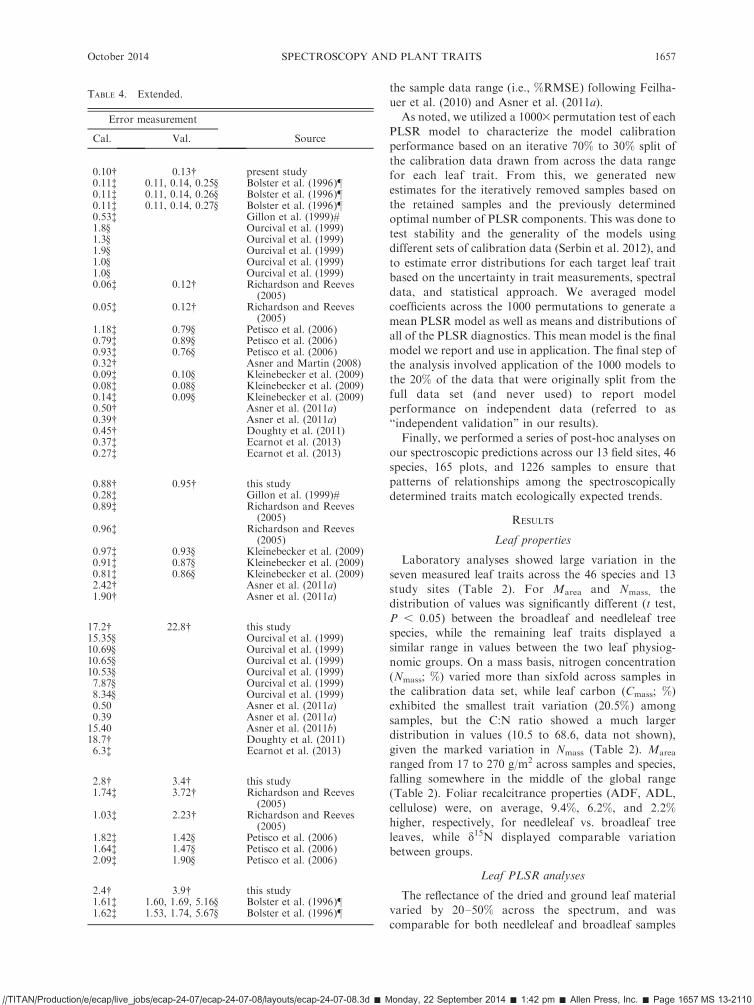
TABLE 3. Results of the PLSR modeling and cross-validation for each leaf trait.
R2 RMSE %RMSE
Leaf property Spectrum range (nm) Treatment No. components Cal. Val. Cal. Val. Cal. Val.
Marea, (g/m2) 500–2400 raw 11 0.91 0.87 17.2 22.8 7.4 10.1
Nmass (%) 1500–2400 raw 9 0.98 0.97 0.10 0.13 2.7 4.0Cmass (%) 1200–2400 raw 12 0.77 0.73 0.88 0.95 9.2 11.1d15N (%) 1200–2400 log(1/R) 14 0.62 0.60 0.91 1.51 10.2 16.2ADF (%) 1200–2400 log(1/R) 13 0.84 0.85 2.8 3.4 7.3 9.3ADL (%) 1200–2400 log(1/R) 13 0.77 0.69 2.4 3.9 9.2 12.7Cellulose (%) 1200–2400 log(1/R) 10 0.77 0.72 1.4 1.9 7.5 11.4
Note: Root mean square error (RMSE) percentage shows the error of each model as a percentage of the observed data range inthe calibration (Cal.) and validation (Val.) data set, respectively. We used pseudo-absorption (A ¼ log[1/R]) for ADF, ADL,cellulose, and d15N rather than reflectance (R) based on results of previous studies.
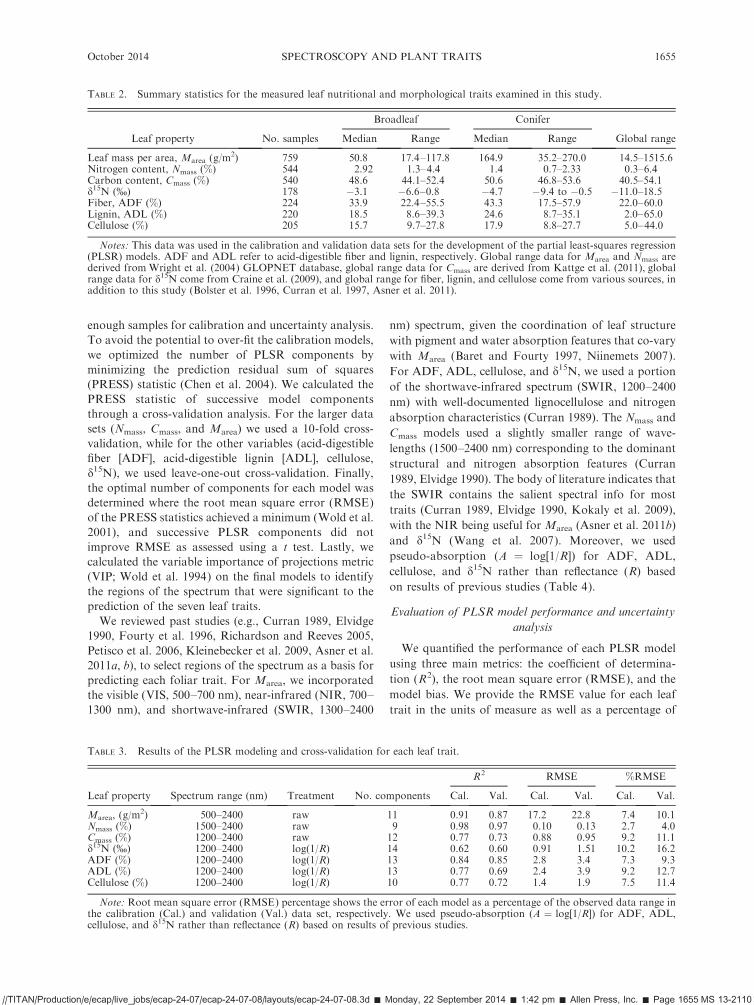
TABLE 2. Summary statistics for the measured leaf nutritional and morphological traits examined in this study.
Broadleaf Conifer
Leaf property No. samples Median Range Median Range Global range
Leaf mass per area, Marea (g/m2) 759 50.8 17.4–117.8 164.9 35.2–270.0 14.5–1515.6
Nitrogen content, Nmass (%) 544 2.92 1.3–4.4 1.4 0.7–2.33 0.3–6.4Carbon content, Cmass (%) 540 48.6 44.1–52.4 50.6 46.8–53.6 40.5–54.1d15N (%) 178 !3.1 !6.6–0.8 !4.7 !9.4 to !0.5 !11.0–18.5Fiber, ADF (%) 224 33.9 22.4–55.5 43.3 17.5–57.9 22.0–60.0Lignin, ADL (%) 220 18.5 8.6–39.3 24.6 8.7–35.1 2.0–65.0Cellulose (%) 205 15.7 9.7–27.8 17.9 8.8–27.7 5.0–44.0
Notes: This data was used in the calibration and validation data sets for the development of the partial least-squares regression(PLSR) models. ADF and ADL refer to acid-digestible fiber and lignin, respectively. Global range data for Marea and Nmass arederived fromWright et al. (2004) GLOPNET database, global range data for Cmass are derived from Kattge et al. (2011), globalrange data for d15N come from Craine et al. (2009), and global range for fiber, lignin, and cellulose come from various sources, inaddition to this study (Bolster et al. 1996, Curran et al. 1997, Asner et al. 2011).
//TITAN/Production/e/ecap/live_jobs/ecap-24-07/ecap-24-07-08/layouts/ecap-24-07-08.3d ! Monday, 22 September 2014 ! 1:42 pm ! Allen Press, Inc. ! Page 1655 MS 13-2110
October 2014 1655SPECTROSCOPY AND PLANT TRAITS

TABLE 4. Comparison of PLSR model results among studies for the seven leaf functional traits.
TraitR2
vegetation type N Spectra Spectral region (m) Spectral treatment Cal. Val.
Nmass (%)
Temperate/boreal 544 dry 1500–2400 raw 0.98 0.98Temperate/boreal 372 dry 400–2498 1D[log(1/R)] 0.97 0.97, 0.93, 0.86Temperate/boreal 372 dry 400–2498 2D[log(1/R)] 0.98 0.97, 0.93, 0.88Temperate/boreal 372 dry 400–2498 2D[log(1/R)] 0.97 0.97, 0.93, 0.84Aleppo pine 84 dry 1100–2500 2D[log(1/R)] 0.94Holm oak 92 fresh 400–1100 log(1/R) 0.51Holm oak 92 fresh 1100–2500 log(1/R) 0.70Holm oak 92 fresh 400–2500 log(1/R) 0.56Holm oak 92 fresh 1100–2500 2D[log(1/R)] 0.89Holm oak 92 fresh 400–2500 2D[log(1/R)] 0.93Montane conifer 132 dry 400–1098 2D[log(1/R)] 0.95 0.84
Montane conifer 132 dry 1100–2498 2D[log(1/R)] 0.96 0.92
Mediterranean 182 dry 1100–2500 log(1/R) 0.96 0.94Mediterranean 182 dry 1100–2500 1D[log(1/R)] 0.99 0.92Mediterranean 182 dry 1100–2500 2D[log(1/R)] 0.99 0.94Tropical forests 162 fresh 400–2500 raw 0.85Bog species 72 dry 1250–2350 log(1/R) 0.96 0.86Bog species 72 dry 1250–2350 1D[log(1/R)] 0.99 0.93Bog species 72 dry 1250–2350 2D[log(1/R)] 0.99 0.89Humid tropical 6136 fresh 400–1050 raw 0.59Humid tropical 6136 fresh 400–2500 raw 0.77Tropical forests 159 fresh 400–2500 raw 0.83Wheat 359 fresh 400–2500 1D 0.92Wheat 253 dry 400–2500 1D 0.93
Cmass (%)
Temperate/boreal 540 dry 1200–2400 raw 0.77 0.73Aleppo pine 84 dry 1100–2500 2D 0.99Montane conifer 72 dry 400–1098 log(1/R) 0.37
Montane conifer 72 dry 1100–2498 2D[log(1/R)] 0.26
Bog species 72 dry 1250–2350 log(1/R) 0.92 0.93Bog species 72 dry 1250–2350 1D[log(1/R)] 0.94 0.93Bog species 72 dry 1250–2350 2D[log(1/R)] 0.96 0.94Humid tropical 6136 fresh 400–1050 raw 0.43Humid tropical 6136 fresh 400–2500 raw 0.71
Marea (g/m2)
Temperate/ boreal 759 dry 500–2400 raw 0.91 0.87Holm oak 373 fresh 400–1100 log(1/R) 0.88Holm oak 373 fresh 1100–2500 log(1/R) 0.96Holm oak 373 fresh 400–2500 log(1/R) 0.95Holm oak 373 fresh 400–1100 2D[log(1/R)] 0.95Holm oak 373 fresh 1100–2500 2D[log(1/R)] 0.97Holm oak 373 fresh 400–2500 2D[log(1/R)] 0.98Humid tropical 6136 fresh 400–1050 raw 0.82Humid tropical 6136 fresh 400–2500 raw 0.77Tropical forests 2871 fresh 400–2500 raw 0.85Tropical forests 159 fresh 400–2500 raw 0.90Wheat 179 fresh 400–2500 1D 0.90
ADF (%)
Temperate/Boreal 224 dry 1200–2400 log(1/R) 0.84 0.85Montane conifer 132 dry 400–1098 2D[log(1/R)] 0.88 0.68
Montane conifer 132 dry 1100–2498 2D[log(1/R)] 0.96 0.89
Mediterranean 182 dry 1100–2500 log(1/R) 0.97 0.96Mediterranean 182 dry 1100–2500 1D[log(1/R)] 0.98 0.96Mediterranean 182 dry 1100–2500 2D[log(1/R)] 0.97 0.92
ADL (%)
Temperate/boreal 220 dry 1200–2400 log(1/R) 0.77 0.69Temperate/boreal 372 dry 400–2498 1D[log(1/R)] 0.88 0.88, 0.78, 0.73Temperate/boreal 372 dry 400–2498 2D[log(1/R)] 0.88 0.89, 0.75, 0.69
//TITAN/Production/e/ecap/live_jobs/ecap-24-07/ecap-24-07-08/layouts/ecap-24-07-08.3d ! Monday, 22 September 2014 ! 1:42 pm ! Allen Press, Inc. ! Page 1656 MS 13-2110
SHAWN P. SERBIN ET AL.1656 Ecological ApplicationsVol. 24, No. 7
the sample data range (i.e., %RMSE) following Feilha-uer et al. (2010) and Asner et al. (2011a).
As noted, we utilized a 10003permutation test of eachPLSR model to characterize the model calibrationperformance based on an iterative 70% to 30% split ofthe calibration data drawn from across the data rangefor each leaf trait. From this, we generated newestimates for the iteratively removed samples based onthe retained samples and the previously determinedoptimal number of PLSR components. This was done totest stability and the generality of the models usingdifferent sets of calibration data (Serbin et al. 2012), andto estimate error distributions for each target leaf traitbased on the uncertainty in trait measurements, spectraldata, and statistical approach. We averaged modelcoefficients across the 1000 permutations to generate amean PLSR model as well as means and distributions ofall of the PLSR diagnostics. This mean model is the finalmodel we report and use in application. The final step ofthe analysis involved application of the 1000 models tothe 20% of the data that were originally split from thefull data set (and never used) to report modelperformance on independent data (referred to as‘‘independent validation’’ in our results).
Finally, we performed a series of post-hoc analyses onour spectroscopic predictions across our 13 field sites, 46species, 165 plots, and 1226 samples to ensure thatpatterns of relationships among the spectroscopicallydetermined traits match ecologically expected trends.
RESULTS
Leaf properties
Laboratory analyses showed large variation in theseven measured leaf traits across the 46 species and 13study sites (Table 2). For Marea and Nmass, thedistribution of values was significantly different (t test,P , 0.05) between the broadleaf and needleleaf treespecies, while the remaining leaf traits displayed asimilar range in values between the two leaf physiog-nomic groups. On a mass basis, nitrogen concentration(Nmass; %) varied more than sixfold across samples inthe calibration data set, while leaf carbon (Cmass; %)exhibited the smallest trait variation (20.5%) amongsamples, but the C:N ratio showed a much largerdistribution in values (10.5 to 68.6, data not shown),given the marked variation in Nmass (Table 2). Marea
ranged from 17 to 270 g/m2 across samples and species,falling somewhere in the middle of the global range(Table 2). Foliar recalcitrance properties (ADF, ADL,cellulose) were, on average, 9.4%, 6.2%, and 2.2%higher, respectively, for needleleaf vs. broadleaf treeleaves, while d15N displayed comparable variationbetween groups.
Leaf PLSR analyses
The reflectance of the dried and ground leaf materialvaried by 20–50% across the spectrum, and wascomparable for both needleleaf and broadleaf samples
TABLE 4. Extended.
Error measurement
Cal. Val. Source
0.10! 0.13! present study0.11" 0.11, 0.14, 0.25§ Bolster et al. (1996)}0.11" 0.11, 0.14, 0.26§ Bolster et al. (1996)}0.11" 0.11, 0.14, 0.27§ Bolster et al. (1996)}0.53" Gillon et al. (1999)#1.8§ Ourcival et al. (1999)1.3§ Ourcival et al. (1999)1.9§ Ourcival et al. (1999)1.0§ Ourcival et al. (1999)1.0§ Ourcival et al. (1999)0.06" 0.12! Richardson and Reeves
(2005)0.05" 0.12! Richardson and Reeves
(2005)1.18" 0.79§ Petisco et al. (2006)0.79" 0.89§ Petisco et al. (2006)0.93" 0.76§ Petisco et al. (2006)0.32! Asner and Martin (2008)0.09" 0.10§ Kleinebecker et al. (2009)0.08" 0.08§ Kleinebecker et al. (2009)0.14" 0.09§ Kleinebecker et al. (2009)0.50! Asner et al. (2011a)0.39! Asner et al. (2011a)0.45! Doughty et al. (2011)0.37" Ecarnot et al. (2013)0.27" Ecarnot et al. (2013)
0.88! 0.95! this study0.28" Gillon et al. (1999)#0.89" Richardson and Reeves
(2005)0.96" Richardson and Reeves
(2005)0.97" 0.93§ Kleinebecker et al. (2009)0.91" 0.87§ Kleinebecker et al. (2009)0.81" 0.86§ Kleinebecker et al. (2009)2.42! Asner et al. (2011a)1.90! Asner et al. (2011a)
17.2! 22.8! this study15.35§ Ourcival et al. (1999)10.69§ Ourcival et al. (1999)10.65§ Ourcival et al. (1999)10.53§ Ourcival et al. (1999)7.87§ Ourcival et al. (1999)8.34§ Ourcival et al. (1999)0.50 Asner et al. (2011a)0.39 Asner et al. (2011a)15.40 Asner et al. (2011b)18.7! Doughty et al. (2011)6.3" Ecarnot et al. (2013)
2.8! 3.4! this study1.74" 3.72! Richardson and Reeves
(2005)1.03" 2.23! Richardson and Reeves
(2005)1.82" 1.42§ Petisco et al. (2006)1.64" 1.47§ Petisco et al. (2006)2.09" 1.90§ Petisco et al. (2006)
2.4! 3.9! this study1.61" 1.60, 1.69, 5.16§ Bolster et al. (1996)}1.62" 1.53, 1.74, 5.67§ Bolster et al. (1996)}
//TITAN/Production/e/ecap/live_jobs/ecap-24-07/ecap-24-07-08/layouts/ecap-24-07-08.3d ! Monday, 22 September 2014 ! 1:42 pm ! Allen Press, Inc. ! Page 1657 MS 13-2110
October 2014 1657SPECTROSCOPY AND PLANT TRAITS
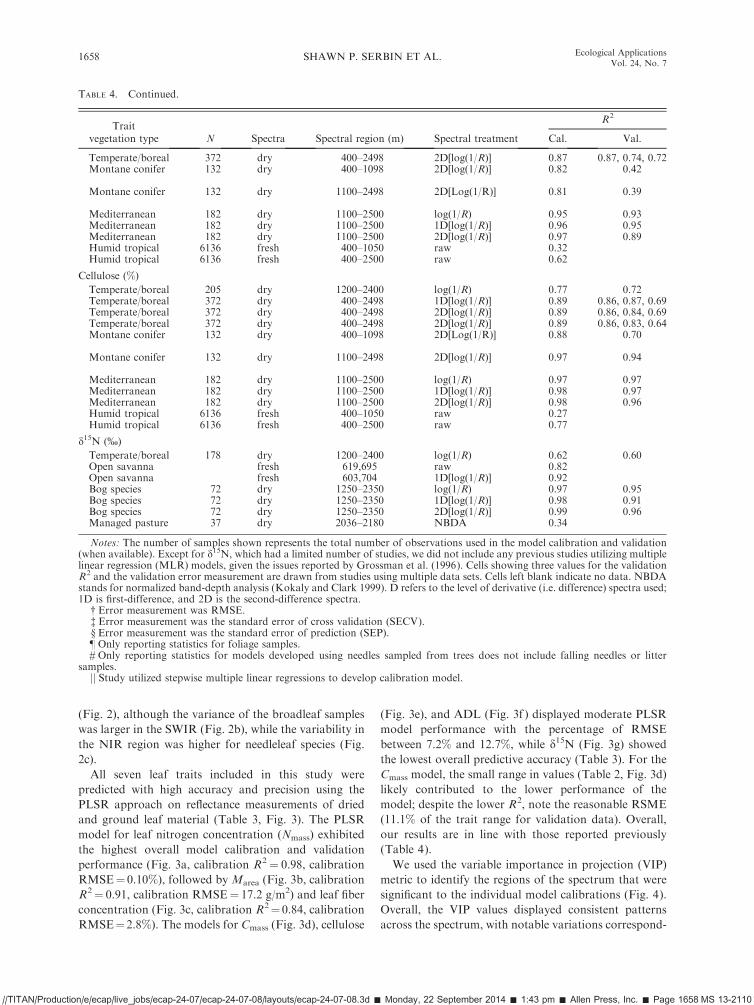
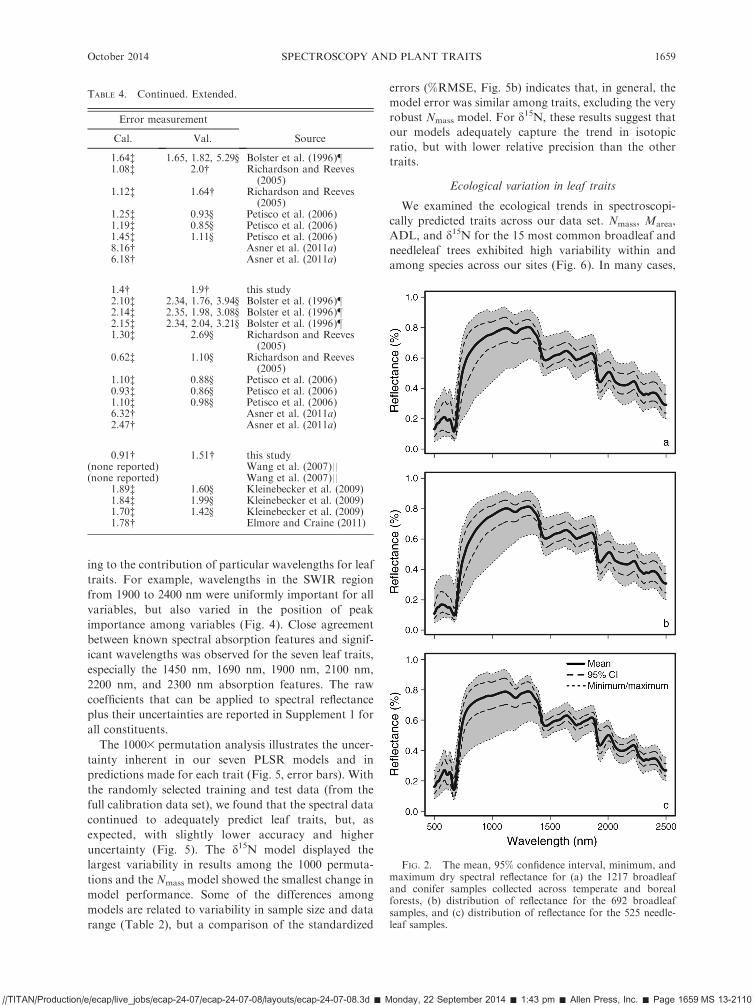
(Fig. 2), although the variance of the broadleaf sampleswas larger in the SWIR (Fig. 2b), while the variability inthe NIR region was higher for needleleaf species (Fig.2c).All seven leaf traits included in this study were
predicted with high accuracy and precision using thePLSR approach on reflectance measurements of driedand ground leaf material (Table 3, Fig. 3). The PLSRmodel for leaf nitrogen concentration (Nmass) exhibitedthe highest overall model calibration and validationperformance (Fig. 3a, calibration R2¼ 0.98, calibrationRMSE¼ 0.10%), followed by Marea (Fig. 3b, calibrationR2¼ 0.91, calibration RMSE¼ 17.2 g/m2) and leaf fiberconcentration (Fig. 3c, calibration R2¼ 0.84, calibrationRMSE¼2.8%). The models for Cmass (Fig. 3d), cellulose
(Fig. 3e), and ADL (Fig. 3f ) displayed moderate PLSRmodel performance with the percentage of RMSEbetween 7.2% and 12.7%, while d15N (Fig. 3g) showedthe lowest overall predictive accuracy (Table 3). For theCmass model, the small range in values (Table 2, Fig. 3d)likely contributed to the lower performance of themodel; despite the lower R2, note the reasonable RSME(11.1% of the trait range for validation data). Overall,our results are in line with those reported previously(Table 4).We used the variable importance in projection (VIP)
metric to identify the regions of the spectrum that weresignificant to the individual model calibrations (Fig. 4).Overall, the VIP values displayed consistent patternsacross the spectrum, with notable variations correspond-
TABLE 4. Continued.
TraitR2
vegetation type N Spectra Spectral region (m) Spectral treatment Cal. Val.
Temperate/boreal 372 dry 400–2498 2D[log(1/R)] 0.87 0.87, 0.74, 0.72Montane conifer 132 dry 400–1098 2D[log(1/R)] 0.82 0.42
Montane conifer 132 dry 1100–2498 2D[Log(1/R)] 0.81 0.39
Mediterranean 182 dry 1100–2500 log(1/R) 0.95 0.93Mediterranean 182 dry 1100–2500 1D[log(1/R)] 0.96 0.95Mediterranean 182 dry 1100–2500 2D[log(1/R)] 0.97 0.89Humid tropical 6136 fresh 400–1050 raw 0.32Humid tropical 6136 fresh 400–2500 raw 0.62
Cellulose (%)
Temperate/boreal 205 dry 1200–2400 log(1/R) 0.77 0.72Temperate/boreal 372 dry 400–2498 1D[log(1/R)] 0.89 0.86, 0.87, 0.69Temperate/boreal 372 dry 400–2498 2D[log(1/R)] 0.89 0.86, 0.84, 0.69Temperate/boreal 372 dry 400–2498 2D[log(1/R)] 0.89 0.86, 0.83, 0.64Montane conifer 132 dry 400–1098 2D[Log(1/R)] 0.88 0.70
Montane conifer 132 dry 1100–2498 2D[log(1/R)] 0.97 0.94
Mediterranean 182 dry 1100–2500 log(1/R) 0.97 0.97Mediterranean 182 dry 1100–2500 1D[log(1/R)] 0.98 0.97Mediterranean 182 dry 1100–2500 2D[log(1/R)] 0.98 0.96Humid tropical 6136 fresh 400–1050 raw 0.27Humid tropical 6136 fresh 400–2500 raw 0.77
d15N (%)
Temperate/boreal 178 dry 1200–2400 log(1/R) 0.62 0.60Open savanna fresh 619,695 raw 0.82Open savanna fresh 603,704 1D[log(1/R)] 0.92Bog species 72 dry 1250–2350 log(1/R) 0.97 0.95Bog species 72 dry 1250–2350 1D[log(1/R)] 0.98 0.91Bog species 72 dry 1250–2350 2D[log(1/R)] 0.99 0.96Managed pasture 37 dry 2036–2180 NBDA 0.34
Notes: The number of samples shown represents the total number of observations used in the model calibration and validation(when available). Except for d15N, which had a limited number of studies, we did not include any previous studies utilizing multiplelinear regression (MLR) models, given the issues reported by Grossman et al. (1996). Cells showing three values for the validationR2 and the validation error measurement are drawn from studies using multiple data sets. Cells left blank indicate no data. NBDAstands for normalized band-depth analysis (Kokaly and Clark 1999). D refers to the level of derivative (i.e. difference) spectra used;1D is first-difference, and 2D is the second-difference spectra.
! Error measurement was RMSE." Error measurement was the standard error of cross validation (SECV).§ Error measurement was the standard error of prediction (SEP).} Only reporting statistics for foliage samples.# Only reporting statistics for models developed using needles sampled from trees does not include falling needles or litter
samples.jj Study utilized stepwise multiple linear regressions to develop calibration model.
//TITAN/Production/e/ecap/live_jobs/ecap-24-07/ecap-24-07-08/layouts/ecap-24-07-08.3d ! Monday, 22 September 2014 ! 1:43 pm ! Allen Press, Inc. ! Page 1658 MS 13-2110
SHAWN P. SERBIN ET AL.1658 Ecological ApplicationsVol. 24, No. 7
ing to the contribution of particular wavelengths for leaftraits. For example, wavelengths in the SWIR regionfrom 1900 to 2400 nm were uniformly important for allvariables, but also varied in the position of peakimportance among variables (Fig. 4). Close agreementbetween known spectral absorption features and signif-icant wavelengths was observed for the seven leaf traits,especially the 1450 nm, 1690 nm, 1900 nm, 2100 nm,2200 nm, and 2300 nm absorption features. The rawcoefficients that can be applied to spectral reflectanceplus their uncertainties are reported in Supplement 1 forall constituents.The 10003 permutation analysis illustrates the uncer-
tainty inherent in our seven PLSR models and inpredictions made for each trait (Fig. 5, error bars). Withthe randomly selected training and test data (from thefull calibration data set), we found that the spectral datacontinued to adequately predict leaf traits, but, asexpected, with slightly lower accuracy and higheruncertainty (Fig. 5). The d15N model displayed thelargest variability in results among the 1000 permuta-tions and the Nmass model showed the smallest change inmodel performance. Some of the differences amongmodels are related to variability in sample size and datarange (Table 2), but a comparison of the standardized
errors (%RMSE, Fig. 5b) indicates that, in general, themodel error was similar among traits, excluding the veryrobust Nmass model. For d15N, these results suggest thatour models adequately capture the trend in isotopicratio, but with lower relative precision than the othertraits.
Ecological variation in leaf traits
We examined the ecological trends in spectroscopi-cally predicted traits across our data set. Nmass, Marea,ADL, and d15N for the 15 most common broadleaf andneedleleaf trees exhibited high variability within andamong species across our sites (Fig. 6). In many cases,
FIG. 2. The mean, 95% confidence interval, minimum, andmaximum dry spectral reflectance for (a) the 1217 broadleafand conifer samples collected across temperate and borealforests, (b) distribution of reflectance for the 692 broadleafsamples, and (c) distribution of reflectance for the 525 needle-leaf samples.
TABLE 4. Continued. Extended.
Error measurement
Cal. Val. Source
1.64" 1.65, 1.82, 5.29§ Bolster et al. (1996)}1.08" 2.0! Richardson and Reeves
(2005)1.12" 1.64! Richardson and Reeves
(2005)1.25" 0.93§ Petisco et al. (2006)1.19" 0.85§ Petisco et al. (2006)1.45" 1.11§ Petisco et al. (2006)8.16! Asner et al. (2011a)6.18! Asner et al. (2011a)
1.4! 1.9! this study2.10" 2.34, 1.76, 3.94§ Bolster et al. (1996)}2.14" 2.35, 1.98, 3.08§ Bolster et al. (1996)}2.15" 2.34, 2.04, 3.21§ Bolster et al. (1996)}1.30" 2.69§ Richardson and Reeves
(2005)0.62" 1.10§ Richardson and Reeves
(2005)1.10" 0.88§ Petisco et al. (2006)0.93" 0.86§ Petisco et al. (2006)1.10" 0.98§ Petisco et al. (2006)6.32! Asner et al. (2011a)2.47! Asner et al. (2011a)
0.91! 1.51! this study(none reported) Wang et al. (2007)||(none reported) Wang et al. (2007)||
1.89" 1.60§ Kleinebecker et al. (2009)1.84" 1.99§ Kleinebecker et al. (2009)1.70" 1.42§ Kleinebecker et al. (2009)1.78! Elmore and Craine (2011)
//TITAN/Production/e/ecap/live_jobs/ecap-24-07/ecap-24-07-08/layouts/ecap-24-07-08.3d ! Monday, 22 September 2014 ! 1:43 pm ! Allen Press, Inc. ! Page 1659 MS 13-2110
October 2014 1659SPECTROSCOPY AND PLANT TRAITS

the within-species variation was as high as the variationacross species, likely related to differences among layersin the canopy and ecological variations in site condi-tions. For Marea, canopy position (i.e., growing seasonlight levels) played a strong role in mediating the valuesfrom the bottom to the top of the canopy, while Nmass
did not display a significant change in values withcanopy position (Fig. 7). However, nitrogen content(Narea, g/m
2; the product of Marea and Nmass) increasedfrom the lower- to uppermost branches in the canopy,related to the strong changes in Marea, but the increasewas greater for broadleaf trees (Fig. 7). For d15N, we
observed strong variation across sites related to broadclimatic patterns, which in turn influence speciescomposition and nutrient cycling (Fig. 8).
DISCUSSION
Our results for northern temperate and boreal foresttree species demonstrate the ability of dry-materialspectra to characterize a wide range of foliar traitsbetween and among species and functional types, as wellas across the broad ecological gradients that drivebetween- and within-species variation in those traits.Moreover, we show that we can employ a single
FIG. 3. Independent validation results for the seven partial least-squares regression (PLSR) models; nitrogen content (Nmass),carbon content (Cmass), isotopic composition (d15N), leaf mass per area (Marea), acid-digestible fiber content (ADF), and acid-digestible lignin content (ADL). Error bars denote the 95% confidence intervals for each predicted value, while the dark lines denotethe 95% prediction intervals and gray lines show the 95% confidence interval of the models. The dashed lines show the 1:1 line, withthe regression line shown in light gray. Other abbreviations and variables are RMSE, root mean square error, and Nval. Nval refersto the number of independent observations used for validation of each PLSR model.
//TITAN/Production/e/ecap/live_jobs/ecap-24-07/ecap-24-07-08/layouts/ecap-24-07-08.3d ! Monday, 22 September 2014 ! 1:43 pm ! Allen Press, Inc. ! Page 1660 MS 13-2110
SHAWN P. SERBIN ET AL.1660 Ecological ApplicationsVol. 24, No. 7

calibration model per trait for all species and differingcanopy positions among those species, suggesting a rapidand cost-effective approach to the quantification ofgeographic variation in foliar traits. Our results arecomparable to previous studies using PLSR approaches(e.g., Bolster et al. 1996, Gillon et al. 1999, Brinkmann etal. 2002, Richardson and Reeves 2005, Petisco et al. 2006,Asner et al. 2011a; Table 4) and other methods (e.g.,McLellan et al. 1991a, Martin and Aber 1994, Kokalyand Clark 1999, Curran et al. 2001). We observed the best
model performance for the Nmass model, which isconsistent with previous research (e.g., Bolster et al.1996, Petisco et al. 2006); however our model for Marea
was also strong (Table 3, Fig. 3b), with accuracy similarto results derived from fresh-leaf spectroscopy (e.g.,Ourcival et al. 1999, Asner et al. 2011a; Table 4). ThePLSR models for other leaf traits displayed slightly lowerperformance (Table 3, Figs. 3 and 5), but are within therange of results expected from the literature, several ofwhich used fresh-leaf spectra observations (Table 4).
FIG. 4. The PLSR model variable importance of prediction (VIP) plot by wavelength for the six chemical constituentsinvestigated in this study. The wavelength centers of key leaf chemical absorption features for leaf proteins, starches, cellulose, andlignin (Curran 1989, Elvidge 1990, Fourty et al. 1996) are presented as the vertical gray lines for reference.
FIG. 5. Distribution of model performance for 10003 permutation tests used to calculate model uncertainty. The boxplotsdisplay the median for each trait by group (dark vertical line), the interquartile range (boxes), and the data range (whiskers). Graydots indicate performance of the model on the independent validation data (Table 3).
//TITAN/Production/e/ecap/live_jobs/ecap-24-07/ecap-24-07-08/layouts/ecap-24-07-08.3d ! Monday, 22 September 2014 ! 1:43 pm ! Allen Press, Inc. ! Page 1661 MS 13-2110
October 2014 1661SPECTROSCOPY AND PLANT TRAITS

However, in contrast to many previous studies (Table 4),we avoided the use of first or higher order differencespectra. Permutations using derivative as opposed to rawspectra showed that such transformations yield unstablemodels because of the additional noise in the derivativespectra and the resulting influence this noise has on the
PLSR regression coefficients (data not shown). Althoughseveral of the leaf traits we tested have been examinedelsewhere, our study is unique in that we examined a largenumber of species (46) and traits (seven) concurrently,and analyzed leaves from different canopy levels (topthird, middle third, and bottom third), following a
FIG. 6. Trait variability determined from spectroscopy for eight common broadleaf (left column) and seven common needleleaf(right column) species. Traits measured are (a, b) nitrogen concentration, (c, d) leaf mass per area, (e, f ) lignin concentration, and(g, h) isotopic 15N ratio. Species measured are red maple (ACRU), sugar maple (ACSA), yellow birch (BEAL), white ash (FRAM),trembling aspen (POTR), white oak (QUAL), northern red oak (QURU), American basswood (TIAM), balsam fir (ABBA), jackpine (PIBA), black spruce (PIMA), red pine (PIRE), white pine (PIST), northern white cedar (THOC), and eastern hemlock(TSCA). Boxplots display the median for each trait by group (dark horizontal line), the interquartile range (boxes), the data range(whiskers), and the extreme observations (black dots).
//TITAN/Production/e/ecap/live_jobs/ecap-24-07/ecap-24-07-08/layouts/ecap-24-07-08.3d ! Monday, 22 September 2014 ! 1:43 pm ! Allen Press, Inc. ! Page 1662 MS 13-2110
SHAWN P. SERBIN ET AL.1662 Ecological ApplicationsVol. 24, No. 7

consistent analytical approach. Furthermore, we includeda comprehensive uncertainty analysis within our PLSRmodeling step. The coefficients reported in Supplement 1can be applied to spectra recorded in a fashion consistentwith our methods to estimate these traits for temperateand boreal taxa similar to those in our data set.Our results reinforce the utility of spectroscopic
methods for quantitatively estimating a range of keyfoliar properties, including Marea (LMA), Nmass, andstructural components (e.g., lignin, cellulose), acrossdiverse tree species (Figs. 3 and 4). Unlike the use ofnarrow-band spectral vegetation indices (SVIs) for theestimation of key leaf traits (e.g., Gitelson et al. 2006, LeMaire et al. 2008), our PLSR approach characterizes thesimultaneous contribution of many important absorp-tion properties of leaves (e.g., Curran 1989, Fourty et al.1996, Foley et al. 1998; Fig. 4) to the overall relationshipwith leaf reflectance, generally yielding more robustmodels when compared to SVIs (Feret et al. 2011).Specifically, the locations of important wavelengths inour biochemical PLSR models match the locations ofknown spectral absorption features related to proteins,nitrogen, lignin, cellulose, and starches (Curran 1989,Elvidge 1990, Fourty et al. 1996, Kokaly et al. 2009; Fig.4). However, differences in important wavelengthsamong traits (Fig. 4) and in the associated predictioncoefficients (Supplement 1) demonstrate that the rela-tionships between spectral features and foliar traits varyconsiderably, emphasizing that different components ofthe spectrum are sensitive to different chemical constit-uents or leaf traits.The ability to accurately estimate leaf chemistry using
reflectance spectroscopy depends on instrument charac-teristics (e.g., spectral resolution, signal-to-noise, whichhas steadily improved in recent years), the magnitude ofthe optical signal for the trait of interest, and theavailability of foliage samples spanning a sufficientrange of values (Curran 1989, Foley et al. 1998, Feret etal. 2011). In addition, the measurement precision of theanalytical techniques to develop calibration data canvary among the traits of interest. In particular, themethods for determining ADF and lignin ADL concen-tration can result in relatively high variance betweenreplicate samples (Brinkmann et al. 2002). This is due tothe gravimetric methods used to determine the values forADF and ADL; cellulose is determined as the differencebetween the two. In our data set, we estimate fromsample replicates that measurement error for ADF andADL is between 1% and 12%, but generally less than5%. Similarly, we found considerable replicate variancefor the d15N samples, ranging from 1% to 10%.Likewise, the methods used for estimating needleleafMarea are also known to introduce error (Bond-Lamberty et al. 2003), primarily due to the difficulty inaccurately measuring the projected area of needles. Areview of the literature suggests that a model for Marea
may be improved by the use of fresh-leaf spectroscopicdata (Table 4), given the strong coupling between water
content, leaf structure, and Marea (Fourty and Baret1997, Asner et al. 2011a, b).
Our study differs significantly from previous re-search in that we did not limit our collection of foliarsamples to the top, sunlit portion of the crown (e.g.,Asner et al. 2011a), nor did we aggregate samples fromdiffering needle ages in evergreen conifer species (e.g.,Petisco et al. 2006). The resulting PLSR models wereable to successfully integrate all the variation relatedto species, canopy position, and physiognomic differ-entiation (Table 2, Appendix A) into a single model
FIG. 7. Trait variation by canopy position (bottom one-third, middle one-third, top one-third of canopy) determinedfrom spectroscopy for (a) leaf mass per area, (b) nitrogenconcentration, and (c) nitrogen content. Boxplots display themedian for each trait by group (dark horizontal line), theinterquartile range (boxes), the data range (whiskers), and theextreme observations (black dots).
//TITAN/Production/e/ecap/live_jobs/ecap-24-07/ecap-24-07-08/layouts/ecap-24-07-08.3d ! Monday, 22 September 2014 ! 1:43 pm ! Allen Press, Inc. ! Page 1663 MS 13-2110
October 2014 1663SPECTROSCOPY AND PLANT TRAITS

for each trait (Table 3, Fig. 3). The results did notshow sensitivity of the models to species type, canopyposition, or leaf lifespan (Appendix B). This demon-strates that we can use these models to rapidly assessimportant within-canopy variations in leaf traits thatare ecologically significant to whole-plant nutrientdynamics, light harvesting, and carbon sequestration.The within-canopy variation is often ignored whenestimating canopy or stand level variables for ecosys-tem process models, some of which can utilize thisinformation directly (e.g., Drewry et al. 2010), andother analyses due to the logistics of sample collectionor analytical expense. The key finding is that spectrareflect the variations in leaf properties within acanopy, thereby enabling spectroscopy retrieval oftraits without having to stratify the analyses by canopyposition.
Spectroscopic determination of foliar isotopes
Several previous studies explored the potential toestimate foliar isotopic concentrations of leaf nitrogen(d15N) and carbon (d13C), reporting accuracy levels of70–99% (Richardson and Reeves 2005, Wang et al.2007, Kleinebecker et al. 2009). However, Elmore andCraine (2011) did not observe a strong relationshipbetween spectral reflectance of dried and ground leafmaterial and d15N (R2¼ 0.34). In addition, they did notobserve a strong relationship between leaf nitrogen andd15N, which they hypothesized as one of the more likelyreasons for which previous studies observed an ability toestimate d15N from leaf reflectance spectroscopy. Weobserved only a moderate correlation between d15N andleaf nitrogen percentage (Nmass, r ¼ 0.32), suggesting
covariance with Nmass may have only provided a minorcontribution to our ability to predict d15N. However,given the prediction R2¼0.62 for d15N from spectra, it isunlikely that the weak correlation between d15N andNmass alone explains our ability to estimate d15N, andthat spectroscopic sensitivity to d15N is a real featurerather than an artifact of a d15N–Nmass correlation.Much work is still required to develop full confidence inthe ability to estimate d15N from spectroscopy: ourmodel for d15N was not as strong as that reported byKleinebecker et al. (2009), which may result from samplesize (N ¼ 72 compared to our N ¼ 178) or scope ofspecies included. Nevertheless, the results of our studyand others (Richardson and Reeves 2005, Kleinebeckeret al. 2009) highlight the potential for the spectroscopicdetermination of foliar isotopes, even if only broadly,and represent an important prospect for ecologicalstudies.
Broad applications of contact spectroscopy for ecologicalstudies
Use of rapid spectroscopic methods to characterizefoliar traits imparts considerable savings in both timeand analytical expense, allowing for a larger number ofmeasurements to be made across broader geographicregions. This increase in measurement capacity leads toa greater ability to both characterize within- andbetween-species variability and to test hypotheses aboutspatial variability in foliar traits with respect to climaticand other drivers (e.g., disturbance legacies; Deel et al.2012). For instance, ecosystem models often assumeconstant values of traits per species, when in fact thesetraits can vary considerably within a species (Fig. 6).
FIG. 8. Patterns across broad climatic gradients of foliar isotopic concentration (d15N) determined from spectroscopy. (a)Relationship of foliar d15N with mean annual temperature. (b) Relationship of foliar d15N with mean annual precipitation. Theblack filled circles show the patterns of broadleaf tree species, while the gray filled circles display the patterns of needle-leaf treespecies. Climate data were derived from PRISM (Daly et al. 1994). Patterns closely match those derived from a global data set(Craine et al. 2009).
//TITAN/Production/e/ecap/live_jobs/ecap-24-07/ecap-24-07-08/layouts/ecap-24-07-08.3d ! Monday, 22 September 2014 ! 1:43 pm ! Allen Press, Inc. ! Page 1664 MS 13-2110
SHAWN P. SERBIN ET AL.1664 Ecological ApplicationsVol. 24, No. 7

However, we can now utilize information on traitvariability to better simulate variation and uncertaintyin ecosystem responses to climate, global change, anddisturbances (LeBauer et al. 2013). Moreover, traits varywithin canopies, in particular in response to the lightenvironment (Niinemets 2007). Most notably, Marea ishigher in the sunlit portion of a canopy, and declineswith lower canopy position (Fig. 7). Although nitrogenconcentration by mass (Nmass) does not vary consider-ably within a canopy (Fig. 7), nitrogen content by area(Narea), a key determinant of photosynthetic capacity(Kattge et al. 2009), is highly variable as a consequenceof the variability in Marea within canopies (Fig. 7). Interms of characterizing the recalcitrance properties offoliage (e.g., ADL, cellulose, d15N), our spectroscopicmethods yielded estimates that match expected ecolog-ical patterns across species types (Fig. 6e–h), describingthe potential turnover rates and nitrogen cyclingpotential (Melillo et al. 1982) across a much largersample than is logistically feasible with standardapproaches. For example, isotopic analysis can beprohibitive but, despite our reported limitations, pat-terns of d15N derived from spectra with respect toclimate follow the results of Craine et al. (2009) quitewell. The ability to utilize rapid and inexpensivespectroscopic methods to quantify the patterns of foliartraits allows for meaningful data to be feasibly generatedacross a wide variety of species, canopy heights, andstudy locations. Also, further refinement of laboratoryspectroscopic techniques provides increased support forrefining algorithms useful for predicting these traits fromcanopy-level imaging spectrometer data (e.g., AVIRIS;Green et al. 1998).
Generalized algorithms of leaf functional traits
Building on our results, future work should concen-trate on linking similar data and observations fromaround the world (e.g., Bolster et al. 1996, Asner et al.2011a, Doughty et al. 2011) to develop globallygeneralized models (e.g., Martin et al. 2008, Feret etal. 2011). Numerous studies have illustrated thepotential for remotely sensing foliar biochemistry at avariety of scales and with fresh or dry leaf spectra (e.g.,Wessman et al. 1988a, b, Bolster et al. 1996, Martin andAber 1997, Richardson and Reeves 2005, Petisco et al.2006, Asner et al. 2011a), yet a general set of modelscovering the larger suite of leaf traits worldwide doesnot exist. For intensive projects such as the U.S.National Ecological Observatory Network (NEON;Kampe et al. 2010) and the Carnegie Spectranomicsproject (Asner and Martin 2009), which have largeremote sensing and leaf-based spectroscopy compo-nents, it is becoming increasingly important to stan-dardize methods and provide operational algorithmsthat can be applied both at the leaf level and fromremote sensing platforms.Future spaceborne imaging spectrometers such as the
proposed Hyperspectral Infrared Imager (HyspIRI)
will allow for the repeat, global mapping of keyecosystem parameters, such as Nmass and Marea.Further work will help identify the extent to whichleaf-level spectral features scale to the pixel. Our studyand others, such as Feret et al. (2011) and Asner et al.(2011a), provide a foundation for such efforts andshould help to distinguish the candidate traits forgeneralized multiscale models (e.g., Nmass, Marea,lignin) from those that may not scale efficiently (e.g.,d15N). In particular, the development of standardizedapproaches to retrieve foliar traits from leaf-levelspectra across many species provides the basis toidentify and compare spectral features in canopy-levelspectra that are related to these same traits. Thecorrespondence of spectral features to foliar traits inmultiple types of spectral data (dry, fresh, canopyspectra) points to a convergence of foliar opticalproperties that we can leverage to more fully charac-terize the variability in ecological function of ecosys-tems across broad geographical areas (Townsend et al.2013). Future work will address spectral variability infresh spectra and imaging spectroscopy using thesesame species, sample locations, and study sites.
CONCLUSIONS
The characterization of foliar chemistry compositionand morphology is essential to understanding theresponse of forest ecosystems to continued globalchange. In this study, we found that a number ofimportant leaf structural and biochemical traits could beaccurately estimated utilizing spectroscopic data, col-lected on dried and ground leaf material, and a partialleast-squares regression (PLSR) approach. These in-cluded leaf nitrogen concentration (Nmass; %), carbonconcentration (Cmass; %), leaf mass per area (Marea; g/m2), fiber (ADF; %), lignin (ADL; %), cellulose (%), andthe nitrogen isotopic composition (d15N; %). Inparticular, Nmass was strongly related to leaf spectra(R2¼ 0.98), as were fiber constituents (R2 of 0.77–0.84)and leaf mass per area (R2 ¼ 0.91). The wavelengthcontributions were broadly similar for the seven leaftraits, but also displayed significant distinctions inspecific wavelengths of importance, especially withinthe shortwave infrared (SWIR) region. In addition, thewavelengths of highest importance corresponded tospectral regions of known chemical absorption features,including those related to foliar proteins, lignin,cellulose, and starches. An important next step for thistype of remote sensing research is to combine similardata sets for other ecosystems (e.g., Richardson andReeves 2005, Petisco et al. 2006, Asner et al. 2011a) torefine and standardize both data and methods as a basisfor operational models to estimate foliar traits fromvegetation globally. Such information will facilitatemore rapid and geographically broader characterizationof the range of variability in vegetation traits (and ouruncertainty in estimating them) for ecological research,remote sensing, and modeling.
//TITAN/Production/e/ecap/live_jobs/ecap-24-07/ecap-24-07-08/layouts/ecap-24-07-08.3d ! Monday, 22 September 2014 ! 1:43 pm ! Allen Press, Inc. ! Page 1665 MS 13-2110
October 2014 1665SPECTROSCOPY AND PLANT TRAITS

ACKNOWLEDGMENTS
Funding for this research was provided by NASA TerrestrialEcology grant NNX08AN31G to P. A. Townsend and B. E.McNeil and a NASA Earth and Space Science Fellowship grantNNX08AV07H to S. P. Serbin. Thank you to J. Limbach, B.Isaacson, A. Edgerton, L. Deel, B. Breslow, C. Parana, and C.Leibfried for field and laboratory assistance, and to E. Kruger,S. T. Gower and C. Kucharik for helpful comments on earlierversions of this paper. Finally, we would like to thank twoanonymous reviewers for the helpful comments that greatlyimproved an earlier version of the manuscript.
LITERATURE CITED
Aber, J. D., and J. M. Melillo. 1982. Nitrogen immobilizationin decaying hardwood leaf litter as a function of initialnitrogen and lignin content. Canadian Journal of Botany60:2261–2269.
Abramoff, M. D., P. J. Magalhaes, and S. J. Ram. 2004. Imageprocessing with ImageJ. Biophotonics International 11:36–42.
Ahl, D. E., S. T. Gower, D. S. Mackay, S. N. Burrows, J. M.Norman, and G. R. Diak. 2004. Heterogeneity of light useefficiency in a northern Wisconsin forest: implications formodeling net primary production with remote sensing.Remote Sensing of Environment 93:168–178.
Asner, G. P., and R. E. Martin. 2008. Spectral and chemicalanalysis of tropical forests: scaling from leaf to canopy levels.Remote Sensing of Environment 112:3958–3970.
Asner, G. P., and R. E. Martin. 2009. Airborne spectranomics:mapping canopy chemical and taxonomic diversity intropical forests. Frontiers in Ecology and the Environment7:269–276.
Asner, G. P., R. E. Martin, D. E. Knapp, R. Tupayachi, C.Anderson, L. Carranza, P. Martinez, M. Houcheime, F.Sinca, and P. Weiss. 2011a. Spectroscopy of canopychemicals in humid tropical forests. Remote Sensing ofEnvironment 115:3587–3598.
Asner, G. P., R. E. Martin, R. Tupayachi, R. Emerson, P.Martinez, F. Sinca, G. V. N. Powell, S. J. Wright, and A. E.Lugo. 2011b. Taxonomy and remote sensing of leaf mass perarea (LMA) in humid tropical forests. Ecological Applica-tions 21:85–98.
Baret, F., and T. Fourty. 1997. Estimation of leaf water contentand specific leaf weight from reflectance and transmittancemeasurements. Agronomie 17:455–464.
Bolster, K. L., M. E. Martin, and J. D. Aber. 1996.Determination of carbon fraction and nitrogen concentrationin tree foliage by near infrared reflectance: a comparison ofstatistical methods. Canadian Journal of Forest Research26:590–600.
Bond-Lamberty, B., C. Wang, and S. T. Gower. 2003. The useof multiple measurement techniques to refine estimates ofconifer needle geometry. Canadian Journal of ForestResearch 33:101–105.
Bowling, D. R., D. E. Pataki, and J. T. Randerson. 2008.Carbon isotopes in terrestrial ecosystem pools and CO2
fluxes. New Phytologist 178:24–40.Brinkmann, K., L. Blaschke, and A. Polle. 2002. Comparison
of different methods for lignin determination as a basis forcalibration of near-infrared reflectance spectroscopy andimplications of lignoproteins. Journal of Chemical Ecology28:2483–2501.
Burrows, S. N., S. T. Gower, J. M. Norman, G. Diak, D. S.Mackay, D. E. Ahl, and M. K. Clayton. 2003. Spatialvariability of aboveground net primary production for aforested landscape in northern Wisconsin. Canadian Journalof Forest Research 33:2007–2018.
Burton, J. I., D. J. Mladenoff, M. K. Clayton, and J. A.Forrester. 2011. The roles of environmental filtering andcolonization in the fine-scale spatial patterning of ground-
layer plant communities in north temperate deciduousforests. Journal of Ecology 99:764–776.
Card, D. H., D. L. Peterson, P. A. Matson, and J. D. Aber.1988. Prediction of leaf chemistry by the use of visible andnear infrared reflectance spectroscopy. Remote Sensing ofEnvironment 26:123–147.
Chen, S., X. Hong, C. J. Harris, and P. M. Sharkey. 2004.Spare modeling using orthogonal forest regression withPRESS statistic and regularization. IEEE Transaction onSystems, Man and Cybernetics 34:898–911.
Compton, J. E., T. D. Hooker, and S. S. Perakis. 2007.Ecosystem N distribution and d15N during a century of forestregrowth after agricultural abandonment. Ecosystems10:1197–1208.
Cook, B. D., P. V. Bolstad, J. G. Martin, F. A. Heinsch, K. J.Davis, W. G. Wang, A. R. Desai, and R. M. Teclaw. 2008.Using light-use and production efficiency models to predictphotosynthesis and net carbon exchange during forestcanopy disturbance. Ecosystems 11:26–44.
Cornwell, W. K., et al. 2008. Plant species traits are thepredominant control on litter decomposition rates withinbiomes worldwide. Ecology Letters 11:1065–1071.
Couture, J., T. Meehan, and R. Lindroth. 2011. Atmosphericchange alters foliar quality of host trees and performance oftwo outbreak insect species. Oecologia 1–14.
Craine, J. M., et al. 2009. Global patterns of foliar nitrogenisotopes and their relationships with climate, mycorrhizalfungi, foliar nutrient concentrations, and nitrogen availabil-ity. New Phytologist 183:980–992.
Curran, P. J. 1989. Remote-sensing of foliar chemistry. RemoteSensing of Environment 30:271–278.
Curran, P. J., J. L. Dungan, and D. L. Peterson. 2001.Estimating the foliar biochemical concentration of leaveswith reflectance spectrometry: testing the Kokaly and Clarkmethodologies. Remote Sensing of Environment 76:349–359.
Curran, P. J., J. A. Kupiec, and G. M. Smith. 1997. Remotesensing the biochemical composition of a slash pine canopy.IEEE Transactions on Geoscience and Remote Sensing35:415–420.
Curtis, J. T. 1959. The vegetation of Wisconsin: an ordinationof plant communities. Second edition. University of Wiscon-sin Press, Madison, Wisconsin, USA.
Dahlin, K. M., G. P. Asner, and C. B. Field. 2013.Environmental and community controls on plant canopychemistry in a Mediterranean-type ecosystem. Proceedings ofthe National Academy of Sciences USA 110:6895–6900.
Daly, C., R. P. Neilson, and D. L. Phillips. 1994. A statisticaltopographic model for mapping climatological precipitationover mountainous terrain. Journal of Applied Meteorology33:140–158.
Dawson, T. P., P. J. Curran, and S. E. Plummer. 1998.LIBERTY—modeling the effects of leaf biochemical con-centration on reflectance spectra. Remote Sensing ofEnvironment 65:50–60.
Deel, L. N., B. E. McNeil, P. G. Curtis, S. P. Serbin, A. Singh,K. N. Eshleman, and P. A. Townsend. 2012. Relationship ofa Landsat cumulative disturbance index to canopy nitrogenand forest structure. Remote Sensing of Environment118:40–49.
Desai, A. R., et al. 2008. Influence of vegetation and seasonalforcing on carbon dioxide fluxes across the Upper Midwest,USA: implications for regional scaling. Agricultural andForest Meteorology 148:288–308.
Doughty, C., G. Asner, and R. Martin. 2011. Predictingtropical plant physiology from leaf and canopy spectroscopy.Oecologia 165:289–299.
Drewry, D. T., P. Kumar, S. Long, C. Bernacchi, X. Z. Liang,and M. Sivapalan. 2010. Ecohydrological responses of densecanopies to environmental variability: 1. Interplay betweenvertical structure and photosynthetic pathway. Journal ofGeophysical Research—Biogeosciences 115.
//TITAN/Production/e/ecap/live_jobs/ecap-24-07/ecap-24-07-08/layouts/ecap-24-07-08.3d ! Monday, 22 September 2014 ! 1:43 pm ! Allen Press, Inc. ! Page 1666 MS 13-2110
SHAWN P. SERBIN ET AL.1666 Ecological ApplicationsVol. 24, No. 7

Ecarnot, M., F. Compan, and P. Roumet. 2013. Assessing leafnitrogen content and leaf mass per unit area of wheat in thefield throughout plant cycle with a portable spectrometer.Field Crops Research 140:44–50.
Elmore, A. J., and J. M. Craine. 2011. Spectroscopic analysis ofcanopy nitrogen and nitrogen isotopes in managed pasturesand hay land. IEEE Transactions on Geoscience and RemoteSensing 49:2491–2498.
Elvidge, C. D. 1990. Visible and near-infrared reflectancecharacteristics of dry plant materials. International Journalof Remote Sensing 11:1775–1795.
Evans, J. R. 1989. Photosynthesis and nitrogen relationships inleaves of C3 plants. Oecologia 78:9–19.
Ewers, B. E., D. S. Mackay, J. Tang, P. V. Bolstad, and S.Samanta. 2008. Intercomparison of sugar maple (Acersaccharum Marsh.) stand transpiration responses to environ-mental conditions from the western Great Lakes region of theUnited States. Agricultural and Forest Meteorology 148:231–246.
Fassnacht, K. S., and S. T. Gower. 1999. Comparison of thelitterfall and forest floor organic matter and nitrogendynamics of upland forest ecosystems in north centralWisconsin. Biogeochemistry 45:265–284.
Feilhauer, H., G. P. Asner, R. E. Martin, and S. Schmidtlein.2010. Brightness-normalized partial least squares regressionfor hyperspectral data. Journal of Quantitative Spectroscopyand Radiative Transfer 111:1947–1957.
Feret, J. B., C. Francois, G. P. Asner, A. A. Gitelson, R. E.Martin, L. P. R. Bidel, S. L. Ustin, G. le Maire, and S.Jacquemoud. 2008. PROSPECT-4 and 5: advances in the leafoptical properties model separating photosynthetic pigments.Remote Sensing of Environment 112:3030–3043.
Feret, J. B., C. Francois, A. Gitelson, G. P. Asner, K. M. Barry,C. Panigada, A. D. Richardson, and S. Jacquemoud. 2011.Optimizing spectral indices and chemometric analysis of leafchemical properties using radiative transfer modeling.Remote Sensing of Environment 115:2742–2750.
Field, C., and H. A. Mooney. 1986. The photosynthesis-nitrogen relationship in wild plants. Pages 22–55 in T.Givnish, editor. On the economy of plant form and function.Cambridge University Press, Cambridge, UK.
Foley, S., B. Rivard, G. A. Sanchez-Azofeifa, and J. Calvo.2006. Foliar spectral properties following leaf clipping andimplications for handling techniques. Remote Sensing ofEnvironment 103:265–275.
Foley, W. J., A. Mcllwee, I. Lawler, L. Aragones, A. P.Woolnough, and N. Berding. 1998. Ecological applicationsof near infrared reflectance spectroscopy—a tool for rapid,cost-effective prediction of the composition of plant andanimal tissues and aspects of animal performance. Oecologia116:293–305.
Fortunel, C., et al. 2009. Leaf traits capture the effects of landuse changes and climate on litter decomposability ofgrasslands across Europe. Ecology 90:598–611.
Fourty, T., and F. Baret. 1997. Vegetation water and drymatter contents estimated from top-of-the-atmosphere re-flectance data: a simulation study. Remote Sensing ofEnvironment 61:34–45.
Fourty, T., F. Baret, S. Jacquemoud, G. Schmuck, and J.Verdebout. 1996. Leaf optical properties with explicitdescription of its biochemical composition: direct and inverseproblems. Remote Sensing of Environment 56:104–117.
Frelich, L. E., and C. G. Lorimer. 1991. Natural disturbanceregimes in hemlock hardwood forests of the Upper GreatLakes region. Ecological Monographs 61:145–164.
Frelich, L. E., and P. B. Reich. 1995. Neighborhood effects,disturbance, and succession in forests of the western GreatLakes Region. Ecoscience 2920:148–158.
Ganapol, B. D., L. F. Johnson, P. D. Hammer, C. A. Hlavka,and D. L. Peterson. 1998. LEAFMOD: a new within-leaf
radiative transfer model. Remote Sensing of Environment63:182–193.
Geladi, P., and B. R. Kowalski. 1986. Partial least-squaresregression—a tutorial. Analytica Chimica Acta 185:1–17.
Gillon, D., C. Houssard, and R. Joffre. 1999. Using near-infrared reflectance spectroscopy to predict carbon, nitrogenand phosphorus content in heterogeneous plant material.Oecologia 118:173–182.
Gitelson, A. A., G. P. Keydan, and M. N. Merzlyak. 2006.Three-band model for noninvasive estimation of chlorophyll,carotenoids, and anthocyanin contents in higher plant leaves.Geophysical Research Letters 33: 5.
Green, D. S., J. E. Erickson, and E. L. Kruger. 2003. Foliarmorphology and canopy nitrogen as predictors of light-useefficiency in terrestrial vegetation. Agricultural and ForestMeteorology 115:165–173.
Green, R. O., et al. 1998. Imaging spectroscopy and theairborne visible infrared imaging spectrometer (AVIRIS).Remote Sensing of Environment 65:227–248.
Grossman, Y. L., S. L. Ustin, S. Jacquemoud, E. W. Sander-son, G. Schmuck, and J. Verdebout. 1996. Critique ofstepwise multiple linear regression for the extraction of leafbiochemistry information from leaf reflectance data. RemoteSensing of Environment 56:182–193.
Helliker, B. R., and S. L. Richter. 2008. Subtropical to borealconvergence of tree-leaf temperatures. Nature 454:511–514.
Hobbie, J. E., and E. A. Hobbie. 2006. 15N in symbiotic fungiand plants estimates nitrogen and carbon flux rates in Arctictundra. Ecology 87:816–822.
Jacquemoud, S., and F. Baret. 1990. PROSPECT—a model ofleaf optical properties of spectra. Remote Sensing ofEnvironment 34:75–91.
Kampe, T. U., B. R. Johnson, M. Kuester, and M. Keller. 2010.NEON: the first continental-scale ecological observatorywith airborne remote sensing of vegetation canopy biochem-istry and structure. Journal of Applied Remote Sensing4(043510).
Kattge, J., W. Knorr, T. Raddatz, and C. Wirth. 2009.Quantifying photosynthetic capacity and its relationship toleaf nitrogen content for global-scale terrestrial biospheremodels. Global Change Biology 15:976–991.
Kleinebecker, T., S. R. Schmidt, C. Fritz, A. J. P. Smolders,and N. Holzel. 2009. Prediction of d13C and d15N in planttissues with near-infrared reflectance spectroscopy. NewPhytologist 184:732–739.
Kokaly, R. F., G. P. Asner, S. V. Ollinger, M. E. Martin, andC. A. Wessman. 2009. Characterizing canopy biochemistryfrom imaging spectroscopy and its application to ecosystemstudies. Remote Sensing of Environment 113:S78–S91.
Kokaly, R. F., and R. N. Clark. 1999. Spectroscopicdetermination of leaf biochemistry using band-depth analysisof absorption features and stepwise multiple linear regres-sion. Remote Sensing of Environment 67: 267–287.
le Maire, G., C. Francois, K. Soudani, D. Berveiller, J. Y.Pontailler, N. Breda, H. Genet, H. Davi, and E. Dufrene.2008. Calibration and validation of hyperspectral indices forthe estimation of broadleaved forest leaf chlorophyll content,leaf mass per area, leaf area index and leaf canopy biomass.Remote Sensing of Environment 112:3846–3864.
LeBauer, D. S., and K. K. Treseder. 2008. Nitrogen limitationof net primary productivity in terrestrial ecosystems isglobally distributed. Ecology 89:371–379.
LeBauer, D. S., D. Wang, K. T. Richter, C. C. Davidson, andM. C. Dietze. 2013. Facilitating feedbacks between fieldmeasurements and ecosystem models. Ecological Mono-graphs 83:133–154.
Martin, M. E., and J. D. Aber. 1994. Analyses of forest foliageIII: determining nitrogen, lignin, and cellulose in fresh leavesusing near infrared reflectance data. Journal of Near InfraredSpectroscopy 2:25–32.
//TITAN/Production/e/ecap/live_jobs/ecap-24-07/ecap-24-07-08/layouts/ecap-24-07-08.3d ! Monday, 22 September 2014 ! 1:43 pm ! Allen Press, Inc. ! Page 1667 MS 13-2110
October 2014 1667SPECTROSCOPY AND PLANT TRAITS

Martin, M. E., and J. D. Aber. 1997. High spectral resolutionremote sensing of forest canopy lignin, nitrogen, andecosystem processes. Ecological Applications 7:431–443.
Martin, M. E., L. C. Plourde, S. V. Ollinger, M. L. Smith, andB. E. McNeil. 2008. A generalizable method for remotesensing of canopy nitrogen across a wide range of forestecosystems. Remote Sensing of Environment 112:3511–3519.
Matson, P., L. Johnson, C. Billow, J. Miller, and R. L. Pu.1994. Seasonal patterns and remote spectral estimation ofcanopy chemistry across the Oregon transect. EcologicalApplications 4:280–298.
McLellan, T. M., J. D. Aber, M. E. Martin, J. M. Melillo, andK. J. Nadelhoffer. 1991a. Determination of nitrogen, lignin,and cellulose content of decomposition leaf material by near-infrared reflectance spectroscopy. Canadian Journal ofForest Research 21:1684–1688.
McLellan, T. M., M. E. Martin, J. D. Aber, J. M. Melillo, K. J.Nadelhoffer, and B. Dewey. 1991b. Comparison of wetchemistry and near-infrared reflectance measurements ofcarbon-fraction chemistry and nitrogen concentration offorest foliage. Canadian Journal of Forest Research 21:1689–1693.
McNeil, B. E., J. M. Read, T. J. Sullivan, T. C. McDonnell, I. J.Fernandez, and C. T. Driscoll. 2008. The spatial pattern ofnitrogen cycling in the Adirondack Park, New York.Ecological Applications 18:438–452.
Melillo, J. M., J. D. Aber, and J. F. Muratore. 1982. Nitrogenand lignin control of hardwood leaf litter decompositiondynamics. Ecology 63:621–626.
Mevik, B. H., and R. Wehrens. 2007. The pls package: principalcomponent and partial least squares regression in R. Journalof Statistical Software 18:1–24.
Mitchell, M. J., D. J. Raynal, and C. T. Driscoll. 1996.Biogeochemistry of a forested watershed in the centralAdirondack Mountains: temporal changes and mass balanc-es. Water, Air and Soil Pollution 88:355–369.
Niinemets, U. 2007. Photosynthesis and resource distributionthrough plant canopies. Plant, Cell and Environment30:1052–1071.
Ollinger, S. V. 2011. Sources of variability in canopy reflectanceand the convergent properties of plants. New Phytologist189:375–394.
Ollinger, S. V., and M. L. Smith. 2005. Net primary productionand canopy nitrogen in a temperate forest landscape: ananalysis using imaging spectroscopy, modeling and field data.Ecosystems 8:760–778.
Ollinger, S. V., M. L. Smith, M. E. Martin, R. A. Hallett, C. L.Goodale, and J. D. Aber. 2002. Regional variation in foliarchemistry and N cycling among forests of diverse history andcomposition. Ecology 83:339–355.
Ourcival, J. M., R. Joffre, and S. Rambal. 1999. Exploring therelationships between reflectance and anatomical and bio-chemical properties in Quercus ilex leaves. New Phytologist143:351–364.
Pastor, J., J. D. Aber, C. A. McClaugherty, and J. M. Melillo.1984. Aboveground production and N and P cycling along anitrogen mineralization gradient on Blackhawk Island,Wisconsin. Ecology 65:256–268.
Peterson, D. L., J. D. Aber, P. A. Matson, D. H. Card, N.Swanberg, C. Wessman, and M. Spanner. 1988. Remotesensing of forest canopy and leaf biochemical contents.Remote Sensing of Environment 24:85–108.
Petisco, C., B. Garcia-Criado, S. Mediavilla, B. R. V. deAldana, I. Zabalgogeazcoa, and A. Garcia-Ciudad. 2006.Near-infrared reflectance spectroscopy as a fast and non-destructive tool to predict foliar organic constituents ofseveral woody species. Analytical and Bioanalytical Chem-istry 386:1823–1833.
Poorter, H., U. Niinemets, L. Poorter, I. J. Wright, and R.Villar. 2009. Causes and consequences of variation in leaf
mass per area (LMA): a meta-analysis. New Phytologist182:565–588.
R Development Core Team. 2013. R: a language andenvironment for statistical computing. R Foundation forStatistical Computing, Vienna, Austria. www.r-project.org
Richardson, A. D., G. P. Berlyn, and T. G. Gregoire. 2001.Spectral reflectance of Picea rubens and Abies balsameaneedles along an elevational gradient, Mt. Moosilauke, NewHampshire, USA. American Journal of Botany 88:667–676.
Richardson, A. D., and J. B. Reeves. 2005. Quantitativereflectance spectroscopy as an alternative to traditional wetlab analysis of foliar chemistry: near-infrared and mid-infrared calibrations compared. Canadian Journal of ForestResearch 35:1122–1130.
Robinson, D. 2001. d15N as an integrator of the nitrogen cycle.Trends in Ecology and Evolution 16:153–162.
Santiago, L. S. 2007. Extending the leaf economics spectrum todecomposition: evidence from a tropical forest. Ecology88:1126–1131.
Schulte, L. A., D. J. Mladenoff, S. N. Burrows, T. A. Sickley,and E. V. Nordheim. 2005. Spatial controls of pre-Euro-American wind and fire disturbance in northern Wisconsin(USA) forest landscapes. Ecosystems 8:73–94.
Serbin, S. P., D. N. Dillaway, E. L. Kruger, and P. A.Townsend. 2012. Leaf optical properties reflect variation inphotosynthetic metabolism and its sensitivity to temperature.Journal of Experimental Botany 63:489–502.
Shipley, B., D. Vile, E. Garnier, I. J. Wright, and H. Poorter.2005. Functional linkages between leaf traits and netphotosynthetic rate: reconciling empirical and mechanisticmodels. Functional Ecology 19:602–615.
Smith, M. L., M. E. Martin, L. Plourde, and S. V. Ollinger.2003. Analysis of hyperspectral data for estimation oftemperate forest canopy nitrogen concentration: comparisonbetween an airborne (AVIRIS) and a spaceborne (Hyperion)sensor. IEEE Transactions on Geoscience and RemoteSensing 41:1332–1337.
Smith, M. L., S. V. Ollinger, M. E. Martin, J. D. Aber, R. A.Hallett, and C. L. Goodale. 2002. Direct estimation ofaboveground forest productivity through hyperspectralremote sensing of canopy nitrogen. Ecological Applications12:1286–1302.
Townsend, P. A., J. R. Foster, R. A. Chastain, and W. S.Currie. 2003. Application of imaging spectroscopy tomapping canopy nitrogen in the forests of the centralAppalachian Mountains using Hyperion and AVIRIS. IEEETransactions on Geoscience and Remote Sensing 41:1347–1354.
Townsend, P. A., S. P. Serbin, E. L. Kruger, and J. A. Gamon.2013. Disentangling the contribution of biological andphysical properties of leaves and canopies in imagingspectroscopy data. Proceedings of the National Academy ofSciences USA 110:E1074.
Ustin, S. L., A. A. Gitelson, S. Jacquemoud, M. Schaepman,G. P. Asner, J. A. Gamon, and P. Zarco-Tejada. 2009.Retrieval of foliar information about plant pigment systemsfrom high resolution spectroscopy. Remote Sensing ofEnvironment 113:S67–S77.
Wang, L. X., G. S. Okin, J. Wang, H. Epstein, and S. A.Macko. 2007. Predicting leaf and canopy 15N compositionsfrom reflectance spectra. Geophysical Research Letters34(2):L02401.
Wessman, C. A., J. D. Aber, D. L. Peterson, and J. M. Melillo.1988a. Foliar analysis using near-infrared reflectance spec-troscopy. Canadian Journal of Forest Research 18:6–11.
Wessman, C. A., J. D. Aber, D. L. Peterson, and J. M. Melillo.1988b. Remote-sensing of canopy chemistry and nitrogencycling in temperate forest ecosystems. Nature 335:154–156.
White, M. K., S. T. Gower, and D. E. Ahl. 2005. Life cycleinventories of roundwood production in northern Wisconsin:
//TITAN/Production/e/ecap/live_jobs/ecap-24-07/ecap-24-07-08/layouts/ecap-24-07-08.3d ! Monday, 22 September 2014 ! 1:43 pm ! Allen Press, Inc. ! Page 1668 MS 13-2110
SHAWN P. SERBIN ET AL.1668 Ecological ApplicationsVol. 24, No. 7

inputs into an industrial forest carbon budget. ForestEcology and Management 219:13–28.
Wold, S. 1994. PLS for multivariate linear modeling. Pages195–218 in H. van de Waterbeemd, editor. Chemometricmethods in molecular design, methods and principles inmedicinal chemistry. Verlag-Chemie, Weinheim, Germany.
Wold, S., A. Ruhe, H. Wold, and W. J. Dunn. 1984. Thecollinearity problem in linear regression. The partial least-squares (PLS) regression approach to generalized inverses.Siam Journal on Scientific and Statistical Computing5(3):735–743.
Wold, S., M. Sjostrom, and L. Eriksson. 2001. PLS-regression:a basic tool of chemometrics. Chemometrics and IntelligentLaboratory Systems 58:109–130.
Wolter, P. T., P. A. Townsend, B. R. Sturtevant, and C. C.Kingdon. 2008. Remote sensing of the distribution andabundance of host species for spruce budworm in northernMinnesota and Ontario. Remote Sensing of Environment112:3971–3982.
Wright, I. J., et al. 2004. The worldwide leaf economicsspectrum. Nature 428:821–827.
SUPPLEMENTAL MATERIAL
Appendix A
List of tree species and their estimated functional trait values (Ecological Archives A024-198-A1).
Appendix B
Analysis of the partial least-squares regression (PLSR) model residuals (Ecological Archives A024-198-A2).
Supplement 1
The resulting PLSR model coefficients (and their uncertainties) for predicting foliar traits using leaf-level dried and groundspectral reflectance data (Ecological Archives A024-198-A3).
Supplement 2
Simplified R script file illustrating the calibration of the dry spectra PLSR models and associated uncertainty analysis (EcologicalArchives A024-198-A4).
//TITAN/Production/e/ecap/live_jobs/ecap-24-07/ecap-24-07-08/layouts/ecap-24-07-08.3d ! Monday, 22 September 2014 ! 1:43 pm ! Allen Press, Inc. ! Page 1669 MS 13-2110
October 2014 1669SPECTROSCOPY AND PLANT TRAITS