Special Report on the Chilean Economic Outlook
127
FILE COPY ReportNo. 551 -CH Special Report on the Chilean Economic Outlook (in Three Volumes) ' VolumeIll: Statistical Appendix j. -d October 18, 1974 Latin America and the Caribbean Not for Public Use Document of the International Bank for Reconstructionand Development International Development Association This reportwas prepared for official useonly by the Bank Group. It maynot be published, quoted or cited without Bank Group authorization. TheBank Group does not accept responsibility for the accuracy or completeness of the report. Public Disclosure Authorized Public Disclosure Authorized Public Disclosure Authorized Public Disclosure Authorized Public Disclosure Authorized Public Disclosure Authorized Public Disclosure Authorized Public Disclosure Authorized
Transcript of Special Report on the Chilean Economic Outlook

FILE COPYReport No. 551 -CH
Special Report on theChilean Economic Outlook(in Three Volumes) '
Volume Ill: Statistical Appendix j. -dOctober 18, 1974
Latin America and the Caribbean
Not for Public Use
Document of the International Bank for Reconstruction and DevelopmentInternational Development Association
This report was prepared for official use only by the Bank Group. It may not be published,quoted or cited without Bank Group authorization. The Bank Group does not accept responsibilityfor the accuracy or completeness of the report.
Pub
lic D
iscl
osur
e A
utho
rized
Pub
lic D
iscl
osur
e A
utho
rized
Pub
lic D
iscl
osur
e A
utho
rized
Pub
lic D
iscl
osur
e A
utho
rized
Pub
lic D
iscl
osur
e A
utho
rized
Pub
lic D
iscl
osur
e A
utho
rized
Pub
lic D
iscl
osur
e A
utho
rized
Pub
lic D
iscl
osur
e A
utho
rized

CURRENCY EQUIVALENTS
The exchange rate is being adjusted at short intervals in line with domesticand international inflation. Unless otherwise specified the following rateshave been used in this report (annual averages):
Year Escudos per US dollar
1968 6.801969 9.001970 11.751971 12.211972 18.101973 88.751974 750.00 j
E[SCAL YEAR
January 1 - December 31
j Mission estimate.

STATISTICAL APPENDIX
I. HUMAN RESOURCES1.1: Estimated and Projected Population of Chile,
1950-19851.2: Selected Data on Social Welfare Agencies, 1965-1973
II. NATIONAL ACCOUNTS2.1: Gross Domestic Product, 1965-19742.2: Gross Domestic Product, Employment and Productivity
III. BALANCE OF PAYNENTS3.1: Balance of Payments Summary 1965-19733.2: Imports of Goods and Non-Factor Services, 1965-19743.3: Composition of Exports, 1964-19733.4: Net Foreign Reserves, 1964-19733.5: Long-Term Liabilities Included by Central Bank in Net
Foreign Reserve Position, 1964-19733.6: Import Registrations, 1969-19743.7: Import Projection, 1974-19803.8: Actual and Projected Exports, 1972-19803.9: Copper Exports, 1973-19803.10: Service Payments on External Debt, 1971-19743.11: Real Exchange Rate Trends, 1970-1974
IV. EXTERNAL PUBLIC DEBT4.1: External Public Debt as of December 31, 1973 (5 pages)4.2: External Public Debt as of December 31, 1973 (42 pages)4.3: Rescheduled vs. Not Rescheduled Debt Service, 1974-804.4: Impact of Possible Debt Relief4.5: The Impact of Repayments of Debt Relief on Chile's
Debt Service Obligations 1975-80
V. PUBLIC FINANCE5.1: Consolidated Public Sector, 1968-19705.2: Estimated Consolidated Public Sector, 1971 and 19725.3: Consolidated Estimated Public Sector Accounts, 19735.4: Public Investments by Sectors and Institutions, 1968-725.5: Current Operations of Major Public Transport Agencies,
1968-705.6: Central Government Operations, 1965-19745.7: Central Government Revenues, 1965-19745.8: Government Escudo Current Revenues, 1968-19735.9: Monetary Adjustment Indices for Some Major Taxes,
1967-19745.10: Central Government Expenditures, 1965-19735.11: Current Transfers and Subsidy Payments of Central
Government, 1965-19745:12: Government Capital Transfers to Decentralized
Agencies, 1968-1974

VI. BANKING6.1: Summary Accounts of the Banking System6.2: Summary Accounts of the Central Bank6.3: Summary Accounts of the Banco del Estado6.4: Summary Accounts of the Commercial Banks6.5: Gross Bank Credit Outstanding to Selected
Public Entities, 1970, 1971 and 1973
VII. AGRICULTURE7.1: Agricultural and Livestock Production, 1970-19757.2: Area Planted and Yields of Main Crops, 1970-1975
VIII. OTHER PRODUCTIVE SECTORS8.1: Indices of Volume of Industrial Production by
Selected Sub-Sectors 1969-19738.2: Steel and Petroleum Products Production, 1968-19738.3: Automotive Production, 1968-19748.4: Fisheries Statistics, 1962-1972
IX. PRICES AND WAGES9.1: Price Indices, 1969-19749.2: Official Cost of Living Index - Greater Santiago9.3: National Wholesale Price Index9.4: Wage and Salary Indices, 1969-19739.5: Wage and Salary Indices Adjusted for Family Benefits,
1969-19739.6: Wage Index, Including Family Benefits, Deflated by
Official Consumer Price Index, 1969-19739.7: Wage Index, Including Family Benefits, Deflated by
Mission Price Level Estimate, 1969-19739.8: Selected Average Price or Tariffs Irndex of Public
Utilities, 1968-19749.9: Monthly Sueldo Vital, 1961-1974

I. HUMAN RESOURCES


Table 1.1: ESTIMATED AND PROJECTED POPULATION OF CHILE, 1950-1985
Population Change since('000) previous year
(%)
1950 6,o62 2.4 (1950-1960, annual average)
1960 (Census) 7,6831961 7,888 2.61962 8,093 2.71963 8.315 2.61964 8,532 2.61965 8,752 2.61966 8,962 2.41967 9,155 2.11968 9,348 2.11969 9,535 2.0
1970 (Census) 9,717 1.91971 9,890 1.81972 10,067 1.81973 10,239 1.71974 10,408 1.71975 10,585 1.71976 10,740 1.51977 10,915 1.61978 11,096 1.71979 11,285 1.7
1980 11,498 1.9
1985 12nt N a 1.9
Source: Instituto Nacional de Estadisticas; ODEPLAN; CELADE.

Table 1.2 : SELECTED DATA ON SOCIAL WELFARE AGENCIES, 1965-1974
Provisional___________________ 1965 1966 1967 1968 1969 1970 1971 1972 1973 1974
Number of members:
Private Sector: 1,666,054 1,716,191 1,765,373 1,732,404 1,775,781 1,822,479 1,874,055 1,919,897 1,989,292 -White Collar 268,969 281,312 291,018 301,320 311,038 321,079 333,675 351,854 391,597 -Blue Collar 1,397,115 1,434,879 1,474,055 1,431,084 1,464,743 1,501,400 1,540,380 1,568,043 1,597,734 -
Public Sector: 297,977 316,728 331,090 346,429 367,466 394,826 409,020 407,511 408,267 -White Collar 282,799 300,717 316,665 333,015 351,954 379,392 393,532 389,289 393,033 -Blue Collar 15,178 16,011 14,425 13,414 15,512 15,434 15,488 18,222 15,234 -
Total membership 1,964,031 2,032,919 2,096,163 2,078,833 2,143,247 2,217,305 2,283,075 2,327,408 2,397,559 -(Percent of work force) (70.6) (71.5) (72.6) (71.6) (72.4) (73.6) (73.8) (73.3) (73.5) -
Total Population Coverage 6,037,400 6,295,600 6,447,800 6,469,900 6,775,300 6,999,100 7,273,300 7,378.054 7,486,104 -(Percent of population) (69.0) (70.3) (70.4) (69.2) (71.1) (72.0) (73.5) (73.3) (73.1) -
Family Allowances (1969=100.0)Social Security Service 31.4 43.7 57.0 71.3 100.0 142.5 285.0 493.3 1,342.8 12,722.2EMPART 32.4 41.5 53.1 66.1 100.0 129.6 207.3 372.6 874.7 4,945.8CANAEMPU 40.5 54.1 64.9 77.8 100.0 183.8 275.7 422.3 1,114.9 10,315.3
Note: The Social Security Service is the largest Social Insurance Agency, and its members are all blue collar workers in the private sector;EMPART's members are almost all private sector white-collar workers; CANAEMPU's members are almost all public sector white-collarworkers and military personnel. The 1974 family allowance includes a unified EO 1,800 per family as well as 11 months of EO 2,200 forall families with incomes below E° 40,000 monthly. The latter sum was payable after February 1, 1974.
Source: Superintendency of Social Security and mission estimates for military members during 1972-73.

II. NATICNAL ACCOUNTS


Table 2.1: GROSS OMESTIC PRODUCT. i965-1974(millions of 1965 and current Escudos)
Estimated Pro.iected 171965 1966 1967 1968 1969 1970 1971 1972 1973 197.A 1974B
GDP at market prices(1965 prices) 17,956 19,221 19,670 20,241 20,915 21,691 23,498 23,827 22,397 24,637 24,637
Real Growth Rate(percent) 7.0 2.3 2.9 3.3 3.7 8.3 1.4 -6.o 10.0 10.0
GDP at market prices(nominal prices) 17,956 25,o43 32,881 44,283 64,551 93,663 149,597 348,435 1,716,244 6,120,469 10,711,765
GDP deflator (percent) 30-3 28.3 30.9 41.1 39.9 47.4 129.7 424.0 224.2 467.4
1/ 1974A assumes 150 percent inflation from December to December; 1974B assumes 592.6 percent inflation.
Source: ODEPLAN 1965-1970 and 1971 in real terms; 1972 real growth rate from U. of Chile;GDP deflators for 1971-1974 and real growth for l972-1974 based on mission estimates.

Table 2.2: GROSS DOMESTIC PRODUCT, EMPLAD4ENT AND PRODUCTIVITY(Millions of constant 1965 E°; employment in '000; productivity index, 1965=100)
1965 1966 1967 1968 1969 1970 1971
TOTALGDP at factor cost 17,314 18,557 18,997 19,562 20,227 20,990 22,813 23,187Eaployment 2,605 2,670 2,752 2,759 2,783 2,825 2,976 3,078Productivity 100 105 104 107 109 112 115 113
AgricultureValue added 1,784 1,929 2,063 2,114 1,919 2,069 2,175 2,097Enployment 728 734 759 716 700 655 650 645Productivity 100 107 111 121 112 129 136 133
MiningValue added 1,771 1,928 1,944 1,980 2,230 2,252 2,290 2,141Employment 93 94 94 95 98 99 107 112Productivity 100 109 109 111 120 120 112 101
IndustryValue added 4,567 4,959 5,100 5,225 5,380 5,451 6,155 6,346Employment 507 528 535 545 551 563 600 636Productivity 100 104 106 106 108 107 114 111
ConstructionValue added 1,001 961 924 929 1,010 1,037 1,136 1,016Daployment 183 186 169 169 172 178 199 205Productivity 100 94 100 101 107 107 104 91
Kmectricity, Ges, Waterand Sanitation ServicesValue added 289 307 357 330 333 346 397 - 430Employment 13 12 12 12 12 12 13 17Productivity 100 112 130 121 122 127 135 107
Transport and TelecommunieationsValue added 829 851 854 897 960 998 1,033 1,051Employment 148 149 156 162 167 176 189 198Productivity 100 102 98 99 102 101 101 95
CommerceValue added 3,749 4,095 4,100 4,283 4,432 4,666 5,027 5,278Employment 281 294 318 337 354 386 403 414Productivity 100 105 97 96 94 91 94 96
Banking and Real EstateValue added 410 470 554 601 782 912 1,049 1,091Employment 23 24 27 27 27 28 29 29Productivity 100 110 114 122 159 182 202 208
Public Administration (incl. Defense)Value added 916 965 994 998 1,008 1,024 1,074 1,131Employment 139 143 142 147 148 155 160 166Productivity .
ServicesValue added 1,998 2,092 2,107 2,205 2,173 2,235 2,482 2,606Employment 490 506 540 552 554 574 625 656Productivity 100 102 96 98 96 95 97 97
Source: ODEPLANT
Note: Differs from TRble 2.1 for 1971-73 as ODEPLAN and mission estimates of GDP differ.

III. BALANCE OF PAYMENTS


Table 3.1: BALANCE OF PAYKENTS SUMMARY 1965-i973($ millions)
1965 1966 1967 1968 1969 1970 1971 1972 1973
1. Exports fob 684 866 873 911 1 173 1 112 985 858 1a. Copper, primary 929 59 ; :92 o 690 658 1,0
b. Other 255 267 222 227 246 272 295 200 245
2. Imports cif 616 775 769 857 927 1,001 1,085 1,285 1,608
3. Trade balance 68 91 104 5h 245 lll -100 -427 -285
4. Non-factor services 7 13 - 9 - -27 -26 1 21 -36
Eyports 100 117 T2; 3 1 3 i35 -T17 IT 120Imports 93 104 13h 149 162 182 146 123 156
5. Resource gap (- inflow) 75 104 95 41 218 85 -99 -406 -321
6. Net factor payments -138 -185 -213 -215 -229 -189 -121 -95 -125Interest on public medium andlong-term debt -28 -34 -40 -48 -50 -71 -81 -93 -123
Direct investment income -100 -127 -137 -166 -135 -148 -72 - 2 - 2Other -10 -24 -36 - 1 -44 30 32 ... ...
7. Current account balance -43 -81 -118 -174 -11 -104 -210 -501 -446
8. Donations 8 7 7 12 23 16 21 12 8
9. Private capital, net 37 -17 38 h2 47 .. .. .. 33
10. Public medium and long-term loans 133 100 20 175 266 368 31 9 -117a. Disbursements 200 169 Y29 333 -3 30 22 7 257 3b. Amortization 67 69 86 158 188 162 195 2h8 438
11. Errorsand omissions -49 71 -160 38 -153 -191 -200 -70 -65
12. Allocation of SDRs - - - - - 21 17 18 -
13. TOTAL 86 80 -30 93 172 110 -341 -532 -587
14. Debt Relief - - - - - - 4O 213 356
15. Reserve movements (- increase) -86 -80 30 -93 -172 -110 301 319 231(IBRD definition)
Source: Central Bank of Chile

Table 3.2 CHILE - IMPORTS OF GOODS AND NON-FACTOR SERVICES, 1965-1974
1965 1966 1967 1968 1969 1970 1971 1972P 1973P 1974-1
($ million)1. Imports CIF 616 775 769 857 927 1,001 1,085 i,60 2 300
1.1 Food 140 162 168 166 166 165 260 405 5951.2 Other consumer goods 45 52 57 80 83 96 103 76 64 70
1.3 Petroleum 17 29 29 24 36 29 57 65 70 3851.4 Other intermediate goods 254 310 288 295 398 416 414 515 594 6491.5 Capital goods 160 222 227 292 244 295 251 224 285 550
2. Imports of non-factor services 93 104 134 149 162 182 146 123 156 170
3. Total imports of goods and non-factor services 709 897 903 1,006 1,089 1,183 1,231 1,408 1,764 2,L90
(Percent)
I. Imports CIF 100 100 100 100 100 100 100 100 100 1001.1 Food 23 21 22 19 18 17 24 32 37 281.2 Other consumer goods 7 7 7 9 9 10 10 6 4 31.3 Petroleum 3 4 4 3 4 3 5 5 4 171.4 Other intermediate goods 41 40 37 35 43 41 38 40 37 281.5 Capital goods 26 29 30 34 26 29 23 17 18 24
II. Total imports of goods and non-factor services 100 100 100 100 100 100 100 100 100 100of which:1. Imports CIF 87 88 85 85 85 85 88 91 91 932. Imports of non-factor services 13 12 15 15 15 15 12 9 9 7
1/ The latest (May 1974) Chilean estimate reflects higher petroleum prices and lower agricultural prices for 1974, than here projected; it only marginallyaffects the total import hill, however.
Source: Central Bank of Chile and mission estimates.

Table 3.3 : CHILE - COMPOSITION OF EXPORTS, 1964-1973
1964 1965 1.966 1967 1968 1969 1970 1971 1972 1973
($ millions)Total exports f.o.b. 592 684 866 873 911 1,172 1,112 985 858 1,323
Mining products 482 558 729 766 795 1,041 950 811 734 1,188Copper 363 429 599 651 684 926 840 690 658 1,088Large mining companies (285) (307) (479) (521) (537) (720) (661) (565) (535) (896)Medium and small mines (78) (122) (120) (130) (148) (206) (178) (125) (123) (192)
Nitrates and iodine 34 37 38 31 22 26 21 35 24 30Iron ore 68 76 76 66 70 71 67 68 45 56Molybdenite 14 14 12 13 10 12 16 16 6 10Other 3 2 4 5 9 6 7 2 1 4
Agricultural and fishery products 27 23 21 23 25 27 33 29 19 24Crops 17 15 12 12 16 15 22 23 16 20Livestock products 9 7 8 7 8 10 8 4 1 1Forestry products 1 1 1 1 1 1 1 1 2 2Fishery products 1 1 1 3 1 1 1 1 1 1
Industrial products 83 103 116 84 91 104 129 143 105 111Manufactured copper - 1 1 1 1 1 1 3 3 28Semi-manufactured copper 36 55 36 8 9 7 14 13 17 28Paper and cellulose 7 10 17 23 24 28 32 32 24 30Chemical products and petroleum derivatives 5 4 5 4 5 8 11 12 8 7Fishmeal 16 8 26 13 18 18 15 28 12 12Canned and frozen fish 3 4 6 6 7 6 9 11 7 7Other manufactured products 16 21 25 29 27 36 47 44 34 27
(Percent)
Total exports 100 100 100 100 100 100 100 100 100 100Copper 61 63 69 75. 75 79 76 70 77 82Other mining products 20 19 16 12 12 10 9 13 9 8Agricultural and fishery products 5 3 2 3 3 2 3 3 2 2Industrial products 14 15 13 10 10 9 12 14 12 8
1/ Exports of semi-finished copper in 1964-66 largely represent export of primary copper by fabricators circumventing price controls in order to takeadvantage of the differential between "producers' prices" and higher LME prices.
Source: Central Bank of Chile and mission estimates.

Table 3.41 NET FOREIGN RESERVES, 1964-1973
($ million)
Year End Position 1973
1964 1965 1966 1967 1968 1969 1970 1971 1972 1973 Sept.
I. - Central Pank (net) 32. 9 37.4 77.2 45.2 125.2 285.0 393. 5 157.6 -)>.. -1oJ.1 -1o4.7A. A-sets 13 T3!TT T9-7T 370 24J f38-1.0 r026 v 11g7 356.2
1.- G^ld 43.2 43.8 415.2 45.0 46.3 47.4 46.7 51.0 51.5 58.1 57.52.- IMT Subscription 25.0 25.0 25.0 25. 0 31.3 31.3 39. 5 42.9 42.9 47.6 47.6
3.- IMF Special DrawingRights - - -- -- -- -- -- 21.8 41.6 2.2 0.4 1. 0
4._ Foreien Exchange 45.5 93.6 126.0 80.4 160.4 290.5 310.3 120.9 96.7 134.9 37.05.. -IDB and IBRD Bonds -- -- 1. 0 1.0 1.5 5. 5 9.9 7. 5 -- -- --6._ Other -- -- -- 1.6 2.7 6.3 6.8 0.1 1.4 65.0 25.1
B. Liabilities 146.6 125.0 120.0 107.8 117.0 96.0 41.5 106.4 230.2 469.1 332.91._ To IMF 126.0 125.0 110.2 95.0 110.3 88.3 41.0 81.8 128.7 143.0 143.02. -Pay-ent Agreements 4.1 -- 9. 8 3.8 6. 6 7.6 0.1 20. 4 18.2 85.3 13. 13.- Discounted Notes and other 16. 5 _ -- 9.0 0. 1 0. 1 0.4 0.2 8. 3 67.4 34.04. Advances against copper sales __ -- -- -- -- -- -- -- 6.0 11. 3 10. 3>- Other 69.0 162.1 132.5
II. _ Commercial Banks (net) - 74.2 - 58. 5 -18.1 -16. 6 -3. 9 8.6 10.5 - 54.3 -179. 8 _283.3 -226.1A. As sets .= ¶ Z 07 ~ =' :fl __9 ___ 53. U96 -T- -57 3___6
1._ Gold 5. 5 5. 5 4, 7 5. 0 4. 9 42 4.5 4. 3 4. 3 4. 32._ Foreign exchange 15.6 15.2 39.4 38.9 41.6 48.2 56.4 34.6 49.0 63.6 39.3
B. Liabilities 95.3 79.2 62. 2 60. 5 50.4 44.7 50.1 93.4 233.1 351.2 269. 7
III. - NET RESERVES OF THE BANKINGSY STEM (IBRD Definition) - 107.1 _ 21.1 59. 1 28.6 121.3 293.6 4040 103.3 -215.3 44,.41 -jv'.
IV. - Lone-term Liabilities included by
Central Bank in Reserve Position I/ 131.6 16 1.8 125.3 120.1 83.8 73, 6 60. 8 65.1 74.0 Yt-.. 84.
V. TOTAL NET RESERVES(Central Bank Definition) -238.7 - 182. 9 - 66.2 - 91. 5 37. 5 220. 0 343.2 38.2 - 289. 3 - 542.5 - 475.1
Changes in Net Reserve Position ) - 0 decline)Dec. 1972 Dec. 1970
1964 1965 1966 1967 1968 1969 1970 1971 1972 1973 Sep. 1973 -Sep. 19731:- Central Banh(net) 11.4 70.3 39.8 - 32.0 80.0 159.8 108.5 -235.9 -193.1 -127.6 -129.2 _55B.2
A. Assets 11.9 48.7 34.8 - 44.2 89.2 138.8 54.0 -171.0 - 69.3 111.3 _ 26.5 _Z66.8S. Liabilities 0.5 - 21.6 - 5. 0 _ 12.2 9.2 _21. 0 -54. 5 64.9 123. 6 238. 9 102. 7. 291.44
II. Commercial Banks (net) 4.8 15. 7 40.4 1. 5 12.7 12. 5 1.9 - 64.8 -125. S _ 03. 5 _46 .3 _236.6
III.- NET RESERVES OF THE BANICNGSYSTEM IBRD Definition) 16.2 86.0 80.2 - 30.5 92.7 172.3 110.4 -300.7 -31b.0 -231. 1 -,.. - 794.0
Ii.- Long-term liabilities included byCentral Bank in Reserve Position .9.1 30.2 -36.5 -5.4 -36.5 - 10.2 - 12.8 4.3 b.9 22.1 1.O 2..1
V.- TOTAL NET RESERVES (CentralBank Def.) 25.3 55.8 116.7 -05.3 129:0 182.5 113.2 -305.0 _327.5 -Z53.2 -185.6 - 818.3
Note :Liabilities shown do not include arrears in service payments on Chile' a public medium and long- term debt which amounted to$ 325 million at the end of 1973.. These arrears have been included in 1974 debt rescheduling agreement whose ispact is reflectedin IERLD est wrojections
1/ See Table 3.5.
,ource: Central Bank of Chile

Table 3.5: LONG-TERI LIABILITIES DICLUDED BY CENTRAL BANK IN NET FOREIGN RESERVE POSITID-M, 1964 1973($ million)
Seot.1964 1965 1966 1967 1968 1969 1970 1971 1972 1973 1973
Total long-term liabilities includedby Central Bank in Reserve Position 131.6 161.8 125.3 120.1 83.8 73.6 60.8 65.1 74.0 96.1 84.3
a. Eximbank 38.2 37.1 29.1 16.7 12.9 9.6 6.3 3.4 3.4 3.4 3.4
b. Private US banks 10.0 45.0 28.1 22.5 -- 2.3 1.7 2.3
c. AID 18.0 a/ 19.2 a/ - 16.4 1L.1 12.0 11.0 10.7 10.7 10.7 10.7
d. Kreditanstalt and other German banks 48.2 36.6 34.5 24.8 19.6 15.8 13.4 13.0 13.2 1508 15.7
e. Spanish Foreign Exchange Institute 6.7 4.6 2.4 0.3 __ __ __
f. Sercobe Espana - 4.-4 6.4 16.7 19.3 20.5 19.6
g. French Government 2.5 1.9 1.5 1.5 1.2 1.0 1.1
h. Credit Nacional (France) -- 1.6 1.6 2.7 2.6 3.0 3.2
i. Swiss banks 6.8 6.3 5.6 4.9 5.0 4.3 4.4
j. Banco do Brazil -- -- -- -- 0.9 1.1 10
k. Italian banks 9.6 11.0 11.6 10.2 10.3 10.2 10.1
1. Belgian banks -- -- 1.0 1.5 1.5 3.0 3.2
im. East Germany - 7.9 -
n. Spanish banks - 4488
o. Other 17.2 41.1 33.6 3907 11.6 6.4 __ 0.2 3.6 8.7 4.8
a/ US Treasury
Source: Central Bank of Chile

Table 3.6 IMPORT REGISTRATIONS, 1969-1974
($ millions)
1969 1970 1971 1972 1973 1973 1974I Quarter I Quarter
1. Consumer Goods 134 161 245 277 238 50 321.1 Primary agricultural products 33 29 35 12 9 - 21.2 Processed agricultural products 28 41 110 191 167 40 111.3 Non-agricultural industrial products 73 91 100 74 61 10 19
a. Pharmaceuticals ... ... (28) (36) (32) (7) (7)b. Tools ... ... (11) (6) (7) (1) (2)c. Other ... ... (62) (32) (22) (3) (10)
2. Capital Goods 292 264 200 312 333 105 672.1 Machinery and equipment 202 200 139 158 176 50 422.2 Transport equipment 87 57 58 144 145 55 252.3 Breeding animals 3 7 3 10 12 - -
3. Intermediate Goods 489 523 720 823 1,100 197 4553.1 Agricultural raw materials 69 101 152 237 304 58 117
a. Food (---) (76) (122) (147) (233) (38) (97)b. Non-food (.) (25) (30) (70) (71) (19) (20)
3.2 Industrial raw materials 40 227 233 267 372 71 129a. Food (16) (25) (44) (98) (137) (37) (19)b. Non-food (24) (202) (188) (169) (235) (34) (110)
3.3 Other intermediates for industry 209 ... 93 90 107 14 293.4 Spare parts 115 115 133 124 155 27 44
a. For machinery and equipment (66) (64) (71) (49) (76) (11) (23)b. For transport equipment (49) (51) (62) (75) (79) (15) (21)
3.5 Fuel and lubricants 56 69 110 101 148 23 1293.6 Parts for automobile assembly .. - 23 23 4 7
TOTAL 917 948 1,166 1,411 1,681 353 554
Note: Due to a change in classification,details for 1968 and 1970 are not fully comparable to those forsubsequent years.
Source: Central Bank of Chile

Table 3.7: IIPORT PROJECTION (1974-1980)
1974 1975 1976 1977 1978 1979 1980
($ million)
IMPORTS (CIF) at 1974 prices
1. Food2! 666 595 568 557 552 4 574Wheat 222 157 139 112 199 8 91Corn and feedgrains 98 73 71 60 54 49 47Sugar 114 116 114 116 116 119 121Beef 51 51 56 61 66 73 78Rice 30 31 32 33 33 34 34Other 151 157 168 174 183 195 204
2. Other Consumer Goods / 70 73 77 81 85 89 93
3. Petroleumn/ 385 459 513 5530
4. Other Intermediate GoodshJ 649 688 729 773 819 868 920
5. Capital Goodsi/ , 550 577 606 637 688 743 802Public sector importsW -3 8 407 44 489 531 573 619Private sector imports2/ 162 170 142 148 157 170 183
TOTAL GOODS 2j320 2,393 2,497 2,601 2,674 2,797 2,897
j Consistent with maximum effort by the Government along the lines examined in Chapter V.Real growth projected at about 5 percent per year.
| Petroleum projections are in line with the discussion in Chapter V.Projected to increase by 6 percent per year.
g/ Projected to increase by 5 percent per year through 1977; at 8 percent per year thereafter.The public import projection meets the requirements of the public investment program(scaled-down alternative II) shown in Chapter VI.
j Private capital goods imports amount to about one-quarter of total capital goods imports overthe 1974-1980 period. The boost in 1975 follows a sharp increase in 1974 (not shown on thistable); thereafter the level drops to its historical trend.
Source: Mission estimate.

o 0440444 400'Co0 CC CO Co CoCo 440 Co CoCo 4.4Co0Co44CoCoC' CoCoOCo 44 '0 CoO' 004000 0440040 Co CCCo CCCoCoNCCoCoCSCo4 40 '0 -t - Co4'04CoCoCo CoCoCo40.C .00 - 40 CoCoCoCo .4Co4Co4Co'0CoCo0 CoCo Co '0404444 '0Co04CoCo Co 0'Co - 4 0 - Co CoCoCoCo Co0...C04044CoCoCo Co CooCo '0'4�0442*�420
44 44 .44
Co CoCo0Co04Co0Co'0Co4-4Co044 CoO 44044 OCoCoCoCoCo 44 Co 40 Oo-Co444 CoCoCoCoCoCo Co CO CoCoCo 'C 4 Co00004Co0CoCoCoCo0 Co CoCo 0CoCo0 CoCoCoCoC044Co '0 4 0 Co Co4Co44.C '0'0C0.COO CO.C 0 40 0.404-C .C4CoCo0C0'04 .44 0 .44 '0'0CoCoCoCo44c00CC40Co Co CoCo - Co�040Co 0444040 40.42444 CoCoCoCoCo 440 4..40Co4CoCo 0
Co.4 .44 .44
Co '004404004.4004404 -4 CooO'0CoCo'0 .4044CoCo -- Co -- OCoCoCoCoCoCoCoCoOCOCoCo COCo Co CoO Co040000Co'04CoCo0 4 CoCo COCoCoO 44440404 Co .4 Co CoCoCo4Co40 -4444CoCo CoCo Co 00 CoCoCoCoCo .CCoCOCoO'004 CoCo Co 0Cc) '0'0CoCo400Co40040Co CoCo 0 4C.'00.40Co Co CoOCoCoCoCoCo 40.42 CoCoOCoCo 440 .40 000 CoflO .44 0
Co CoCo000..4244 0C04Co4 Co Co Co Co CoCoOCoCoCo CoCCo '000 0.4 '0 00 CoCoCoOCo 4-CoCoCo OCoCoC 4.4 Co CoCo '004 044444Co4Co4 4 CoCo Co '0Co0CoCoCoCo'04Co4044 CoCo OCoOCoCo Co44CoCoCo CoO Co Co4 44040 404Co 0444 44 Co CoO Co .440442..4CoCo4004 0 '0 CoCo 0 Co 0.40 4 - Co .. 4Co04444040004 CoCCO
0 Co Co a 4424-Co. Co SCo '0 - 4Co0Co4-'0CoCoCo Co40Co4Co4CoCo44CoCoCo'0 Co00444 CoCo 4 CoCo Co004CoCoCo004Co OCoCo 40 4 r 4 Co Co0400000CoCo'0Co0 4 CoCo Co - Co OCo CoOCooCoCoCoCoCo 4 '0 - 44.4400Co CoCoCoCoOCo 4Co '0 4.42 .42 CoCo Co 40 CoCoCo CoCoCoCoCo 04 ' CO Co 4 4Co404.440 CoOCoOC 4 Co- Co - Co 4'.Co.42 4 000CoCoCo..4CoCo,0.CCo.4.42004Co Co''.'0 00Co 0 - - 44 0 00 44 CoCo 0
0 0
4 CoCo000CoCoCoCo44'0CoCo 40 CoCo4'0.-4.-4'0 CoCooCoCoCo OCo Co Coo �CCo 00040Co440.*0Co CoCo 2 � 004004CoCo444Co4 Co Co4 Co '04 .42400.CCo4Co0 4 '0 CoCoCoCoOC Co 004444 CoOCoCo Co 4444.-) 40 4CoCo4Co4004 '00 CoCo0.-40CoCo.-4CoCoCoCo 4 Co
54 .4
e2 4Co4.4CoCo44Co00 '0 Co Co Co 0Co444Co CoCoCoCoCoCo 44 Co 4Co 0004 Co400Co0440Co0C4 OCo 4 44 0400044Co0 CoCoCo4 Co CoCo 4Co42000Co.CoCo4.40 Co'0CoC�00 Co CoCoCoCoCoCo CoCo Co 0.42 CoCo'0Co0404Cc)Co .C44Co Coo Co 0-4 CoCoCoCCO CoCoCoCoCoCoOCo Co Co4 Co Co 0�0- C 0 Co 0Co04CoCo0Co00Co0.-4.42Co00Co 40 Co00'00 Co4 0 00- - 0 00 OCo 44
42 0�4
Co 4 .42C4Co4000CoCo4CoCoCo Co C Co Co04440 Co044Co00 Co 0 '0 04000440 CoCoCoCoC 4404 Co 40 CoCoOCoCoCoCo 4 4 Co4 - 44 0Co00,42000 Co 0 Co '00,0.444 '004444 4 Co 4 Co4Co0CoCoCo0CoC.CCoCoCoCo .0 0 CoCo CoCoCoOCoOCoCo 0 '0Co Co Co 0 000 Co 0 Co………0 000040 4 - - - 40
Co Co04'0..CoCo 0Co'0Co'0Co Co 44 0000000000000 0 0 0 Co44'0.42CoCo0Co'0Co'04 Co .4 Co 0000000000000 � 2Co 444 .42CoCo000Co44 -40 000000000000 0 0 0 4440044000444 .4 0 0000000000000 0 0 0Co '0 0 000 Co -o 2…'0 0 000 04 0 0 0000000000000000
0 .4 0
C 0 0 0 42 C Co0 0 Co 0 Co 0 Co 0
C Co o 04 C a Co C 0 0Co 0 Co 0 Co C 0 Co 440 404 0 40 404 .004 404 0 0. .004 0404 0 0.0 4. C C 4. 4. 4. C 4. 00- 0 42 Co. 0. 0 0 0. 0 Co 0 0. 0 Co 0
0. 0 0 0. 0 0. 0 0 0. 0 4200 0. 0 0 00 0. 4. 00 0. C 00 00 0. 4. .00 .40 0 '44 0 40 0 00 0 C 0 00 0 C 0 00 00 0 C 0 42
0 0 0000 C 0 0. 0 04.04) .4 0 0 04�440 .4 0 000 0 04.00 44 042 0 OCCo 0 42 0 4 0 OCCo 0 0 0 OCCo 0 0 2 S OC 0 44 042.42 0 04200 C - C 0 OCCo 0 42 0 42 00)0Co 0 42 044 42 0000 0 0 54.Co 0 5000 So 0 44- Co 0-00 00 4 04 5. Co 0000 0420 4 SC 4. Co 2000 0400.4. 0 0040 Co 0 4)4 0 0400 OCo 4 40 4. 0 4044. 00 0 0 4. 0 00444 CO4...Co04 .0440 00 .424 0)2 400 2 0 �2-u0 0 CO 2 � .7%40 Co 0000 0004 44 0 00 Co 24.00 0440 C C 0.42 Co 04.044 40200 0 4.0 0.42 Co 0000 0004 0 0444. 0200400 0.4 Co 4. Co 4. 50 444.0 0 0 4. 0 04. 000044.0 0 Co 4. 00 04. 020044.0 0 Co 442Co0. 0CC00044. 000 0 0 0 00. OC4200044. 504. 0 0 00. 04000040 54.4. 0 0 0.4 00. 000004. 54.4. 0 0 -0 5 54. 0400,0 0 0 o� 0 0 0 54. 04200,000 0 .4 C .42 0 54. .4CO0..S00 0 42 4CC) .2 0 54. 42400,000 0 42 00.4.000.4000.000,0 04 0 04 0 4.000.4.000.00,0.0 00 4. 0 4.. 4.000.Co000.00.0.C 40 0 00 0 .4.000.Co4)S0.00.C,0 00 44 4.
4.0044 4.0004-Coo) 0 00 0�Co 4.000042420 0 42 0.4. 0.40 4.00040420 0 0 54.0.40 4.0004.4200 0 42440 0,04.404040.0.0.40 0 04 0 CoO 0,04.0 �42040.0.0.00 0 0 '0 0 0,0.400040.0.0.00 - 04 04 00 0,04.004040.0.0.00 0 04 004 00.54.5.000 0 0 00. 0�Co000 0 4 40 .40. 04.4-004 0 4 405 0.04.4-000 0 4 0o 400.0420,0..4S.0444 40�00 00. 0042,0420.04Co.C4�4242 So 00. 0.40,0000444400 0420 00.0420,042044CoCo4400 0 4.40. OSOCOOCO- - - 0 0 0 0 000.4040...0 0 0 0 00 042042040...42 0 0 05 004.424000...- 0 00(20040400. 04CoCo4CoCo .0 4�. 04 4.. 042 o.040400. 04CoCoCo4Co 4 4.. 4 04 4.42 44040400. 044CoCoCoCo 4 4.. Co 442 �42 0040400.04444444 4.4 04
4.40 42.40440,04 Co - 0 0 4.044.4404 Co 04 0 - 420 044404 Co - 0 0 >0CoCo44'0Co 04 Co Co 00 *Co - 0. Co Co - 44 Co 4.0) 4 04 42 0 0

Table 3.9 : CHILE - COPPER EXPORTS, 1973-1980
(Medium price alternative)
Actual Projected1970 1971 1972 1973 1974 1975 1976 1977 1978 1979 1980
1. Large Mines1.1 Production ('000 t) 541 571 593 616 730 795 825 855 885 925 9551.2 Total sales ('000 t) 533 587 558 601 730 795 825 855 885 925 9551.3 Domestic sales ('000 t) 21 26 36 31 30 35 40 45 50 55 601.4 Exports ('000 t) 512 561 522 570 700 760 785 810 835 870 8951.5 Exports (million lbs) 1,130 1,237 1,151 1,256 1,543 1,675 1,730 1,785 1,840 1,920 1,9701.6 Copper price LME (i/lb) 64.2 49.1 48.6 80.8 110.0 105.0 95.0 110.0 150.0 170.0 160.01.7 Discount (#/lb) 2.0 1.0 1.4 7.1 6.0 5.0 5.0 5.0 5.0 5.0 5.01.8 Copper price c.i.f. (i/lb) 62.2 48.1 47.2 73.7 104.0 100.0 90.0 105.0 145.0 165.0 155.01.9 Freight, insurance, etc. (i/lb) 3.0 2.4 2.2 2.4 2.3 2.0 2.0 2.0 2.0 2.0 2.01.10 Copper price f.o.b. (4/lb) 59.2 45.7 45.0 71.3 101.7 98.0 88.0 103.0 143.0 163.0 153.01.11 Export value ($ million) 661 565 518 896 1,569 1,642 1,522 1,834 2,631 3,130 3,014
2. Medium and Small Mines 1-2.1 Production = Exports ('000 t) 151 127 125 127 130 150 170 200 215 225 2752.2 Production = Exports (million lbs) 333 281 275 279 285 330 375 440 475 495 6052.3 Copper price LME (4/lb) 64.2 49.1 48.6 80.8 110.0 105.0 95.0 110.0 150.0 170.0 160.02.4 Discount (#/lb) 8.7 6.0 6.0 6.0 6.0 6.0 6.0 6.02.5 Copper price c.i.f. (,/lb) 72.1 104.0 99.0 89.0 104.0 144.0 164.0 154.32.6 Freight, insurance, etc. (#/1b) 3.0 3.0 3.0 3.0 3.0 3.0 3.0 3.02.7 Copper price f.o.b. (#/lb) 58.0 44.4 44.6 69.1 101.0 96.0 86.0 101.0 141.0 161.0 151.02.8 Export value ($ million) 178 125 123 193 288 317 323 444 670 797 914
3. Total Copper Exports3.1 Export volume ('000 t) 663 688 647 697 830 910 955 1,010 1,050 1,095 1,1703.2 Export value ($ million) 840 690 658 1,088 1,857 1,959 1,845 2,278 3,301 3,927 3,9283.3 Average price f.o.b. (#/lb) 57.4 45.5 46.1 70.9 101.6 97.7 87.6 102.4 142.6 162.6 152.53.4 Price index (1972=100) 125 99 100 154 220 212 190 222 309 353 3313.5 Average discount (4/lb) 6.8 3.6 2.5 9.9 8.4 7.3 7.4 7.6 7.4 7.4 7.5
1/ Includes future new mines.
Source: Central Bank of Chile, Corporacion del Cobre and mission estimates.

Table 3.10: CHILE: SERVICE PAYMENTS ON EXTRNAL DEBT - 1971-1974('000 $)
Principal Interest Total Percent
Service Payments 1971
Expected 195,160 81,123 276,284 100
Repaid 161,473 75,295 236,768 86
Net Relief 33,687 5,828 39,515 14
Service Payments 1972
Expected 247,922 93,353 341,275 100
Repaid 93,703 34,255 127,958 37
Net Relief 154,219 59,098 213,317 63
Service Payments 1973
Expected 438,273 122,622 560,895 100
Repaid 163,433 41,948 205,381 3
Net Relief 274,840 80,674 355,514 63
Service Payments 1974 - Projected
Expected 361,584 138,648 500,232 100
To Be Repaid 1/ 152,293 62,929 215,222 1/ 4
Net Relief 209,291 75,719 285,010 57
1/ After debt reschedulingSource: TIRD
Note: External debt means public and publicly guaranteed debt. For 1973 and 1974the impact of the rescheduling agreement of 1974 is shown as producing reliefin those two years respectively; i.e. arrears are not carried over from 1973into 1974.

Table 3.11 REAL EXCBA'ICFh irE TRENDS, 1970-1974
A. ixchange hate B. Price Indicen C. Comparati-e Change D. i.eal Exchange hateBarking Market 1. Official Price Index 2. Misnion Price 3. Us Industrial 4. Differential Prices 1. Exchange 2. Differential Prices 1. Based on Official Price 2. Based on iiission
3elling a. Consuner hi W'holesale Index GOOdC Rate Index Price Index(a) (b) (a) (b) Absolute Index Absolute Index
Montnly Averages
1570 June 11.745 123.9 125.3 123.9 109.8 114.1 112.8 1.1300 1.O) 1.000 11.74 5 1.000 11.745 1.000July 12.030 126.3 127.5 110.0 115.9 1.024 1.01o 11.841 1.008August 12.230 129.5 130.7 11.2 118.', 1.041 1.039 11.771 1.D02
171 Woveuber 12.233 160.4 1556. u14.9 13i.5 1.o41 1.19S 10.226 C.671Dece.-ber 18.53,0 164.6 162.b 206.9 115.3 140.8 179.L 1.246 1.231 1.590 11.856 1.D00 9.201 0.783
1972 January 15.830 170.8 170.1' 115.9 147.4 1.348 1.292 12.252 1.043July 15.830 219.5 212.1 113.1 179.5 1.348 1.574 10.057 o.885A uguo; 25.000 269.1 253.7 118.5 215.1 2.129 1.8376 13.326 1.135
1973 June 25.000 d36 653 1.974 126.9 514 1,55 2.129 4.5s5 13.794 5.549 0.473 1.812 0.154July 29.000 929 729 2.659 126.9 575 2,095 2.469 5.039 18.573 -5.755 0.490 1.561 0.133August 74.000 1,o88 a05 3.160 127.4 632 2,s1j 5.301 5.539 ?2.128 13.3iD 1.137 3.341 0.285.ievtol,lixr 85.000 1,271 91. 3.833 126.1 740 2,992 7.237 6,486 26.525 13.105 1.116 3.205 0.273October 280.000 2,3814 3,221, 3.264 129.6 2,479 2,518 23.840 21.727 22.323 12.887 1.097 12.543 1.0i8
uveo,-ber 290.00D 2,520 4,625 3.363 133.5 3,4i4 2,519 24.69i 30.35. 22.332 9.552 0.813 12.991 1.105Dccember 343.225 2,61.O 4,927 4.028 137.1 3,594 2,938 29.223 31.499 21.041 10.896 0.928 13.178 1.122
1974 January 371.290 3,012 6,723 4,598 140.5 4,755 3,271 31.61 1.1.937 28.998 8.854 0.754 12.814 1.097Fiebruary 415.250 3,750 7,917 142.5 5,556 35.418 43.6.°4 8.548 0.72b
Notes: A. Exchange rate in E°/U3$ - C-ntral BanoB. Price indice-
1. a. O0.7icial consumer price index for Greater Santiago - IRE.1. b. Official wholesale price index - INE.2. iis8ion price indec - See table 9.1.3. US: Industrial goods comnonent o' wholesale orice index - UD Dept. of Commerce, Busineo s Conditions Digest, Various issues, Series No. 55.4. Differential Prices: a. Chilean wholesale price index deflated by US industrial goods index.
b. Mission price index, same deflator as in 4.a.C. Conparative change:
1. Columu A in index frox (June 1970 = 100).2. Colusn B.4 in index from (June 1970 = 100).
D. heal exchange rate:1. Absolute value* A/C.2.2. Index: C.1/C.2.


IV. EXTERNAL PUBLIC DEBT


Tables 4.1 and 4.2: External Public Debt
1. The following tables consolidate Chile's external debt with amaturity of over one year at the end of 1973.
2. Debt service projections include the following:
(a) 1972 debt renegotiation
(b) Estimates of the 1974 debt renegotiation covering1973 and 1974 maturities.
(c) 1974 cancellations of commitments from Comeconcountries and Finland.
3. The 1972 debt renegotiation with the Paris Club included 70%of matlurities dce and not paid from November 1971 to December 1972.Repayment terms averaged, 81½ years including 2 years grace, interestaveraged 6 per cent per anniun. The amounts included were the following:
Count ry Amount
(In thousands of US dollars)
Belgium 2,390Canada 2,403Denmark 2,000France 17,953Germany (Fed. Rep.) 36,410Italy 7,744Japan 2,858Netherlands 1,523Norway 364Spain 13,725Switzerland 4,111United Kingdom 27,884United States 124,100
Total 243,465
Special Agreements
Various Sappliers 9,579US Banks 210,645Adela 13,780
Tbtal 234,004

- 2 -
The special agreement with US banks was of a very short term nature, withalmost 70 percent of the amount to be repaid by 1976. However, Chile wasgiven the option to request at the end of 1974 that the payment falling duein the second half of 1976 be rescheduled until the end of 1979.
4. The 1974 renegotiation with the Paris Club includes 80 percent ofamortization and interest payments falling due between January 1, 1973 andDecember 31, 1974 in respect of (1) guaranteed commercial credits with an originalmaturity of more than one year and (2) loans granted by the government or appro-priate government agencies of the participating creditor countries for which theperiod of repayments is less than 40 years, but excepting loans granted in connec.-tion with previous debt reschedulings. The refinancing loans are to be repaid in14 equal semiannual installments beginning January 1, 1977, and the rates andterms of interest to be paid on these loans will be determined bilaterallybetween Chile and each participating country. To lessen the burden of the pay-ment of the remaining balance of 20 percent, the participating creditorcountries agreed to recommend further that this amount be paid over a three-yearperiod: 5 percent in 1974, 5 percent in 1975, and 10 percent in 1976. Theselatter payments may, at the discretion of each creditor country, be wiolly orpartly allocated to interest payments. The rescheduling arrangements are to beimplemented by bilateral agreements between Chile and each participating country.
Estimates of amounts renegotiated are the following:
Country Amount
(In thousands of US dollars)
1973 197_
Belgium 1,435 2,568Canada 2,246 2,195Dermark 1,645 1,li46France 21,740 27,15hGe inarny 31,767 27,541Ital-y 24.,580 28,072Japan 9,654 10,775Jetherlands 1,903 -lNorway 476 245Spain 14,500 15,715Switzerland 1,933 1,573United Kingdom 25,952 26,527United States 277,170 156,197
Total 415,000 300,000

- 3 -
5. 1974 cancellations of commitments with Comecon countries andFinland were the following:
Country Amount
(In thousands of US dollars)
Bulgaria 34, 148Hungary 15,000Pbland 25,000USSR 115,739
Sub-total 189,887Finlmnd 10,256
Total 200,143
6. Entries of renegotiated amounts are shown in the adjustment/cancellation coluwn.


TABLE 4.1
EXTERNAL PUBLIC DEBTr AS OF DECEMBER 31, 1973
DEWBT RXPAYABLR IN FOREIGN CURRENCY
IN THOUSANDS OF US DOLLARS Page 1
DEBT OUTSUANDIING DECEMBER 31, 1973CREDITOR COUNTRY UNDI S-
TYPE OF CRElDrIOR DISBURSED BURS)ED TOTAL
TOTAL EXTERNAL PUBLIC DEBT 3,081,770 646,631 3,728,401
SUPPLIERS 406,052 14,326 420, 378ARGENTINA 21, 214 - 21,214AUSr RALIA 3,916 _ 3,916AUSrRIA 8 - 8BELGIUM 6,029 29 6,o58BRAZIL 19,379 - 19,379CANADA 2,214 - 2,214COLOMBIA 37 1,350 1,387DENMARK 13, 204 - 13,204FIRANCE 13,729 483 14,212GEFM4ANY (FED. RSP. OF) 32,757 5,614 38,371ITALY 25,788 314 26,102JAPAN 58,204 - 58,204MEXICO 63 - 63NETHERLANDS 7,386 - 7,386NORWAY 3,521 1,405 4,926PERJ 1,187 - 1,187IORTUGAL 28 - 28SPAIN 32,722 5,061 37,783SWEDI)x 9,459 _ 9,459SWITZERLAND 708 - 708UNITED KINGDOM 33,309 70 33,379USA 118,556 - 118,556MULTIPLE LENDERS 2,634 - 2,634
PRIVATE BANKS 428,789 61,619 490,408AUST RIA 2,33 - 2,333BELGIUM 5,050 8,827 13,877BRAZIL 573 - 573FRAN CE 106,372 16,171 122,543GER4ANY (FED. REP. OF) 19,338 4,218 23,556ITALY 45,727 5,173 50,900NET-r. ANTILLES 1,057 162 1,219SPAIN 3,000 - 3,000SWITZERLAND 2,497 - 2,497UNITED KINGDOM 25,007 10,468 35,475USA 217,384 16,600 233,984

EXTERNAL PUBLIC DEBT AS OF DECEMBER 31, 1973
DEi3T REPAYABLE IN FOREIGN CURRENCY
IN THOUSANDS OF US DOLLARS Page 2
DEBT OUTSTANDING DECEMBER 31, 1973CREDITOR COUNTRY UNDIS-
TYPE OF CREDITOR DISBURSED BURSED TOTAL
PJBLICLY ISSUED BONDS 38,522 - 38,522SWITZERLAND 7,924 - 7,924UNITED KINGDOM 11,985 - 11,985USA 18,613 - 18,613
NATIONALIZATION 123,082 751 123,833CANADA 6,626 - 6,626GERMANY (FED. REP OF) 5,098 - 5,098NETHERLANDS 1,360 611 1,971PANIAMA 500 - 500SPAIN 1,039 - 1,039UNITED KINGDOM 1,659 - 1,659USA 103,560 - 103,560MULTIPLE LEIDERS 3,241 140 3,381
OTHER PRIVATE FINANCIAL INST. 61,718 44,155 105,873SPAIN 16,641 32,547 49,188SWITZERLAND 1,043 - 1,043UNITED KINGDOM 27,101 10,657 37,758USA 2,422 - 2,422MULTIPLE LENDERS 14,511 951 15,462
LOANS F1OM INTL. OIGANIZATIONS 193,893 22,361 216,257CORP. ANDINA FOMENTO - 195 195IBRD 128,882 19,970 148,852IDA 22,368 - 22,368IDB 42,643 2,199 44,842
LOA4S FROM GOVERNMENTS 1,628,487 503,416 2,131,903CANADA 36,158 86,966 123,124BELGIUM 3,298 - 3,298BRAZIL 2,874 16,535 19,4o9BULGARIA 8,327 26,952 35,279CANADA 16,003 237 18,373CHINA 6,000 61,000 67,000CZECHOSLOVAKIA 582 32,390 32,972DEIMARK 3,088 - 3,088FIiLAND - 10,256 13,256FRANCE 50,429 4,520 54,949GERMANY (EASr) 7,468 14,189 21,657GERM4ANY (FED. REP. OF) 153,918 8,162 162,080

ErCfERNAL PUBLIC DEBT AS OF DECfflBER 31, 1973
DEBT REPAYABLE IN FOREIGN CURRENCY
IN THOUSANDS OF US DOLLARS Page 3
DEBT OUTSTANDING DECEMBER 31, 1973CREDITOR COUNTRY' UNDIS-
TYPE OF CREDITOR DISBURSED BURSED TOTAL
HUNGARY 423 19,447 19,870ITALY 31,806 - 31,806JAPAN 12,512 9,643 22,155KOREA (NORrH) - 5,000 5,000MEXICO 324 19,655 19,979NETHERLANDS 20,281 771 21,052NORWAY 901 - 901PEJU - 4,000 4,000ROLAND - 35,000 35,000ROMANIA, REPUBLIC OF 12,500 20,048 32,548SPAIN 24,285 45 24,330SIWEDEN 3,238 2,069 5,307SWITZERLAND 5,269 5,269UNITED KINGDOM 53,140 - 53,140USA 1,134,673 8,569 1,143,242USSR 41,081 115,739 156,820
UNCLASSIFIED 201,228 - 201,228MULTIPLE LENDERS 201,228 - 201,228
EXTERNAL DEBT DIVISIONECONOFIC ANALYSIS & PROJJECTIONS DEPARTMENT
JULY 8, 1974

EXTERNAL PUBLIC DEBT AS OF DECEMBER 31, 1973
DEBT REPAYABLE IN FOREIGN CURRENCY
IN THOIJSANDS OF US DOLLARS Page 4
DEBT OUTSTANDING DECEMBER 31, 1973CREDITOR COUNTtE UNDIS-
TYPE OF CREDITOR DISBIJRSED BURSED TOTAL
TOTAL EXTERNAL PUBLIC DEBT 3,081,770 646,631 3,728,401
SUPPLIERS 406,052 14,326 420,378
PRIVATE BANKS 428,789 61,619 490,408
PUBLICLY ISSUED BONDS 38,522 - 38,522
NATIONALIZATION 123,082 751 123,833
OTHER PRIVATE FDIANCIAL INST. 61,718 44,155 105,873
LOANS FI)M INTL. ORGANIZATIONS 193,893 22,364 216,257CORP. ANDINA FOMENTO - 195 195IBRD 128,882 19,970 148,852IDA 22,368 - 22,368IDB 42,643 2,199 44,842
LOANS FRDIM GOVERNMENTS 1,628,487 503,416 2,131,903CANADA 36,158 86,966 123,124BELGI.JM 3,298 3,298BRAZIL 2,874 16,535 19,409BULGARIA 8,327 26,952 35,279CAIADA 16,003 237 18,373CHIN A 6,000 61,000 67,000CZECHOSLOVAKIA 582 32,390 32,972DENMARK 3,088 3,088FINL-ND - 10,256 10,256FRANCE 50,429 4,520 54,949GERMtNY (EAST) 7,468 14,189 21,657GEaW'TY (FED. REP. OF) 153,918 8,162 162,080HUNGARY 423 19,1447 19,870ITALY 31,806 - 31,806JAPAN 12,512 9,643 22,155KOREA (NoRrH) - 5,000 5,000MEXICO 324 19,655 19,979NETHERLANDS 20,281 771 21,052NOIWAY 901 - 901PERU 1 4,000 4,000POLAND - 35,000 35,000

EXTERNAL PUBLIC DEBT AS OF DECEMBER 31, 1973
DERT REPAYABLE IN FOREIGN CUJRRENCY
IN THOUSANDS OF US DOLLARS Page 5
DEBT OUTSTANDING DECEMBER 31, 1973CREDITOR COUNTRY UNDIS-
TYPE OF CREDITOR DISBURSED BURSED TOTAL
FOMANIA, REMJBLIC OF 12,500 20,048 32,548SPAIN 24,285 45 24,330SWEDFI2 3,238 2,069 5,307SWITZERLAND 5,269 _ 5,269UNITED KINGDOM 53,140 - 53,140USA 1,134,673 8,569 1,143,242USSR 41,081 115,739 156,820
UNCLASSIFIED 201,228 - 201,228MIJPIPLE LENDERS 201,228 - 201,228
/1 THE DESIGNATION OF "ERS" REFERS TO THE FACT THAT -THIBLF,-C- ED -TO COUNTRIES WHICH ARE MEMBERS OF THE EXPANDED REPORTING sYsr&A (iRS). THEPRIMARY SOURCE OF THE DATA FOR THIS AND FOR TABLE 2 ATTACHED IS THE REPORTSOF DEBTOR COUNTRIES, ALTHOUGH CREDITOR INFORMATION PROVIDED UNDER THE ERSMAY HAVE BEEN USED TO CHECK OR SUPPL&EMNT IT.
EXTERIAL DEBT DIVISIONECONOMI3 ANALYSIS & PROJECTIONS DEPARTMENT
JULY 10, 1974

lABLE 4.2 06/12/74
EXTERNAL PUBLIC DEST AS OF UECEMBER 31,1973
UEBT kEPAYABLE IN FOREIGN CURRLNCY
IN THOUSANDS OF U.S. DOLLAkS Page 1
TOTAL
DEBT OUTSTANDING TRANSACTIONS DURING PERIDOBEGINNING OF PERIOD CANCEL-
LATIONS,DISBURSED INCLUDING COMMIT- DISBURSE- bENVICk PAYMENTS ADJUST-
YEAP ONLY UNDISBURSED MENTS MENTS PRINCIPAL INIEREST TOTAL MENTS(1) (2) (3) (4) (5) i6) (7) (a)
19k5 801.928 1,014,198 163,727 200,126 67',247 2,4,(2 95.*619 12JO841I)6(. 947J312 1.142P762 294,264 168.633 69,264 3,.635 1(.3.u99 -19P604
1907 !PL35A365 1.348.158 667p711 289,446 86.1V2 39,631 125,733 190183196P 1.221P257 1,930.584 283.436 324q,839 1586P90 41,L20 2(.5plo '13P2731969 1.383.274 2pioa2P165 380.441 432.185 158,434 46.156 206,590 24.075197c I65PP.14 2,P4P0U97_ 469,876 530.273 161.859 71,22U 233,079 33,2661971 ?,(;75P69f 2,s81.380 283.946 226.45% 161.473 75a295 236.76e 242P8311'972 7,3k4#357 2,9,46,43B 3b5,6d4 256P737 6j.97V 3Q,2'.)5 121.234 1640479z91.71 2,75P,361 3,424,;11 2b8b166 315.t02 155,236 41,06k ly?v(7 18 172.350
1Q74 3,081,77( 3.726.401 - 314,871 152,293 62,929 215,222 -103,5331975 3,327,934 3,472,575 106.111 36d#375 161J4d6 529pt b1 -i97( 3.o65,670 3,111471 19,021 523.308 154J414 LlY.7 221977 2,561P543 2.586.163 20.156 319.995 12jP429 443,424197F 2,26',552 2P26b.016 - 1.316 307.442 1Ct,962 413p4L4 41J,,79 ',955,424 1.960.571 1.11e 285,979 8b.8t7b 374ob55 -
19H; i.670,561 1.674.592 991 274,567 zz,9: 347,553 -19t] 1.2880889 1,291.925 741 235,719 5i*,0 286,816lot-2 1,1)53.907 1,056,206 ' r41 18bb445 30,6j5 227.C50 -
19P3 866.203 867.761 74: 1(4,450 2o,o. 2n3.093 -19P14 692,494 693.311 741 87.133 1,i'3o lo6pb63o31°95 6 06,102 606,177 22 11,573 1!,5;5 d7.10219pt, 5214L89 521.542 ' ' 60.717 14#kop 72.966 -
1jP-" 460.772 460,825 44,643 1Q,404 55.127 -
19U8 415.651 415.704 38.090 V,340 47P431 -
1999 377P560 377,613 - 35.677 (,L4j4 44.110 -
3990 341.884 341.937 - 35.eb2b (62k 43.450 -1'41 3306.056 3(100109 3 - j40iu7 oobl? 44.t43 -
l142 268.029 268,u2 ' 26.784 jPU44 328t28 -
1°93 ?41.?46 741.c99 - - 23.8(5 *.21i 29.1J78 -
Note: Debt with a maturity of over one year. 1974 service payments after debt reorganization.Debts as a result of Nationalization are shown as new commitments and new disbursements.

TABLE 2 ' CHILE 06/12/74
EXTERNAL PUBLIC DEBT AS OF DECEMBER 31.1973
DEBT REPAYABLE IN FOREIGN CURRENCY
IN THOUSANDS OF U.S. DOLLARS Page 2
SUPPLIERS
DEBT OUTSTANDING TRANSACTIONS DURING PERIODBEGINNING OF PERIOD CANCEL-
LATIONS*DISBURSED INCLUDING COMMIT' DISBURSE- SERVICL PAYMENTS ADJUST;
YEAp ONLY UNDISBURSED MENTS MENTS PRINCIPAL INIEREST TOTAL MENTS
(1) (2) (3) (4) (5) L6) (7) (6)
1965 116p8G1 133.u60 240505 22.309 21.004 5.441 26P445 b3p767
1966 114P464 132.794 64p605 43.*786 23.127 t.694 28.821 -14P256
1967 131.188 18O.I6 147.174 75J999 27*717 o.031 35J748 5P316
1966 176.872 304,7b9 88.440 121.469 34.o706 9.410 44.116 882
1969 262.612 357.149 64P642 102pb12 34.#751 1J.65b 45P407 -740
1970 330.620 406P300 172.195 167p769 480490 lo701 64#791 28#879
1971 479J423 559.284 5dP567 68.653 51.815 212u0t 73,015 16'2o8
1972 513.674 582P123 54P600 68P613 6.332 1.*92 8.251 -141.914
1973 448.624 487P951 9.713 34.824 16.543 0.495 25.038 060477
1974 406.O52 420.378 * 13.o939 18,963 6,919 25,882 -60,586
1975 340.440 34U0829 389 62.769 2e.957 85.746 -
1976 27PJO40 27e8040 - 52.723 1b151 70.874 -
1977 225.317 225.317 . _ 44.829 14#63r 59.466197e 180#337 180.337 a 38,813 11s6(5 5GJ418 a1979 141.521 141.521 - 36,121 8,963 45O085198(0 105.400 105.400 - 26.665 cp5Ut 33.193 -
19el 78.715 78.715 - - 19,806 Lipbc4 24.610 -
1982 58.909 56.909 - - 15,704 I.556 19.26C -
19h3 43.204 43P204 14.059 L.#523 16#5b2 -
1984 29.145 29.145 I - 11,432 *.646 13.076 -
1985 17.713 17.713 - 10445 905 11J414 a19pf 7.P268 7.26b - 5.319 344 5.662 -
1987 1.949 1l949 a- 1.369 136t 1.505 -1 9F8 581 581 ' 3 4# 12f -
19P9 498 496 - 83 31 120 -
199( 415 415 - - 63 31 1131991 332 332 - 83 2 107 -
1992 249 249 ' - 83 1b 101 -
1993 166 166 - - 83 11 94 -

TABLE 2 - ChILE 06/12/74
EXTERNAL PUBLIC DEbT AS OF DECEMBLR 3101973
UEBT REPAYABLE IN FOREiGN CURRENCY
IN THLUSANDS OF U.S. DULLARS Page 3
PRIVATE BANKS
DEBT OUTSTANDING TRANSACTIUNS DURING PLRIODBEGINNING OF PERIOD CANCEL
LATIONS,DISBURSED INCLUDING COHMITO DISBURSE SERVIC. PAYMENTS ADJUST-
YEAR ONLY UNDISBURSED MENTS MENTS PRINCIPAL INTEREST TOTAL MENTS(1) (2) (3) (4) (5) i6) (7) (8)
19(5 21't0B4 67,uC0 11I293 50'75c, 15,461 k,u2c 17#489 '12196, 56p375 62kb2u 21,130 44217 18,731 4,5qi? 23p323 2619f7 41P882 65,247 28'345 26,450 6,212 L,773 9i9o5 -6211968 59500 84,759 50o357 34'285 32,319 4.316 36P635 '5914e5 61J499 102P73t 16#046 129,298 19*832 J*b3j4 23p666 -4p125)(17l,7 169Pe89 2640829 126P126 90,934 26J636 tIpG559 45,195 1o9!07' ?32P191 364'k1U 31,0b7 56,031 21,3(J7 lio355 340662 31'146r- 72 e' ?89'609 4C5P011 44,969 69,276 7k84 9 7ti e, 57 101P989s"73 453o,35 540,U33 25,376 53,422 50,733 iip?15 b2.447 -22,844
1 76 42ep7b9 49OP46' 44,3554 14,633 913 15,546 -66,701I Q7F391'809 409P074 - 17P106 61J973 lftpv7o 76p95Ui 1 (47e 346P941 34t7,10 1 2 210184 CJ,U99 233'283 -
19?77 136,Q17 136P917 - 266823 Yob3 36o5Cb *111)7e 110JJ94 !1O,V94 - - 24*166 7,756 31,922 a1(79 b5sp2e e5J92o - - 168C60 :.9063 22j 643 -
YI ki ~, C,69DU6P 69,) 066 - 20o725 40 3( 25 555 a1981 4J,343 48, 43 - 12,a26 JJ32;. 15. 34c -19P? 36s317 36o317 '11,010 o,443 13,4tiL'AC83 25J306 25,306 , _ 9,246 *,74. l0w,9bb
"t.'84 1e,O6(! 16,U6t - - 6,474 i,1.3 7J63o -19PF 9'5o6 94Sto - - #4t,u 737 5'21719fb 5'106 5 10(6 4 ' 4,4bt 216 4,704 -15f 7 617 617 1 49 3 4 a'i98Pt( 469 469 ' - 15Y 25 184 a
310 RlU - a 170 1' 164 a140 14u - 66 4 89 -
I098 1 54 54 - - 1 - ¶ _1 942 53 53 a - 1 1 -
19CP3 52 52 a - 1 - *

TABLE 2 - CHILE 06/12/74
EXTERNAL PUBLIC DEBT AS OF DECEMBER 31,19V3
DEBT REPAYABLE IN FOREIGN CURRENCY
IN THOUSANDS OF U.S. DULLARS Page 4
PUBLICLY ISSUEU bONDS
DEBT OUTSTANDiNG TRANSACTIONS UURING PERIOUBEGINNINQ OF PERIUi CANCEL-
LATIONS,DISBURSED INCLUDING COMMIT' DISBURbE- SERVICL PAYMENTS ADJUST-
YEAR ONLY UNDISBURSED HENTS MENTS PRINCIPAL INtEREST TOTAL MENTS
(1) (2) (3) (4) t5) (6) C7) (a)
196F 11C'739 l10'71Y - - 3J7C4 J.352 7s116 -3,375159fh 103P560 103p58U - _ 3,981 J4U56 7J037 '3P3051967 96P?94 96P294 ' 4,027 ep6o 6i725 -7-31119tP 84,956 84,95e, - - 4S267 4 46 6,755 '3,8091cy611? 76h86l 7ob66u - - 4P510 io244 6P754 '3J262c970 ( 6 9 b9 UP. -88 4P727 P 0?C 6,797 '3J959
1 97 1 601 402 60,402 - 9 379 1,764 1'1 43 2P173
1972 53*196 53,196 ' - i8p76 1,593 10P469 '2131973 440107 44,107 * _ 4,246 1,.3ul 5,547 -l339
1974 38'522 38o522 ' 6P719 L,106 7s825 -1975 31.803 31 603 - ' 6*922 9U3 7s825 -1976 2aB881 24pub1 - ' 7,131 693 7o825 -
1977 17?7SC 17r750 7 ' 7o347 47 7,J251 97t 1Ci,403 10P403 ' - 6,353 256 6,609 -1979 4 5c50 4o050 5 3,262 9 3 3'h -1 Op C' 7&8 7f 86 - 786 14 802 -I981 - a - a - _19Y a = - - _ -
1 98i. . a - a
1985 - a - a - a _
I 987 . - -a
1 997a aa 1988 - a a a a _ a
1 989 - a a - _
l990 a a a a a a a
1991 - a a a a _ a_
19'2 ' aa
1993 . a a

TABLE 2 a CMILE 06/12/74
ExTERNAL PUBLIC DEST AS OF DECEmBER 31,1973
DEST REPAYABLE IN FOREIGN CURRENCY
IN THOUSANDS OF U.S. DOLLARS Page 5
NATIONALIZATION
DEBT OUTSTANDING TRANSACTIONS DURING PERIODBEGINNING OF PERIUD CANCEL-
LATIONS,DISBURSED INCLUDING CUMMIT- DISBURSE- SEhVICL PAYMENTS ADJUST-
YEAR ONLY UNDISSURSED MENTS MENTS PRINCIPAL INTEREST TOTAL MENTS(1) t2) (3) (4) (5) (6) (7) (8)
1965 16'900 16,900 U1I50u ' 1,500 -
196. 15J400 15'400 - 1o675 4: 1,717 -
1Q61 13'725 13P725 8O'Ou 80'000 lo*035 Ji181 13'222 a1961 6 3690 8390 - _ 391999 ~j352 42'551 -
196 44'491 44,491 ' 35,908 &15 36,723 1,100197L, 9'683 9o683 1,279 81,279 48i93 ao 4,979 -
1071 86i0069 86pU69 23,480 23J4&0 4,678 4,914 9*592 15*6551972 120o526 120O526 24,970 24,O79 2P812 231 3,oU044 -4'174t973 137,619 138,510 - 14u 643 174 818 an14,O33
1974 123'082 123p833 ' 751 6h3' 338 981 -12,2231975 110O967 110,967 - 12#016 6,357 18'3731976 9A'951 98,951 a ' 11,196 ,*741 16*936 -1J77 87p755 87,T55 ' 7P4 73 ")19q 121664 -1978 B0O26j2 8aO282 ' - 7,132 4.740 110880 -1979 73'150 73o15O . , 7,021 4,314 11e339 9198O 66,129 66#129 - - 6,921 JP'89 10s8IO -
1Q4'1 59'wui 59o208 _ , 6,462 i,40 919415'7J, 2h 52J726 5' 5,331 au17 8,418 -
1'e3 47'395 4 !395 4 - 47711 ;,I't5J 7T491I 4 42*6k)4 42,684 - - 4,711 d,501 7o21219H,5 37'97? 37P972 - 4,711 2k,223 6,934 -
1986 33'261 33P261 a 4,711 IP944 6P6551987 28P550 28e550 - - 3,454 1 '6,u'i 5119 -
196P 25P096 25o096 - 3, 137 lo459 4*596 -l9e9 21 959 21.959 - - 3,137 1,271 4,408 -
'99() 18'822 18,822 - - 3,137 1,Ud; 4.219 -i991 15'685 15P685 - * 3,137 694 40031
1 992 12P548 12' -54b 33, 137 7uo 3,843 -
1943 94 11 9,411 - 1 3,e3? 5I 3,b655

TABLE 2 - CHILE 06/12/74
EXTERNAL PUBLIC DEBT AS OF DECEMBER 311973
DEBT REPAYABLE IN FOaEIGN CURRENCY
IN THUUSANDS OF U*S. DOLLARS Page 6
OTHLR PRIVATE FINANCIAL INSTs
DEBT OUTSTANDING TRANSACTIONS DURING PERIODBEGINNING OF PERIOD CANCEL-
LATIONS,DISBURSED INCLUDING COMMITO DISBURSEw SERVICL PAYMENTS ADJUST*
YEAR ONLY UNDISBURSED MENTS MENTS PRINCIPAL INTEREST TOTAL MENTS(1) (2) (3) (4) (5) (6) (7) (8)
53 53 - 14 15196¢3 9 310o 0ooo 15 1 161967 24 l0sU?4 74p604 876 4 22 26 -3'1lo
9 f. FS 8 9k ti81,523 11,793 2,602 79 115 19419 el 0 3,p621 93*237 996 244t91 251 34 5yd 116
1976 28ei57 94J 09b 14p76O 13#423 2,484 A Jb06 - 4'30 '47019J71 381736 105.''Y4 25,869 2u.483 3#561 A,61o 5,377 5PO22!1472 5-o5ng99 133,234 6E557 16,917 1o0 5i 153 43701(73 60*381 144pU52 3#811 5J736 216 59 275 41#774
197k 61'718 io5pbI3 - 37,743 595 170 765 -5,0901 9 7 87J542 1 0 u Ab - 19,917 13*31 5'963 19*282 -1976 94,140 94 i4U -4 14,015 ,ii7 20 1321Q7' 80j1fe6 8Uo1?6 ' 16,O70 t,174 21'244 41978 6 a'b56 64'056 ' - 12,493 4Dl0i 16d602 -1979 51'563 51#563 ' - 12P287 J-295) 1595b2 -198( 391275 39s275 * _ 12,290 2i494 1 *07b4 -1981 26o966 26'986 - _ 7,551 1.541 9,073 -1982 191434 199434 _ 2#445 1,217 3*663 -1983 16'989 16.989 - - 1,124 l,09u 2#214 -1984 15o865 15,*8 ' 1*120 1,0i6 2.144 4190t5 140737 14,737 - - 631 51i 1.14919P6 1o042 1#042 ' - 135 66 204 -t987 907 907 ' ' 140 ) 199 -1988 767 767 - 144 49 1941989 623 623 ' - 149 40 169 -
474 474 - - 154 29 164 -199t 320 32u - 98 118 -1992 22? 222 * - 74 14 681993 1 8 148 - - 74 9 63

TABLE 2 - CHILE 06/12/T4
EXTERNAL PUBLIC DEBT AS OF DECEMBER 31,1973
DEBT REPAYABLE IN FOREIGN CURRENCY
IN THOUSANDS OF U.S. DULLARS Page 7
LOANS FROM INTL. ORGANIZATIONS
DEBT OUTSTANDING TRANSACTIONS DURING PERIOLBEGINNING OF PERIOU CANCEL-
LATIONS,DISBURSED INCLUDING COMMITm DISBURSE- SERVICL PAYMENTS ADJUST-
YEAR ONLY UNDISBURSED MENTS MENTS PRINCIPAL INIEREST TOTAL NENTScl) C2) (3) C4) (5) 46) (7) (8)
19h65 b4p9k20 164P350 14v8O0 24,00 5P691 0 ot, 10,751 -1196f 103'237 173,458 60,000 27,714 7P288 aso 6 713158 319 7 123p666 226,173 18,000 2CJ272 8274 ,o 672 14'946 "UI837I 9t! 135#6t4 234,U62 14,900 25,184 10O258 (#C973 18A231 21c6s 150*593 23e,706 1i765 19,0076 13*472 9 ,06( 22'532 '902107( 156'197 226,U97 31,300 331740 14,123 9,077 23,199 '2041971 175P815 243,00 _ 240119 12P615 9 ,4ck 22#077 109311977 l6e?e9 232,386 - llhb24 9,571 wp7 5 19P327 3011973 190,843 223#116 195 11P?23 9#916 0#093 16#609 2#862
197t 193oP93 216,257 13,644 16*620 lVo4bU 27s1U0 -197S 191#117 199,o37 0 4'960 19,312 1u,1ob 29#419 -Iv7( 176'765 180,325 3,u2u 14,205 9,491 23#697 -1977 165#560 166*12 - 54G 11#755 o,948 20693 -1976 154p365 154,365 U 12#372 tW266 2(,638 -1979 141'993 141,993 U - 8P766 #oo06 16*372 -1 5 P. (1 1. 3 33'227 133,227 9.U 9#370 ?,p U42 1 6P412 -19P21 123p857 123,857 V U 9o154 Cl,45b 15'612 -1s9? 114P7u3 114,703 - 9,656 bfO 15,543 U
19F3 105'046 105,046 U - 8,602 'J312 13,914 -1984 96'444 96P444 - * 6*847 '*792 13,639 a19 85 7,59 7 87P597 ' 9,158 4,25-i 1 3,411 aI9qFf. 7 P .0 LI,39 7EP439 U 6,165 *.,-44 IU P0 1 -
19br 72'?74 72p274 - . 6P472 jp4t05 9P936 -65'8n2 65 #602 - U 6#325 sPJC6 9,390 -
198 9 5Q,477 59,e7 '7 r 4,990 ;j*i k(i 7,711 -194( 544167 5,P 87 ' P 5 143 E,436 7*5/9 U
19t,1 49,344 49, 344 5 4uts 1 (. 705tB 1992 43P916 &a3,Y16 5737 1'o2i 7#564 a1eiY4 3P6#179 3t#179 6,066 ±*49i (55S9 -

TABLE 2 - CHILE 06/12/?A
EXTERNAL PUBLIC DEST AS OF DECEMBER 31i1973
DEBT REPAYABLE IN FOREIGN CURRENCY
IN THOUSANDS OF U6S. DOLLARS Page 8
LOANS FROM INTL. ORGANIZATIONSCORPsANDINA FOME.
DEBT OuTSTANDING TRANSACTIONS DURING PERIODBEGINNING OF PERIOD CANCEL-
LATIONSDISBURSED INCLUDING COMMIT' DISBURSEO bEkVICL PAYMLNTS ADJUST
YEAR ONLY UNDISBURSED HENTS MENTS PRINCIPAL INTEREST TOTAL MENTS(1) (2) (3) (4) (5) i6) (7) (8)
4 973 j195 - ' ' -
1q74 9 ' 9 5 51'?75 195 195 - 33 42
j7, 1 663 3 ' ' 33 b 40 -1077 13 0 13U - 33 6 39I 47e 9'i 96 ' a 33 it 37197'4 65 65 ' ' 33 3 35 51CPl F 33 33 ' a 33 1 34 4

IABLE 2 - CHILE 06/12/74
EXTERNAL PUBLIC DEBT AS OF DECEMBER 3101973
DEBT REPAYABLE IN FOREIGN CURRENCY
IN THOUSANDS OF U.S. DOLLARS Page 9
LOANS FRON INTL. ORGANIZATIONSIBRD
DEBT OUTSTANDING TRANSACTI0NS DURING PERIODBEGINNING OF PERIOD CANCEL-
LATIONS#DISBURSED INCLUDING CGMkIT- OISBURSE- SERVICE PAYMENTS ADJUST-
YEAR ONLY UNDISBURSED MENTS MENTS PRINCIPAL INIEkEST TOTAL MENTS(1) (2) (3) (4) (5) (6) (7) (8)
196'3 59'746 1071992 7.15U 13,712 5'I60 ), 5Sso 76 -14116h 68PF729 8 1U9J982 60,0UUO 13,626 5J234 ,U2 9,2b2 319e7 76P693 t64,751 . 12c.22 5,565 ",624 104192 -1P4611968 83J3446 i57,I22 1160U 11P374 6,645 5,374 12,019 1
8FP0176 162P676 ' 14'O66 9,324 5i9e6 15,292 -17Q. 92'918 153P.54 19o300 2T,14e 9,010 QJ~v2 15,l02 -2041971 111P057 163P440 17,b70 6,464 6,o56 13s1201972 122'163 156,976 - b0lo 2pol o,45t 9,336 -I,3161Q73 126P576 152,t79 6*233 2,277 k,yy? 5,274 60
iQ7" 12ho862 148,b52 11,450 9P526 (p432 16#9601975 130PA04 139,324 - 4P960 12,684 7,380 2CJ,063 -1976 123'0b1 126f641 - 302o 9,177 1,172 16,349 -1977 116P923 117,463 540 7,153 "(0jU 14,0b3 -1q78 l101310 1100310 - 8*647 0,P54 15fib9 -'979 101*663 101O663 ' - 5,026 bo12L 11,154 a19Re 96 63 P. 96,p38 -. 5,613 ti,812 11,425 -195P1 921 n25 91, 025 ' 5,963 )s464 11,427 -
1982 65P061 85,01 ' - 6,342 :09uy 11'434 -1983 78'720 78,720 - - 6,723 4P696 11,419 -
I Q P 4 71'997 71,997 - U 7,133 4,2/5 11,'4u8 19r5 64'86is 64s6 6 U 7,561 i,b3U 11P391 U
Q8 57> 33 57, 3*j3 ' U 4,569 JS50b 8,U76 -1987 52,734 52,/3 - a 4,875 Jo214 8L 69-I )86 t~l 4 7. 47,859 4-t , - U 5P1 76 i901 8P079 719t9 420t6i1 426bl 4293 i56s; 6,bb2199 " 38A 3b8 38,3b8 4.*573 id.* 686ob9U1991 33phl5 33*,15 ' 4J858 .o02b5 6ob3 19Q2 28D957 28,957 ' ' 5,167 1,710 6,o8b31993 23'790 23o790 ' 5,496 *,386 6pbb2

TABLE 2 - CHILE 06/12/74
EXTERNAL PUBLIC DEBT AS OF DECEMBER 31,1973
DEBT REPAYABLE IN FOREIGN CURRENCY
IN THOUSANDS OF UeS. DOLLARS Page 10
LOANS FROM INTL. ORGANIZATIONSIDA
DEPT OuTSTANDING TRANSACTIONS DURING PERIOUBEGINNING OF PERIOD CANCEL-
LATIONS,DISBURSED INCLUDING COMMIT- DISBURSE- SEhVICL PAYMLNTS ADJUST-
YEAR ONLY UNDISBURSED MENTS MENTS PRINCIPAL INlEREST TOTAL MENTS(1) (2) (3) (4) (5) (6) (7) tB)
19e,5 40484 19i000 - 1427 4U 40 -
19 ( 5'f911 19,00U ' 4,815 - 64 64 -
1967 1U726 19 0,'U - 5,093 9 t 90- 19)68 i5s'o1Q 19,quU 3 4.164 - 144 144 -
1469 18.983 19,00u ' 15 - 142 142 -21970 1e8,P99 16996 - - ' 142 142 -
1971 18AQ98 18.v98 ' - 93 142 235 -
l972 18p??05 18,905 - - 95 154 249 1P6201973 20o300 20430 U 321 170 491 2#259
1971L ?2P 368 22P368 - - 190 167 357 -
1975 22?178 22,176 ' - 190 lo 356 -1976 21'P988 21988 19U 165 355 -
I9 77 21'798 21,798 - - 190 163 353 -
1978 21 6;)8 21,608 ' - 190 162 352 21979 21Da4fi 21p41o - 190 16u 350 -
19p0 21P?28 21s226 - * 190 159 349 -
19 1 I 21933 21 03 - 3b0 157 5371982 20).58 20.658 - ' 57U 14 724 -
19h3 2(0')b8 20,Udd - * 57u 15U 720 01981 19P518 19p51d - - 57 145 715 -
7c)F,5 18P948 18,946 ' ' 570 141 711 -
1cr,6 1 8378 1,376 - 570 137 toT -
IF7 s17'U8 17,808 .' o 570 132. 702 -,P q -17':'39 17*239 ' - 570 12( 698 -
l 19 16MA69 16.669 - 570 124 694 41990 16'0 99 16 099 ' - 570 I2u 6V0 -
1991 15P529 15,529 - - 570 115 685 -
1992 14P,459 14i959 ' 570 111 681 -
1993 14,389 14,389 - - 570 1 ) 677 -

TABLE 2 a CHILE 06/12/74
EXTERNAL PUBLIC DEBT AS OF DECEMBER 31,1973
DEBT REPAYABLE IN FOREIGN CURRENCY
IN THOUSANDS OF U.S. DOLLARS Page 11
LOANS FROM INTL. ORGANIZATIONSIDB
DEBT OUTSTANDING TRANSACTIONS DURING PERIOUBEGINNING Of PERIOD CANCEL-
LATIONS,DISBURSED INCLUDING CLMMIT- DISBURSE- SERVICL PAYMENTS ADJUST
YEAR ONLY UNDISBURSED HENTS MENTS PRINCIPAL INTEREST TOTAL MENTS(1) (2) (3) (4) (5) 46) (7) (8)
19t5 2 C! f69)0 37.358 7.65C 8..87C 531 'P424 1.J955 m
1lct 29 0 28 44.470 ' 9J273 2.054 A.77b 3.832 -iqk7 36.247 '42.422 .3oG40 2,J57 27 06 1,95b 4J664 '376
3kJ3Y9 57.34( 3f300 10*646 3#613 ;,1455 6.068 119f9 43.43A 57juX,e 1765 4..995 4J148 2.950 7.098 900197( 44's2tl 53.745 12.o UJ 6#592 5.01 13 2pb 4 7,9551971 45J760 60.632 6.5 49 6#05b 2.-64 86722 109311972 47?221 56.505 3P214 6.595 o,147 9J742 '31973 43.837 49.9S01 -4#990 7.318 472t 11.044 2P253
197" 42'f643 L4,4s2 2,199 6.902 ie.7 9.778 ,t075 37.940L 37p940 ' 6.406 2 55) 6#958 -1976 31p534 31J534 - 4.805 l 147 6.952 -1977 26.728 26.728 4-3 1764L 6.216I 976 27J350 22' 350 - , 3.503 1.557 5.0601979 1A8J47 1 6 p7 * ' 3.518 1p314 4J832198( 15.329 15.3 -9 - 3.534 1,u70 4.60419!i 11794 11.794 ' 2.811 3 3.648 -19 f ,0 °8 4 Bo984 2.' 746 b3' 3.3b61983 6723B 6.23b I ' 1.309 46( 1.7761981 4.929 4.929 I ' 1 144 3i1 1J515 -19e5 3'785 3j.765 ' 1.027 2b2 1.3091 9b 6 t#2 758 2o758 1#027 2u0 1.2272987 1,731 1,731 - - 1.027 118 1.145 -
1.9Ee 704 7014 577 $6 613 -198el 127 127 - 127 e 135

TABLE 2 - CHILE 06/12/74
EXTERNAL PUBLIC DEBT AS OF DECEMBER 31#1973
DEBT REPAYABLE IN FOREIGN CURRENCY
IN THOUSANDS OF U.S. DOLLARS Nge 12
LOANS FROM GOVERNMENTS
DEST OUTSTANDING TRANSACTIONS DURING PERIODBEGINNING OF PERIOD CANCEL-
LATIONS,DISBURSED INCLUDING COMMIT- DISBURSE- SERVICE PAYMENTS ADJUSTO
YEAR ONLY UNDISBURSED MENTS MENTS PRINCIPAL INTEREST TOTAL MENTS(1) (2) (3) (4) (S) 46) (7) (5)
196S 451*451 522'116 133P129 103'O56 190813 IiP490 32#303 1902391966 554P217 654P671 118,529 92P914 14*447 14,5d0 29*027 m2'0741967 628p586 7560679 339'558 85'647 27.J33 1(1246 451081 -llJ629196$ 679P677 1P056pd05 117'946 141'099 371242 190366 56P628 -85251969 783!598 1J128J984 106J990 156J208 49,71u 2lp2U(i 70,910 m16*2621970 895'180 1,170OP02 42'216 143P128 58e906 24,862 83P768 9'1291971 1,003P060 1,162,441 1440943 33,68b 58'118 Up,7a4 80'9u2 1751972 9900443 1,249P441 224P462 35,900 2813460 luo424 38fB84 224*1201973 1#225P1U5 1,669p375 199J607 160'855 47,095 12-340 59,435 3091955
1974 1628p487 2,131 903 _ 204,2h0 61,685 40,519 102,204 33,78h1975 1,998Pt82 2,104,02 ' 63,739 166,892 9u,3tU 257P252 -1976 1pb95P030 1,y37Jli - 16,U01 18OP700 deJ670 271.370 -1977 1P722P331 1,748A410 a 19,616 180,545 72,285 252#830197e l,561'402 1,567pb65 a 1,316 180,959 6i,589 24045481979 1,381,759 1386,906 a l,llo 176P508 54,390 230'898 -
19pO lp?06P367 1,210,398 - 991 172P635 45.P391 218,026 -9tj8, 926p623 929P663 ' 741 155,546 3u,10o 185P652 8
98.2 7/1'819 774,117 - 741 144P296 22J380 166,6b21983 6280264 629'c21 - 741 136U708 15,199 151,906198Lu 492J297 493 114 - 74 54542 o612 63,1541985 438f496 438p571 - 22 42.146 0,830 '48J977 -1 98o, 396P372 396P425 - 39P89b >o833 45 732 -j9h7 356P474 356,527 - - 33o060 5,124 38,184I 98 p H3221936 322J989 * 28.242 4,699 32 941196Q 294'694 294P747 * * 27,148 4,352 31J4991 99t. 267p546 267P599 - * 27,225 4sO42 31,266 61991 240J321 24'is374 * 29,280 J.739 33J0191992 211P041 211,U94 * 17,752 J 4t$U 21 231I9Q3 193P290 193,343 * * 140444 3*243 17,687

TABLE 2 - CHILE 06/12/74
EXTERNAL PUBLIC DEBT AS OF DECEMBER 31#1973
DEBT kEPAYABLE IN FOREIGN CURRENCY
IN THOUSANDS OF U.S. DOLLARS Page 13
LOANS FRUM OOVERNMENTSARGENTINA
DEBT OUTSTANDING TRANSACTIONS DURING PERIOUBEGINNING OF PERIOD CANCELO
LATIONSPDISBURSED INCLUDING CUMMIT- DISBURSE- SEhVICL PAYMENTS ADJUSTS
YEAR ONLY UNDISBURSED MENTS MENTS PRINCIPAL INTEREST TOTAL MENTS(1) (2) (3) (4) (5) 6) (7) (8)
1965 4#132 4,132 4,132 60 4192 21 9 6--1967 - - - -i - - 0S. 3v5' ' -14I (s: 914 3#500 6.50-0 1,866 316 4b 3641 976I 2P46i 9J684 1.500 2,12o 631 64 695 _1971 3,95.1 10C553 6,500 3J997 910 2o5 lP1151972 7'O'40 16,143 12#000 171 994 510 1J5o41973 6J?17 27,149 100I 576 34,542 4*022 426 4J448 '579
1974 36'158 123,124 ' 82,866 4,40U 776 5p1751975 114,644 116,724 - 4O80 15,050 (p#926 22*975297f, 1U3'674 13o674 - 12,18 U167 19,0t5 51977 90P)856 90;^ 56 - _ 13 245 J,41I 18H663 -197& 77P611 77J1ii1 - 13,429 4ob23 1'0521979 64Jp1e1 64,161 - 12*761 'e7b1 16P56319pe 51 P4Q(1 51o400 I ' 10,933 i,07I 14'00319e1 4( P4b7 40,46/ 10,46?7 ; 414 12J881 -1 e 2 30JOCO( 30,p 000 1 - 100JO( 16.b Ip 0 -1983 20'OCC 2QU0u - 1,O(JO) 1,2uu 11,2UU-19F4 10O'00 10,u0O ' - 10,00U 0OU i0J6U0 -

TABLE 2 - CHILE 06/12/74
EXTERNAL PUBLIC DEST AS OF DECEMBER 3101973
DEBT REPAYABLE IN FOREIGN CURRENCY
IN THOUSANDS OF U.S. DULLARS Page 14
LOANS FROM GOVERNMENTSBELGIUM
DEBT OUTSTANDING TRANSACTIONS DURING PERIODBEGINNING OF PERIOD CANCEL-
LATIONS,DISBURSED INCLUDING COMMITO DISBURSE- SERVICL PAYMENTS ADJUSTo
YEAR ONLY UNDISBURSED MENTS MENTS PRINCIPAL INlEREST TOTAL MENTS
() O(2) (3) (4) (5) C6) (7) (8)
1965 -' - i 3 3 342
1966 342 342 - a 27 27 490
1967 83? 832 ' ' - 19 19 47
1968 879 879 - 9 57 -
1969 87c( d7U - - 292 68 30a
197 ) 578 5'( a a 578 ' 578 -
15971 _ a a a a - a_
1972 1 a _ 713 713 2'390
1973 1.J677 167a 93 93 1J621
1 974 3ff298 3J,298 - 200 213 413 2,5681975 59666 5o666 a - 467 31 804 4197 6 5180 5.0 - a 685 291 976 6
1977 4 495 4,495 - - 745 253 998 a
1978 3'750 3 750 ' a 745 211 956 _
1979 3P006 3,006 ' a 745 170 914 -
19F0 2'261 2,261 _ a 745 12V 872 -
1981 1J,516 1'516 ' 601 06 687 7
1982 915 9i5 - a 458 55 513 -
1983 457 457 a a 457 27 484 -

TABLE 2 a CHILE 06/12/74
EXTERNAL PUBLIC DEBT AS Of DECEMBER 31#1973
UEBT REPAYABLE IN FOREIGN CURRENCY
I-N THUUSANDS OF U.S. DOLLARS Page 15
LOANS FROM GOVERNMENTSBRAZIL
DEBT UUTSTANDING TRANSACTIONS DURING PERIODBEGINNING OF PERIOD CANCEL'
LATIONSDDISBURSED INCLUDING COMMIT' DISBURSE- SERVICE PAYMENTS ADJUST-
YEAR ONLY UNDISBURSED MENTS MENTS PRINCIPAL INTEREST TOTAL MENTS(1) (2) (3) (4) (5) C6) (1) (8)
1972 - - 20,OuO 1627 '1973 1IA27 20'00 * 1P638 591 16'9 760 -
1974 ?p 74 19'4U9 - 12P535 2#99O !4d 3'5781975 12P419 16P419 ' 4,000 2P990 951 3,947 -
1976 13g428 1342'8 - 2J990 dd 3*878 71977 1O'4 38 1*'*4 , 2,990 6rt$ 3,669 -1978 7,447 7,447 - - 2#990 469 3 459 91979 4,457 4,457 ' - 990 295 1I2 8 -1980 3P466 3P466 - - 990 225 1I216 -
1981 2'476 2,476 ' - 990 156 1,146 -
I19R2 P1486 1i486 ' 990 1,0771983 495 495 - 495 17 513

TABLE 2 - CHILE 06/12/T4
EXTERNAL PUBLIC DEBT AS OF DECEMBER 31.1973
DEBT REPAYABLE IN FOREIGN CURRENCY
IN THOUSANDS OF U.S. OOLLARS Page 16
LOANS FROM GOVERNtIENTSBULGARIA
DEBT OUTSTANDING TRANSACTIONS DURING PERIOUBEGINNING OF PERIOD CANCEL;
LATIONS,DISBURSED INCLUOING COMMIT' OISBURSE- SERVICE PAYMENTS ADJUST-
YEAR ONLY UNDISBURSED MENTS MENTS PRINCIPAL INlEREST TOTAL MENTS(1) (2) (3) (4) (5) (6) (7) (8)
1Q71 * 3Z,, 104197? -04 :49 5,OUU 145 25 13 38 ;1973 3 )4 5,3(4 300 00 7E958 a i'25
1 Q74 8'237 35P279 ' - 62 1° 78 334 1481975 '069 10OY 6 - 176 53 2291976 M93 b 176 44 2191977 718 718 176 34 2101978 542 542 _ 145 25 1701979 398 398 ' - 114 18 132 -190 2834 2d4 a 114 13 126 a
198l 170 i7u - 114 7 121 -1Q 2 57 5- - 57 1 58

TABLE 2 - CHILE 06/12/74
EXTERNAL PUBLIC DEBT AS OF DECEMBER 311973
DEsT REPAYABLE IN FOREIGN CURRENCY
IN THOUSANDS OF U.S. DOLLARS Page 17
LOANS FROM GOVERNMENTSCANADA
DEBT OUTSTANDING TRANSACTIONS DURING PERIODBEGINNING OF PERIOD CANCEL-
LATIONS,DISBURSED INCLUDING COMMIT- DISBURSE- bERVICL PAYMENTS ADJUST-
YEAR ONLY UNDISBURSED MENTS MENTS PRINCIPAL INIEREST TOTAL MENTS(1) (2) (3) (4) (5) k6) (7) (8)
1965 12'608 129t49 - 124 74-1 (c5 -
1966 12#FL'4 12P525 39 9 759 768-1967 12J514 12P516 3,996 _ 1*064 I2b 1'792 -2196i 11*A50 15#446 3,996 56 1,249 66L 16917 11969 1OJ258 18,194 171 1#84b 717 2,565 1197 L 8'5b2 16J347 1.dou 3i264 2J051 L 2J6CB' 1'0301971 1O*438 1I71 i6 - 1,752 1,125 13 1'73e 6919721 1I1 613C 2p43 2,to7 - 143 143 -11973 15'711 18352 2,246 2,294 ' 142 142 -2,405
1974 1CIfW03 lt,373 - 2,051 222 133 355 9121975 19063 19G63 - 2oU62 b42 2903 1976 17'002 17P(OO2 2,#283 Z20 3C3 -1977 14*719 14.1719 1#7is 51 2i319 -
197E 12'961 12'961 1,329 4h7 1,817 -1979 1l16.52 11*652 1#329 415 1,744 -
19q(: 1O'323 10'i23 - - 1329 341 1I67019F1 8J993 8B993 1J147 267 1,41419f2 7s847 7?.'47 814 21i 3P0231983 7*033 7,03J 715 17L bb51984 6P318 6,31b - 292 13r 429 -19h5 6J027 6,027 - 292 129 42119e6 5,735 5,735 292 1,2' 4131987 5 0443 5,443 - 292 114 406 -19e6 5JI52 5"152 - 292 ILC 3961q89 40860 4,O66 ' ' 292 VL 390 -1990 40568 4P56 - - 292 $(J 382 -
1991 4J?76 4P276 - ' 292 3 374 1992 3#985 3*985 - 292 5 3 O -1993 3'693 3,693 - 292 OF 359 -

TABLE 2 - CHILE 06/12/TA
EXTERNAL PUBLIC DEST AS OF DECEMBER 31PI973
DEBT REPAYABLE IN FOREIGN CURRENCY
IN THUUSANDS OF U.S. DOLLARS Page 18
LOANS FROM GOVERNMENTSCHINA,PEOPLES REP*OF
DEPT OUTSTANDING TRANSACTIONS DURING PERIODBEGINNING OF PERIOD CANCEL'
LATIONSDDISBURSED INCLUDING COMMITT DISBURSE- SERVICL PAYMENTS ADJUST'
YEAR ONLY UNDISOURSED MENTS MENTS PRINCIPAL INTEREST TOTAL MENTSCO) (2) (3) (4) (5) c6) t7) (8)
1972 ' - 67O000 3,00 -_
1973 3t000 67,d -OC 3o(o(
1974 6'000 67,0O0 1 1,OC -1975 17p800 67r0CC - 18*0001976 35Pd800 67,P0)0 - 13,-000 -1977 48if00 67,U - 16r200 ' a -1978 67P000 67,000 - a a -
1979 67'(IU 67,00U a a ' ' a
19ec- 67#000 67,00 ' a a '-1981 67'000i 67,*00 L i a -1982 67'i000 6?pQU0 ' a 3P350 - 3P35019b3 63.650 63J650 W a 6J700 - 6P700 -1984 56'Q50 56sv50 ' a 6P700 - 6,7U01985 50'250 50#250 a a 6s7UO _ 6,700 -19t6 43'550 43P550 a a 6*700 6,o7U019h7 3('850 36,pS( - a 6,700 a 6,700 a1988 30'150 30J;.50 - a 6,700 a 6,700 a
1989 23'450 23P450 - , 6,70 6700 a1990 16'750 16#750 a 6*7u0 _ 6#700 -1991 10P050 l005U 0 _ 6,7U0 - 6*700 a1992 3,350 3P350 ' a 3 35U - 3,350 a

TABLE 2 - CHILE 06/12/74
EXTERNAL PUBLIC DEBT AS OF DECEMBER 31#1973
DEBT REPAYABLE IN FOREIGN CURRENCY
IN THOUSANDS OF U.S. DOLLARS Page 19
LOANS FROM GOVERNMENTSCZECHOSLOVAKIA
DEBT OUTSTANDING TRANSACTIONS DURING PLRIOUBEGINNING OF PERIOU CANCEL-
LATIONSDDISBURSED INCLUDING COMMIT' DISBURSE- SERVICL PAYMENTS ADJUSTa
YEAR ONLY UNDISBURSED MENTS MENTS PRINCIPAL INIEREST TOTAL MENTS(1) (2) (3) (4) (5) '(6) (7) (8)
1965 71 113 24 1 251966 47 69 ' 23 2 251967 24 66 15 57 31 5 361968 50 su 5o078 78 17 2 19 a
1969 111 5s111 a 25 2 27 -
197( 86 5,0U6 78 1db 32 371971 741 5,131 24 146 68 3I 981972 319 5U6 7 3JOO 378 53 1( 631973 644 boU34 15,out 10,632 37 3 40 9*975
1974 562 32.972 - 23,695 864 489 1'3521975 23'413 32,108 8 6,695 5,427 1,12i 6P5551976 26P681 26J,61 ' 5J412 1,18? 6P5991977 21#269 21'269 - 2#912 967 3p9001978 1IA356 1 8356 * 2J912 844 3J7561979 15 444 15J444 2#912 7o0 3*613198Ci 12 531 12*531 - 2F912 556 3,4691981 9'619 9,619 ' a 2#912 413 3*3251982 6'o706 6p70e a' 2,198 277 2*4761983 4,508 4,508 , . 1#781 166 1J9471984 ?*727 2i72z ' 1,364 92 li456 a
19 .' 1J364 1,364 1J364 31 1394

TABLE 2 a CHILE 06/12/74
EXTERNAL PUBLIC DEST AS OF DECEMBLR 3101973
DEBT REPAYABLE IN FOREIGN CURRENCY
IN IHOUSANDS OF UDSe DOLLARS Page 20
LOANS FROM GOVERNMENTSDENMARK
DEBT OUTSTANDING TRANSACTIONS DURING PERIODBEGINNING OF PERIUD CANCELT
LAtIONSDDISBURSED INCLUDING COMMIT- OISBURSE SEkVICL PAYMENTS ADJUST-
YEAR ONLY UNDISEURSED MENTS MENTS PRINCIPAL INTEREST TOTAL MENTS(1) (2) (3) (4) (5) C6) (7) (8)
t965 - - 1,936 74? - '1966 747 1P937 - 744 - 82 B2 ml1967 1IJ49 4 li936 - 4;7 - 37 37 -1531968 1'7-83 P713 - 69 116 1651969 1#714 1,714 * a 247 112 359 -1970 1'467 1,467 - - 357 S, 449 -1971 l'110 1,1l0 * a 362 7V 432 621972 810 -w 990 49 10039 2,0001973 1'820 1,62 2 470 126 598 1s738
1974 3'088 3P08b - _ 157 11 34A 1, 44B1975 4'379 4,379 - - 371 27k 644 41976 4,0008 4.u06 0 8 523 248 7711977 3,4 t4 3,4b4 574 215 7891978 2p910 2,910 - - 574 176 752 a1979 2,336 2,336 - 574 14? 716 a
1980 10761 1,161 - a 574 u5 679 91981 1'187 1,187 ' a 467 6s 536 -1982 720 720 . , 360 43 403 a1983 360 360 - 360 22 382 a

TABLE 2 ' CHILE 06/12/74
EXTERNAL PUBLIC DEBT AS OF DECEMBER 31.1973
DEST REPAYABLE IN FOREIGN CURRENCY
IN THOUSANDS OF U&S. DOLLARS Page 21
LOANS FROM GOVERNMENTSFINLAND
DEBT OuTSTANDING TRANSACTIONS DURING PERIOUBEGINNING OF PERIOU CANCEL-
LATIONtoDISBURSED INCLUDING COMMIT- DISBURSE- SERVICL PAYMENTS ADJUST*
YEAR ONLY UNDISBURSED MENTS MENTS PRINCIPAL INTEREST TOTAL MENTScl) (2) (3) (4) (5) (6) (7) (8)
1973 . _ O212 - 44
1974 - 10o256 -- - 10P2561975 a a

TABLE 2 - CHILE 06/12/74
EXTERNAL PUBLIC DEST AS OF DECEMBER 31.1973
DEBT REPAYABLE IN FOREIGN CURRENCY
IN THOUSANDS OF U.S. DOLLARS Page 22
LOANS FROM GOVERNMENTSFRANCE
DEBT OUTSTANDING TRANSACTIONS DURING PERIODBEGINNING OF PERIOD CANCELs
LATIONS.DISBURSED INCLUDING COMMITO DISBURSE- SERVICL PAYMENTS ADJUST-
YEAR ONLY UNDISBURSED MENTS MENTS PRINCIPAL INTEREST TOTAL MENTSCl) (2) (3) (4) (S) i6) (7) (8)
1965 3J350 3.666 7.853 2P528 587 236 825 -I1966 5.291 10,933 4.052 3,101 308 319 627 -1967 8.084 14,677 a 2.541 ' 187 1871968 10o625 14,677 6.666 405 1.093 677 1.770 11969 9'936 20.269 6#840 2.088 1.682 404 2.086 i2J2051970 9'290 23J222 a 2.877 1.822 383 2*205 0491971 10*296 21.351 - 3.381 1.955 349 2.3004 1.'6971972 12P711 21.093 a 2.864 7,008 391 7.399 17J5871973 25#195 31.672 - 2,653 1#136 783 1.919 24.412
1974 50429 54.949 4,52-0 3,4 2,462 5,904 26,271975 77.781 77.781 - 6.848 4.098 10o946 -1976 70o933 70,933 - 8.616 3,55 12.3711977 62.317 62.317 - - 9J249 i#289 12.5381978 53'068 53.068 9.249 2,785 12.0341979 43'819 43.819 * 9J249 2#2du 11.529 a1 98 0 3 4, 570 34,o 570 9. 216 1, 776 1 09921981 25P354 25.354 ' 7.730 1.273 9.0021982 17.625 17.625 - 6J640 874 7.5141983 10.964 10.984 ' 6.639 502 7.1411984 4J345 4.*345 Is1052 13u I-# 1821985 3.293 3,293 ' 1.052 93 1.1451Q86 2241 2,*241 ' ' 1J052 57 1. 109 a1987 1189 1.189 ' - 711 21 732

TABLE 2 - CHILE 06/12/74
EXTERNAL PUBLIC DE3T AS OF DECEMBER 31i1973
DEBT REPAYABLE IN FOREIGN CURRENCY
IN THOUSANDS OF U.S. DOLLARS Page 23
LOANS FROM GOVERNMENTSGERMANY (EAST)
DEBT OUTSTANDING TRANSACTIONS DURING PERIODBEGINNING OF PERIOD CANCEL-
LATIONS,DISBURSED INCLUDING CUMMIT DISBURSES SERVICL PAYMENTS ADJUST-
YEAR ONLY UNDISBURSED MENTS MENTS PRINCIPAL INTEREST TOTAL MENTS(I) (2) (3) (4) (5) C6) (7) (8)
1971 - - 1I346 '-
1972 * 1,346 i0,427 3,124 '1973 3'124 21P773 - 41477 - _,116
1974 7J46P 21#65? ' 1O.41( 2#660 406 3'0661975 15P218 18,997 3,779 2*660 533 3#193 -1976 16P336 16*336 - 2,660 5U 3P1601977 13'676 13,676 U 2,o660 41IL 3o071 1978 11Ao15 11.0u b 2P643 321 2'964 -1979 8P372 b,372 m 2,489 234 2 72319PO 5J8A2 5J862 - - 2,353 15V 2J512 -
1981 3J529 3J529 2,353 b8 2J4411982 1P176 1,176 1,176 1U 1'194

TABLE 2 - CHILE 06/12/74
EXTERNAL PUBLIC DEBT AS OF DECEMBER 31P1973
DEBT REPAYABLE IN FOREIGN CURRENCY
IN THOUSANDS OF U.S. DOLLARS Page 24
LOANS FROM GOVERNMENTSGERMANY (FEDO*REPoOF)
DEBT OuTSTANDING TRANSACTIOhS DURING PERIODBEGINNING OF PERIOD CANCEL
LATIONS,
DISBURSED INCLUDING COMMIT- DISBURSE- SERVICL PAYMENTS ADJUST-YEAR ONLY UNDISBURSED MENTS MENTS PRINCIPAL INIEREST TOTAL MENTS
(1) (2) (3) (4) (5) (6) (7) (8)
1 96 5 4 A -o z39 46#511 6J750 - 121670 4,137 13*807 14*143
1q66 5p*984 57,734 l6ei75 11*599 2*123 175b 3*911 1*695
1967 6r0*390 72P091 15*675 10,501 2,221 4J2*I 4,433 -5'0806
106e 63J535 79*739 - 6,085 3P547 2?4ub 5*955 51969 66'166 76,197 8 196 6*244 5#024 J,366 8* 392 7*0691970 73*523 86,438 6biU7 6 762 J,492 10U254 -21971 72*967 79,674 - 2P493 5*2Qi1 2,305 7P566 10*409
1Q72 79J955 64*882 723 3,579 538 4*117 36J3911973 113*362 117P694 7*636 4*6r6 4,173 A*461 5*640 40*923
1974 153*918 162*0PB - 975 3,806 4,21R R,o24 20,158
1975 171''45 178p432 719 18,812 O6449 27*261 -
1976 153*152 159*620 719 21,779 (r556 29*3371977 132*091 137*841 719 22*625 6*489 29*114 -
1978 110*165 115*216 - 719 22*625 *,369 27*i995 -
1979 88*279 92'9si 719 22*297 4*250 26*547 -
1980 66*700 70,294 7 719 21*092 J,145 24*237 -
1981 46*327 49P202 719 14*449 k'1z5 16*573 -
1982 32*597 34P753 - 719 98988 i*4tk 1135U -
1983 23J418 24*855 - 719 8*435 9YU 9,384 -
1984 15*(702 16*420 a 719 1J849 48( 2*336 -
1985 140571 14457k - - 1,849 425 2*275 51986 12*722 12 72* -2 1,849 353 2*203 -
1987 10*872 10,872 - - 1*812 281 2*093 -
1986 9J060 9,U60 I - 1*774 212 1*986
1989 7*286 7,286 - 1,025 154 1*179 -
1990 6*261 6s261 - - 1,025 127 1*152 -
1991 5J236 5,236 3- 6UB 103 712 -
1992 4o628 4,62 - 386 91 476 -
1993 4*242 4*242 4-2 3b6 dJ 469 -

TABLE 2 a CHILE 06/12/74
EXTERNAL PUBLIC DEBT AS OF DECEMBER 3101973
DEST REPAYABLE IN FOREIGN CURRENCY
IN THOUSANDS OF U.S. DOLLARS Page 25
LOANS FROM GOVERNMENTSHUNGARY
DEBT OUTSTANDING TRANSACTIONS DURING PERIODBEGINNING OF PERIOD CANCELS
LATIONS,DISBURSED INCLUDING COMMIT- DISBURSE- SERVICL PAYMENTS ADJUST-
YEAR ONLY UNDISBURSED MENTS MENTS PRINCIPAL INTEREST TOTAL MENTScl) (2) (3) (4) (5) t6) (7) (a)
1971 a 20000 ' ''1972 - 20,000 a1973 a 20,000 a 553 130 15 145 -
1974 423 19,od7o u 3,447 696 232 928 a15Oooo1975 3,174 4,174 a 1J 00 696 250 9461976 3,479 3,479 ' a 696 209 9041977 2'783 2,783 ' ' 696 167 863 -
1978 2'087 2#087 a 696 125 8211979 1'391 1,391 ' 696 83 779 -19e0 696 696 ' ' 696 42 737

TABLE 2 CHILE 06/12/74
EXTERNAL PUBLIC DEBT AS OF DECEMBER 31*19?3
DEBT REPAYABLE IN FOREIGN CURRENCY
IN THOUSANDS OF U*S. DOLLARS Page 26
LOANS FROM GOVERNMENTSITALY
DEBT OUTSTANDING TRANSACTIONS DURING PERIODBEGINNING OF PERIDO CANCEL*
LATIONS,nISBURSED INCLUDING COMMIT' DISBURSE- SERVICL PAYMENTS ADJUST
YFAR ONLY UNDISBURSED MENTS MENTS PRINCIPAL INTEREST TOTAL MENTS(1) (2) (3) (4) (5) (6) (7) (6)
1965 -3,79U
1966 - 3,790 - 2P795 - 134 134 -
1967 2T795 3J790 ' 995 '1968 3'790 3,790 374 314 6881969 3J416 3,416 1,517 226 19743 -1970 1 899 18699 a 1.899 29 1P9281 971 -1 -1 972 - - ' -' - 7*7441973 7,744 7,744 ' - 341 341 24'403
1974 31 806 31 606 - - 2,632 Z,5l6 5,148 28,072.1975 57#246 57,246 3J744 3,418 7P162 a1976 53'502 53,502 ' 6,377 30193 9J5701977 47'126 47,126 ' 7*130 ,s811 9 941 -1978 39'996 39,'996 a 70,130 2*3t3 9'513 31979 32J866 32, 866 7,130 L*955 9o085 -198u 25'737 25s737 - - 7,130 1, 52 86571981 18'607 18,607 - - 6,574 ,o108j 7#6741982 12'033 12O33 ' ' 6,018 722 6'7401983 6,015 6U015 ' ' 6,015 361 6'376 a

TABLE 2 a CHILE 06/12/74
EXTERNAL PUBLIC DEBT AS OF DECEMBER 31,1973
UEBT REPAYABLE IN FOREIGN CURRENCY
IN THOUSANDS OF U.S. DOLLARS Page 27
LOANS FROM GOVERNMENTSJAPAN
DEBT OUTSTANDING TRANSACTIONS DURING PERIODBEGINNING OF PERIOU CANCEL;
LATIONI,DISBURSED INCLUDING COMMIT DISBURSE& SERVICL PAYMENTS ADJUST-
YEAR ONLY UNDISBURSED MENTS MENTS PRINCIPAL INTEREST TOTAL MENTS(1) (2) (3) (4) (5) (6) (7) Ce)
1965 - - 5,966 1,073 ' '1 966 l'C73 5.p66 ' 4*492 ' 149 149 -1967 5'565 5*966 ' 401 e 2P267 2J2671968 5D966 5o966 - 522 332 854 -11969 5p 443 5p413 4 ' 2,498 288 2*786 11970 2 946 2 946 2J944 8 2P952 -21971 ' a a1 9 7 2 so'a 2P8581973 2Je85 2'B5d 9,954 9'954 a a 9J343
1974 12'512 22'155 - _ 1,022 1,339 2'361 10,7751975 31'908 31*908 1,462 1,860 3#3211976 30#446 30P446 - a 2,487 1,772 A02591977 27'960 27P960 ' a 2#774 1,623 403961978 25#186 25i8o ' - 3,309 1,0456 47661979 21877 p1'877 3,845 1,246 5i0911980 18'031 18031 * , 3#845 1#020 4P8661981 14J166 14*186 ' 3,625 795 4#420 -1982 10o561 10*561 - a 3A405 589 3,995 -1983 7'156 7,156 ' a 3J405 390 3J7961984 3'750 3#75 U ' 1,071 192 1,2631985 27679 2,679 I a 1,071 13i 1'2041986 10607 1I607 I ' 1,071 74 1,145 -1987 536 536 ' 536 15 550 a
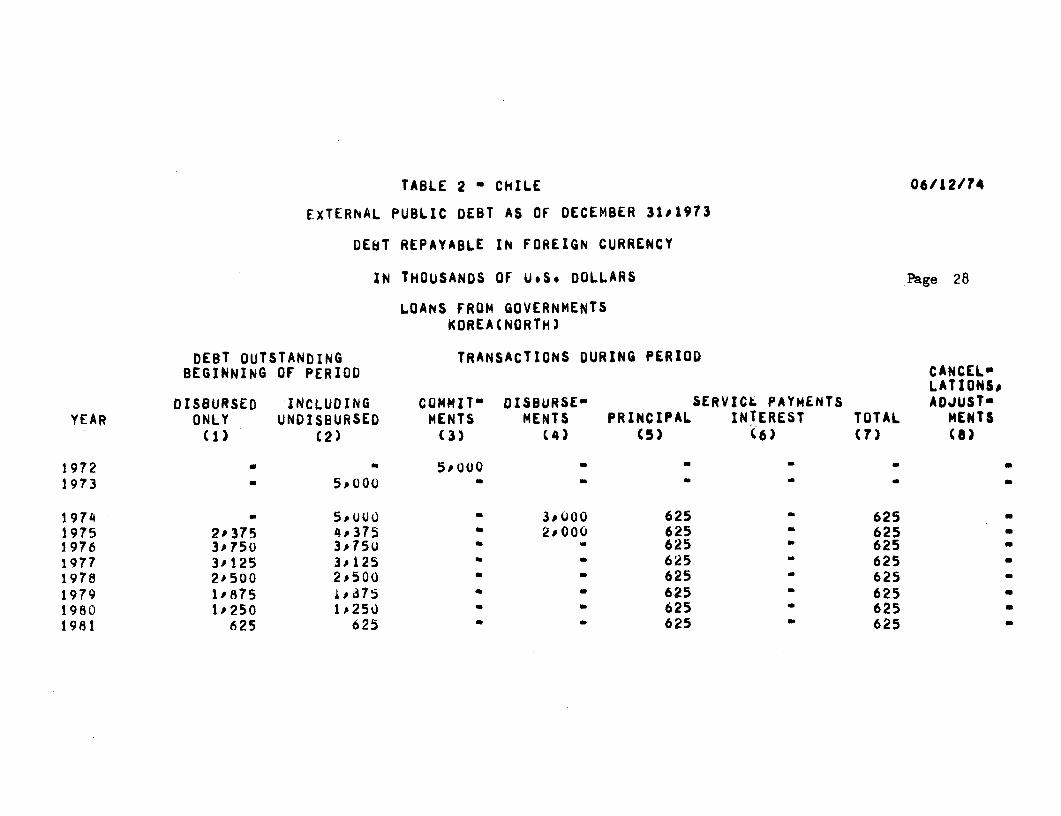
TABLE 2 ' CHILE 06/12/?4
EXTERNAL PUBLIC DEBT AS OF DECEMBER 31J1973
DEbT REPAYABLE IN FOREIGN CURRENCY
IN THOUSANDS OF U.S. DOLLARS Page 28
LOANS FROM GOVERNMENTSKOREACNORTH)
DEBT OUTSTANDING TRANSACTIONS DURING PERIODBEGINNING OF PERIOD CANCEL'
LATIONS,DISBURSED INCLUDING COMMIT' DISBURSE SERVICL PAYMENTS ADJUST-
YEAR ONLY UNDISBURSED MENTS MENTS PRINCIPAL INTEREST TOTAL MENTS(1) (2) (3) (4) (5) (6) (7) (8)
1972 - . 5,000 . . .1973 - 5,000 .
1974 - 50U0 0 3,000 625 6251975 2'375 4P375 2,00OU 625 ' 6251976 3'75o 3,750 ' 625 625 -1977 3'125 3P125 ' - 625 6251978 2'500 2,500 ' - 625 6251979 1'875 875 ' 625 ' 625 a
1980 1'250 1*250 - 625 ' 625 -1981 625 625 625 625

TABLE 2 - CHILE 06/12/74
EXTERNAL PUBLIC DEBT AS OF DECEMBER 3101973
DEBT REPAYABLE IN FOREIaN CURRENCY
IN THOUSANDS OF U.S. OULLARS Page 29
LOANS FROM GOVERNMENTSMEXICO
DEBT OUTSTANDING TRANSACTIONS DURING PERIODBEGINNING OF PERIOD CANCEL-
LATIONSDISBURSED INCLUDING COMMITO DISBURSE- SERVICL PAYMENTS ADJUST
YEAR ONLY UNDISBURSED MENTS MENTS PRINCIPAL INTEREST TOTAL MENTS(1) (2) (3) (4) (5) (6) (7) (8)
19772 - - 2k,(ou -_ - a1973 - 20 UOu * 345 20 9 29 -1
1974 324 19J979 a 11,793 3#996 373 4*369 -1975 8'121 15s983 - 6i¢62 3J996 693 4 689 X1976 10987 1l19'i7 _-OOU 3'996 669 40685 -1977 7,992 7,992 9 - 3*996 479 4,475 -1978 3'996 3'996 3,996 240 40236 -

TABLE 2 - CHILE 06/12/74
EXTERNAL PUBLIC DENT AS OF DECEMBER 311973
UEBT REPAYABLE IN FOREIGN CURRENCY
IN THOUSANDS OF U.S. DOLLARS Page 30
LOANS FROM GOVERNMENTSNETHERLANDS
DEBT OUTSTANDING TRANSACTIONS DURING PERIODBEGINNING OF PERIOD CANCEL-
LATIONS#
DISBURSED INCLUDING COMMIT DISBURSE- SERVICL PAYMENTS AOJUSTYEAR ONLY UNDISBURSED MENTS MENTS PRINCIPAL INTEREST TOTAL MENTS
Cl) (2) (3) (4) (5) (6) (7) (8)
t966 73 73 - - a a 214
1967 287 2a7 - - - - a 39
196a 326 32 696 - 35 35
96(} 326 1oU22 930 1293 65 67 132 21970 IJ5S4 1,b88 3s756 2#752 65 10t6 171 al
1971 4J'24C s5 78 - d01 65 159 224 690197? 5,573 6,203 7,225 89 138 30 168 1P2261973 6'750 14,516 - 12i155 65 24 89 6'601
1974 20'f281 21ou52 - 525 301 61/ 9181975 2OJ504 20P751 - 22 625 67? 1P2971976 19,901 20,12b a 22 723 03i 1*356 -
1977 19P200 19,4Ui 22 747 580 1,335197P 18P475 1J655 22 747 541 1J288
1979 17,750 17,907 - 22 747 494 1,2421980 17'025 17,16U 6 22 9b7 44t 1P435 a
1_81 16' 060 16i,73 22 964 39S~ 1 360 0
14 6 2 1 5. 15 11 8 15,J2b - 2 2 942 34 1,286 61983 14' 199 1IA'26Y - 22 859 296 1o155 a
19b4 13*363 13,407 22 642 251 893 -
1985 12?'743 12J765 - 22 634 219 853 -
1916 1 2132 12,132 - - 3,811 230 4,042
19el7 8*320 b8320 2 a 3,757 18 3,938 a
988e 4,563 4,563 - - 517 1 36 650 a
195B 4*046 4JO40 ' - 465 115 580 a
1990 3p581 3*581 ' a 465 95 559 -1991 3,117 3,117 ' ' 24U 7t 318 -
1992 2J877 2,877 7 240 72 312 -
1993 2,o637 2,637 a a 240 66 306
TABLE 2 ' CHILE 06/12/74
EXTERNAL PUBLIC DEBT AS OF DECEMBER 31,1973
UEBT REPAYABLE IN FOREIGN CURRENCY
IN THOUSANDS OF U.S. DOLLARS Page 31
LOANS FROM GOVERNMENTSNORWAY
DEST OUTSTANDING TRANSACTIONS DURING PERIODBEGINNING OF PERIOD CANCEL-
LATIONS,DISBURSED INCLUDING COMMITO OISBURSE& SERVICL PAYMENTS ADJUST-
YEAR ONLY UNDISBURSED MENTS MENTS PRINCIPAL INIEkEST TOTAL MENTS(1) (2) (3) (4) (5) t6) (7) (8)
1965 228 22- * 38 ' 38 11966 191 191 16 '6 -1967 175 175 - - 61 61196P 114 ' ' 114 - 1141 96S 9 - - * * _ ,
1970 * * * * .
1911 91972 ' a 364 364 ' a a -
1973 364 364 ' a a - ' 537
1974 sQ1 9u1 4- 49 L9 97 2451975 1'097 109? - a 49 b 114 -1976 1i049 i,049 ' a 137 62 199 -1977 912 912 . 144 5 198 -
1978 768 768 - - 144 4519 l1979 624 624 ' 144 36 1801980 480 4B0 ' 144 2o 1721981 337 337 * - 144 19 163 -
1982 193 193 ' ' 165 11 176 -1983 28 28 2 8 29 -

TABLE 2 - CHILE 06/12/74
EXTERNAL PUBLIC DEST AS OF DECEMBER 31#1973
DEBT REPAYABLE IN FOREIGN CURRENCY
IN IHgUSANDS OF U.S. DOLLARS Page 32
LOANS FROM GOVERNMENTSPERU
DEBT OUTSTANDING TRANSACTIONS DURING PERIODBEGINNING OF PERIOU CANCEL'
LATIONSPDISBURSED INCLUDING COMMIT' DISBURSES SERVICL PAYMLNTS ADJUSTo
YEAR ONLY UNDISBURSED MENTS MENTS PRINCIPAL INTEREST TOTAL MENTS(1) (2) (3) (4) (5) t6) (7) (8)
1972 - 4,0U --1973 4,00
1974 - 4'uuo - 2,400 250 IL 328 a1975 2'.150 3,?5u 1#600 500 164 684 -1976 3'050 3-25 500 20 7u31977 2P75o 2o750 500 171 6711978 2'250 ,25Uo 500 138 6381979 1*750 1,75o - 500 1(6 6061980 1s250 1o250 500 73 5731981 75o 750 * 50(2 41 5411982 250 250( - 250 & 258

TABLE 2 - CHILE 06/12/74
EXTERNAL PUBLIC DEBT AS OF DECEMBLR 31I973
UEBT REPAYABLE IN FOREIGN CURRENCY
IN THOUSANDS OF U.S. DOLLARS Page 33
LOANS FROM GOVERNMENTSPOLAND
DEBT OuTSTANDING TRANSACTIONS DURING PERIOUBEGINNING OF PERI0U CANCEL-
DISBURSED INCLUDING COMMITa DISBURSE SERVICT PAYMN7S YEAR ONLY UNDISBURSED MENTS MENTS PRINCIPAL 'NEREST TrT>
tl) (2) (3) C4) a)) l7 ) (8)
1966 - - 114 114 23 - 231967 91 91 ' 18 5 23 -196$6 73 73 18 4 22 -1969 55 55 - - 16 3 R1 -I1970 36 36 - _ 18 2 20 a1971 18 18 35,000 - 18 1 19 _1 972 35,* -.1 973 - 35, i,0 - - -_
1974 35,QOQU 5pUO0 1 176 143 1 320 025,0001975 3'824 8,824 5,00IJ 1 176 392 1o568 a1976 7J647 7.#47 1 1,176 476 1654 -
1977 6'471 6J471 I- 1176 401 lJ578 -1978 5'294 5i294 a a 1 176 325 105011979 4'11 8 4118 a 1176 249 1J425 a1980 2'941 2p94i a a 1,176 172 1,349 a1Q81 I1765 1J765 a a 1J176 96 1J272 a1982 588 5U3 8 a 588 19 607 a

TABLE 2 CHILE 06/12/74
EXTERNAL PUBLIC ODET AS OF DECEMBER 31o1973
UEBT REPAYABLE IN FOREIGN CURRENCY
IN THOUSANOS OF U.Se DOLLARS Page 34
LOANS FROM GOVERNMENTSROMANIAJ REPUBLIC OF
DEBT OUTSTANDING TRANSACTIONS DURING PERIODBEGINNING OF PERIOD CANCEL-
LATIONSDDISBURSED INCLUDING COMMIT" DISBURSE- SENVICL PAYMENTS ADJUST'
YEAR ONLY UNDISBURSED MENTS MENTS PRINCIPAL INTEREST TOTAL MENTStl) (2) (3) (4) (5) (6) (7) (a)
2971 m - 21,744 50 7 - 7 -
1972 43 21,737 13,014 14,660 381 64 445 481973 1 AL37 0 34,416 ' 291 49 340 'Il580
1974 12'500 32J548 ' 14,048 2,995 590 3,5921975 23#552 29,552 ' 6*000 3,995 IP25u 5'2451976 25'557 25,557 - 3,995 1,3 92 5,3871977 21'561 21,561 - - 3,640 1,176 4,818 -1978 17'921 17#921 ' - 3,640 976 44,616 a
1979 1LA061 14,21 - - 3,640 774 44414 -l9eU 10640 10640 ' - 3,640 572 4,212 2t961 7,JOc 7,0 0 2,000 390 2J39019A2 5000Q 5,uiu -- 2,000 270 2,27019e3 3'0 0 3o00 -0 2,000 150 2,150 -19 8 1o00o 1,ou0O - 1,0o0 30 1,030

TABLE 2 - CHILE 06/12/74
EXTERNAL PUBLIC DEST AS OF DECEMBER 311973
DEBT REPAYABLE IN FOREIGN CURRENCY
IN THOUSANDS OF UsS. DOLLARS Page 35
LOANS FROM GOVERNMENTSSPAIN
DEBT OUTSTANDING TRANSACTIONS DURING PERIODBEGINNING OF PERIOD CANCEL-
LATIONS,DISBURSED INCLUDING COMMIT' OISBURSE- SERVICL PAYMENTS ADJUST-
YEAR ONLY UNDISBURSED MENTS MENTS PRINCIPAL INTEREST TOTAL MENTS(1) (2) (3) (4) (5) t6) (7) (a)
1965 50856 10'UULI . 3 * C 7A 2c2 2c2 -1966 F.932 1 UUOO 962 300 6U7 9071967 95594 p7WCU e 61 1'50U 335 18635 -1968 80175 8,200 ' 25 15i00 264 1 7641969 6'700 6 lU7 ' ' 2,140 2J,1401970 4J56U 4p56u ' ' 2s140 144 2#264 -1971 2'420 2D420 - 2147 b4 2#231 -1972 973 273 - 2#201 9 2P210 13'7251973 1I-797 11,797 43 - 1J571 169 1o740 14J061
1974 21L,285 24J33C - 1i592 1X363 2 955 15,7151975 36'453 38i453 ' - 2J653 e'209 500611976 35J6O00 35Jo 600 ' 4J450 051 6,502 a1977 31'150 3115u ' 4*903 i 79? 6o700 -1978 26J?47 26P24? 4,9CO 1515 6p416 a1979 21'346 21J346 - 4P898 1,234 6P131 a19%C 16P446 16P448 - - 4.898 952 5.850 a19P1 11'551 11#551 ' - 4.270 671 4.94119e? 7J2 1 7J281 - - 3,642 437 4017819P3 3'640 3J640 ' - 3P640 218 3.858 -

TABLE 2 a CHILE 06/12/74
EXTERNAL PUBLIC DEBT AS OF DECEMBER 31#1973
DEBT REPAYABLE IN FOREIGN CURRENCY
IN THOUSANDS OF U.S. DOLLARS Page 36
LOANS FROM GOVERNMENTSSWEDEN
DEBT OUTSTANDING TRANSACTIONS DURING PERIODBEGINNING Of PERIOD CANCEL
LATIONS,DISBURSED INCLUDING COMMITO DISBURSE- SERVICL PAYMENTS ADJUST
YEAR ONLY UNDISBURSED MENTS MENTS PRINCIPAL INTEREST TOTAL MENTS(1) (2) (3) (4) (5) '6) (7) (a)
1972 - 5#029 a ' ' a
1q73 - 5,C24 2,960 ' ' 278
1Q74 3.238 5,307 2(69 '1975 5'3u7 5P307 - 27 27 -1976 5'307 5,j(lj - - a 27 -1977 _'307 5s307 ' ' 2? 27 -1976 5P3G7 5,,307 - a a 27 27 a1979 5I3LI7 5,307 - a a 27 27 -19P0 5'307 5,3(7 ' ' a 2? 27 a19Pi 5P307 5,307 2 a ' 27 271Q+2 5'307 5,307 - 66 27 931983 5'241 5P241 - a 133 26 159 -l Qo IL 5,108 SslOb I - 133 25 15819P5 4'975 4,975 ' - 133 25 157 a
i9Pf 4*843 4,o43 - - 133 24 15719e7 40710 4*710 _ 133 156 a19tM 45*577 457 a 133 23 15519F9 4,445 40445 ' a 133 22 155 -
199C 4*312 4,312 ' 133 21 154 a1991 *#,j79 4,179 _ , 133 21 153 -1992 4*047 4,047 - a 133 60 1931993 3*914 3'914 - 133 58 191

TABLE 2 - CHILE 06/12/74
EXTERNAL PUBLIC DE8T AS OF DECEMBER 311973
DEBT REPAYABLE IN FORLIGN CURRENCY
1N THOUSANDS OF U.S. DOLLARS Page 37
LOANS FROM GOVERNMENTSSWITZERLAND
DEBT OUTSTANDING TRANSACTIONS DURING PERIODBEGINNING OF PERIOD CANCEL
LATIONSDDISBURSED INCLUDING COMMIT- DISBURSE- SERVICk PAYMENTS ADJUSTo
YEAR ONLY UNDISBURSED MENTS MENTS PRINCIPAL INTEREST TOTAL MENTScl) (2) (3) (4) (5) (6) CT) (6)
1972 - - 1,347 - 1#347 4#1111973 2,764 2*764 - 169 169 2#505
1974 5'269 5,269 _ 176 330 506 1,5731975 60666 6#666 669 360 1*0501976 5,977 5,977 - - 862 324 1'186 -
1977 5'115 50115 * 914 277 1J1921978 4'201 4*201 - - 1#135 226 1,3631Q79 3'065 3,065 - a 914 165 1,0791980 2'151 2#151 - 914 115 1,0291981 1,237 1,237 65b 65 723 -19P2 579 579 ' 401 j5 436 -
lQ&3 176 176 . 176 11 189

TABLE 2 - CHILE 06/12/74
EXTERNAL PUBLIC DEBT AS OF DECEMBER 31,1973
DEBT REPAYABLE IN FOREIGN CURRENCY
IN THOUSANDS OF U.S. DOLLARS Page 38
LOANS FROM GOVERNMENTSUNITED KINGDOM
DEBT OUTSTANDING TRANSACTIONS DURING PERIODBEGINNING OF PERIOD CANCELf
LATIONS,DISBURSED INCLUDING COMMIT' DISBURSE- SEkVICE PAYMENTS ADJUSTS
YEAR ONLY UNDISBURSED MENTS MENTS PRlNCIPAL INlEREST TOTAL MENTS(1) (2) (3) (4) (5) t6) (7) CS)
1965 6'748 9,b0u 5*076 3'UO2 86b 41A 1J282 11966 8 882 1 4.0 .09 - 4D1 6 868 6t6 1'537 1967 12'200 13s141 1'451 b06 888 564 1I452 -2#021196E 1 O375 11 683 12 460 1o468 6b5 2'133 21969 9'370 10s229 2^781 2p781 2#042 615 2*657 ml197( i0iIU8 10o967 761 2#018 474 2P4921971 F'851 8,94 v 9 1 2 843 363 3'226 426197c 6'522 6,532 10089 154 1'243 26'2691973 31 732 31 732 ' 554 1.67C 2P224 211962
197ai 53'140 53 14O 4 2,625 3,075 5,700 26,1761975 76'691 76,691 - 6#800 4,553 l1I354197t 691P91 69.b91 - 9P444 4,143 13,5671977 60G446 60,446 - 10s2Co0 4,573 13 774I976 50U246 50*246 ' 10200 co 59 13,159 -1979 40'046 40*U46 - ' 10i055 2,344 12'39919PC0 29 991 29i991 ' 990 9 ,744 11 653 U
1981 20'082 20p 82 a 7,997 1 l4b 9-14519?2 12'085 12,06U5 - 6P084 725 6'809I913 6 001 6u0U1 6,001 360L 6s361 -

TABLE 2 ' CHILE 06/12/74
EXTERNAL PUBLIC DEBT AS OF DECEMBER 3121973
DEBT REPAYABLE IN FOREIGN CURRENCY
IN THOUSANDS OF U.Ss DOLLARS Page 39
LOANS FROM GOVERNMENTSUSA
DEBT OUTSTANDING TRANSACTIONS DURING PERIODBEGINNING OF PERIOD CANCEL-
LATION$,DISBURSED INCLUDING COMMIT- DISBURSE SERVICL PAYMENTS ADJUSTo
YEAR ONLY UNDISBURSED MENTS MENTS PRINCIPAL INT4RLST TOTAL MENTS(1) (2) (3) (4) (5) k6) tT) (0)
i9f.5 370J?19 433Ju15 101'758 92P632 2#37U bP694 11j064 4J67919f6 465'171 537PUB2 96*188 64pb7b 10o777 1woO44 20J8Z1 1D0821 Q 6.7 5 4 p514 541 6219411 303P4!1 7,p052 22'05U 1I ,bby 32A939 3P7331966 562'536 899,0Y9 97J978 133,U76 27I262 1J6b53 41J115 8,5311969 66 8319 961w264 39J743 141,165 31996 1 52 47.278 -21J127197C 778P067 947p684 35'022 124P959 37,J59 19J,514 57'1I3 891541971 88P'526 953J471 15J515 43,417 10o5U5 61J922 13,1781972 86O0624 896,b76 2J322 9J942 b,513 18,455 109p7521973 965'141 996p498 249000 33,4?1 33,694 (,025 40J,720 1569438
1974 1134P673 1143,242 - 3,399 2h,747 20,421 45,361 100,0091975 I,213J334 1,218,504 1,9o2 809663 4bp2u2 128ob651976 1I134'653 1,137po41 126o. 91,153 44'639 135#792 -1977 IP044P760 1,u46,688 675 82,049 39Y4860 121'529 -197h 963J386 964,639 575 81J962 3o01d8 118'1701979 881,979 ee2#657 375 b4,520 32,436 116'956 -198G0 797'834 798,137 2 250 83J776 2O,369 112J14519e1 60692u6 606i261 *l1649 11,850 99J4991982 524'559 524,012 - 80,658 149944 94060219e3 443J907 443P954 a 74..733 1'J066 84,798984 369'168 369,221 2 9,150 6,544 35,094 -
1965 340'O18 340'071 27,763 5,697 33,460 -312P?54 312,307 a 23,701 4J940 28,641
1987 288p553 288,606 19Y120 4*,490 23*609j9pt 269,a34 269,487 18J826 4,22V 23'046 -l9P9) 250J607 250,660 aa 18534 J,962 22'496 -199(! 232J073 232*126 18,*611 4J700 22J319 -1991 213J463 213,516 21,307 JP454 240761 1992 192'155 192J208 13J352 4,1d2 16,534 -
1993 17#8s03 178,856 ' ' 13.394 i,969 169363 -

TABLE 2 ' CHILE 06/12/74
EXTERNAL PUBLIC DEBT AS OF DECEMBER 31D1973
DEBT REPAYABLE IN FOREIGN CURRENCY
IN THOUSANDS OF U.S. DOLLARS Page 40
LOANS FROM GOVERNMENTSUSSR
DEBT OUTSTANDING TRANSACTIONS DURING PERIODBEGINNING OF PERIOD CANCEL'
LATIONS,DISBURSED INCLUDING COMMIT' DISBURSE" SERVICL PAYMENTS ADJUST
YEAR ONLY UNDISBURSED MENTS MENTS PRINCIPAL INTEREST TOTAL MENTS(1) (2) (3) C4) (5) (6) (7) (C)
IV67 - - 15,oo0 - ' ' -1 96e 15,UOU - .i969 ' 15,D0ou 42#0U'1976 - 57,UOU m ' '1971 - 57,P00 60#000 5o276 - ' a
1972 5J778 117puou q0,00O 3J426 ' '1973 807U4 157,000 ' 32o377 - . 160
1974 41 0p Ol 156pb2J ' 11507391975 41'O81 41,081 - 4 4J135 I,651 5 756 61976 36P946 36P946 ' 4P135 1,478 5P6131977 32*811 32511 '' 4p135 1,304 5*4391978 28*676 26b676 ' 4,135 1131 5*2661979 24*541 24J541 4-135 9!8 5,093 -198(W 20*406 20,406 ' ' 4,135 785 4*9201981 160271 16,271 - 4#135 612 4,747 -
1982 12*136 12,136 - - 4#135 43b 4,573 a1983 8*001 88001 - 4 4J135 265 4,4001Q84 3*866 3,866 ' ' 1,289 124 1o413 -1985 2#577 2P577 1,289 7( 1*367 -t98h6 1*89 1,289 'o 1289 34 1*322-
/ EXCLUDES $77.1 MILLION CF SHORT TERM DEBT NOT PAID AT THE END OF 1973 AND BEING RENEGOCIATED DURING 1974.

TABLE 2 - CHILE 06/12/74
EXTERNAL PUBLIC DEBT AS OF DECEMBER 3101973
DEBT REPAYABLE IN FOREIGN CURRENCY
IN THOUSANDS OF U.*S OULLARS Page 41
UNCLASSIFIED
DEBT OUTSTANDING TRANSACTIONS DURING PERIODBEGINNING OF PERIOD CANCEL'
LATIONS,DISBURSED INCLUDING COMMIT- DISBURSE- SERVICL PAYMENTS ADJUSTO
YEAR ONLY UNUISBURSED MENTS MENTS PRINCIPAL INTEREST TOTAL MENTS(l) (2) (3) (4) (5) (6) (T) (a)
1972 170'521 170521 30,126 3o,126 22,979 Vo549 32,5281973 177P668 1T7*66b 49,404 49,404 25P844 ti5 26'649
1974 201'228 2P22b - 25,154 11,269 36#4221.975 176'075 176,075 - 25,154 W,860 35PO14 -1976 150'921 150<9 21 ' 25,154 b,452 33J605 -
1977 125#768 125p768 25*154 1,043 32'196197e l0OP614 1Oo,614 - 25,154 5'634 30,7881979 75 461 75,461 25,154 4,226 29P379 -180 50#307 5t.*307 - 25,154 2,817 27#9711981 25'154 25#154 25,154 1o4u9 26P562 -

TABLE 2 a CHILE 06/12/74
EXTERNAL PUBLIC DEBT AS OF DECEMBLR 31,1973
DEBT REPAYABLE IN FOREIGN CURRENCY
IN THOUSANDS OF U.S. DOLLARS Page 42
UNCLASSIFIEDMULTIPLE LENDERS
DEBT OUTSTANDING TRANSACTIONS DURING PERIODBEGINNING OF PERIOD CANCEL'
LATIONSoDISBURSED INCLUDING COMMIT' DISBURSE SERVICL PAYMENTS ADJUSTS
YEAR ONLY UNDISBURSEU MENTS MENTS PRINCIPAL INTEREST TOTAL MENTS
(1) (2) 03) (4) CS) (6) (7) (8)
1972 170,521 17U.521 30.126 30U126 22,979 Y.549 32.528
1973 177p668 177.668 49p4J4 49.404 25P844 d65 26.649 -
1974 201.228 201.228 - 25,154 11,269 36.422
1975 176.O75 176P0(5 - 25.154 i.b66U 35.014
1976 150*921 150.921 a a 25,154 0.452 33.605 a
t977 125.768 125.768 - - 25.154 (.043 32.196 a
1978 10O.614 100.614 25.154 .634 30.768 -
1979 75.461 75.461 25.154 4,226 299379 -
1980 50'307 50.307 - 25.154 2,817 27.971 -
198t 25.154 25.154 a a 25.154 1,*409 26.562 -
EXTERNAL DEBT DIVISIONECONOMIC ANALYSIS & PROJECTIONS DEPAMEN
JULY 8, 1974

Table [-3: RESCHEDULED VS. NOT RESCHEDULED DEBT SERVICE, 1974-80
($ million)
1974 1975 1976 1977 1978 1979 1980
TOTAL DEBT SERVICE 215.2 529.9 677.7 443.4 413.4 374.9 317.6
I. DEBT SERVICE ON RESCHEDULED DEBT 101.4 128.2 323.9 165.5 157.8 142.6 137.3
(A) Prior to 1965 8.6 &.5 8.5 8.5 7.3 7 .8Bonds 7 7T 78 -6 7. :Loans from Government .8 .7 .7 .7 .7 .3 -
(B) Under the 1965 Paris Club Agreement 2.1 1.7 1.7 1.6 1.5 1.4 1.2
(C) Under the 1972 Agreements 32.3 41.3 203.3 8.2 36.5 302 33.0Paris Club 12.0 29.2 2b.4 27. 26.5 2-7 MC7Special arrangements 20.3 12.2 174.9 10.7 10.0 4.6 8.3
of which: commercial banks (11.8) ( 8.3) (170.2) ( 6.9) ( 6.4) ( 1-3) ( 5-4)
(D) Under the 1974 Paris Club Agreement 58.4 76.7 110.4 117.2 112.4 107.2 102.3
118 DEBT SERVICE ON OTHER DEBT 113.8 401.5 353.7 277.8 255.5 232.3 210.3
(A) International Organizations 27.1 29.4 23.7 20.7 20.6 16.4 16.4World Bank Group 17.0 20.1 163 14 15.2 11.2 11.4Other 10.1 9.3 7.4 6.6 5.4 5.2 5.0
(B) Bilateral Official 43.3 149.0 0 1 1 96.3 89.8DAC Countries 19.3 92.8 7W.0 57.8 57.6 59.3China & CCMECON Countries 11.0 23.9 24.0 20.5 19.4 18.5 17.8Other 13.0 32.3 28.3 27.6 26.4 18.5 15.8
(C) Suppliers Credits 7a1 84.6 69.9 58.6 49.9 44 9 33.1
(D) Financial Institutions 4.5 852 79.3 47.7 38.9 34-0 32.2
(E) Nationalization Liabilities 1.0 18.4 16.9 12.7 11.9 11.3 10.8
(F) Unclassified 36.4 35.0 32.2 30.8 29.4 28.0
Source: External debt reports to the IBRD by the Government of Chile.

Table 4.4: IMPACT OF POSSIBLE DEBT RELIEF(In millions of U.S. dollars)
1975 1976 1977
(A) On Debt Rescheduled in 1972 and 1974 94.4 282.7 124.3
1. Roll-over of final payments to U.S.commercial banks - 157.7 -
2. Postponement of 80%of repayment ofremaining rescheduled debt 94.4 125.0 124.3
(B) On Debt not Previously Rescheduled(80% of total debt service) 205.3 176.9 127.2
1. Bilateral officialLending (excl. other developing countries) 74.2 62.4 46.2
2. Suppliers credits 67.7 55.9 46.9
3. Loans from financial institutions 63.4 58.6 34.1
(C) Total 299.7 459.6 251.5
Source: IBRD Mission estimates.

TABLE 4.5
THE IMPACT OF REPAYMENTS OF DEBT RELIEF ON CHILE'S DEBT SERVICE OBLIGATIONS 1975-80(In millions of U.S. dollars)
1975 1976 1977 1978 1979 1980 1981 1982 1983 1984 1985
(A) Debt Service Before Debt Relief(On commitments received thru end-1972) 372.3 331.7 273.6 242.5 217.4 200.0 149.3 129.4 115.2 99.1 89.5
(B) Service on Rescheduled Debt 118.0 314.0 155.4 148.9 127.4 135.3 107.2 92.4 81.0 -
1972 Agreement 41.3 203.6 38.2 36.5 20.2 33.0 9.9 ... - - -
1974 Agreement 76.7 110.4 117.2 112.4 107.2 102.3 97.3 92.4 81.0 - -
(C) Subtotal (A+B) 490.3 645.7 429.0 391.4 344.8 335.3 256.5 221.8 196.2 99.1 89.5
(D) Debt Service on Commitments Received in 1973(Including miscellaneous adjustments) 39.6 32.0 14. 22.0 30.1 12.3 30.0 5.3 6.9 7.8 -2.4
(E) Total Debt Service 529.9 677.7 443.4 413.4 374.9 347.6 286.4 227.1 203.1 106.9 87.1
Source: External debt reports to the IBRD by the Governnent of Chile.

V. PUBLIC FINANCE


Table 5. 1: CONSOLIDATED PUBLIC SECTOR, 1968-1970
(millions of current Escudos)
1968 1969 1970Central Decentralized Public Central Decentralized Public Central Decentralized Publlc
Government Agencies Sector Government Agencies Sector Government Agencies Sector
Current Revenues 8.757.6 7,817.6 16,575.2 13,068.6 11,457.8 24,526.4 19,302.3 15,517.5 34,819.8
Direct Taxes 3,434.9 - 3,434.9 5,068.0 - 5,068.0 7,664.4 - 7,664.4Indirect Taxes 4,932.1 - 4,932.1 7,420.5 - 7,420.5 10,645.5 - 10,645.5Sales of Goods and Services 151.2 3,058.8 3,210.6 216.3 4,498.5 4,714.8 280.9 4,841.9 5,122.8Rent from Assets 83.0 476.0 559.0 117.6 552.8 993.2 443.8 470.1 913.9Social Taxes - 2,927.9 2,927.9 - 4,236.6 4,236.6 - 6,472.3 6,422.3Other 156.4 1,354.9 1,511.3 246.2 502.5 748.7 267.7 1,511.0 1,778.7Special Laws - - - - 1,344.6 1,344.6 - 1,272.2 2,772.2
Current Expenditures 3,954.7 8,690.7 12,645.4 5,619.8 12,730.4 18,350.2 9,618.2 19,039.8 78,658.0Wages and Salaries 2,344.2 2,422.6 4,766.8 3,400.5 3,582.4 6,982.9 5,982.7 5,390.3 11,373.0Purchase of Goods and Services 476.4 1,982.0 2,458.4 713.0 3,284.7 3,997.7 1,085.5 4,021.7 5,107.2Family Allomances and Pensions 305.2 3,532.6 3,837.6 384.2 5,043.1 5,427.3 659.3 8,005.2 8,664.5Transfers to Private Sector 444.6 201.5 646.1 644.9 256.8 901.7 906.0 389.2 1,795.7Transfers to Non-Consolidated
Public Sector 185.0 137.6 322.6 110.1 100.6 210.7 441.4 741.8 1,183.2Interest Payments 197.9 130.0 327.9 367.1 173.4 540.5 543.3 195.9 739.2Other 1.4 284.4 285.8 - 289.4 289.4 - 295.7 295.7
Surplus on Current Account 4802.9 -873.1 3,929.8 7,448.8 -1,272.6 6,176.2 9,684.1 -3.527.3 6,161.8
Net Inter Sector Transferson Current Account (- - transfer from) -2,576.2 2,576.2 - -3,522.3 3,522.3 - -5,742.0 5,742.0 -
Capital Expenditures 1,715.4 5,998.8 7,714.2 2,594.5 9,500.1 12.094.6 4,045.6 14,324.5 18,370.1Fixed Capital 1,141.1 2,957.7 4,098.8 1,643.4 5,375.9 7,019.3 2,489.8 7,647.7 10,137.5Purchase of Assets 14.3 298.4 312.7 14.4 151.0 165.4 5.6 700.4 706.0Transfers to Private Sector 4.1 9.7 13,8 6.5 15.6 22.1 16.0 96.5 112.5Transfers to Nonconsolidated
Public Sector 4.9 302.5 307.4 20.4 178.4 198.8 94.3 701.7 796.0Financial Investments - 1,506.3 1,506.3 - 2,349.3 2,349.3 - 4,225.6 4,225.6
(Stock) - (337.9) (337.9) - (648.4) (648.4) (252.2) (757.5)(Development and Housing Loans) - (901.3) (901.3) - (1,326.4) (1,326.4) (3,394.2) (3,394.2)(Personal Loans) - (267.1) (267.1) - ( 374.5) ( 374.5) ( 578.9) ( 578.9)
Other - 122.1 122.1 - 53.3 53.3 - 147.4 147.4Amortization of Debt 551.0 802.1 1,353.1 909.8 1,376.6 2,286.4 1,439.9 1,305.2 2,745.1
(Internal) (176.5) <99.1) (275.6) (281.6) (306.8) (588.4) (244.6) (625.0) (869.6)(External) (374.5) (703.0) (1,077.5) (628.2) (1,069.8) (1,698.0) (1,195.3) (680.2) (1,875.5)
Capital Revenues 0.4 906.3 906.7 53.5 1,623.6 1.677.1 163.0 2,471.7 2,634.7Sale of Assets 0.1 81.1 81.2 - 214.5 214.5 - 111.9 111.9
Loan Recoveries - 455.7 455.7 - 761.3 761.3 - 1,097.3 1,097.3Other 0.3 369.5 369.8 53.5 647.8 701.3 163.0 1,267.5 1,425.5
Deficit, Gross 3,087.9 -5,965.6 -2,877.7 4,907.8 -9,149.1 -4,241.3 5,801.5 -15,375.1 -9.573.6Net Deficit (minus=amortization) (3,638.9) (-5,163.5) (-1,524.6) (5,817.6) (-7,772.5) (-1,954.9) (7,241.4) (-14,069.9) -6,828.5)
Borrowing. Gross 2,877.7 4,191.1 9,555.5External Borrowing 2,291.0 4,084.0 6,174.8(Net External Borrowing) (1,213.5) (2,386.0) (4,299.3)Internal Borrowing 586.7 107.1 3,380.7New Loans 879.2 1,069.5 3,467.5Cash Balances -292.5 -962.4 -86.8
(Net Internal Borrowing) (311.1) (-481.3) (2,5111)(Of which, from Central Bank) (n.a.) ( 40.0) (1,570.0)
Discrepancy - 50.2 18.1
Net Intersector Transferson Capital Account (- = transfer from) -1,436.0 1,436.0 - -1,939.3 1,939.3 - -2,785.6 2,785.6 -
Note: Because the disbursals from external project loans are significantly understated in the Ministry of Finance's consolidation, the mission used external disbursals andamortizations from the IBRD debt tables, and increased the fixed and financial investments by decentralized agencies by the difference between the Finance Ministry'sestimate of net external borrowing and the mission's.
Sources: Ministry of Finance and mission estimates.

Table 5.2: ESTIMATED CONSOLIDATED PUBLIC SECTOR, 1971 and 1972
(millions of current Escudos)
1971 177 tTrraditional (of which:Central Decentralized Public Public Central Decentralized Gran Public t'aditional Public
Government Agencies Corporations Sector Government Agencies Mineria Corporation Public Rector
Current Revenues 23,607.9 17,502.2 5,693.2 46,798.3 34,369.2 30,101.6 11,845.4 50,567.8 (9,189.7) 176,884.0Direct Taxes 7,853.7 - - 7,853.7 6,116.0 - - 6,116.0Indirect Taxes 14,802.5 - - 14,802.5 26,093.6 - - - 76,093.6Sales of Goods and Services 796.0 1,076.0 5,529.4 7,401.4 544.3 2,341.3 11,349.7 49,550.6 (8,768.1) 63,785.9Rent from Assets - 689.3 48.9 738.2 677.4 583.1 - 100.0 (75.6) 1,360.5Social Taxes - 10,126.2 - 10,126.2 - 19,096.7 - - - 19.096.7Other 150.7 1,563.1 114.9 1,828.7 937.9 2,174.0 495.7 877.2 (312.5) 4,484.8Special Laws - 4,047.6 - 4,047.6 - 5,906.5 - 40.0 ( 33.8) 5,946.5
Current Expenditures 14,694.7 23,845.6 8,037.6 46,577.9 26,360.2 44,698.5 11,590.1 54,276.5 (14,440.4) 136,975.3Wages and Salaries 9,007.7 6,062.5 3,046.0 18,116.2 17,884.8 12,263.1 5,183.0 16,224.9 ( 5,699.3) 51,555.8Purchase of Goods and Services 1,507.1 2,306.0 3,499.6 7,312.7 2,890.9 3,563.0 5,553.6 32,774.5 ( 6,393.9) 44,782.0Family Allowances and Pensions 1,071.4 13,675.7 638.8 15,385.6 1,719.0 25,501.9 540.5 7,907.0 ( 1,466.6) 30,668.4Transfers to Private Sector 1,806.5 549.4 24.3 2,380.2 3,509.2 1,577.8 - n.a. (39.5)Transfers to ion-ConsolidatedPublic Sector 686.5 731.6 77.6 1,495.7 - n.a. (86.8) 9,679.1Interest Payments 615.8 206.2 171.3 993.3 356.4 313.9 980.8 (214.5) 1,651.1Other - 314.2 580.0 894.2 - 1,478.8 313.0 1,389.3 (539.8) 3,181.1
Surplus on Current Account 8,908.2 6,343.4 2,344.4 220 4 8,009.0 14,596.9 255.3 -3.708.7 (-5,750.7) -10,041.3
Net Intersector Transferson Current Account (- transfer from) -11,742.7 10,261.2 1,481.0 - -23,131.6 20,903.5 7,218.1
Capital Expenditures 5,069.4 13,122.4 3,138.5 21,330.3 7,640. 21,450.5 1,487.2 9,237.6 (2,501.1) 39.856.1Fixed Capital 3,044.4 6,396.4 2,431.5 11,872.3 6,337.4 10,569.4 761.5 6,128.6 (1,149.5) 73,796.9Purchase of Assets 20.9 290.3 24.2 335.4 69.2 958.8 - 1,000.0 (61.7) 7,028.0Transfers 108.2 563.8 9.1 681.1 8.3 202.0 200.0 (175.6) 410.3(to Private Sector) (16.4) (19.8) - (36.7) (8.3) (202.0) (200.0) (175.6) (410.3)(to Non-consolidated Public Sector) (91.8) (544.0) (9.1) (644.9)Financial Investments - 4,517.1 97.5 4,614.6 - 7,066.2 461.7 (191.6) 7,527.9(Stock) - (1,185.7) C-) (1,185.7) - (2,786.1) - - (2,786.1)(Development and Housing Loans) - (2,468.9) (97.4) (2,566.3) - (2,859.2) (461.7) (191.6) (3,320.9)(Personal Loans) - ( 862.5) ( 0.1) ( 862.6) - (1,420.9) _ _ (1,470.9)Other - 148.3 0.2 148.5 - 128.8 _ 128.8Amortization of Debt 1,895.9 1,206.5 576.0 3,678.4 1,225.9 2,565.3 725.7 1,447.3 (922.7) 5,964.7(Internal Debt) (251.7) (1,175.0) (246.2) (1,672.9) (525.6) (2,477.4) (147.2) (1,065.9) (875.5) (4,216.1)(External Debt) 1,644.2 ( 31.5) (329.9) (2,005.6) (700.3) ( 87.9) (578.5) ( 381.4) ( 47.2) (1,748.1)
Capital Revenues 403.7 2,776.0 71.0 3.250.7 842.0 4,014.5 1,588.7 161.8 6,444.7Sale of Assets - 197.2 5.4 202.6 8.1 362.5 n.a. (26.8) n.a.Loan Recoveries - 1,478.3 18.4 1,496.7 0.8 1,861.0 n.a. (23.3) n.e.Other 403,7 1,100.5 47.2 1,551.4 833.1 1,791.0 n.e. (111.7) n.a.
Deficit. Gross 17.859.2 -43.457Net Deficit (sinus.asortization) (-14,180.8) (-37,488.5)
Borrowing, Gross 17,859.2 42,890.4External Borrowing 2,780.6 4,608.7(Net External Borrowing) (775.0) (2,860.6)Internal Borrowing 15,078.6 38,281.7New Loans 17,018.2 42,220.7Cash Balances -1,939.6 -3,938.5(Net Internal Borrowing) (13,405.7) (34,065.6)(of which: from Central Bank) (15,850.0) (44,100.0
Net Intersector Transfers onCapital Account (- = transfer from) -4,596.7 4,217.6 379.1 - -5,133.0 4,569.3 - n.a. (563.7 -
Errors and Omissions - 562.3
Note: See Note on Table 5.1
Source: Ministry of Finance.

Table 5.3: CONSOLIDATED ESTIMATED PU'LIC SECTOR ACCOUNTS, 1973(billions of escudos)
Gentrgl Decentralized Grar? Public (Of ohichGovernment Agencies Mineria Corporations traditional) Total
Current Revenues lSl.l 87.2 55.6 236-8 7 r 2Direct Taxes 29.6 - - - 29.Indirect Taxes 117.5 - - _ _ 117.5Sales of Goods and Services 0.8 8.2 52.2 226.0 67.5 287.1Interest from Assets 1.9 1.6 - 0.5 0.2 4.0Social Security - 50.2 _- 50.2Special Laws - 19.9 - - _ 19.9Other 1.5 7.3 3.5 10.3 5.8 22.6
Current Exnenditures 10 .4 138.5 48.5 272.4 153.8 562.7Wages and Salaries 64i.3 43-° 14. -8EC7 Purchase of Goods & Services 19.3 20.6 21.1 154.8 io.6 215.9Family Allowances & Pensions 5.3 62.2 - - 4.1 67.5Transfers to Private Sectors 13.1 6.4 _ _ 21.0 19.5Transfer to Non-consolidated
Public Sector - - - - 1.1 -Interest Payments 1.4 0.5 - 20.2 1.0 22.1Other 5.7 13.1 10.6 - 29.4
SURPLUS ON CURRENT ACCOUNT -a.o_2 7.1 -35.6 -0.3 -1 Capital Expenditures 42.o 2L.0 12.0 h4k2 23.0 243.6Fixed Capital 33-6 45.1 3.1 33-6 5.2Purchase of Assets 0.4 o.6 - ) ) 157.9Transfers 0.8 0.5 1. 13(to Private Sector) (0.8) (0.5) (-) (-) (-) (1.3)
(to Non-consolidatedPublic Sector) (-) (-) H-) (-) C-)
Financil Assets _ 32.6 - 3.4 1.9 47.2(Development-Housing os) ) (20.9) ( ) ) (1.9) ) (27.4'(Personal Leans) (-()() )))
Other - 0.7 - 0.7Amortization 7.2 11.7 8 6 0-(Internal Debt) (2.0) (10.6) (289) (6.8) 16.06(Fxtarnal Debt) ~ ~ ~~ (.8) (66)(1,5.2) (22.1)(Rxternal Dobi) ~~~(5.2) (1.1) (640) (2.2) (0.8) (l14.5)
Caital Revenueso. 17.3 3 20S.Ile of Assets - 8.9 - 3_3 _ 12_2Toar l'enverues _- - 3 - 2.2Other 0-3 4 - 0.1 4 7
GRaSS fDEFI_ITNet Defioit (m:LiD1=awortization)
24?
GROSS BCRRCW`NG -217.9Gross
Internal, Oross (14-0)
(Net) 226.3
(203.9)
General Notes' Totals may not add due to rounding; these estimates are Particularly subject to error.Sources: Ministry of Finance and Mission Estimates.

Table 5. 4 PUBLIC INVESTMENTS BY SECTORS AND INSTITUTIONS, 1968-72 PaSe 1 of 3 pages(millions of current Escudos)
Estimated1968 1969 1970 1971 1972
I. Agriculture 622.6 998.6 1,218.7 2,348.0 4,221.41. Agricultural Development Inst. (INDAP) 99.0 125.5 135.0 370.6 712.52. Agrarian Reform Corp. (CORA) 225.9 480.4 736.1 1,335.0 2,151.03. Irrigation (Direccion de Riego) 73.3 101.8 157.1 270.5 522.04. Agricultural Marketing Ent. (ECA) 10,7 23.8 24.4 55.0 48.85. Development Corporation (CORFO) 173.3 184.2 25.3 200.0* 300.0*6. Others 40.4 82.9 140.8 116.9 487.1
II. Industry 350.7 456.2 934.8 1,025.2 5,362-21. Development Corporation (CORFO) 203.6 340.8 545.2 1,000.8 1,867.1*2. State Sugar Company (IANSA) 15.2 87.5 256.3 - -3. Navy Shipyards (ASMAR) 8.0 7.7 12.0 24.4 29.94. Petroquimica. Chilena 28.2 - - - -5. Small Industry Technical Asst.(SERCOTEC) 59.3 7.4 44.3 --
6. Intervened Firms (APS) - -- - 3,465.27. Other 36.4 12.8 - - -
III. Mining 472.2 573.4 819.5 534.9 1,173.2
1. State Mining Corp. (ENAMI) 46.8 100.5 171.9 213.6 259.32. Development Corp. (CORFO) 31.9 53.2 201.1 250.0* 150.0*3. Copper Corporation (CODELCO,Gran Mineria) 388.2 418.5 270.2 70.9 761.54. Others 5.3 1.2 176.3 0.4 2.4
IV. Fuel and Power 560.8 833.1 1,344.0 1,475.7 2,657.51. State Petroleum Co. (ENAP) 166.6 329.3 86.0 141.7 429.82. State Power Co. (ENDESA) 387.1 488.8 * 989.4* 1,124.0* 1,681.8*3. Development Corp. (CORFO) 6.3 9.1 267.0 200.0* -4. Others .8 5.9 1.6 10.0* 545.9

Table 5.4 PUBLIC INVESTMENTS BY SECTORS AND INSTITUTIONS, 1968-72 Page 2 of 3 pages
(millions of current Escudos)
Estimated1968 1969 1970 1971 1972
V. Communications 59.9 188.2 21;.7 191.5 824.01. Postal and Telegraph Service 1.9 2.5 3.2 41.5 55.42. State Telecomm. Ent. (ENTEL) 41.0 120.9 50.9 - -
3. Development Corp. (CORFO) 15.0 59.8 125.7 150.0*4. Others 2.0 5.0 37.9 - 768.6
VI. Urbanization 281.6 435.7 705.0 1,556.0 3,449.21. Dept. of Sanitary Works 72.0 120.9 173.1 422.8 837.82. Santiago Water Supply Co. 25.6 23.2 56.3 63.4 107.83. Dept. of Urban Areas (COU) 36.5 122.7 204.4 475.5 844.24. Urban Renewal (CORMU) 85.5 134.0 233.5 586.7 1,538.65. Other 62.0 34.9 37.7 7.6 120.8
VII. Education 348.7 366.2 510.4 531.8 726.51. Primary, Secondary and Special Schools 291.1 272.9 291.1 369.2 329.82. Universities 49.6 59.8 71.8 90.7 316.63. Vocational Training _ - 106.6 - 5.5
4. Others 8.0 33.5 40.9 71.9 74.6
VIII. Health 138.3 203.1 340.9 463.7 771.91. iEospital Construction Society (SCEEHH) 85.3 107.7 161.5 234.1 520.0
2. National Hospital Service (SNS) 37.1 82.5 78.8 111.1 152.73. National Medical Service for Employees
(SERMENA) 15.8 12.8 100.1 62.3 45.6
4. Other .1 .1 .5 56.2 53.6
IX. Housing 1,158.6 1,633.1 2,452.3 3,603.5 7,439.5
1. State Housing Corporation (CORVI) 665.6 900.5 1,136.8 1,987.8 3,511.82. Housing Foundation (CORHABIT) 270.6 366.7 376.0 571.9 1,170.63. Social Security Svstem (SSS) 79.3 118.5 283.9 154.3 55.5
4. Central Savings and Loan Assoc. 143.1 247.4 655.6 681.2 1,949.85. Others - - - 208.3 751.8

Table 5.4 PUBLIC INVESTMENTS BY SECTORS AND INSTITUTIONS, 1968-72 Page 3 of 3 pages(millions of current Escudos)
Estimated1968 1969 1970 1971 1972
X. General Building Construction 52.4 77.6 114.7 292.6 1,680.41. Ministry of Public Works (Div. de Arq.) 40.3 68.0 104.2 272.6 755.02. Hotels and Motels (HONSA) 6.7 - 10.5 - 8.33. Development Corp. (CORFO) 5.4 9.6 - 20.0* 10.04. Others - - - - 307.1
XI. Transportation 934.1 1,170.8 1,600.8 2,230.8 3,424.71. Ports and Maritime Transport 113.8 88.3 132.7 161.4 361.8a) Dept. of Ports (D.P. M.O.O.P.P.) 99.2 39.4 64.0 94.3 360.0b) National Ports Enterprise (EMPREPORT/EMPORCHI) 8.3 36.9 56.8 64.4 1.8*c) National Maritime Ent. (EMPREMAR) 6.3 12.0 11.9 2.7 _ *
2. Urban Transportation 27.7 4.3 315.0 929.8 1,445.1a) State Bus Co. (ETC) 3.1 4.3 21.2 14.0 87.6b) Santiago Subway - - 293.8's 915.8* 1,357.5*c) Others 24.6 - - 8.2 4.2
3. Air Transport 201.5 154.2 69.9 114.0 274.8a) Airport Construction 20.8 53.0 51.7 64.5 136.8b) Air Navigation 2.2 5.7 10.2 15.7 30.9c) National Airline (LAN) 178.5 95.5 8.0 33.8 107.1
4. Roads 431.1 660.4 802.8* 318.9* 369.6*5. Railroads 132.7 261.2 273.6 296.1 369.2*6. Other 27.3 2.4 6.8 402.4 600.0*
XII. Defense 119.3 234.9 408.5 74.5 616.9
XIII. Other 210.7 331.7 627.2 748.4 740.4
Totali/ 5,309.9 7,416.6 10,579.3 15,076.6 32,471.0
1/ Excludes personal loans and amortizations but includes financial investments.* Either rough estimate based on credit information, reallocation by mission, or taken from individual agency report when significantly
different from Ministry of Finance.= not available on individual basis not applicable or reallocated to another line item.
Sources: Ministry of Finance, some pubtic agencies and mission estimates.

Table 5.5: CURRENT OPERATIONS OF MAJOR PUBLIC TRANSPORT AGENCIES, 1968-70&(million Escudos and percent of GDP)
1968 1969 1970
Current Revenues 824.l 1,116.3 1,602.7
(Fiscal Transfers - not included) (377.2) (h62.6) (711.0)
Current Expenditures 1,195.6 1,593.3 2,317.5
Current Surplus, -371.5 -477.0 -714.8
Current Surplus/GD? () o.8 0.7 -0.8
1/ Airline, Airport, Bus, Port, Shipping and Railway Agencies
Sources: Ministry of Finance and Table 2.1

Table 5.6: CENTRAL GOVERNMENT OPERATIONS, 1965-1974(millions of current Escudos)
Est../ Budget £-1965 1966 1967 1968 1969 1970 1971 1972 1973 1974
Current Revenues 3,209.1 4,897.9 6,312.2 8,757.6 13,068.6 19,309.2 23,924.4 38,375.1 200,200 1,400,067.1Current Expenditures 2,609.3 3,677.8 4,696.4 6,530.9 9,142.1 15,360.2 26,395.7 50,799.9 220,100 1,031,791.0(of which transfers) (1,368.7) (1,915.7) (2,324.4) (3,511.7)(4,661.5) ( 7,748.7) (15,265.1)(29,667.9)(134,150 )( 568,669.8)
Savings on Current Account 599.8 1,220.1 1,615.8 2,226.7 3,926.5 3,949.0 -2,471.3 -12,424.8 -19,90 368,276.1
Capital Revenues - - - 0.4 112.3 225.6 510.7 1,017.8 12,800 12,233.0
Capital Expenditures 1,160.5 1,715.1 1,836.0 2,600.4 3,682.8 5,391.3 8,165.0 12,924.7 74,600 583,802.8(Direct Investment) (600.4) ( 820.2) (872.1) (1,155.6)(1,657.4) (2,495.4) (3,065.3)( 6,406.6) 34,000) (260,825.5)(Capital Transfers) (560.1) ( 894.9) (936.9) (1,444.8)(2,025.4) (2,895.9) (5,099.7)( 6,518.1) (40,600) (322,977.3)
Deficit -560.7 -495.0 -220.2 -373.3 356.0 -1,216.7 -10.125.6 -24,331.7 -81,700 -203,293.7
Borrowing, net 560.7 495.0 220.2 373.3 -406.3 1,198.7 10,125.6 24,331.7 81,700 209,276.0External, net 352.1 353.5 -75.4 -117.3 -369.7 -1,069.9 -1,445.7 - 602.8 5,300 120,308.2Disbursals 461.3 500.3 170.5 257.2 258.5 125.4 198.5 97.5 60 202,608.2Repayments -109.2 -146.8 -245.9 -374.5 -628.2 -1,195.3 -1,644.2 -700.3 5,360 -82,300.0
Internal, net 208.6 141.5 295.6 490.6 -36.6 2,268.6 11,571.3 24,934.5 87,000 88,967.8Disbursals 321.3 295.1 401.6 677.2 548.0 2,439.2 11,872.6 27,560.2 94,350 91,000.0Cash Balance Changes 10.3 -6.8 -13.4 -10.1 -303.0 74.0 -49.6 -2,100.1 5,400 -Repayments -123.0 -146.8 -92.6 -176.5 -281.6 -244.6 -251.7 -525.6 -1,950 -2,032.2
Discrepancy - - - - 50.3 18.0 - - - -5,982.3
1/ Because the estimated 1973 figures are particularly subject to error, they have been rounded off so as not to falsely indicate an exactitude not wsrrantcdby the data. The gross internal borrowing, for example, is a residual.
2/ Revised Budget based on 80 percent December-December inflation rate.
Source: Ministry of Finance.

Table 5.7: CENTRAL GOVERNMENT REVENUES, 1965-1974
(millions of current Escudos)
Revised 2J1965 1966 1967 1968 1969 1970 1971 1972 Provisional Budget
1973 1974
Current Revenues 3,209.1 4,897.9 6,312.2 8,757.6 13,068.6 19,309.2 23,924.4 38,375.1 200,183.4 1,412,300
Tax Revenues 3,041.6 4,629.6 6,051.1 8,367.0 12,488.5 18,316.8 22,656.2 36,145.3 198,526.2 1,048,446
Direct Taxes 1,363.5 2,117.9 2,711.5 3,434.9 5,068.0 7,664.4 7,853.7 10,047.6 62,053.0 320,126
Personal Income Taxes 280.7 473,P 691.7 921.5 1,374.8 2,130.3 3,600.2 5,478.1 49,479. 1k 211,607-/Business Income Taxes 354.5 478.3 670.8 816.7 1,116.9 1,634.9 2,493.6 2,779.3 4,476.52/ 20,2972/Large Copper Mining Taxes 407.0 808.9 931.9 1,162.1 2,015.9 3,100.7 497.5 120.2 2,602.0 - 3/Property Taxes 321.3 356.9 417.1 534.6 560.4 798.5 1,282.4 1,605.9 5,181.3 78,5524/Other - - - - - - - 64.1 294.1 9,669
Indirect Taxes 1,678.1 2,506.7 3,339.6 4,932.1 7,420.5 10,652.4 14,802.5 26,097.7 136,493.2 728,320
Transactions Taxes 767.5 1,117.2 1,595.2 2,260.9 3,367.7 4,745.0 7,650.2 13,325.1 68,205.9 366,916Production Taxes 229.5 296.9 429.0 636.5 930.3 1,383.3 1,921.9 4,442.3 24,769.7 176,108Service Taxes 179.0 299.1 389.2 642.1 951.9 1,350.6 1,634.4 2,665.4 11,872.8 31,615Import Taxes 347.2 549.0 664.0 986.3 1,415.5 2,047.6 2,336.1 3,776.3 23,543.1 111,166Stamps Taxes 142.5 226.7 251.7 394.0 693.1 991.6 1,251.9 1,878.4 9,049.3 39,776Other 12.4 17.8 10.5 12.2 26.0 134.3 8.0 10.2 52.4 2,740
Non Tax Current Revenues 132.0 223.8 261.1 390.6 580.1 992.4 1,268.2 2,229.8 1,657.2 363,854
(Copper Differential) (342,514).3/
Non Current Revenues - - _ 0.1 112.3 225.6 510.7 1,017.8 12,846.7 -
Total Revenues 3,209.1 4.897.9 6,312.2 8,757.7 13,180.9 19,534.8 24,435.1 39,392.9 213,030.1 1,412,300
1/ Assuming 80 percent inflation, December to December; see table 5.9 for mission estimates of further inflation.2/ Proportional distribution between corporate and personal income tax estimated by mission.
3/ Literally all revenues from copper mines were expected to come from foreign exchange differential during 1974.
4/ Includes EO 12,233 million from net worth tax that will be owed :tn 1974 but paid in February 1975.Source: Ministry of Finance, Budget Office for 1965-1972 and 1973; Ministry of Finance, Internal Revenue Office for 1973 and mission estimates.

cable 5.8: GOVERNMENT ESCUDO CURRENT REVENUES, 1968-1973(thousand Escudos)
Revenue 1968 1969 1970 1971 1972 1973
Total Current Revenues 8,785,885.6 12.790.411.2 19.344.864.4 23.564.383.4 38.811.762.1 208,031,152.6
1...c. Taxes 2,840,675.8 4,300,689.5 6,556,282.7 6,337,151.9 8,501,896.2 56,851,706.8
I..c.e Tax Law 1,576,677.5 2,291,629.6 3,531,118.7 5,732,944.0 7,997,590.8 53,670,394.5
First Category, Personal 191,505.2 240,261.3 276,133.3 546,100.7 694,056.8 2,738,239.7First Category. Corporate 239,677.1 383,429.0 710,752.6 967,256.1 878,459.3 2,199,008.6First Category, Others 17,714.7 24,577.8 29,378.2 196,326.0 92,213.0 128,445.6Second Category 405,352.5 573,750.7 900,009.1 1,472,196.2 2,652,157.9 19,574,262.8Global Complenentary 445,759.3 699,364.5 1,072,494.0 1,844,633.5 2,858,116.8 1,760,125.3Capital Gains 11,574.9 15,800.2 19,892.3 28,425.9 100,734.1 156,563.5Additional 136,900.6 194,566.5 338,493.3 287,087.0 349,533.0 1,214,950.3Deferred 128,193.2 159,879.6 184,965.9 390,918.6 372,319.9 482,318.0Provisional Payments - - . - - 25,106,480.7
Substitute Income Tacos 17,959.8 29,447.7 45,476.4 56,738.4 75,703.0 285,167.3
Other Non Copper In-me Taxes 40,250.8 62,795.2 61,519.2 68,565.9 123,476.8 294,133.4
From Copper Mines 1,205,787.7 1,916,817.0 2,918,168.4 478,903.6 305,125.6 2,602,013.6(exchange rate) (6.9) ( 9.2) (11.7) (12.2) (18.2) (110.5)
Property 520,127.6 553,180.5 778,917.8 1,263,379.9 1,595,555.5 5,181,256.7
Real Estate 267,590.3 376,427.9 501,683.4 662,566.4 791,678.8 2,062,335.9Net Worth 140,739.0 70,858.0 132,914.3 313,403.3 395,678.7 1,458,639.4Vehicles 59,515.7 77,484.7 114,118.5 175,839.5 369,699.9 1,392,829.1Infrastructures and gifts 14,421.6 19,847.0 21,731.0 38,642.1 34,376.0 103,459.7Others 37,861.0 8,562.9 8,470.6 72,928.6 4,132.1 163,992.6
Legal Stoops 444,022.4 776,247.7 1,123,411.8 1,435,330.7 2,172,220.9 8,049,323.5
Transactions of Goods and Services 2,836,441.9 4,230,304.2 6,051,723.2 9,210,328.3 16,116,747.7 80,078,685.8
Transactions of Goods, basic law 2,240,841.0 2,349;682.9 4,790,782.4 7,614,309.1 13,151,937.2 66,777,515.3Other Goods Trans.actions 16,713.7 26,525.9 51,386.5 65,524.3 406,420.0 1,428,401.8Transactions of Services, basic lao 340,754.3 522 173.1 741,731.8 1,010,146.4 1,576,585.3 6,977,212.4Other Service Transactions 238,132.9 331,922.3 467,822.5 520,348.5 981,805.2 4,895,556.2
Production 636,825.0 918,739.1 1,366,464.8 1,834,233.5 4,202,525.7 24,769,710.0
Hydroe srbos 262,909.6 382,766.7 537,200.7 645,730.1 1,019,602.3 7,064,112.3Alcoholic Beverages 61,088.8 83,931.8 115,145.9 777,838.8 1,693,128.1 9,158,161.7Tobacco, Cigars and Cigarettes 310,525.2 446,718.3 708,579.5 906,668.0 1,470,2128.8 5,806,082.3Others 2,301.4 5,322.3 5,538.7 3,096.6 19,576.5 2,741,353.7
Imports 1,376,411.7 1,850,940.6 3,274,510.9 3,210,385.8 5,735,232.9 31,390,806.4
Other Taxes 6,447 7 7,436.0 14,117.3 81,029.6 33,539.0 52,c45.7
Interest and fines 124,933.5 152,873.6 179,435.9 192,543.7 454,044.2 1,657,215.7
Note: The public accounts of Chile are kept in both Escudos and U.S. dollars. The majority of oIrrent fiscal revenues received in dollars came from themajor copper nines. This table, useful for checking the performance of individual taxes, includes all Escudo revenues and the U.S. dollar revenuesfrom the major copper mines changed into Escudos at the indicated rate. Because minor dollar revenues are excluded, there is a slight discrepancybetween this table's totals and those of 5.7, which include all dollar revenues.
Source: Internal Tax Service, Ministry of Finance.

Table 5.9: MONETARY ADJUSTIENT INDICES FOR SOME MAJOR TAXES, 1967-1974(1969 100.0)
1967 1968 1969 1970 1971 1972 1973 1974
Tax Adjustment Indices:Income Tax 64.1 78.2 100.0 129.3 174.4 213.0 426.o 2129.8Stamp Tax 67.3 78.7 100.0 128.9 17h.8 203.6 494.9 247h.5Urban Land Tax 67.8 80.0 100.0 130.0 168.7 204.3 286.3 2862.8Rural Land Tax 82.6 90.9 100.0 115.0 126.5 136.6 273.2 7923.5
Inflation Indices:Official Consumer Price Index 60.4 76.5 100.0 132.5 159.1 282.9 1281.0 5329.22!Official Wholesale Price Index 56.2 73.3 100.0 136.1 160.5 272.9 1686.6 8127.6?/Mission's GDP Deflator n.a. n.a. 100.0 139.9 206.2 473.7 2482.0 8o46.7i/
1/ Assumes 150 percent inflation from December to December2/ Assumes 100 percent inflation from December to December
Note: These indices are relatively useful when examining the 1969-1973 tax performance, since their useis only valid if there is no change in tax rateso Since in 1974 there were substantial changesin tax rates, a comparison between the indices only reveals the tax effect that would have occurredwithout rate changes.
Sources: Ministry of Finance, National Statistics Institute and mission estimates

Table ,. 10: CENTRAL GOVERNMENT EXPENDITURES, 1965-1973
(millions of current Escudos)
Prel.
1965 1966 1967 1968 1969 1970 1971 1972 1973
Current Expenditure 2,609.3 3,677.8 4,696.4 6,530.9 9,142.1 15,360.2 26,395.7 50,799.9 219,126.7
Wages and Salaries 899.9 1,324.3 1,744.4 2,343.9 3,400.5 -,982.7 9,007.7 17,884.7 64,340.3
Purchase of Goods and Services 270.2 374.7 452.5 477.4 713.0 1,085.5 1,507.2 2,890.9 19,273.5
Social Security Contributions,
Pensions and Family Allowances 473.8 695.1 825.6 1,173.1 1,524.9 2,705.9 5,692.6 10,079.6 30,350.0
Transfer Payments to Public Sector 768.5 1,037.4 1,237.9 1,893.8 2,491.7 L,136.8 7,765.9 16,079.1 90,641.1
Transfer Payments to Private Sector 126.4 183.2 260.9 444.8 644.9 906.0 1,806.6 3,509.2 13,161.0
Interest Payments 70.5 63.1 175.1 197.9 367.1 543.3 615.7 356.4 1,360.8
Capital Expenditure 1,392.7 2,008.7 2.174.5 3,151.4 4,592.6 6,831.2 10,060.9 14.150.6 81.,912.2
Investments 1,160.5 1,715.1 1,836.0 2,600.4 3,682.8 5,391.3 8,165.0 12,924.7 74,597.9
Direct Investments 600.4 820.2 872.1 1,155.6 1,657.4 2,495.4 3,065.3 6,406.6 33,999.9
Capital Transfers 560.1 894.9 936.9 1,444.8 2,025.4 2,895.9 5,099.7 6,518.1 1.0,598.0
Debt Amortization 232.2 293.6 338.5 551.0 909.8 1,439.9 1,895.9 1,225.9 7,314.3
External 109.2 146.8 245.9 374.5 628.2 1,195.3 1,644.2 700.3 5,364.6
Internal 123.0 146.8 92.6 176.5 281.6 244.6 251.7 525.6 1,949.7
Total Expenditure 4,002.0 5,686.5 6,870.9 9,680.9 13.734.7 22,191.4 36,456.6 64,950.5 301,038.9
Source: Ministry of Finance.

Table 5. 11: CURRENT TRANSFERS AND SUBSIDY PAYMENTS OF CENTRAL GOVERNMENT, 1965-1974
(millions of current Escudos)
Provisional Est. Budget1965 1966 1967 1968 1969 1970 1971 1972 1973 1974
J. Social Security Payments Pensions 473.8 695.1 825.6 1.173.1 1,524.9 2.705.9 5.692.6 10,079.6 30,350.0 40.202and Family Allowance
Social Security Funds 316.7 494.6 590.0 867.9 1,140.7 2,046.6 n.a. n.a. 25,851.0* 30,787Pensions 90.0 113.9 129.4 179.1 224.0 405.6 n.a. n.a. 2,500.0* 3,648Family Allowances 67.1 86.6 106.2 126.1 160.2 253.7 n.a. n.a. 1,909.5 5,767
II. Transfers to Public Sector 768.5 1,037.4 1,237.9 1,893.8 2.491.7 4.136.8 7,765.9 16,079.1 90.641.1 166.428
Traditional State Economic Enterprises 239,8 305.3 339.8 615.1 795.5 1,183.3 2,367.6 4.210.0 33.896.2 42.914Railroads 134.9 169.7 178.5 246.7 302.1 479.6 865.5 1,251.3 4,148.8 104National Airline (LAN) 7.1 10.5 8.5 19.2 27.3 60.0 114.2 76.6 350.1 -Maritime Transport (EMPREMAR) 8.1 8.2 5.2 18.4 28.8 40.4 58.7 112.9 310.8Public Bus lompany (ETC) 23.7 25.8 36.1 40.1 46.' 86.6 106.1 169.9 544.1 -Port Company (EMPREPORT/EMPORCHI) 28.8 27.7 29.3 48.3 55.8 40.5 185.0 284.7 893.7 488Agricultural Institutions 27.7 54.9 64.1 199.4 272.4 403.6 886.1 2,142.8 26,820.7 -
(Agrarian Reform - CORA) (9.0) (15.4) (29.7) (38.4) (45.8) (56.0) (128.6) (472.6) (1,751.8) 2,234(Agrarian Development Institute -INDAP) (17.0) (28.2) (18.2) (27.3) (43.7) (86.0) (270.6) (577.6) (1,931.2) 3,205(Ag. & Livestock Service - SAG - - (64.4) (94.4) (133.2) (363.0) (558.6) (2,386.1) 3,251(Ag. Marketing Inst. - ECA) (1.7) (1.4) (0l.3) (:0.0) (60.0) (85.0) - 100.0 (18,020.1) 26,000(Others) - (12.9) (15.7) (19.1) (28.5) (43.4) (123.9) (434.0) 2,731.5) 7,632
State Mining Company lENAMI) 9.5 8.5 18.1 43.0 62.9 72.6 152.0 171.8 828.0 -
Economic Development Institutions 37.0 46.8 17.7 32.5 57.3 113.0 252.1 515.5 2.461.3 11.008Development Corporation (CORFO) 21.2 32.4 - - - - 7.7 - 427.0 7,875Public Housing 15.8 14.4 17.7 32.5 67.3 113.0 244.4 515.5 2,034.3 -
(Housing Corpn. - CORVI) (9.1) (4.3) - ( .5) ( .5) ( .7) - (28.7) (303.0) 446(Housing Foundation - CORHABIT) (6.7) (10.1) (17.7) (26.5) (32.8) (63.4) (154.4) (313.7) 1,011.8) 1,105(Other) - - - (5.5) (34.0) (48.9) (90.0) (173.1) (719.5) 1,582
Health Institutions 313.2 424.8 531.7 652.9 944.4 1.496.8 2.564.8 5.731.5 27,055.4 55.952
National Health Service (SNS) 306.1 415.2 523.7 641.1 931.5 1,477.1 2,511.7 5,655.0 26,843.3 55,718Med. Service for Employees (SERMENA) 5.1 8.0 6.8 7.4 7.6 18.0 33.8 63.2 50.0 -Others 2.0 1.6 7.2 4.4 5.3 1.7 19.3 13.3 162.1 234
Educational Institutions 121.3 181.9 232.1 315.0 458.4 706.5 1,227.3 2.397.9 9.461.4 12.780University of Chile 96.3 141.7 181.0 251.1 361.5 562.3 946.6 1,815.4 7,099.7 9,030State Technical University 23.5 34.3 42.0 53.9 84.7 134.6 264.0 563.1 2,276.5 2,750Scho- 1 Construction Societies 1.5 5.9 9.1 10.0 12.2 9.6 16.7 19.4 85.2 1,000
Municipalities 26.7 33.4 54.1 68.6 89.1 193.1 375.1 L255.5 5.088,3 12.124
Miscellaneous 30.5 45.2 62.5 209.7 137.0 444.1 979.0 1.968.7 1267 al/ 31.6',
III.Transfers to Private Sector 126.4 183.2 260.9 444.8 644.9 906.0 1.806.6 3,509.2 13,161.0 22,96
Private Education 61.4 86.4 140.9 212.4 331.4 530.4 n.a. n.a. 7,466.5 10,414Other 65.0 96.8 120.0 232.4 313.5 375.6 n.a. n.a. 5,694.5 12,382
Total Transfer and Subsidy Payments 1,368.7 1.915.7 2,324.4 3,511.7 4,661.5 7,748.7 15.265.1 29,667.9 134.152.1 229,426
i/Almost EO 2,000 million of the increase sent to a newly-established forestry corporation.2/ Includes EO 5,279.2 million transferred through Ministry of Defense in December 1973 for unknown purposes.* Estimated arbitrarily by mission
Note: In 1974, the budget outlays in U.S. dollars converted to Escudos at 750 to 1.
Sources: Ministry of Finance and mission estimates.

Table 5.12 GOVERNMENT CAPITAL TRANSFERS TO DECENTRALIZED AGENCIES, 1968-1974
(millions of current Escudos)
Prov. Est.3/1968 1969 1970 1971 1972 1973 1974
Transport 128.0 219.3 272.4 254.3 362.0 1,637.3 14,821.61. Railroads 90.8 143.0 151.2 169.9 324.2 1,242.0 6,783.02. Maritime Enterprise (EMPREMAR) 5.7 7.4 9.6 9.8 1.3 - -
3. Ports (EMPREPORT/EMPORCHI) 6.8 26.3 74.0 46.0 31.0 229.9 1,763.64. Airlines (LAN) 21.0 26.0 7.7 11.1 1.8 - -5. Others 3.7 16.6 29.9 17.5 3.7 165.4 6,275.0
Agriculture 249.2 380.1 623.1 1,064.1 1.180.8 3,785.7 50,764.71. Agrarian Reform (CORA) 151.4 266.2 389.5 932.1 1,098.0 3,439.2 35,751.82. Agricuiltural Development (INDAP) 66.5 78.5 100.0 70.6 10.0 85.1 9,160.63. Agricultural Marketing (ECA) 6.5 6.6 18.9 9.5 5.7 - 1,233.34. Agricultural Service (SAG) 9.8 12.5 28.2 34.6 52.6 221.0 2,090.55. Others 15.0 16.3 86.5 17.3 14.5 40.4 2,528.5
Housina 318.6 398.9 363.3 898.2 1,615.2 11,558.8 67.425.01. CORVI 112.3 215.7 203.4 579.3 1,056.3 7,795.2 51,875.22. CORHABIT 178.8 183.2 159.9 318.8 488.9 1 967.4 15,549.83. Others 27.5 - - .1 70.0 1,796.22/ -
Education 52.8 57.3 64.8 83.7 678.7 4,146.6 21,038.51. University of Chile 20.5 24.7 39.9 34.7 403.9 2,115.4 6,166.42. U. Tecnica 10.6 8.2 10.4 24.5 122.2 562.0 2,343.23. School Construction (SSCCEE) 21.7 24.4 14.5 24.5 152.5 1,469.2 12,528.9
Social Institutions 28.0 63.5 63.7 120.4 256.3 2,400.8 22,306.61. Health (SNS) 28.0 35.2 44.0 54.7 70.5 275.3 2,412.02. Hospitals (SSCCHH) - 28.3 39.7 65.7 185.8 - 19,894.63. Others - - - - - 2,12S.5 -
Urban Aftairs and Regional Development 61.7 145.2 322.4 1,176.3 1,609.4 8,799.2 66,435.3
1. CORMU 60.3 93.6 168.6 407.2 694.1 3,794.0 17,265.92. COU - 51.6 150.5 432.7 486.4 3,672.1 22,200.03. Regional Ccrperations 1.4 - 3.3 336.41/ 428.9 1,333.12/ 26,969.4
Development Finance 546.7 648.9 964.4 1,315.6 222.6 3,211.1 54,264.31. CORFO 546.7 648.9 964.4 1,315.6 222.6 3,211.1 54,264.3
Others 59.8 105.2 185.8 170.8 584.8 5.058.5 25,941.3
Total 1.444.8 2,018.4 2,879.9 5,083.4 6,509.8 40,598.0 322,997.3
1/ Increase due to trans5ers to new provincial development corporation.; virtually all their operations were in vrban areas.2/ EO 3,129.3 million unallocated from Ministry of Housing and Irban Development arbitrarily split between Housing and Urban
Development prcportionate to other transfers of Ministry.3/ Original budget estimate was EO 261,900.8 million; this estimate uses later global estimate made by Treasury Ministry which
assumed 80 percent inflation rate and average exchange rate of EO 555,0 to the U.S. dollar, prorating the allocationsproportionate to their earlier share.
Source: Ministry of Finance.

VI. BANKING


Table 6.1: SUMMARY ACCOUNTS OF THE BANKING SYSTEM
(In billions of Escudos)
1968 1969 1969 1970 1971 1971 1972 1972 1973 Sep. 1973 Dec.US$ = E
09.88 US$ = E
012.21 US$ = E
025.00 US$ = E
088.75
A. Net International Reserves 0.35 2.15 2.65 4.16 0.47 0.96 -7.24 -25.68 -42.18 -51.671. Assets 2.89 4.33 5.34 6.10 3.70 7.58 6.20 22.01 18.79 33.122. Liabilities -2.54 -2.18 -2.69 -1.94 -3.23 -6.62 -13.44 -47.69 -60.97 -84.79
C. Domestic Credit 7.37 8.37 8.09 12.36 30.03 30.20 84.78 117.40 231.10 387.391. To Government (net) 6.57 6.08 7.38 9.14 20.59 31.79 58.21 117.00 166.65 240.032. To Official Entities (net) -0.63 -0.80 -0.68 -0.63 2.59 4.66 13.99 31.98 36.29 112.873. To Private Sector 5.00 6.10 6.33 8.20 12.64 13.39 30.42 32.93 51.79 88.654. Official Capital and Surplus -0.44 -0.61 -0.63 -0.94 -2.64 -3.21 -6.29 -9.16 -12.23 -34.835. Revaluation Accounts (net) -2.53 -2.13 -3.57 -3.00 -1.52 -10.01 -6.75 -2.40 37.34 27.326. Net Unclassified Assets -0.65 -0.28 -0.74 -0.22 -1.01 -5.70 -3.95 -54.48 -53.96 -26.36
a. Import advance deposits (-0.09) (-0.05) (-0.05) (-0.01) (-0.01) (-0.01) (-0.01) (--) (--) (--)
b. Sales of forward exchange (-0.85) (-1.00) (-1.23) (-0.75) (-0.91) (-1.86) (-5.04) (-17.91) (-35.96) (-26.85)c. Other deposits (-0.03) (-0.09) (-0.10) (-0.05) (-0.31) (-0.31) (-2.76) (-5.11) (-8.43) (-32.36)d. Other (0.32) (0.86) (0.64) (0.59) (0.22) (-3.52) (3.86) (-31.46) (-9.57) (32.85)
7. Interbank Float 0.05 0.01 0.01 -0.19 -0.62 -0.68 -0.85 1.53 5.22 -20.29
D. Medium-and Long-Term Foreign Liabilities -- -' -- -- -- -- 3.81 13.52 14.96 16.56
F. Liabilities to Private Sector 7.72 10.51 10.74 16.52 30.50 31.20 73.73 78.20 173.96 319.161. Money Supply 4.48 6.07 6.07 10.05 21.52 21.52 54.21 54.21 135.09 229.18
a. Currency in circulation (1.70) (2.36) (2.36) (4.38) (8.97) (8.97) (28.23) (28.23) (76.44) (95.66)b. Demand deposits in local currency (2.78) (3.71) (3.71) (5.67) (12.55) (12.55) (25.98) (25.98) (58.65) (133.52)
2. Quasi-Money 3.24 4.44 4.67 6.47 8.98 9.68 19.52 23.99 38.87 89.98a. Deposits in local currency (1.89) (2.84) (2.84) (4.32) (8.32) (8.32) (17.77) (17.77) (31.71) (85.79)b. Deposits in foreign currency (0.55) (0.65) (0.80) (0.87) (0.66) (1.36) (1.75) (6.22) (7.16) (4.19)c. Capital and surplus (0.80) (0.96) (1.03) (1.28) ( -- ) ( -- ) ( -- ) ( -- ) ( -- ) ( --
Source: Central Bank of Chile, IBRD estimates.

Table 6.2: SUMMARY ACCOUNTS OF THE CENTRAL BANK
(In billions of Escudos)
1968 1969 1969 1970 1971 1971 1972 1972 1973 Sep. 1973 Dec.US$ = E
09.88 US$ = E
012.21 US$ = E
025.00 US$ = Eo88.75
A. Net International Reserves 0.38 2.05 2.54 4.02 1.13 2.31 -2.74 *-9.72 -22.10 -23.391. Assets 2.36 3.73 4.61 5.27 3.22 6.60 4.87 17.28 14.93 26.762. Liabilities -1.98 -1.68 -2.07 -1.25 -2.09 -4.29 -7.61 -27.00 -37.03 -50.15
C. Domestic Credit 3.24 3.32 2.88 4.74 22.02 21.02 71.50 91.00 227.75 380.821. To Government (net) 5.79 5.38 6.66 7.86 18.98 29.96 57.51 115.10 168.66 266.112. To Official Entities (net) 0.52 0.89 0.78 1.15 5.88 7.36 23.91 37.86 47.01 142.243. To Banks 0.44 0.66 0.66 0.69 1.87 1.88 6.99 7.01 5.19 8.474. To Private Sector 0.51 0.51 0.60 0.75 1.29 1.60 5.73 6.97 24.56 41.305. Official Capital and Surplus -0.16 -0.30 -0.30 -0.51 -0.81 -0.81 -2.72 -2.71 -5.25 -8.346. Revaluation Accounts (net) -2.53 -2.13 -3.57 -3.00 -1.52 -10.01 -6.75 -2.40 37.34 27.327. Net Unclassified Assets -1.33 -1.49 -1.96 -2.20 -3.67 -8.97 -13.17 -70.83 -49.76 -96.28
a. Import advance deposits (-0.09) (-0.05) (-0.05) (-0.01) (-0.01) (-0.01) (-0.01) ( -- ) ( -- ) ( --b. Sales of forward exchange (-0.84) (-1.00) (-1.23) (-0.75) (-0.91) (-1.86) (-5.04) (-17.91) (-35.96) (-26.85)c. Other Deposits (-0.03) (-0.09) (-0.10) (-0.05) (-0.31) (-0.31) (-2.76) (-5.11) (-8.43) (-32.36)d. Other (-0.35) (-0.35) (-0.57) (-1.39) (-2.45) (-6.79) (-5.36) (-47.81) (-5.37) (-36.80)
D. Medium- and Long-Term Foreign Liabilities -- -- -- -- -- -- 3.81 13.52 14.96 16.56
E. Liabilities to Banks 1.81 2.70 2.74 3.80 12.81 13.00 34.52 37.32 108.14 232.96
F. Liabilities to Private Sector 1.81 2.67 2.67 4.96 10.33 10.33 30.44 30.44 82.55 107.911. Currency in Circulation 1.70 2.36 2.36 4.38 8.97 8.97 28.23 28.23 76.44 95.662. Demand Deposits 0.01 0.01 0.01 0.02 0.25 0.25 0.10 0.10 0.30 0.613. Savings Certificates 0.10 0.30 0.30 0.56 1.11 1.11 2.11 2.11 5.81 11.64
Source: Central Bank of Chile, IBRD estimates.

Table 6.3: SUMMARY ACCOUNTS OF THE BANCO DEL ESTADO
(In billions of Escudos)
1968 1969 1969 1970 1971 1971 1972 1972 1973 Sep. 1973 Dec.US$ = E°9.88 US$ = E
012.21 USS = 25.00 US$ = 88.75
A. Net International Reserves -0.14 -0.05 -0.06 -0.13 -0.42 -0.87 -3.71 -13.16 -15.30 -21.011. Assets 0.07 0.09 0.11 0.17 0.08 0.16 0.27 0.95 0.82 1.992. Liabilities -0.21 -0.14 -0.17 -0.30 -0.50 -1.03 -3.98 -14.11 -16.12 -23.00
B. Claims on Central Bank 0.75 1.05 1.06 1.03 4.30 4.30 15.87 18.98 51.54 100.271. Currency in Vaults 0.21 0.24 0.24 0.37 0.65 0.65 2.26 2.26 7.02 11.272. Deposits 0.54 0.79 0.79 0.65 3.65 3.65 10.50 13.33 38.14 87.473. Central Bank Notes -- 0.02 0.02 0.01 -- -- 3.00 3.00 -- --4. Liquidation of Exchange Operations -- -- -- -- -- -- 0.11 0.39 6.38 1.53
C. Domestic Credit 1.38 1.58 1.69 3.35 5.95 6.52 11.81 18.85 - 0.28 18.761. To Government (net) 0.66 0.53 0.51 1.OL 1.50 1.51 0.72 0.86 - 3.07 -26.212. To Official Entities (net) -1.04 -1.28 -1.24 -1.48 -3.03 -2.36 -8.93 - 5.03 - 8.68 -35.643. To Private Sector (net) 1.93 2.42 2.46 3.44 6.40 6.56 14.80 15.37 13.95 29.864. Official Capital and Surplus -0.28 -0.31 -0.33 -0.43 -0.51 -0.65 -0.81 - 1.78 - 1.63 - 9.855. Net Unclassified Assets 0.11 0.32 0.29 0.72 1.59 1.46 6.03 9.43 - 0.85 60.60
E. Liabilities to Central Bank 0.20 0.25 0.25 0.32 1.59 1.59 5.22 5.23 3.90 7.59
F. Liabilities to Private Sector 1.79 2.43 2.44 3.93 8.23 8.37 18.76 19.44 32.06 90.431. Demand Deposits 0.49 0.56 0.56 1.02 2.50 2.50 5.83 5.83 11.31 22.672. Time Deposits 0.04 0.05 0.05 0.10 0.47 0.47 0.97 0.97 2.13 1.693. Savings Deposits 1.23 1.78 1.78 2.74 5.13 5.13 11.70 11.70 18.02 65.55
a. Sight Deposits (0.27) (0.34) (0.34) (0.48) (1.09) (1.09) (1.98) (1.98) ( 3.93) ( 4.89)b. Term Deposits (0.96) (1.44) (1.44) (2.26) (4.04) (4.04) (9.72) (9.72) (14.09) (60.66)
4. Deposits in Foreign Currency 0.03 0.04 0.05 0.07 0.13 0.27 0.26 0.94 0.60 0.52
Source: Central Bank of Chile, IMF and IBRD estimates

Table 6.4: SUMMARY ACCOUNTS OF THE CCMMERCIAL BANKS
(In billions of Escudos)
1968 1969 1969 1970 1971 1971 1972 1972 1973 Sep. 1973 Dec.US$ 5 E0
9.88 US$ = E012.21 Us$ = E025.00 US$ = E°88.75
A. Net International Reserves 0.11 0.14 0.18 0.27 -0.24 -0.49 -0.79 -2.80 -4.78 - 7.271. Assets 0.46 0.50 0.63 0.66 0.40 0.82 1.06 3.78 3.04 4.372. Liabilities -0.35 -0.36 -0.45 -0.39 -0.64 -1.31 -1.85 -6.58 -7.82 -11.64
B. Claims on Central Bank 2.56 7.88 7.98 17.65 19.74 61.79 112.631. Currency in Vaults 0.24 0.36 0.36 0.47 0.78 0.78 3.25 3.25 10.64 29.112. Deposits 0.85 1.24 1.27 2.07 6.73 6.83 13.30 14.25 39.13 79.963. Central Bank Notes -- 0.05 0.05 0.02 0.36 0.36 0.65 0.65 0.47 0.244. Liquidation of Exchange Operations -- -- -- -- -- -- 0.45 1.59 11.55 3.32
C. Domestic Credit 3.16 4.04 4.20 5.16 4.58 5.30 9.34 13.06 3.63 16.341. To Governnent (net) 0.13 0.16 0.20 0.18 0.11 0.32 -0.02 1.04 1.06 0.132. To Official Entities (net) -0.11 -0.21 -0.23 -0.30 -0.26 -0.34 -0.99 -0.85 -2.04 6.273. To Private Sector (net) 2.56 3.17 3.27 4.01 4.95 5.23 9.89 10.59 13.28 17.494. Central Bank Shares 0.02 0.02 0.02 0.02 0.03 0.03 0.03 0.03 0.03 0.045. Capital and Surplus -- -- -- -- -1.32 -1.75 -2.76 -4.67 -5.35 -16.646. Net Unclassified Assets 0,56 0.89 0.93 1.26 1.08 1.81 3.19 6.92 -3.35 9.05
E. Liabilities to Central Bank 0.24 0.41 0.41 0.36 0.28 0.29 1.67 1.68 1.29 0.88
F. Liabilities to Private Sector 4.12 5.41 5.64 7.63 11.94 12.50 24.53 28.32 59.35 120.821. Demand Deposits 2.28 3.13 3.13 4.63 9.80 9.80 20.05 20.05 47.04 110.242. Time Deposits 0.52 0.71 0.71 0.92 1.61 1.61 2.99 2.99 5.75 6.913. Deposits in Foreign Currency 0.52 0.61 0.76 0.80 0.53 1.09 1.49 1.49 6.56 3.674. Capital and Surplus 0.80 0.96 1.03 1.28 -- -- -- -- --
Source: Central Bank of Chile, IMF and IBRD estimates

Table 6.5 : GROSS BANK CREDIT OUTSTANDING TO SELECTEDPUBLIC ENTITIES, 1970, 1971 and 19731/
(millions of Escudos at year-end)
Public Corporation 1970 1971 1973 1973/1970
CAP (Steel Corp.) 180 1.,426 23,577 131
Soquimdich (Chemical Corp.) 149 701 3,390 23
ECA (Marketing Corp.) 513 909 61.,404 120
ENAMI (Small Mines Corp.) 14 832 8,102 579
CODELCO (Large Mines Corp.) - 19 11,922 627Z/
CORA (Agrarian Reform Corp.) 330 558 2,841 9
INDAP (Agricultural Dev. Inst.) 95 408 6,193 65
CORFO (Development Corp.) 165 1,292 449,630 270
ENDESA (Electricity Corp.) 13 167 10,543 811
ENAP (Petroleum Corp.) - 210 20,931 l0O/
Intervened Firms 595 1,141 54,718 92
]/ 1972 not yet available in consictent format
V/ 1973/1972
Source: Central Bank


VII. AGRICULTURE


N
'0 0 N '0 0 0 N 0 '4 - N 0 N N N '4 - 0 N N N N I N
O '4 0 NNNNNNONN�'tNNN ..1 N N N N N N .4 CIIN N N N N NNNNN N N 0' NNN4N"
NO - N NN N NNNNNN 4
N - NNU
.1' N N N N '4 N N N- '4 N N N N9 '4 N 4 N C- 04� '4N'4'4NN
NNNNNNN 0 N - - N NO N N C N - N NN'4CNC NECN . . .
N N N N N 0 N N N N 0 N N N N N N N N - N NNNININIIt
NNNNCCNN,NN0 '4 N N N .� N NO.IC.J'4IJ.INII. ININ,lN N N N - N N N Cl fl N
NI'NNNNN.tNNN 10 NNNNN 0 N N N N 0 N
N N N N N N N N N 'N N N '4 N N N 4 NNNNNNNNN N Nj
NNC N '4 N N N
'C N
N 0 NN'4C"NN N N N N '4NONNN
N NNNNN N - .0 N N N N N N N N .0 N '4 4 '4N N N N N N N ... NN N N N N N N N N . N N N N N N N N Nj
0 - NNN'NNNNNIN N.1
NIL
C N - '4 N 0 0 0 N C '4 N N 0 N N N N N N N NN - 0N H N N N N N N N N � N N 0 N N N N N N - NN 4 N N N N N N -. 4 N- N N - - N N N N N N
N
H NNNNNNNNNN'4NCN4NC N NNNNNN -' I Co . . . . .1N N N N N N N N N N '.. N N NI N C N N N I *4� N,
N .0 0 - N N N N - .� 0 N Nj - N N N N - I 4'N N N N N N Nj NI : - N .j N N N NJ NI
0. I I "cl
NI
N II .':'-tt'.; NNN..NNNN NNNNONNC NNNNNNN N N N N N N N N. NNNNN N
C4 N� N . N
iiN N N ONN4NN 4 N N N N N N N N N N Nil
NNNNNNN N N N N N N I N IN I'
0 N N N N NNNNN 4 N N N N N N �4
o INI
N .NIH 0101 0 N NNNNNNNNNNNN N N N N ONNJ
- �2I N�NNNNN�NNNC,NN NNNNNNNJN 0 N N N N N N N N N N N N 4 N
N NN N - NNNI2N N I
N N 4 14 NNNNNNNN .1 N - N - N N N N CC N N "II"C N N N N N N NIlIN �N - N N N '4 N N NNNNNNN N Njj NN�I
N N -
o N N N N N N N N N N N N '4 0 0 .4 N N 14 0 - N C
.14 N N N N N N N N N N N N N N 0' 04-iNN N I
CCC'O N N N N N N - N N N N N 4 4 N.'CNN�NIC1
AN ���*NNC0NNNNN�NNO NN 0,4 N"
C N N - N N N NI NO. 4 'CI
'C 0 - CC .1 '4Cl N N
4 0 N S a H C4" H H IC ON
N 00 0 i'� C' 0 C4I�, C CC CC C N N C) 0 0 4'.1 0 CC CC .0 - 0 0 N - - CC - NO-i N N N'. CCC I NO ON...,, '. CL N.
N' 4 CC N .0 '. -, 0 N N N ..� I 0 4 NIo.Ioo- 00CC 0 0 'C 'C C CC 0 j�L CLONLON I 0. 0 0IOCCCO'.000.CC CC .00CC CC LI NOCLN,NCCO I CI N.
NoN 000.04 'CON � C - C,N Ci N N N 0. C.) C-. N 'C N :0 N C.. N 0. CC. '4 CI CL

Table 7.2: AREA PLANTED AND YIELDS OF MAIN CROPS, 1970-1975
Cultivated Area('000 ha)
1970 1971 1972 1973 1"971 19-5
ITheat Mh0 727 712 534 601 663Oats 73 75 81± 76 )06 78Barle-y. h7 53 67 - 6h 94 71Rye 8 9 9 6 1), 8Corn 74 77 85 86 108 75Rice 25 27 26 19 11 26Beans 57 70 78 68 75 73Lentils 17 18 19 16 22 16Peas 11 10 13 12 18 16Ch. icsk- S 11 16 20 16 114 13Potato- S 72 80 79 67 98 80S'aIgar c.eets 42 35 31 23 26 h3Sun1owte r seeds 20 15 15 12 8 13
54 L9 5 31 5Wine 109 108 108 10 1(w3 103
Yiel.ds
1970 1971 972 1573 3974± 1975
Wheat 1.77 1.88 1.68 1.Lo 1.26 1.51Oats 1.52 1.4? 1.'3 1.1±1 1.48 1.616Bazley 2.06 2.16 2.07 1.68 1.72 1.91'.ve 1.29 1.38 1.3 3.).35 1.39 1.57Corn 3.24 3.35 3.35 3.40 3.140 3.42.Pice 3.02 2.46 3.36 2.96 2.KO 2.82Beans 1.15 1.03 1.04± 0.9.5 0.93 1.18Lentils o.65 0.66 0.59 0.61 0C.62 0.63Peas 0.69 0.84 0.81 0.75 0.77 0.92Chi ckpeas 0.48 0.45 0.46 0.27 0.1±8 0.53Potatcs_s 9.515 10.144 9.26 9.35 9.±5 9.93Sugar ;-eets 39.69 39. 57 38.22 29.16 36 ,'.-4 33.16Swflc,er seeds 1.39 1.33 1.' O-,'5 1.05 1.36P.apese-cs 1.30 1.66 1.39 1.23 1.21 1.21Wi-ne 0.37 0. 19 .-0.62. C 0.0 0, .G 0.r0
* Estimate ODEPA
Octob'±r 8, 1974

VIII. OTHER PRODUCTIVE SECTORS


Table 8.1: INDICES OF VOLUME OF INDUSTRIAL PRODUCTION BY SELECTEDSUB-SECTORS 1969-1973
(1969 = 100)
1969 1970 1971 1972 1973
Food Products 100.0 109.7 115.4 106.8 100.4Drinks 100.0 101.7 125.3 127.0 110.8Tobacco 100.0 97.4 119.4 122.5 127.4Textiles 100.0 106.6 120.4 125.3 119.2Clothing 100.0 97.5 110.7 117.3 106.8
Leather Products (excluding shoes) 100.0 96.5 102.2 96.2 88.1Shoes 100.0 91.5 116.9 119.6 117.7Wood and Cork 100.0 111.3 120.5 148.8 132.2Furniture and Accessories 100.0 107.8 121.0 116.1 116.4Paper and Products 100.0 98.2 101.0 97.9 90.9
Printing 100.0 95.1 98.8 144.3 141.9Industrial Chemicals 100.0 105.3 110.6 112.0 105.8Other Chemical Products 100.0 100.6 119.6 119.7 117.3Petroleum Refining 100.0 96.2 123.7 132.0 123.7Petroleum Derivatives 100.0 91.8 108.8 106.7 108.4
Rubber Products 100.0 113.3 133.1 132.3 124.4Plastic Products 100.0 86.0 105.6 119.1 102.1Ceramics and Brick Products 100.0 94.5 99.6 106.8 105.2Glass Products 100.0 90.4 106.0 119.3 136.4Other Non-Metallic Mineral Products 100.0 96.6 108.7 105.6 106.1
Basic Iron and Steel Products 100.0 95.3 103.9 98.1 87.3Basic Non-Ferrous Metal Products 100.0 101.7 111.6 118.8 122.8Metal Products 100.0 108.3 111.6 120.2 114.3Non-Electric Machinery 100.0 98.2 115.4 122.4 113.8Electric Equipment 100.0 90.5 111.4 115.3 116.8
Electronic Equipment 100.0 148.1 196.3 146.3 106.9Domestic Electric Appliances 100.0 110.5 126.5 119.0 111.6Transport Material 100.0 100.4 91.4 105.9 71.6Professional and Scientific Equipment 100.0 100.4 106.8 94.4 70.9Other Manufactures 100.0 83.1 82.1 72.5 87.1
TOTAL 100.0 103.5 114.7 117.6 109.9
Source: Statistical Department, Sociedad de Fomento Fabril.

Table 8.2: STEEL AND PETROLEUM PRODUCTS PRODUCTION, 1968-1973
Steel Ingots Gasoline Diesel Fuel Liquid G2s(7 OOOt) ('00 m) ('OOO mI) (tOOO m-)
1968 526 1,362 727 467
1969 602 1,542 727 510
1970 5h7 1,558 722 415
1971 610 1,778 897 617
1972 52h 1,855 829 854
1973 508 1,660 777 800
Yearly Rate: Jan.-Sept. h79 1,575 729 739(1973)
Oct. -Dec. 596 1,916 921 982
Source: Central Bank, Boletin Mensual

Table 8.3: AUTOMOTIVE PRODUCTION, 1968-1974
(Number of Units Assembled)
1968 1969 1970 1971 1972 1973
Company:
Citroen 2,835 3,296 3,574 6,015 6,t400 4,784
Fiat 4,188 6,067 5,634 7,824 9,168 2,432
Ford 1,635 2,788 2,999 - - _
General Motors 2,280 1,680 3,696 2,220 - -
Renault-Peugot 2,289 44,573 4,235 3,911 4,o042 2,817
Others 4,815 3,665 4,453 3,500 6,631 3,203
Total: 18,042 22.o69 24.591 23.470 26.241 13,236
of which:
Passenger Vehicles 13,671 18,485 20,684 21,250 23,372 12,187
Pickup Trucks 1 536 1,314 2,694 1, 500 - _
Heavy Trucks 2,835 1,908 1,209 720 2,869 1,049
Buses - 362 4 - - -
Source: Central Bank

Table 8 .4: FISHERIES STATISTICS, 1962 -1972
1962 1963 1964 1965 1966 1967 1968 1969 1970 1971 1972
Landed Catch (1,000 tons) 641 762 1,161 703 1,383 1,053 1,393 1,095 1,181 1.494 792Fish 591 706 1,094 643 1,309 969 1,307 1,009 1,082 1,396 690Other (lobster, shrimp. etc) 50 56 67 66 74 84 86 86 99 98 102
Industrial Fisheries Output (1, 000 tons) 117 131 207 124 264 201 292 218 241 344 17294 -- _6 _ 6_
Fishmeal 94 108 175 94 220 164 238 180 197 263 119Oils 13 13 18 10 22 15 34 23 23 63 17Frozen Fish 2 2 3 9 9 8 6 5 7 7 6Other 8 8 11 11 13 14 14 10 14 11 30
Exports (million $) -- -- 22 16 36 24 28 28 29 48 24Fishmeal -- -- 16 8 25 13 18 18 16 29 12Fresh and Frozen -- -- 2 4 6 6 6 7 8 11 6Other -- -- 4 4 5 5 4 3 5 8 6
Fishing Fleet
Number of boats over 10 t. g. r.w. -- -- -- -- 426 412 388 371 272 271 --Gross registered tonnage (1, 000 tons) -- -- -_ -- 42 41 38 36 28 -- __
Source: Ministry of Agriculture.

DC. PRICES AND WAGES


Table 9.1: PRICE INDICES, 1969=1974
(December 1969 = 100.0)
Official Official AdjustedConsumer Price Wholesale Price Money Supply 1/ Money Index /
Index Index Index (Mission Price Index)
December 1969 100.0 100.0 100.0 100.0March 1970 116.18 117.2 118.5 115.0June 1970 123.88 125.3 126.3 123.9zeptember 1970 139.94 132.3 145-5 141.6December 1970 134t94 133e7 165.9 150elMarch 1971 146.13 140h2 219.0 187.7June 1971 160.84 146.6 2517 194h5September 1971 164.67 150.8 294h7 193.2December 1971 180o04 162.4 354.7 206.9March 1972 208.07 186.1 412.1 248.7June 1972 240.39 207.6 465-5 323.8Septemoer 1972 329.27 305.2 534.1 426.9December 1972 434.12 394h7 893.4 797.7January 1973 478.814 4404 969.5 917.1February 1973 498.66 456.1i 1,082.6 1,033.8March 1973 529.49 491.6 1,208.5 12175-5April 1973 50351 5o06.1 1,253.3 1l288.4May 1973 696.72 600.3 1,!437.5 ls535.2June 1973 805.75 652.9 1,716.2 1,973.6July 1973 929.02 728.6 2,171.7 2,659.2August 1973 1,087.50 804h7 2,396.9 3,179.6September 1973 1,271.07 948.4 2,683.2 3,833.1October 1973 2,384.21 3,223.6 2,,766.9 3,263.6November 1973 2,520.11 4h624.6 3,523.1 3,363.0December 1973 2,639.68- 4).92 7.2 4s632.4 4,028.2January 1974 3,011.87 6,722.6 5,214•5 4,596.2F'ebruary 1974 3,749.78 7,917.3 n.a nea.March 1974 4,282.25 n.a. n.a. n.a.
/ To Private Sector and Intervened firms (after June 1973) only.2/ Adjusted for rough velocity and real output changes, estimated by mission.Sources: Central Bank Bulletins, National Statistics Institute, and mission estimates.

Table 9.2: OFFICIAL COST OF LIVING INDEX - GREATER SAN'TIAGO
(December 1969 = 100)
Food Housing Clothing Other General IndexIndex Variation !I Index VariationI Index Variation Index Variation Index Variation
1964 Annual Average 31.8 50.3 33.1 35.3 30.9 50.7 21.7 36.7 30.3 46.01965 " 41.2 29.6 41.9 26.5 38.7 25.3 29.2 34.2 39.1 28.81966 " 50.4 22.5 50.5 20.6 46.5 20.3 38.5 31.9 48.0 22.91967 " " 57.7 14.5 60.5 19.7 56.8 22.1 49.1 27.6 56.7 18.11968 " " 72.4 25.5 75.3 24.5 71.3 25.6 66.5 35.4 71.8 26.61969 " " 94.7 30.7 94.9 26.1 91.2 27.8 92.7 39.4 93.8 30.71970 " 128.1 35.4 119.4 25.8 116.5 27.7 127.6 37.7 124.4 32.51971 " 158.6 23.8 139.0 16.4 146.7 26.0 143.5 12.5 149.3 20.11972 " " 341.5 115.2 117.3 27.6 233.2 59.0 230.8 60.8 265.5 77.81973 " " 1,627.0 376.5 562.2 217.0 1,251.0 436.4 1,001.9 334.1 1,202.1 352.8
1970 December 140 40.4 129. 28.7 129 28.7 135 35.1 135 34.91971 December 180 28.2 149. 15.7 161 25.2 154 14.0 165 22.11972 September 446 158.9 184. 23.6 266 65.0 258 67.4 329 99.8
December 618 243.3 229. 53.8 340 110.9 352 Iz8.4 434 163.4
1973 January 678 9.7 243 6.1 386 13.6 399 13.2 479 10.3February 708 14.6 263 14.8 398 17.1 405 15.1 499 14.9March 729 18.0 276 20.5 496 45.9 426 21.0 530 22.0April 784 26.9 327. 42.8 601 76.7 445 26.4 584 34.0May 956 54.7 368 60.7 777 128.5 474 34.7 697 60.5June 1,042 68.6 442 93.0 907 166.8 651 84.9 806 85.6July 1,464 83.4 508 121.8 1,129 232.0 708 101.1 929 114.0August 1,464 136.9 552 141.1 1,307 284.4 755 114.5 1,088 150.5September 1,787 189.2 586 155.9 1,462 330.0 841 138.9 1,271 192.8October_/ 3,259 427.3 905 295.6 2,493 633.2 2,136 506.8 2,384 449.2November_/ 3,374 445.9 1,111 385.1 2,518 640.6 2,318 558.5 2,520 480.5December_2/ 3,549 474.2 1,166 409.2 2,538 646.5 2,464 600.0 2,640 508.1
1974 January 4,138 16.6 1,394 19.5 2,554 0.6 2,880 16.9 3,012 14.1February 5,003 41.0 1,988 70.5 2,725 7.4 3;978 61.4 3,750 42.1March 5,604 57.9 2,306 97.8 3,324 31.0 4,503 82.7 4,282 62.2
1/ Variations are measured as between annual average indexes and--in the case of monthly indexes--between the index for each month and that for the previous December.
2/ Variation as calculated by Economics Department of Universidad de Chile.
Source: Instituto Nacional de Estadisticas

Table 9.3: NATIONAL WHOLESALE PRICE INDEX(1968 - 100)
NATIONAL PRODUCTS IMPORTED GENERALAgricultural Mineral Industrial Total PRODUCTS INDEX
Index Variation Index Variation Index Variation Index Variation Index Variation Index Variation
1964 Annual Average 40.2 51.7 38. 9 40.4 37.9 53.4 38.8 51.6 50.3 48.4 42. 0 50. 61965 " 55./ 37.3 57.1 46.8 48.5 8.0 51.7 33.2 53.8 7.0 52.3 24.31966 69.4 *5.7 71.0 24.3 6/.2 Z8.2 65.5 .6.7 60.8 13.0 64.2' 22.91967 " " 80.4 15.7 82.2 15.8 76.4 22.8 78.4 i9.7 7-.- i8.8 76.6 09.31968 100.0 24.4 100.0 21.7 100.0 30.9 100.0 27.6 100.0 38.5 100.0 30.51969 141.0 41.0 129.2 29.2 135.6 35.6 136.2 36.2 137.4 37.4 136.5 36.51970 191.7 36.0 166.7 29.0 186.1 37.2 186.1 36.6 184.6 34.4 185.8 36.11971 " 240.5 25.5 221.3 32.8 212.0 13.9 217.2 16.7 225.5 22.2 219.1 17.91972 502.1 108.8 380.3 71.8 352.4 66.2 378.6 74.3 352.3 56.2 372.5 70.01973 " 2, 652. 5 428. 3 2,179.2 473.0 2.032. 1 476.6 2,142. 1 465. 8 2, 296. 9 552.0 2, 277.6 511. 4
1964 December 43.4 51.6 45.0 40.3 40.3 53.5 41.9 51.6 52.5 48.6 44.9 50.61965 " 59.2 36.4 63.0 40.0 51.9 28.8 55.6 32.7 56.6 7.8 55.8 24.5
1966 74.0 25.0 73.5 16.7 64.4 24.1 68.7 23.6 62.1 9.7 66.8 19.71967 84.8 14.6 86.8 18.1 79.0 22.7 81.8 19.1 75.5 21.6 80.0 19.81968 " 106.2 25.2 104.5 20.4 106.6 34.9 106.3 30.0 107.0 41.7 106.5 33.11969 " 156.8 47.7 143.1 36.9 145.4 36.4 147.1 38.4 153.0 43.0 148.5 39.41970 212.3 35.4 174.7 22.1 195.1 34.2 197.0 33.9 204.2 33.5 198.6 33.71971 " 270.5 27.4 251.9 44.2 234.0 19.9 /40.9 :2.3 241.8 18.4 241.1 21.41972 " 1,184. 0 337.7 495.0 96.5 506.2 116.3 618.2 156.6 480.7 98.8 586.7 143.31973 7,257.0 512.9 7,935.2 1, 503.0 6,804.2 1,244.2 6,931.4 1,021.2 8,615.0 1 ,692.2 7, 316.9 1, 147. 1
1972 September 578 113.7 401 59.2 438 87.2 459 90.5 432 78.7 453 88.01973 September 2,468 108.5 1,471 197.2 1,374 171.4 1,560 152.3 897 86.6 1,408 140,0
October 5,824 391.9 3,624 632.1 4,342 757.8 4,555 636.8 5,568 - 1,058.3 4,787 715,5November 6,393 440.0 7,347 1, 384.2 6,424 1, 169.1 6,462 945.3 8,234 1,621.9 6,868 1,070.0December 7, 257 512.9 7,935 1,503.0 6,804 1, 244.1 6,931 1,021.2 8,615 1,692.2 7,317 1,146.5
Source: National Statistical Institute (Instituto Nacional de Estadisticas)
Note : Variations measured between annual average indexes and - in tle case of monthly indexes - between the index for each month and that of the
previous December.

Table 9.4 : WAGE AND SALARY INDICES, 1969-1973(December 1969 = 1000)
Public Central Decentralized TotalUtilities Mining Manufacturing Government Agencies Wages Salaries
1969 December 100.0 100.0 100.0 100.0 100.0 100.0 100.0
1970 January 100.9 105.0 103.9 108.5 106.9 107.0 103.8
ADril 104.2 107.8 116.4 128.2 122.8 121.1 114.9July 132.1 110.6 126.3 131.1 130.1 127.5 125.6October 132.6 152.2 132.0 134.1 136.4 132.9 139.4
1971 January 141.8 170.5 146.2 138.7 160.4 150.5 151.5April 171.2 178.8 171.9 190.6 190.6 186.4 174.7July 186.7 190.2 188.7 196.2 212.5 198.1 193.8October 201.2 200.0 212.5 199.0 208.5 206.3 207.1
1972 January 203.5 226.4 237.6 197.1 252.9 225.2 235.5April 271.2 217.7 271.7 213.3 267.7 244.3 262.9July 276.3 226.8 300.4 301.6 278.3 278.9 289.3October 362.6 337.2 513.1 417.6 490.1 448.8 466.2
1973 January 673.5 616.1 666.5 545.1 590.9 594.1 663.8April 669.8 622.2 818.9 618.1 628.7 640.8 761-3July 776.6 764.8 192.8 007.3 918.2 919.9 099.9October 943.4 1,,148.7 1,509.6 1,003-3 1,098.41, 1.0o63.9 4h07.8
1974 January 3,112.8 2,246.3 4,203.4 }4,050.9 2,461.4 2,95G.4* 3,911.9*'
Note: Does not include family benefits* Estimated by missionSource: Central Bank Bulletins

Table 9.5 : WAGE AND SALARY INDICES ADJUSTED FOR FAMILY BENEFITS, 1969-1973
(December 1969 - 100.0)
Public Central Decentralized Totali.Utilities Mining Manufacturing Government Agencies Wages Salaries
1969 December 100.0 100.0 100.0 100.0 100.0 100.0 100.0
1970 January 111.7 109.9 109.0 118.4 117.0 111.6 107.1April 114.6 112.4 119f.8 135.5 130.8 12309 116.8July 138.9 114.8 128.4 138.0 137.1 129.5 126.1October 139.3 151.0 133.4 140.6 142.6 134.2 138.1
1971 January 159.3 185.5 164.4 156.6 175.5 168.1 15805April 184.9 192.7 18607 201.7 201.7 199.3 179.0July 198.4 202.6 201.3 206.6 220.8 209.5 195.6October 211.0 211.1 222.0 209.0 217.3 216.6 207.1
1972 January 221.0 248.3 258.0 215.5 264.0 247.2 243.6April 279.9 240.7 28707 229.6 276.9 263.8 267.5July 284.4 248.6 312.6 306.4 286.1 293.8 290.4October 403.5 396.4 549.3 451.3 514.3 49314 483.1
1973 January 673.8 638.9 682.7 562.2 602.0 619.7 678.6April 670.6 644.2 815.2 625.6 634.9 660.3 763.4July 763.5 768.2 1140.4 964.1 886.6 903.0 1057.8October 1137.7 1390o2 1704.0 1189.7 1272.4 1316.4 1528.4
Noter Family benefits assumed to be 15 percent of cash salary in December 1969Sources: Central Bank Bulletins, Superintendency of Social Security and mission estimates.

Table 9.6 : WAGE INDEX, INCLUDING FAMILY BENEFITS, DEFLATED BYOFFICIAL CONSUMER PRICE INDEX, 1969-1973
(December 1969 100.0)
Public Central Decentralized TotalUtilities Mining Manufacturing Government Agencies Wages Salaries
1969 December 100.0 100.0 100.0 100.0 100.0 100.0 100.0
1970 January 111.7 109.9 109.0 118.4 117.0 111.6 107.1April 98.6 96.8 103.1 116.6 112.6 106.6 lOO.rJuly 112.1 92.7 103.7 111.4 110.7 104.5 101.8October 99.5 107.9 9503 100.5 101.9 95.9 98.7
1971 January 118.1 137.5 121.8 116.1 130.1 124.6 117.7April 126.5 131.9 127.8 138.0 138.0 136.4 122.5July 123.4 126.0 125.2 128.5 137.3 130.2 121.6October 128.1 128.2 134.8 126.9 132.0 131.5 125.8
1972 January 122.8 137.9 143.3 119.7 146.6 137.3 135.3April 134.5 115.7 138.3 110.4 133.1 126.8 128.6July 118.3 103.4 130.0 127.5 119.0 122.2 120.8October 122.5 120.h 166.8 137.l 156.2 149.9 146.7
1973 January 140.7 133.4 142.6 117.4 125.7 129.4 141.7April 114.9 110.4 139.7 107.2 108.8 113.2 130.8July 82.2 82.7 122.8 103.8 95.4 97.2 113.9October 47.7 58.3 71.5 49.9 53.4 55.2 64.1
Sources: Tables 9.1 and 9.5

Table 9. 7 : WAGE INDEX, INCLUDIN1G FAMILY BENEFITS, DEFLATED BYMISSION PRICE LEVEL ESTIMATE, 1969-1973
(December 1969 = 100.0)
Public Central Decentralized TotalUtilities Mining Manufacturing Government Agencies wages Salaries
1969 December 100.0 100.0 100.0 100.0 100.0 100.C 100.0
1970 January 111.7 109.9 109.0 118.4 117.0 111.6 107.1April 99.7 97.7 104.2 117.8 113.7 107.7 101.6Jul' 112.1 92.7 103.6 111.4 110.7 1%.5 101.8October 98.4 106.6 94.2 99.3 100.7 94.8 97.5
1971 January 106.1 123.6 1o9.5 104.3 116.9 112.0 105.8Aprii 98.5 102.7 99.5 107.5 107.5 106.2 95.4July 102.0 104.2 103.5- 106.2 113.5 107.7 100.6October 109.2 109.3 114.9 108.2 112.5 112.1 107.2
1972 January 106.8 120.0 124h7 104.2 127.6 119.5 117.7April 112.6 96.8 115.7 92.3 111.3 106.1 107.6July 87.8 76.8 96.5 94.6 88.4 90.7 89.7October 94h5 92.9 128.7 105.7 120.5 115.6 113.2
1973 January 73.5 69.7 74h4 61.3 65.6 67.6 74.0April 52.1 50.0 63-3 48.6 49.3 51.3 59.3July 28.7 28.9 42.9 36.3 33.3 34.0 39.8October 34.9 42.6 52.2 36.5 39.0 403 46.8
Source: Tables 9.1 and 9.5

Table 9.8: SELECTED AVERAGE PRICE OR TARIFFS INDEXOF PUBLIC UTILITIES, 1968-1974
(1969 = 100)
EiAPB ENDESA CHITECTRA ETCYear (Petroleum (Electricity (Electricity Railroads (Bus Entity)
Entity) Entity) Entity)
1968 75 70 72 73 68
1969 100 100 100 100 100
1970 133 146 129 131 129
1971 134 154 137 158 145
Jan.-June 1972 181 179 167 279 313
July-Dec. 1972 181 179 175 279 313
January 1973 327 179 168 656 1s428
February 1973 341 179 168 656 1,428
March 1973 347 179 168 656 1,428
April 1973 354 179 168 656 1,428
May 1973 342 179 168 656 1,428
June 1973 348 179 168 656 1,423
July 1973 341 179 168 656 1,428
August 1973 342 179 168 656 1,428-
September 1973 345 179 168 656 1,1428
October 1973 1,781 179 168 656 1,1428
November 1973 3,682 274 931 656 1,1428
December 1973 3,682 271- 931 656 1,428
January 1974 - 1,171 1,025 - 5,269
Source: Calculated by mission from estimates provided by Finance Ministry.

Table 9.9: MONTHLY SUELDO VITALE9, 1961-1974
(Escudos and index)
Year2/ A Scale B Scale A Scale B Scale(Escudos) (Escudos) (1969-100) (1969=100)
1961 77.17 66.03 16.2 16.2
1962 80.91 69.23 16.9 16.9
1963 103.32 88.41 21.6 21.6
1964 150.23 128.55 31.5 31.5
1965 207.92 177.91 h3.5 43.5
1966 261.77 223.99 54.8 54.8
1967 306.27 262.07 64.1 64.1
1968 373.34 319.46 78.2 78.2
1969 477.5o 408.59 100.0 100.0
1970 617.41 528.31 129.3 129.3
1971 832.89 712.69 174.4 174.4
Jan.-Sept.1972 1,016.96 870.19 213.0 213.0
Oct.1972-Dec-1973 2,033.92 1,740.38 426.o 425.9
1974 -- 10,170.00 2,129.8 2,48900
/ From January 1 to December 31, unless otherwise noted.
Note: The "Sueldo Vital" (living wage) is used in Chile for both tax purposesand setting some public service and minimum wage levels. The latter purposeis achieved each year by increasing minimum and public service wages proportionateto the increase in the "sueldo vitale". The A Scale was used for workers inindustry and commerce, and B scale for agricultural workers; these were unified in1974.
Source: Finance Ministry