special report 307 Greenhouse Gas Emissions from …onlinepubs.trb.org/onlinepubs/sr/sr307.pdf ·...
228
policy options for reducing energy use and Policy Options for Reducing Energy Use and Greenhouse Gas Emissions from U.S. Transportation special report 307
Transcript of special report 307 Greenhouse Gas Emissions from …onlinepubs.trb.org/onlinepubs/sr/sr307.pdf ·...

America’s Climate Choices: Five-Book SetAmerica’s Climate Choices: Final Report, Advancing the Science of Climate Change, Adapting to the Impacts of Climate Change, Informing an Effective Response to Climate Change, and Limiting the Magnitude of Future Climate Change National Academies Press, ISBN 978-0-309-21532-9, 5-volume set, 7 × 10, paperback, 2010–2011, $183.80
Adapting Transportation to the Impacts of Climate Change: State of the Practice 2011Transportation Research E-Circular E-C152, 64 pages, 8.5 × 11, electronic, 2011, www.trb.org/Environment/Blurbs/165529.aspx
Representing Freight in Air Quality and Greenhouse Gas ModelsNational Cooperative Freight Research Program Report 4, ISBN 978-0-309-15481-9, 162 pages, 8.5 × 11, paperback, 2010, $62.00
Current Practices in Greenhouse Gas Emissions Savings from TransitTransit Cooperative Research Program Synthesis 84, ISBN 978-0-309-14303-5, 77 pages, 8.5 × 11, paperback, 2010, $49.00
Modal Primer on Greenhouse Gas and Energy Issues for the Transportation IndustryTransportation Research E-Circular E-C143, 78 pages, 8.5 × 11, electronic, 2010, www.trb.org/Environment/Blurbs/163289.aspx
A Transportation Research Program for Mitigating and Adapting to Climate Change and Conserving EnergySpecial Report 299, ISBN 978-0-309-14275-5, 120 pages, 6 × 9, paperback, 2009, $35.00
Driving and the Built Environment: Effects of Compact Development on Motorized Travel, Energy Use, and CO2 Emissions Special Report 298, ISBN 978-0-309-14255-7, 239 pages, 6 × 9, paperback, 2009, $37.00
Potential Impacts of Climate Change on U.S. TransportationSpecial Report 290, ISBN 978-0-309-11306-9, 280 pages, 6 × 9, paperback, 2008, $37.00
Also of Interest
policy o
ptions fo
r reducing energy use and greenho
use gas emissio
ns from
u.s. transportatio
ns
pecia
l rep
or
t 30
7
Policy Options for Reducing Energy Use and
Greenhouse Gas Emissions from U.S. Transportation
special report 307Policy Options for Reducing Energy Use and Greenhouse Gas Emissions from U.S. Transportation
Saving energy in transportation can have important implications for the cost of securing the world’s oil supplies, since transportation accounts for most of the petroleum consumed in the United States. It can also help with controlling the buildup of greenhouse gases, which will require major reductions in carbon dioxide emissions from economic sectors that are heavy users of carbon-rich fossil fuels.
This report examines the potential for policies to yield major changes in transportation energy use and emissions trends. Policy measures targeting cars and light trucks, medium and heavy trucks, and commercial airliners are considered. These three modes are by far the largest users of energy within U.S. transportation because they account for the vast majority of passenger trips and freight.
ISBN 978-0-309-16742-0
9 780309 167420
9 0 0 0 0
TransporTaTion research Board2011 execuTive commiTTee*
chair: neil J. pedersen, Consultant, Silver Spring, Marylandvice chair: sandra rosenbloom, Professor of Planning, University of Arizona, Tucsonexecutive director: robert e. skinner, Jr., Transportation Research Board
J. Barry Barker, Executive Director, Transit Authority of River City, Louisville, Kentuckydeborah h. Butler, Executive Vice President, Planning, and CIO, Norfolk Southern Corporation, Norfolk, VirginiaWilliam a. v. clark, Professor, Department of Geography, University of California, Los Angeleseugene a. conti, Jr., Secretary of Transportation, North Carolina Department of Transportation, RaleighJames m. crites, Executive Vice President of Operations, Dallas–Fort Worth International Airport, Texaspaula J. hammond, Secretary, Washington State Department of Transportation, Olympiamichael W. hancock, Secretary, Kentucky Transportation Cabinet, Frankfortadib K. Kanafani, Cahill Professor of Civil Engineering, University of California, Berkeley (Past Chair, 2009)michael p. Lewis, Director, Rhode Island Department of Transportation, Providencesusan martinovich, Director, Nevada Department of Transportation, Carson CityJoan mcdonald, Commissioner, New York State Department of Transportation, Albanymichael r. morris, Director of Transportation, North Central Texas Council of Governments, Arlington (Past Chair, 2010)Tracy L. rosser, Vice President, Regional General Manager, Wal-Mart Stores, Inc., Mandeville, Louisianasteven T. scalzo, Chief Operating Officer, Marine Resources Group, Seattle, Washingtonhenry G. (Gerry) schwartz, Jr., Chairman (retired), Jacobs/Sverdrup Civil, Inc., St. Louis, MissouriBeverly a. scott, General Manager and Chief Executive Officer, Metropolitan Atlanta Rapid Transit Authority,
Atlanta, Georgiadavid seltzer, Principal, Mercator Advisors LLC, Philadelphia, PennsylvaniaLawrence a. selzer, President and CEO, The Conservation Fund, Arlington, VirginiaKumares c. sinha, Olson Distinguished Professor of Civil Engineering, Purdue University, West Lafayette, IndianaThomas K. sorel, Commissioner, Minnesota Department of Transportation, St. Pauldaniel sperling, Professor of Civil Engineering and Environmental Science and Policy; Director, Institute of Trans-
portation Studies; and Interim Director, Energy Efficiency Center, University of California, DavisKirk T. steudle, Director, Michigan Department of Transportation, Lansingdouglas W. stotlar, President and Chief Executive Officer, Con-Way, Inc., Ann Arbor, Michiganc. michael Walton, Ernest H. Cockrell Centennial Chair in Engineering, University of Texas, Austin (Past Chair, 1991)
peter h. appel, Administrator, Research and Innovative Technology Administration, U.S. Department of Transportation (ex officio)
J. randolph Babbitt, Administrator, Federal Aviation Administration, U.S. Department of Transportation (ex officio)rebecca m. Brewster, President and COO, American Transportation Research Institute, Smyrna, Georgia (ex officio)anne s. Ferro, Administrator, Federal Motor Carrier Safety Administration, U.S. Department of Transportation (ex officio)Leroy Gishi, Chief, Division of Transportation, Bureau of Indian Affairs, U.S. Department of the Interior, Washington,
D.C. (ex officio)John T. Gray, Senior Vice President, Policy and Economics, Association of American Railroads, Washington,
D.C. (ex officio)John c. horsley, Executive Director, American Association of State Highway and Transportation Officials, Washington,
D.C. (ex officio)david T. matsuda, Deputy Administrator, Maritime Administration, U.S. Department of Transportation (ex officio)victor m. mendez, Administrator, Federal Highway Administration, U.S. Department of Transportation (ex officio)William W. millar, President, American Public Transportation Association, Washington, D.C. (ex officio) (Past
Chair, 1992)Tara o’Toole, Under Secretary for Science and Technology, U.S. Department of Homeland Security (ex officio)robert J. papp (Adm., U.S. Coast Guard), Commandant, U.S. Coast Guard, U.S. Department of Homeland Security
(ex officio)cynthia L. Quarterman, Administrator, Pipeline and Hazardous Materials Safety Administration, U.S. Department of
Transportation (ex officio)peter m. rogoff, Administrator, Federal Transit Administration, U.S. Department of Transportation (ex officio)david L. strickland, Administrator, National Highway Traffic Safety Administration, U.S. Department of Transportation
(ex officio)Joseph c. szabo, Administrator, Federal Railroad Administration, U.S. Department of Transportation (ex officio)polly Trottenberg, Assistant Secretary for Transportation Policy, U.S. Department of Transportation (ex officio)robert L. van antwerp (Lt. General, U.S. Army), Chief of Engineers and Commanding General, U.S. Army Corps of
Engineers, Washington, D.C. (ex officio)Barry r. Wallerstein, Executive Officer, South Coast Air Quality Management District, Diamond Bar, California
(ex officio)
*Membership as of September 2011.

special report 307
Policy Options for Reducing Energy Use and
Greenhouse Gas Emissions from U.S. Transportation
Committee for a Study of Potential Energy Savings and Greenhouse Gas Reductions from Transportation
Transportation Research BoardWashington, D.C.
2011www.TRB.org

Transportation Research Board Special Report 307
Subscriber CategoryEnergy and environment
Transportation Research Board publications are available by ordering individual publications directly from the TRB Business Office, through the Internet at www.TRB.org or nationalacademies. org/trb, or by annual subscription through organizational or individual affiliation with TRB. Affiliates and library subscribers are eligible for substantial discounts. For further information, contact the Transportation Research Board Business Office, 500 Fifth Street, NW, Washington, DC 20001 (telephone 202-334-3213; fax 202-334-2519; or e-mail [email protected]).
Copyright 2011 by the National Academy of Sciences. All rights reserved.Printed in the United States of America.
NOTICE: The project that is the subject of this report was approved by the Governing Board of the National Research Council, whose members are drawn from the councils of the National Academy of Sciences, the National Academy of Engineering, and the Institute of Medicine. The members of the committee responsible for the report were chosen for their special competencies and with regard for appropriate balance.
This report has been reviewed by a group other than the authors according to the procedures approved by a Report Review Committee consisting of members of the National Academy of Sciences, the National Academy of Engineering, and the Institute of Medicine.
This report was sponsored by the Transportation Research Board.
Library of Congress Cataloging-in-Publication Data
National Research Council (U.S.). Committee for a Study of Potential Energy Savings and Greenhouse Gas Reductions from Transportation. Policy options for reducing energy use and greenhouse gas emissions from U.S. transportation / Committee for a Study of Potential Energy Savings and Greenhouse Gas Reductions from Transportation, Transportation Research Board of the National Academies. p. cm. — (Transportation research board special report ; 307) Includes bibliographical references. ISBN 978-0-309-16742-0 1. Greenhouse gas mitigation—Government policy—United States. 2.Transportation—Environmental aspects—United States. I. Title. TD885.5.G73N396 2011 333.79'6816—dc23
2011027807

The National Academy of Sciences is a private, nonprofit, self-perpetuating society of distin-guished scholars engaged in scientific and engineering research, dedicated to the furtherance of science and technology and to their use for the general welfare. On the authority of the charter granted to it by the Congress in 1863, the Academy has a mandate that requires it to advise the federal government on scientific and technical matters. Dr. Ralph J. Cicerone is president of the National Academy of Sciences.
The National Academy of Engineering was established in 1964, under the charter of the National Academy of Sciences, as a parallel organization of outstanding engineers. It is autonomous in its administration and in the selection of its members, sharing with the National Academy of Sci-ences the responsibility for advising the federal government. The National Academy of Engineer-ing also sponsors engineering programs aimed at meeting national needs, encourages education and research, and recognizes the superior achievements of engineers. Dr. Charles M. Vest is presi-dent of the National Academy of Engineering.
The Institute of Medicine was established in 1970 by the National Academy of Sciences to secure the services of eminent members of appropriate professions in the examination of policy mat-ters pertaining to the health of the public. The Institute acts under the responsibility given to the National Academy of Sciences by its congressional charter to be an adviser to the federal gov-ernment and, on its own initiative, to identify issues of medical care, research, and education. Dr. Harvey V. Fineberg is president of the Institute of Medicine.
The National Research Council was organized by the National Academy of Sciences in 1916 to associate the broad community of science and technology with the Academy’s purposes of fur-thering knowledge and advising the federal government. Functioning in accordance with general policies determined by the Academy, the Council has become the principal operating agency of both the National Academy of Sciences and the National Academy of Engineering in provid-ing services to the government, the public, and the scientific and engineering communities. The Council is administered jointly by both Academies and the Institute of Medicine. Dr. Ralph J. Cicerone and Dr. Charles M. Vest are chair and vice chair, respectively, of the National Research Council.
The Transportation Research Board is one of six major divisions of the National Research Council. The mission of the Transportation Research Board is to provide leadership in transpor-tation innovation and progress through research and information exchange, conducted within a setting that is objective, interdisciplinary, and multimodal. The Board’s varied activities annually engage about 7,000 engineers, scientists, and other transportation researchers and practitioners from the public and private sectors and academia, all of whom contribute their expertise in the public interest. The program is supported by state transportation departments, federal agencies including the component administrations of the U.S. Department of Transportation, and other organizations and individuals interested in the development of transportation. www.TRB.org
www.national-academies.org


committee for a study of potential energy savings and greenhouse gas reductions from transportation
Emil H. Frankel, Bipartisan Policy Center, Washington, D.C., ChairVictoria Arroyo, Georgetown University Law Center, Washington, D.C.George C. Eads, CRA International, Inc. (retired), Washington, D.C.John M. German, International Council for Clean Transportation, Washington,
D.C.Lance R. Grenzeback, Cambridge Systematics, Inc., Cambridge, MassachusettsAnthony D. Greszler, Volvo Powertrain North America, Hagerstown, MarylandW. Michael Hanemann, University of California, BerkeleyHenry Lee, Harvard University, Cambridge, MassachusettsVirginia McConnell, Resources for the Future, Inc., Washington, D.C.Donald L. Paul, University of Southern California, Los AngelesJohn M. Samuels, Jr., Revenue Variable Engineering, LLC, Palm Beach
Gardens, FloridaDaniel Sperling, University of California, DavisBrian D. Taylor, University of California, Los AngelesKathleen C. Taylor, General Motors Corporation (retired), Fort Myers, FloridaIan A. Waitz, Massachusetts Institute of Technology, CambridgeJames J. Winebrake, Rochester Institute of Technology, New York
Transportation Research Board StaffThomas R. Menzies, Jr., Study Director


vii
Preface
In an environment of volatile energy prices and increasing calls for the transportation sector to reduce its consumption of imported oil and emis-sions of greenhouse gases (GHGs), the 2007 Transportation Research Board (TRB) Executive Committee proposed assembling a special com-mittee of experts to inform U.S. policy makers about potential strategies for reducing energy use and GHG emissions from the nation’s personal and freight transportation systems. The Executive Committee proposed a study that would examine the anticipated trends in U.S. transportation energy use and emissions, the challenge involved in altering these trends fundamentally, and candidate strategies and policy options for meet-ing this challenge. With approval by the National Research Council’s (NRC’s) Governing Board and using internal funds to sponsor the proj-ect, TRB assembled a 16-member committee of experts in economics, policy analysis, vehicle and fuel technologies, and transportation system operations and management to conduct the study under the leadership of Emil H. Frankel. The study’s full statement of task, as accepted by the Governing Board, is presented in Chapter 1.
The breadth and ambition of the study’s task led to intense debate and discussion by committee members during deliberations and to numerous e-mail exchanges and two teleconference discussions to produce this final report. The committee met seven times. Several of the meetings included briefings and panel discussions involving outside experts from govern-ment, industry, and academia. These sessions were highly informative and enabled the committee to gain a better understanding of how the transportation system uses energy, how energy consumption and GHG emissions are expected to trend over the next several decades, and the various policies that are now in place and proposed to affect these trends. In addition, a number of related studies on transportation energy use

viii Preface
and efficiency, mitigation strategies, and R&D needs were completed by TRB and NRC while this study was under way from 2008 to 2010 (TRB 2009a; TRB 2009b; NRC 2010a; NRC 2010b; NRC 2010c). The insight and information gained from these studies, as well as a number of others from industry, government, academia, and nonprofit research institutions (for example, Schäfer et al. 2009; Sperling and Cannon 2009; OECD 2007; Bandivadekar et al. 2008; Greene and Plotkin 2011), allowed the com-mittee to focus more of its attention on examining the policy challenge inherent in reducing transportation energy use and emissions.
The statement of task calls on the committee to refrain from recom-mending policies but to provide an objective review of the policy instru-ments available, including an assessment of the strengths and weaknesses of each in affecting long-term trends in transportation energy use and emissions. Because of the multitude of ways in which individual policy instruments can be designed, targeted, and applied, it was not possible to examine all of their possible variations and outcomes for a sector as large and diverse as U.S. transportation. For example, how fast and by how much fuel taxes or vehicle efficiency standards are raised will pro-foundly influence the relative prospects of such options for implementa-tion and their effects on energy use and emissions and on other areas of interest to policy makers such as transportation safety, the environ-ment, and the economy. This study is not a modeling exercise aimed at projecting and quantifying the effects of many policy instruments, each designed and structured in alternative ways and applied across one or more modes. The more realistic study goal is to compare the main types of policy options with respect to the main energy- and emissions-saving responses they induce and the challenges and opportunities they present for implementation.
Acknowledgments
During its information-gathering sessions, which were open to the public, the committee was briefed by the following officials on federal initia-tives and programs to reduce energy use and emissions from transpor-tation: Julie Abraham, Director, International Policy Fuel Economy and Consumer Programs, National Highway Traffic Safety Administration;

Preface ix
Jan Brecht-Clark, Associate Administrator for Research, Development, and Technology, Research and Innovative Technology Administration, U.S. Department of Transportation (U.S. DOT); Carl Burleson, Direc-tor, Office of Environment and Energy, Federal Aviation Administration, U.S. DOT; Sarah Dunham, Director, Transportation and Climate Division, Office of Transportation and Air Quality, U.S. Environmental Protection Agency; Arthur Rypinski, Energy Economist, Office of the Secretary, U.S. DOT; Gloria Shepherd, Associate Administrator for Planning, Envi-ronment, and Realty, Federal Highway Administration, U.S. DOT; and Thomas White, Senior Policy Analyst, Office of Policy and International Affairs, U.S. Department of Energy. The committee thanks all seven for their presentations.
In conjunction with a meeting at the Arnold and Mabel Beckman Cen-ter of the National Academies in Irvine, California, the committee invited faculty from the University of California, Irvine, to participate in com-mittee discussions on a series of topics relevant to the study, including the potential for urban land use policies to affect transportation energy use and emissions, the impact of higher fuel prices on motor vehicle travel and motorist interest in fuel economy, and the potential for intelligent transportation systems to increase the energy efficiency of transportation system operations. The committee thanks the following university faculty for joining in these discussions: Marlon Boarnet, Professor of Planning, Policy, and Design and Economics; Stephen Ritchie, Professor of Civil and Environmental Engineering and Director of the Institute of Transpor-tation Studies; and Kenneth A. Small, Research Professor and Professor Emeritus of Economics.
Thomas R. Menzies, Jr., managed the study and drafted the report under the guidance of the committee and the supervision of Stephen R. Godwin, Director, Studies and Special Programs, TRB. Norman Solomon edited the report; Janet M. McNaughton handled the editorial production; Juanita Green managed the book design, production, and printing; and Jennifer J. Weeks prepared the prepublication manuscript, under the supervision of Javy Awan, Director of Publications, TRB. Special thanks go to Amelia Mathis for assistance in arranging meetings and communicating with the committee. In addition, the committee and staff thank Matthew Stepp and Anthon Sonnenberg, Fellows of the National Academies’ Christine

x Preface
Mirzayan Science and Technology Policy Graduate Program. Both con-tributed analyses and research to the study during its early stages.
This report has been reviewed in draft form by individuals chosen for their diverse perspectives and technical expertise in accordance with procedures approved by NRC’s Report Review Committee. The purpose of this independent review is to provide candid and critical comments that will assist the institution in making the report as sound as possible and to ensure that the report meets institutional standards for objectivity, evidence, and responsiveness to the study charge. The review comments and draft manuscript remain confidential to protect the integrity of the deliberative process.
NRC thanks the following individuals for their review of this report: Asad A. Abidi, University of California, Los Angeles; Paul N. Blumberg, Consultant, Southfield, Michigan; Marlon Boarnet, University of Califor-nia, Irvine; Douglas M. Chapin, MPR Associates, Inc., Alexandria, Vir-ginia; John M. DeCicco, University of Michigan, Ann Arbor; Edward A. Helme, Center for Clean Air Policy, Washington, D.C.; Henry D. Jacoby, Massachusetts Institute of Technology, Cambridge; and Steven E. Polzin, University of South Florida, Tampa. The review of this report was overseen by George M. Hornberger, Vanderbilt University, and C. Michael Walton, University of Texas at Austin. Appointed by NRC, they were responsible for making certain that an independent examination of this report was carried out in accordance with institutional procedures and that all review comments were carefully considered. Responsibility for the final content of the report rests solely with the authoring committee and the institu-tion. Suzanne Schneider, Assistant Executive Director, TRB, managed the report review process.
References
abbreviationsNRC National Research Council
OECD Organisation for Economic Co-operation and Development
TRB Transportation Research Board
Bandivadekar, A., K. Bodek, L. Cheah, C. Evans, T. Groode, J. Heywood, E. Kasseris, M. Kromer, and M. Weiss. 2008. On the Road in 2035: Reducing Transportation’s

Preface xi
Petroleum Consumption and GHG Emissions. Laboratory for Energy and the Envi-ronment, Massachusetts Institute of Technology, Cambridge.
Greene, D. L., and S. E. Plotkin. 2011. Reducing Greenhouse Gas Emissions from U.S. Transportation. Pew Center on Global Climate Change, Washington, D.C.
NRC. 2010a. Limiting the Magnitude of Future Climate Change. National Academies Press, Washington, D.C.
NRC. 2010b. Real Prospects for Energy Efficiency in the United States. National Acad-emies Press, Washington, D.C.
NRC. 2010c. Technologies and Approaches to Reducing the Fuel Consumption of Medium- and Heavy-Duty Vehicles. National Academies Press, Washington, D.C.
OECD. 2007. Cutting Transport CO2 Emissions: What Progress? European Conference of Ministers of Transport, Paris.
Schäfer, A., J. B. Heywood, H. D. Jacoby, and I. A. Waitz. 2009. Transportation in a Climate-Constrained World. Massachusetts Institute of Technology Press, Cambridge.
Sperling, D., and J. S. Cannon (eds.). 2009. Reducing Climate Impacts in the Transpor-tation Sector. Springer Science and Business Media.
TRB. 2009a. Special Report 298: Driving and the Built Environment: The Effects of Compact Development on Motorized Travel, Energy Use, and CO2 Emissions. Transportation Research Board of the National Academies, Washington, D.C.
TRB. 2009b. Special Report 299: A Transportation Research Program for Mitigating and Adapting to Climate Change and Conserving Energy. Transportation Research Board of the National Academies, Washington, D.C.


Contents
Summary 1
1 Study Purpose and Background 15Why Examine Policies for a Single Sector, Transportation? 18Informing Transportation Policy Choices 23Transportation’s Current Dependence on Fossil Fuels 24Outlook for Transportation Energy Use 27Transportation Energy Use and GHG Buildup 30Report Organization 34
2 U.S. Transportation Today 37Scale, Scope, and Patterns of Personal and Goods Transportation 38Energy Performance of Major Transport Modes 52Considerations Affecting the Adoption of Fuel-Saving
and GHG-Reducing Technologies 72Summary Assessment 76
3 Transportation Policy Landscape 79Overview of Decision Makers and Actors 81Current Policies to Reduce Energy Use and Emissions 88New and Proposed Policies 97Summary Assessment 99
4 Factors Driving Modal Energy Use and Emissions 101Factors Influencing Trends in Light-Duty Vehicles 102Heavy-Duty Trucks 111Air Passenger Transportation 125Other Modes 129Summary Assessment 129

5 Policy Options to Reduce Transportation’s Energy Use and Greenhouse Gas Emissions 133Transportation Policies in the National Context 133Transportation-Specific Policy Options 139Transportation Fuel Taxes 140Vehicle Efficiency Standards 149Feebates as Financial Incentives 154Low-Carbon Fuel Standards 157Measures to Curb Private-Vehicle Travel 159Measures Targeted to Freight and Passenger Service 168Summary Assessment 173
6 Informing the Choices Ahead 179Aligning Strategic Interests and Policies 182Research to Inform Strategic Policy Making 188Concluding Observations 190
Appendix: Scientific Concern over Greenhouse Gas Buildup 193
Study Committee Biographical Information 199

1
This report examines U.S. transportation’s consumption of petroleum fuels and the public interest in reducing this consumption to enhance national energy security and help control emissions of carbon dioxide (CO2) and other greenhouse gases (GHGs). Scientific analyses and models indicate a need to stabilize atmospheric concentrations of these gases by the middle of this century. Worldwide emissions reductions of up to 80 percent may be needed over the next four decades as a consequence. A response by the transportation sector to this energy and emissions challenge will be impor-tant, because the sector accounts for more than two-thirds of the petro-leum consumed in the United States and produces between one-quarter and one-third of all the CO2 emissions attributable to the country’s energy consumption.
The report reviews policy options to bring about desired energy con-sumption and GHG emissions reductions from U.S. transportation over the next half century. It is not intended to model or quantify the impacts of each policy option over time but instead to examine the means by which each influences behavior and the demand for and supply of energy- and emissions-saving technology, particularly in the modes of transpor-tation with the greatest effect on the sector’s consumption of petroleum and emissions of GHGs. In choosing among policies, elected officials must take into account many factors that could not be examined in this study, such as the full range of safety, economic, and environmental implications of their choices; therefore, the report does not recommend
Summary

2 Policy Options for Reducing Energy Use and Greenhouse Gas Emissions from U.S. Transportation
a specific suite of policies to pursue. Instead, the emphasis is on assessing each policy approach with regard to its applicability across transportation modes and its ability to affect the total amount of energy-intensive trans-portation activity, the efficiency of transportation vehicles, and GHG emissions characteristics of the sector’s energy supply. For each policy option, consideration is given to the challenges associated with imple-mentation and with the production of large savings in energy and GHG emissions over a time span of decades.
Given the magnitude of the needed emissions reductions indicated by climate change science and GHG modeling, it is difficult to envision the U.S. transportation sector contributing meaningfully to these reductions without a close alignment of policies to induce and sustain the needed energy- and emissions-saving response. Gradual improvements in the energy efficiency of transportation vehicles and their operations over the past several decades—brought about in part by public policies—have helped temper transportation’s overall demand for carbon-rich petro-leum, even as the total population, automobile ownership, personal travel, freight demand, and traffic congestion have grown. However, a mere tempering of the growth in petroleum demand by transportation will not yield deep reductions in the CO2 and other GHGs emitted from transportation over the next 40 years. In this respect, the policy challenge that lies ahead is more complex than the energy conservation challenge facing the nation over the past 40 years. The achievement of deep reduc-tions in energy use and emissions by midcentury will require more than gradual improvements in vehicle energy efficiency. It is likely to require reducing the GHG impact of the transportation fuel supply and the total amount of energy- and emissions-intensive transportation activity.
The Policy Challenge Ahead
Transportation is central to commerce and to the daily lives of Ameri-cans. It allows people to access more places of work, obtain a wider range of goods and services, and connect socially over broader areas. It allows businesses to situate in the most economically efficient locations and reach a larger number of suppliers and customers. Today’s transportation modes and systems cannot be easily or quickly altered, having evolved

Summary 3
over many decades and reflecting countless decisions about where and how Americans live and U.S. businesses operate. The diversity, complex-ity, and ubiquity of the nation’s energy-intensive transportation system thus present both opportunities and challenges for policy making.
The total energy consumed in transportation and the associated emis-sions of GHGs are largely a function of the energy efficiency of transpor-tation vehicles and their operating environment, how often and intensely the vehicles are used, and the GHG characteristics of the fuels that are consumed. Policies to curb transportation energy consumption and emissions in the decades ahead will almost certainly need to focus on the cars and light trucks used for personal travel and the medium and heavy trucks used for moving freight. Cars and light trucks alone account for about two-thirds of the sector’s petroleum consumption and thus for a comparable share of GHG emissions. Largely because of anticipated increases in vehicle energy- and GHG-efficiency standards, light-duty vehicles are projected to account for a smaller share of the transportation sector’s total energy use and emissions over time. Nevertheless, they will continue to account for the majority (55 to 60 percent) in 2030.
Heavy- and medium-duty vehicles, including trucks that carry freight, account for 20 to 25 percent of the sector’s energy use and emissions. They are projected to account for a similar percentage in 2030, which means that all motor vehicles will continue to account for more than 75 percent of transportation’s total energy use and emissions. The next-largest contributor is the passenger airline industry, whose share of emissions is projected to increase from about 6 to about 8 percent over the 20-year period. Thus, three types of vehicles—cars, trucks, and pas-senger aircraft—will remain the chief sources of sector energy use and emissions for many years to come. Any policies aimed at making major changes in transportation energy use and emissions trends will almost certainly need to find and exploit opportunities to reduce the activity of these vehicles and their energy and emissions intensity. For cars and light trucks, these opportunities are likely to include
• Furtherincreasingtheenergyefficiencyofvehiclesintroducedafter2020 in an attempt to exceed the goal of 35 miles per gallon required in current legislation;

4 Policy Options for Reducing Energy Use and Greenhouse Gas Emissions from U.S. Transportation
•Moderatingtherateofgrowthinprivate-vehicleusebyhouseholds,particularly for the fastest-growing reasons for personal trip making, such as discretionary trips for shopping and services; and
•Diversifyingthefuelsupplytoreducedependenceongasolineandtofavor energy sources whose production and consumption both result in lower emissions of GHGs.
For freight-carrying trucks, the opportunities are likely to include
•Acceleratingthedevelopmentandintroductionoffuel-savingtruckdesigns and technologies,
• Encouraging thewidespread adoption by fleet operators ofmoreenergy-efficient operations and maintenance practices, and
•Diversifyingthefuelsupplytoreducedieselconsumptionandtofavorenergy sources whose production and consumption both result in lower emissions of GHGs.
For passenger airlines, the opportunities are likely to include
•Acceleratingfleetturnovertohastenearlyentryofnext-generationair-craft that are more efficient in using energy and produce fewer emis-sions and
• Enablingmoreefficientairlineroutingandoperationsthroughtheuseof improved air traffic management procedures and systems.
The successful exploitation of opportunities for saving energy and reducing emissions in these dominant modes will require policies that influence the decisions and actions of those who (a) supply the vehicles, fuels, and infrastructure; (b) own and operate the vehicles and provide commercial freight and passenger services; and (c) demand these trans-portation services. A policy approach that does not influence the incen-tives and actions of all of these groups will almost certainly fall short of achieving the desired outcome. The crux of the debate is over the types and combinations of policies that are best suited both to making early progress in controlling emissions and to enlarging the savings to bring about deep emissions reductions by the middle of this century.

Summary 5
Aligning Strategic Interests and Policies
A long-standing emphasis of U.S. policy making has been on regulating transportation vehicles and fuels to compel the production of more effi-cient vehicles and the emergence of energy sources other than gasoline and diesel fuel. Federal regulations that require automobile manufactur-ers to increase vehicle fuel economy have been in place since the 1970s and are now accompanied by GHG performance standards for new cars and light trucks starting in model year 2012. Additional efficiency stan-dards are planned for medium- and heavy-duty trucks, and similar stan-dards may eventually be pursued for larger vehicles in other modes. The recent adoption of federal renewable fuel standards, which require that a certain percentage of the transportation fuel supply consist of fuels pro-ducing lower GHG emissions on a life-cycle basis, represents another policy approach that is largely based on the suppliers of transportation products. In comparison, policies aimed at influencing the behavior and decisions of the users of transportation vehicles and the consumers of fuel are seldom proposed, much less introduced.
Supplier-oriented vehicle and fuel standards are not the only options available to policy makers, and actions targeted to consumers will almost certainly be required if large reductions in transportation energy use and emissions are to be achieved over the next half century. The policy options reviewed in this report include
•Transportationfueltaxes,•Vehicleefficiencystandardsandfeebates(andotherfinancialincen-
tives to motivate interest in vehicle efficiency),• Low-carbonstandardsfortransportationfuels,• Landusecontrolsandtraveldemandmanagementmeasuresaimedat
curbing private household vehicle use, and• Publicinvestmentsintransportationinfrastructuretoincreasevehicle
operating efficiencies.
The report examines how each policy option influences transporta-tion energy use and GHG emissions, whether by affecting the amount of energy- and emissions-intensive transportation activity, the energy

6 Policy Options for Reducing Energy Use and Greenhouse Gas Emissions from U.S. Transportation
efficiency of vehicles and their operations, or the GHG characteristics of the transportation energy supply. Policies that affect all three factors and that can be applied across modes are likely to have the largest influence on transportation energy use and emissions. How quickly each policy can be put into effect is an important consideration because GHG emis-sions are accumulating in the atmosphere.
Table S-1 summarizes how each of the policies above compares with respect to scope of application (across modes) and array of impacts (i.e., on energy and emissions efficiency, activity, and the GHG characteristics of fuel). Fuel taxes have the greatest applicability across modes. Indeed, fuel taxes are already in place in nearly all modes of transportation, although their magnitude varies. In addition to having sectorwide appli-cability, fuel taxes have the advantage of prompting a varied energy- and emissions-saving response by both consumers and suppliers of fuels, vehicles, and transportation services. By raising fuel prices, fuel taxes can lead to increased consumer interest in more fuel-efficient vehicles and operations and a reduction in the demand for energy-intensive trans-portation activity (with the magnitude of the effect depending on the sizeanddurationofthetax).Efficiencystandardshaveamorefocusedimpact; they seek to increase the energy and emissions performance of vehicles and fuels but do not prompt vehicle operators to engage in more energy-efficient operations or to scale back their energy- and emissions-intensive activity. With the exception of fuel taxes, most policy options listed in Table S-1 have a narrow impact; they are targeted at specific modes and at only one of the factors influencing transportation energy use and emissions.
The importance of achieving timely, sustained, and increasing reduc-tions in GHG emissions means that a combination of policies may be needed. Actions that go beyond the current focus on regulating vehicle and fuel suppliers will almost certainly be required, including energy pricing. Although fuel taxes have long played a key role in financing the nation’s transportation infrastructure, their use for inducing energy con-servation has not been tested in the United States. The resistance encoun-tered by proposals to raise fuel taxes even slightly to pay for transportation infrastructure has produced skepticism about the prospects for energy pricing to have a meaningful policy role in the near to medium term.

tabl
e s-
1 S
cop
e, S
cale
, an
d T
imin
g of
Im
pac
ts o
f M
ajor
Pol
icy
Ap
pro
ach
es t
o R
edu
cin
g Tr
ansp
orta
tion
’s
Petr
oleu
m U
se a
nd
GH
G E
mis
sion
s
S
cope
ofA
ppli
cati
ona
ndIm
pact
sTi
min
gan
dS
cale
ofI
mpa
cts
A
ppli
cabi
lity
Acr
oss
Pr
ospe
cts
for
Earl
y
Poli
cyA
ppro
ach
Tran
spor
tati
onM
odes
Im
pact
sa Po
licy
Impl
emen
tati
on
Sca
leo
fIm
pact
sb
Fuel
taxe
sTa
xes
can
be a
sses
sed
on a
ll fu
els
used
in a
ll m
odes
of
tran
spor
tatio
n.
T axe
s th
at ra
ise
the
pric
e of
fuel
w
ill p
rom
pt c
onsu
mer
and
car
-ri
er in
tere
st in
ene
rgy-
effic
ient
ve
hicl
es a
nd o
pera
tion
s as
w
ell a
s al
tern
ativ
es to
ene
rgy-
inte
nsiv
e tr
ansp
orta
tion
act
iv-
ity.
A ta
x st
ruct
ure
favo
ring
lo
w-G
HG
fuel
s ca
n al
so fo
ster
in
tere
st in
alt
erna
tive
fuel
s an
d m
ore
emis
sion
s-ef
ficie
nt
vehi
cle
type
s.
Bec
ause
taxe
s ar
e al
read
y im
pose
d on
fuel
s us
ed in
mos
t tr
ansp
orta
tion
mod
es, h
ighe
r fu
el ta
xes
wou
ld b
e st
raig
htfo
r-w
ard
to a
dmin
iste
r. Th
e m
ajor
ch
alle
nge
to e
arly
impl
emen
ta-
tion
is to
find
inno
vati
ve w
ays
to e
ngen
der a
nd s
usta
in p
ublic
su
ppor
t for
hig
her t
axes
, whi
ch
have
bee
n re
sist
ed d
urin
g th
e pa
st tw
o de
cade
s.
If fu
el ta
xes
can
be s
usta
ined
an
d co
ntin
ually
rais
ed, t
hey
can
gene
rate
incr
easi
ng
impa
cts
on tr
ansp
orta
tion
en
ergy
use
and
em
issi
ons
over
ti
me
as c
onsu
mer
s an
d su
p-pl
iers
of v
ehic
les
and
ener
gy
adju
st th
eir p
urch
ases
, beh
av-
ior,
trav
el a
ctiv
ity,
and
pro
d-uc
ts o
ffer
ed. C
ompl
emen
tary
po
licie
s th
at fa
cilit
ate
fuel
- and
em
issi
ons-
savi
ng re
spon
ses,
su
ch a
s co
mpa
tibl
e la
nd u
se
and
tran
spor
tati
on in
fras
truc
-tu
re p
lann
ing,
may
mak
e th
e hi
gher
fuel
taxe
s m
ore
acce
pt-
able
to c
onsu
mer
s.(c
onti
nued
on
next
pag
e)

tabl
e s-
1 (c
onti
nued
) S
cop
e, S
cale
, an
d T
imin
g of
Im
pac
ts o
f M
ajor
Pol
icy
Ap
pro
ach
es t
o R
edu
cin
g
Tran
spor
tati
on’s
Pet
role
um
Use
an
d G
HG
Em
issi
ons
S
cope
ofA
ppli
cati
ona
ndIm
pact
sTi
min
gan
dS
cale
ofI
mpa
cts
A
ppli
cabi
lity
Acr
oss
Pr
ospe
cts
for
Earl
y
Poli
cyA
ppro
ach
Tran
spor
tati
onM
odes
Im
pact
sa Po
licy
Impl
emen
tati
on
Sca
leo
fIm
pact
sb
Effic
ienc
y st
anda
rds
alre
ady
exis
t for
car
s an
d lig
ht tr
ucks
. Th
ey a
re b
ased
on
ener
gy
cons
umed
or e
mis
sion
s pe
r ve
hicl
e m
ile. E
stab
lishi
ng
stan
dard
s fo
r lar
ger p
as-
seng
er a
nd fr
eigh
t-ca
rryi
ng
mod
es is
mor
e co
mpl
icat
ed
beca
use
of th
e va
riab
ility
in
veh
icle
type
s an
d us
es.
The
stan
dard
mus
t acc
ount
fo
r the
wor
k pe
rfor
med
by
thes
e ve
hicl
es (v
olum
e or
to
nnag
e of
frei
ght,
vol
ume
of
pass
enge
rs).
Vehi
cle
ener
gy a
nd e
mis
sion
s ef
ficie
ncy
stan
dard
s ar
e on
e-di
men
sion
al in
that
they
do
not c
ause
veh
icle
ope
rato
rs to
se
ek o
ut o
pera
ting
effi
cien
cies
(e
.g.,
ener
gy-s
avin
g ro
utin
g)
or to
redu
ce th
e vo
lum
e of
tr
ansp
orta
tion
act
ivit
y. T
he
resu
ltan
t low
erin
g of
the
fuel
co
st o
f tra
nspo
rtat
ion
may
le
ad to
som
e ad
diti
onal
trav
el
acti
vity
, off
sett
ing
a po
rtio
n of
the
ener
gy a
nd e
mis
sion
s sa
ving
s fr
om th
e in
crea
sed
vehi
cle
ener
gy a
nd e
mis
sion
s ef
ficie
ncy.
Vehi
cle
ener
gy a
nd e
mis
sion
s ef
ficie
ncy
stan
dard
s ar
e in
ef
fect
and
bei
ng ti
ghte
ned
for
cars
and
ligh
t tru
cks.
Whi
le
vehi
cles
in o
ther
mod
es a
re
cand
idat
es fo
r sta
ndar
ds,
inst
itut
ing
them
pre
sent
s te
chni
cal a
nd a
dmin
istr
ativ
e ch
alle
nges
.
Cont
inue
d ti
ghte
ning
of
stan
dard
s th
at y
ield
sm
alle
r re
duct
ions
in e
nerg
y us
e an
d em
issi
ons
will
test
con
sum
er
acce
ptan
ce. I
n th
e ab
senc
e of
hi
gher
fuel
pri
ces,
pur
chas
e in
cent
ive
prog
ram
s su
ch a
s fe
ebat
es m
ay b
e ne
eded
to
mot
ivat
e co
nsum
er in
tere
st
in h
ighe
r lev
els
of v
ehic
le
effic
ienc
y.
Vehi
cle
effic
ienc
y
stan
dard
s

Low
-car
bon
fuel
sta
ndar
ds
can
be a
pplie
d to
the
enti
re
tran
spor
tati
on fu
el s
uppl
y.
Thes
e m
easu
res
appl
y m
ainl
y to
trav
el in
met
ropo
li-ta
n ar
eas,
esp
ecia
lly b
y ca
rs
and
light
truc
ks. T
hey
have
lim
ited
app
licab
ility
to o
ther
m
odes
and
to tr
avel
in ru
ral
area
s.
The
mai
n ef
fect
of a
low
-car
bon
fuel
sta
ndar
d is
to re
duce
the
GH
Gs
gene
rate
d by
the
fuel
su
pply
(dur
ing
cons
umpt
ion
and
prod
uctio
n) b
y in
crea
sing
th
e de
man
d fo
r and
sup
ply
of
alte
rnat
ive
fuel
s. If
fuel
pric
es
incr
ease
as
a co
nseq
uenc
e, th
e st
anda
rds
will
als
o ca
use
som
e re
duct
ion
in tr
ansp
orta
tion
activ
ity a
nd g
reat
er in
tere
st in
en
ergy
-effi
cien
t veh
icle
s an
d op
erat
ions
.
The
mai
n ef
fect
of t
hese
pol
i-ci
es is
to re
duce
the
amou
nt
of e
nerg
y- a
nd e
mis
sion
s-in
tens
ive
tran
spor
tati
on
acti
vity
. The
y w
ould
nee
d to
be
acc
ompa
nied
by
othe
r po
licie
s, s
uch
as e
ffici
ency
st
anda
rds
and
fuel
taxe
s, to
af
fect
the
effic
ienc
y of
veh
icle
s an
d th
e G
HG
pro
file
of th
e fu
el
supp
ly.
The
pros
pect
s fo
r ear
ly
impl
emen
tati
on a
re u
ncle
ar
sinc
e th
ere
is li
mit
ed e
xper
i-en
ce w
ith
such
pro
gram
s. If
th
e st
anda
rds
rais
e th
e pr
ice
of
fuel
, as
wou
ld b
e ex
pect
ed, t
he
impl
emen
tati
on c
halle
nge
will
be
sim
ilar t
o th
at o
f rai
sing
fuel
ta
xes.
As
wit
h ot
her p
olic
ies
to c
ontr
ol G
HG
em
issi
ons,
the
abili
ty to
acc
ount
for a
nd v
erify
em
issi
ons
will
aff
ect i
mpl
e-m
enta
tion
pot
enti
al.
Bec
ause
land
use
pla
nnin
g an
d m
any
trav
el d
eman
d m
easu
res
are
trad
itio
nally
th
e re
spon
sibi
lity
of lo
cal
gove
rnm
ents
, sta
tes
will
like
ly
need
to ta
ke a
mor
e ac
tive
role
in
coo
rdin
atin
g an
d al
igni
ng
thes
e de
cisi
ons.
The
ear
ly
impl
emen
tati
on c
halle
nge
will
ent
ail e
stab
lishi
ng th
ese
stat
e an
d re
gion
al p
rogr
ams
to
influ
ence
and
coo
rdin
ate
loca
l de
cisi
ons.
Low
-car
bon
fuel
sta
ndar
ds
may
be
help
ful i
n at
trac
ting
an
d su
stai
ning
inve
stm
ent i
n al
tern
ativ
e fu
els,
pot
enti
ally
lo
wer
ing
the
cost
of s
uppl
ying
th
em o
ver t
ime.
If fu
el p
rice
s re
mai
n hi
gh a
s a
cons
eque
nce,
th
e ch
alle
nge
will
be
in m
ain-
tain
ing
publ
ic s
uppo
rt fo
r the
pr
ogra
m.
Bec
ause
the
built
env
iron
men
t ch
ange
s on
ly g
radu
ally
ove
r ti
me,
man
y de
cade
s w
ill b
e re
quir
ed fo
r lan
d us
e pl
an-
ning
to h
ave
nati
onal
eff
ects
on
tran
spor
tati
on e
nerg
y us
e an
d em
issi
ons.
Onc
e in
pla
ce,
how
ever
, a m
ore
com
pact
bui
lt
envi
ronm
ent m
ay h
ave
last
ing
impa
cts
on e
nerg
y us
e an
d em
issi
ons
and
alig
n w
ell w
ith
othe
r pol
icie
s su
ch a
s hi
gher
fu
el ta
xes.
Low
-car
bon
fuel
st
anda
rds
Land
use
con
trol
s an
d tr
avel
de
man
d
man
agem
ent
mea
sure
s
(con
tinu
ed o
n ne
xt p
age)

tabl
e s-
1 (c
onti
nued
) S
cop
e, S
cale
, an
d T
imin
g of
Im
pac
ts o
f M
ajor
Pol
icy
Ap
pro
ach
es t
o R
edu
cin
g
Tran
spor
tati
on’s
Pet
role
um
Use
an
d G
HG
Em
issi
ons
S
cope
ofA
ppli
cati
ona
ndIm
pact
sTi
min
gan
dS
cale
ofI
mpa
cts
A
ppli
cabi
lity
Acr
oss
Pr
ospe
cts
for
Earl
y
Poli
cyA
ppro
ach
Tran
spor
tati
onM
odes
Im
pact
sa Po
licy
Impl
emen
tati
on
Sca
leo
fIm
pact
sb
App
licab
le to
all
mod
es in
w
hich
gov
ernm
ents
ow
n an
d op
erat
e th
e tr
ansp
orta
-ti
on in
fras
truc
ture
, suc
h as
th
e hi
ghw
ays,
air
way
s, a
nd
wat
erw
ays.
Inve
stm
ents
in tr
ansp
orta
-ti
on in
fras
truc
ture
can
mak
e op
erat
ions
mor
e ef
ficie
nt
in te
rms
of e
nerg
y us
e an
d em
issi
ons.
How
ever
, cap
acit
y-ex
pand
ing
inve
stm
ents
that
re
duce
the
fuel
and
tim
e co
st o
f tra
vel m
ay le
ad to
an
incr
ease
in to
tal t
rave
l act
ivit
y,
offs
etti
ng s
ome
of th
e en
ergy
an
d em
issi
ons
savi
ngs.
The
pros
pect
s fo
r ear
ly im
ple-
men
tati
on w
ill d
epen
d in
larg
e pa
rt o
n m
otiv
atio
ns o
ther
than
en
ergy
and
em
issi
ons
savi
ngs,
es
peci
ally
con
gest
ion
relie
f an
d sa
fety
enh
ance
men
t.
Bec
ause
add
ing
phys
ical
ca
paci
ty to
tran
spor
tati
on s
ys-
tem
s is
bec
omin
g m
ore
cost
ly
and
tim
e-co
nsum
ing,
the
mor
e lik
ely
inve
stm
ents
will
be
in m
easu
res
that
con
trol
tr
affic
and
allo
cate
use
of t
he
syst
ems
mor
e ef
fect
ivel
y.
Fund
amen
tal c
hang
es in
the
oper
atio
ns a
nd s
truc
ture
of t
he
tran
spor
tati
on s
yste
m, s
uch
as
thro
ugh
the
intr
oduc
tion
of t
he
Nex
t Gen
erat
ion
Air
Tra
nspo
r-ta
tion
Sys
tem
and
inte
llige
nt
tran
spor
tati
on s
yste
m te
ch-
nolo
gies
, cou
ld le
ad to
mor
e fa
r-re
achi
ng e
nerg
y an
d em
is-
sion
s be
nefit
s ov
er ti
me.
Publ
ic in
vest
men
ts
in in
fras
truc
ture
op
erat
ing
ef
ficie
ncie
s a Ab
ility
to a
ffec
t the
am
ount
of e
nerg
y-in
tens
ive
tran
spor
tati
on a
ctiv
ity,
the
effic
ienc
y of
veh
icle
s an
d th
eir o
pera
tion
s, a
nd th
e G
HG
pro
file
of th
e en
ergy
sup
ply.
b Pote
ntia
l to
gene
rate
larg
e en
ergy
and
em
issi
ons
savi
ngs
from
the
tran
spor
tati
on s
ecto
r ove
r the
nex
t 25
to 5
0 ye
ars.

Summary 11
In the right-hand columns of Table S-1, policies are compared with respect to their prospects for early implementation and their potential to generate large energy and emissions savings over a span of 25 to 50 years. Gaining public acceptance is a challenge for all meaningful policies. Although vehicle and fuel standards have demonstrated such potential, at least in recent years, they too may need to be supplemented with pricing strategies, such as the vehicle feebate schemes examined in this report, to create and sustain a demand for more efficient vehicles and fuels.
Few of the policies examined in this report are likely to be adopted quickly and retained for long unless they promise to do more than reduce GHG emissions. Interest in reducing dependence on petroleum, much of it supplied by politically unstable regions of the world, has been an important reason for the adoption of fuel economy standards, and this interest will continue to be a driving force behind the introduction of other policies aimed at curtailing transportation’s energy use. Other pub-lic interests must also be aligned with these goals. For example, invest-ments in transportation infrastructure and operating practices that make the system more energy efficient will also be desirable to consumers if they reduce congestion and delays. The coordination of land use planning and transportation investments can likewise yield more effective and efficient energy-saving responses by consumers. Indeed, the introduction of fuel taxes and other pricing policies to spur consumer interest in saving energy would require infrastructure-related policies to be made compatible.
To achieve reductions in GHG emissions, a policy pathway that is both tactical and strategic is indicated. Having demonstrated their poten-tial for implementation, vehicle efficiency standards, for example, may be desirable in slowing the rate of growth in energy use and emissions. However, such mode- and vehicle-specific policies will need to be suc-ceeded by policies that can generate much larger systemic responses, such as those produced by energy pricing. The strategic challenge ahead will lie in structuring and gaining public acceptance of these more far-reaching policies. A convincing case for their importance will be required, as will the timely introduction of many complementary policies, such as infrastructure investments and land use planning, that will foster acceptance and facilitate the desired long-term energy- and emissions-saving response.

12 Policy Options for Reducing Energy Use and Greenhouse Gas Emissions from U.S. Transportation
Research to Inform Strategic Policy Making
Although this study was not tasked with developing a research agenda, the challenges discussed in the report point to the long-term importance of making near- and medium-term policy choices on a well-informed, strategic basis. A policy-making approach that is strategic will require research that goes beyond the traditional role of supporting technology advancement. It will require information and analytic techniques that are drawn from multiple fields and disciplines—for example, economics research on the connections between transportation and productivity, political research on how policies can be coordinated across jurisdic-tions, and behavioral research that yields a better understanding of how consumers value future streams of energy savings. With such informa-tion, policy makers will be in a better position to assess how alternative policies are likely to interact with one another, the lead times that specific measures will require for maximum effectiveness, and the actions that will be needed to put favored policies into effect.
Such research can inform many relevant decisions. It can reveal to transportation agencies the importance of making the operation of their networks more energy efficient and responsive to the needs of consum-ers faced with higher fuel taxes. It can reveal how other public policies, such as truck size and weight regulations, may affect the goal of reduc-ing sector energy use and emissions. It can help in understanding how energy flows on a systemwide basis so that the impacts of mode-specific policies can be better assessed. The scale, uses, and constraints of the transportation sector need to be well understood when the potential for new vehicle and fuel technologies to have meaningful effects on the sector’senergyandemissionsperformanceisassessed.Moregenerally,research can yield a stronger understanding of how policies to promote new energy and transportation technologies may affect petroleum prices, energy consumption, and GHG emissions in other parts of the world and in other sectors of the economy such as manufacturing, construction, and agriculture.
Whichever strategic combination of policies is pursued, success in introducing and sustaining them will ultimately depend on the public’s

Summary 13
resolve to conserve energy and reduce GHG emissions from transporta-tion and other sectors. For decades, there have been ample reasons for the public to care a great deal about saving energy in transportation—from the need to improve air quality to concern over the world’s oil supplies. Climate change has added to and elevated this public interest. Although calls for a strategic alignment of public policies to meet these interests are not new, they are becoming more urgent.


15
This study examines challenges and opportunities associated with reduc-ing the use of petroleum fuels and emissions of carbon dioxide (CO2) and other greenhouse gases (GHGs) by the U.S. transportation sector over the next half century. As explained in the study’s statement of task (Box 1-1), the emphasis is on reviewing candidate strategies and policy options for achieving this outcome.
In 1997, a Transportation Research Board committee conducted a sim-ilar study of transportation’s contribution to GHG buildup in the atmo-sphere and urged a program of research to identify government policies to curb the sector’s growing energy use and emissions (TRB 1997). During the late 1990s, however, fuel prices were falling, and any underlying public interest in reducing energy use did not slow the upward trend in energy demand. Federal fuel economy standards remained flat, and Americans increasingly bought larger and more fuel-intensive cars, pickup trucks, and sport utility vehicles. Transportation activity grew rapidly in nearly all modes, particularly by car, truck, and airplane.
Several developments over the past decade have renewed public con-cern over transportation’s use of energy, and particularly its near exclusive use of petroleum fuels. Swings in oil prices have burdened consumers, hampered the economy, and increased the risk of investing in energy alter-natives. The threat of global climate change from the atmospheric buildup of CO2 emitted from the burning of petroleum and other carbon-rich fossil fuels has heightened this public concern. The September 11, 2001, terrorist
Study Purpose and Background1

16 Policy Options for Reducing Energy Use and Greenhouse Gas Emissions from U.S. Transportation
attacks and the wars in Iraq and Afghanistan are viewed by many as being linked to the massive transfer of wealth to politically unstable regions of the world that supply much of the petroleum used for transportation. And the offshore oil drilling calamity in the Gulf of Mexico during spring and summer 2010, which occurred while this study was under way, is another compelling reason for finding ways to curtail demand for oil and to lessen the incentive for exploiting increasingly costly and environmentally risky oil reserves.
In the case of climate change, much research and modeling have been undertaken during the past decade to ascertain the magnitude of reduc-tions in fossil fuel use and GHG emissions required worldwide and on the part of the United States to limit global climate risks.1 In the aggregate,
This project will examine the challenges and opportunities associated with reducing the use of petroleum fuels and emissions of greenhouse gases (GHGs) from the U.S. transportation sector. It will review policy approaches and strategies to affect the amount of transportation activity and the energy and GHG efficiency of transportation vehicles and their operations across all passenger and freight modes that are major contributors to the sector’s demand for fuel and emissions of GHGs. The emphasis will be on policy and strategy options whose adoption can have meaningful effects on fuel and emissions trends over the next 20 to 50 years. The discussion of options should recognize that decision makers must also take into account the safety, economic, transportation finance, environmental, and other consequences of their choices. The committee will not assess the specific consequences on climate change of the options it examines and it will not recommend any particular option. The report will offer insight on the potential energy and GHG reduction impacts of various options and the pros and cons of pursuing each. Although the report will place the U.S. transportation sec-tor’s contribution to fuel use and GHG emissions in both a national and worldwide context, the analysis of strategies will focus on those the United States can implement.
box 1-1
Statement of Task
1 A review of the state of climate change science is contained in the recent suite of reports produced by the National Research Council project America’s Climate Choices. See http://americasclimatechoices.org/.

Study Purpose and Background 17
this work reveals a challenge that goes well beyond making incremental cuts in fossil fuel use. The scale of emissions cuts needed to stabilize GHG buildup may require the decarbonization of most of the world’s energy supplies and their production methods by the middle of the cen-tury. For the transportation sector to contribute meaningfully to these reductions will almost certainly require early and sustained increases in the energy and emissions efficiency of vehicles and system operations and an eventual shift to low- and no-carbon fuels. Absent dramatic progress in increasing system efficiency and diversifying the energy supply, the total volume of transportation activity may need to be reduced, particu-larly in the most energy- and emissions-intensive transportation modes.
Such changes will not be easy to bring about through public policy. The transportation sector is fragmented and ubiquitous. It is integral to the national economy, intertwined in the daily lives of Americans, and provided through an intricate mix of private and public entities. Policy changes that affect the cost structure, technology, and functioning of the system have implications that extend well beyond the transportation sector, affecting where people live and work; where they shop, socialize, and vacation; and how businesses are structured and operate. Thus, how policy measures are likely to play out to yield reductions in energy use and GHG emissions can be difficult to predict. The more urgent the need to make deep cuts in energy use and emissions from transportation, the more likely are required policy actions to be disruptive to households and commerce and to present policy makers at all levels of government with difficult choices.
The appendix explains why scientists have urged action to stabilize GHG concentrations by making deep and sustained emissions reduc-tions over the next several decades. Stabilizing GHG concentrations will likely require much lower emissions from all energy-using sectors and all regions of the world. While the actions taken in individual sectors and countries will be crucial, their cumulative impacts will be of greatest relevance. The U.S. transportation sector now accounts for about 25 to 30 percent of the CO2 emitted in this country and about 5 percent of worldwide emissions. Therefore, significant reductions in emissions from the U.S. transportation sector may have only modest effects glob-ally. The fact that most countries and most economic sectors contribute

18 Policy Options for Reducing Energy Use and Greenhouse Gas Emissions from U.S. Transportation
only marginally to global emissions means that substantial progress can only be made through collective actions.
In light of the global nature of the climate change problem, the next section explains the rationale for this study, which focuses on strategies for reducing energy use and emissions from one sector in one country—that is, U.S. transportation. Background is then provided on the current use of petroleum and other fossil fuels in U.S. transportation and on pro-jections of consumption over the next two to three decades. Although the CO2 produced from the burning of petroleum is the main source of GHGs from transportation, several other GHGs are emitted, and they are reviewed briefly. The chapter concludes by outlining the organization of the remainder of the report.
Why Examine Policies for a Single Sector, Transportation?
Until recently, the emphasis of federal policy to reduce transportation’s energy use has been on setting standards for automobile fuel economy and to a lesser degree on fostering alternatives to single-occupant driv-ing and promoting various alternative fuels and vehicles. For more than 30 years, the primary federal policy to reduce energy use has been the Corporate Average Fuel Economy (CAFE) program. CAFE establishes fleetwide average fuel economy minimums for manufacturers of cars and light trucks. Various other programs have been instituted (and in some cases withdrawn) over the years to promote automotive fuel effi-ciency and oil conservation, including excise taxes on “gas-guzzling” cars, fuel economy labeling requirements for new cars and light trucks, a national highway speed limit, capital grants for the supply of mass transit services, and programs to promote ridesharing. For the most part, the other major domestic freight and passenger modes—trucking, rail, and aviation—have not been subject to similar federal efforts intended to curtail their energy consumption.
In recent years, additional policies have been introduced to reduce GHG emissions from light-duty vehicles as well as other modes. After years of remaining unchanged, the CAFE standards were restructured and tightened. Federal energy policies were modified to include mea-sures aimed at diversifying the fuel supply and vehicle technologies
Study Purpose and Background 19
through mandates for the use of advanced biofuels, R&D support for alternative energy sources and propulsion systems for vehicles (e.g., bat-teries, hydrogen fuel cells), and tax incentives for the development and purchase of vehicles powered by electricity. A 2007 ruling by the U.S. Supreme Court that GHG emissions are candidates for regulation under the Clean Air Act (CAA)2 is prompting even more policy attention. After actions by California and several other states to regulate GHG emissions from automobiles, the U.S. Environmental Protection Agency (EPA) has exercised its CAA authority to introduce GHG performance standards for cars and light trucks starting in model year 2012, and the agency is expected to introduce similar standards for trucks and possibly vehi-cles in other modes. These standards represent the first concerted effort at the federal level to regulate transportation for the express purpose of GHG mitigation.
Whether targeting the GHG emissions of transportation or any other individual energy-using sector is useful is a subject of debate. Even as EPA was devising GHG performance standards for light-duty vehicles during 2009, Congress was working on legislation to create a broader, market-oriented means of GHG reduction through economywide carbon pric-ing. The basic premise of such a program is that the setting of a national price on emissions of CO2 and other GHGs would cause an increase in the retail price of hydrocarbon fuels used across the economy, including the gasoline, diesel, and jet fuels used in transportation. Businesses and households would be expected to respond in various ways to curb their consumption of these fuels—for example, by using and demanding prod-ucts having greater energy efficiency, switching to lower-carbon energy supplies, and cutting back on their least valued energy- and emissions-intensive activities. The least costly responses to the higher prices would be taken first, causing varying degrees of energy and emissions reduction within and across economic sectors.
By generating such a broad response, economywide carbon pricing is generally viewed as having the greatest potential to bring about emissions cuts through the widest array of means at the lowest overall cost. Sector-specific policies such as vehicle efficiency regulations and mandates for
2 Massachusetts v. Environmental Protection Agency, 549 U.S. 497 (2007).

20 Policy Options for Reducing Energy Use and Greenhouse Gas Emissions from U.S. Transportation
the supply of lower-carbon fuels have a decidedly narrower effect. How-ever, as evidenced by the difficulties of introducing national carbon pric-ing, sector-specific policies have demonstrated greater potential for early implementation.
transportation’s expected limited response to carbon pricingMost economic models projecting the effects of economywide carbon pricing assume that households and businesses will face significant con-straints in making adjustments to their vehicles and travel patterns that will make them less responsive, at least initially, to the higher cost of buy-ing gasoline and diesel. These assumptions derive largely from the trans-portation sector’s lack of energy alternatives, which contributes to a low fuel price elasticity of demand. Whereas operators of large electric power plants can substitute natural gas for coal, transportation vehicles have lit-tle room for energy storage, must be refueled often, and have significant range and power requirements that demand fuels with high energy den-sity and handling ease. Gasoline and diesel fuels meet these use require-ments, but few other fuels do. Other constraints include the expense and time required to transition the large and diverse vehicle fleet—owned by tens of millions of households and businesses—and to make changes in the vast physical infrastructure that is used and served by transpor-tation. The infrastructure consists of both transportation facilities and the built environment of homes, businesses, and other establishments. The latter are often situated in relatively low-density urban and suburban areas that are configured to be served by personal vehicles and trucks. Hence, even as transportation fuel prices rise in response to carbon pric-ing, the speed at which fuel consumption declines will depend largely on both the incentive and the ability of households and businesses to adjust their vehicles, mobility demands, and travel patterns.
The expectation that transportation will not respond as quickly to carbon pricing as some other sectors is often used as justification for urging that additional actions be taken to reduce energy use by and emis-sions from transportation. However, there is no expectation that a carbon pricing program will yield impacts across energy-using sectors that are

Study Purpose and Background 21
proportional to the emissions produced by each sector, simply because the marginal cost of reducing emissions is likely to vary both within and across sectors. The most cost-efficient outcome may not be one that is proportional. Indeed, an imbalance in the response is to be expected. By itself, this is not a reason for pursuing additional actions in transporta-tion or any other sector that does not respond proportionally.
The acceptability of a sector-specific measure to elected officials may depend on considerations other than whether it yields the most cost-efficient outcome, such as the policy’s potential for preventing undesir-able or disproportionate impacts on specific regions of the country, demographic and income groups, and industries. Another practical consideration favoring sector-specific actions is the prospects for achieving a carbon pricing system, which do not appear to be high, at least in the near term. Although carbon pricing programs are in effect in Europe and to a limited degree in some regions of the United States, there is no guarantee that such programs, or any other economywide measures, will be instituted nationally during the next decade or more. The prospect that the GHG problem may become even harder to con-trol as time passes and emissions accumulate could be a factor favoring sector-based policies.
Although sector-specific policies in the transportation domain are often equated with regulation, they can encompass much more than standards and mandates for the supply of energy- and emissions-efficient vehicles and fuels. They can include transportation-targeted pricing instruments, such as higher taxes on motor fuel, higher registration fees for inefficient vehicles, and the use of other forms of taxes and financial incentives to raise consumer and supplier interest in energy- and emissions-saving products and activities. In addition, most of the infrastructure systems used by transportation vehicles are owned and operated by state and local governments. These public entities influence transportation energy use and emissions through their control of system use and their investments in system capacity and traffic operations. Fur-thermore, the policies of state and local governments influence patterns of land development, which in turn can affect transportation activity. For example, local zoning policies can affect whether residential and

22 Policy Options for Reducing Energy Use and Greenhouse Gas Emissions from U.S. Transportation
commercial development take place at the higher densities needed to support public transit use.
other reasons for targeting policies at transportationMitigation of GHGs is not the only reason for giving special attention to transportation’s use of energy. Transportation accounts for most of the nation’s petroleum demand and is the only energy-using sector that is almost entirely dependent on this fuel, most of which is imported into the United States. Transportation’s dependence on petroleum has contributed to concern over the world’s oil supplies, most of which are from politi-cally unstable regions of the world (Council on Foreign Relations 2006). A Rand Corporation study has estimated that the United States might have saved an amount equal to between 12 and 15 percent of its Fiscal Year 2008 defense budget if all concerns over securing oil from the Persian Gulf were to disappear (Crane et al. 2009).
Transportation’s use of petroleum has other troubling side effects. The growing consumption of petroleum around the world coupled with fewer readily exploited oil reserves has contributed to large fluctuations in oil prices. During the past dozen years, oil prices have ranged from $20 to $140 per barrel. This price volatility creates many challenges for petroleum users and suppliers, as well as for manufacturers of vehicles and other products that use petroleum fuels and for investors in alternative energy supplies. A particular concern is that oil price volatility can have pernicious effects on the diversification of transportation energy sources and technologies by discouraging capital-intensive investments that require long payoff peri-ods. Diversification of energy supplies could be instrumental in curbing demand and dampening oil price volatility in the long run.
The burning of petroleum fuels in transportation contributes to other problems, such as local and regional air pollution. The byproducts of petroleum fuel consumption, such as emissions of oxides of nitrogen, carbon monoxide, volatile organic compounds, and aerosols, are sources of metropolitan and regional air pollution detrimental to humans and the environment. Flammable petroleum fuels can create public safety risks when they are released in heavily traveled transportation corridors. Environmental disturbances from oil exploration, extraction, and refin-ing activities have been controversial for decades. Oil leaks and spills
Study Purpose and Background 23
are sources of both chronic and acute environmental disturbances—they infect groundwater, sully surface waters, and cause harm to marine life and ecological and economic damage along shorelines.
Informing Transportation Policy Choices
This report does not advise on whether the U.S. transportation sector should be the subject of special policy actions to reduce its consump-tion of energy and emissions of GHGs. Nor does it urge the pursuit of specific policies. Decisions about whether and how best to reduce transportation energy use and emissions must involve numerous con-siderations that go well beyond the study scope and expertise of the committee. Elected officials must make these decisions after weigh-ing the costs and benefits of reducing energy use and GHG emissions, assessing where the greatest opportunities lie to achieve desired reduc-tions from the economy as a whole, and taking into account the eco-nomic and societal distribution of the costs associated with specific policy actions. Not having examined all of these implication or oppor-tunities to reduce energy use and emissions in other sectors, this study committee is not in a position to offer advice on how much attention should be paid to transportation. Nevertheless, it is self-evident that if deep reductions in GHG emissions are desired across the economy by the middle of the century, all of the country’s energy-intensive sectors will need to make meaningful contributions.
Knowledge of the economics of the transportation sector is important in making sound policy decisions. For example, knowledge of the extent to which fuel represents a major operating cost is important in consider-ing transportation policy options. Fuel is a major input for carriers pro-viding long-distance passenger and freight services, such as airlines and trucking companies, and these carriers operate in highly competitive and cost-conscious industries. Under these circumstances, will policy mea-sures that cause relatively small increases in fuel prices spur industry-wide interest and investments in fuel-saving technologies and practices? Conversely, since the same profit and efficiency motives do not exist for most cars and light trucks owned by private households, will fuel pricing policies produce a weaker energy consumption effect?
24 Policy Options for Reducing Energy Use and Greenhouse Gas Emissions from U.S. Transportation
Knowledge of the structure of the industry, including how the varied mix of public and private entities in different modes can affect the policy response, is also important. For example, freight railroads own and oper-ate their locomotives and tracks; hence, they have a large amount of lati-tude to adjust their operations, equipment, and infrastructure to control energy costs. In contrast, most of the highways, airports, and airways that are used by commercial trucking companies and airlines are owned and operated by government agencies. As a consequence, these carriers cannot control many aspects of operations, such as traffic conditions and routing options, that can affect their energy usage.
These are but a few examples illustrating how an understanding of the functioning and diversity of the transportation sector is important in making policy choices. Furthering this understanding to support sound policy making is the aim of the remainder of this report.
Transportation’s Current Dependence on Fossil Fuels
Since the invention of coal-powered steamships and trains in the early 19th century, transportation has been increasingly reliant on fossil fuels for energy. Oil, rather than coal, is now the predominant energy source, and it accounts for 97 percent of the energy used in the sector.3 Petroleum fuels made from crude oil power nearly all cars, trucks, ships, and air-craft. They power the vast majority of buses and freight trains. The only motorized modes not powered almost exclusively by petroleum fuels are some commuter and urban transit railways. While these modes run wholly or partly on electric power, much of this energy too is generated from the burning of coal and other fossil fuels by electric utilities.
The transportation sector accounts for about two-thirds of the liq-uid petroleum fuels consumed each year in the United States. By far the largest users are cars, trucks, and other motor vehicles. The light-duty fleet, consisting of approximately 140 million cars and 100 million light trucks, accounts for about 68 percent of transportation’s use of petro-leum, mainly gasoline (Figure 1-1). Larger single-unit and combination (tractor-trailer) trucks, nearly all of which run on diesel fuel, consume
3 Transportation Energy Data Book 27 (http://cta.ornl.gov/).

Study Purpose and Background 25
an additional 19 percent. The fleet of jet and turboprop aircraft that are used for passenger service, air cargo, and business aviation has the next largest share of fuel consumption, accounting for nearly 9 percent. All other modes combined account for less than 5 percent of the sector’s petroleum use.
The fact that three basic vehicle types—cars, trucks, and aircraft—account for about 95 percent of transportation fuel use stems in large part from their relatively high energy requirement per unit of transportation output. The main reason why highway vehicles consume so much petro-leum is that they account for the large majority of the people and goods moved in transportation. Cars and light trucks account for 85 percent of all passenger miles, while airlines account for the next largest share at 12 percent (Figure 1-2). Collectively, public transit, motor coaches, inter-city passenger trains, and general aviation aircraft make up only 3 per-cent of total passenger miles. Freight traffic is more evenly split among the truck, rail, and water modes (Figure 1-3). Nevertheless, trucks move almost half the nation’s freight, as measured in ton-miles, including
Cars and lighttrucks (68%)
Passenger airlines(5.9%)
General aviation(1.3%)
Motor coach(0.2%)
Transit bus and rail(0.4%)
Commuter rail(0%)
Intercity passengerrail (0%)
Freight railroads(2.1%)
Combinationtrucks (14.2%)
Single-unittrucks (5.1%)
Domestic waterways(1.3%)
Cargo airlines(1.5%)
figure 1-1
Share of petroleum fuel consumption by U.S. domestic transportation mode, 2007.
Note: The volume total consists of consumed gallons of gasoline, diesel, and jet fuel and does not account for differences in energy content of each type of fuel by volume. Percentage shares by mode were calculated by the committee on the basis of various government and industry data sources. Fuel used during the transmission and distribution of commodities by pipeline is excluded from the totals.

26 Policy Options for Reducing Energy Use and Greenhouse Gas Emissions from U.S. Transportation
Cars and lighttrucks (84.8%)
Airlines(12.5%)
General aviation(0.4%)
Motor coach(1.3%)
Transit bus and rail(0.6%)
Commuterrail (0.2%)
Intercity passengerrail (0.1%)
figure 1-2
Share of U.S. domestic passenger miles by mode, 2007.
Note: Percentage shares by mode were calculated by the committee on the basis of various government and industry data sources.
figure 1-3
Share of U.S. domestic freight ton-miles by mode, 2007.
Note: Percentage shares by mode were calculated by the committee on the basis of various government and industry data sources.
Freight railroads(38%)
Combination trucks(42.5%)
Single-unit trucks(5.7%)
Domestic waterways(13.4%)
Airlines(0.3%)

Study Purpose and Background 27
nearly all freight shipped over shorter distances (less than 100 miles), which are not conducive to service by other modes. The widely used ton-mile metric does not fully convey the ubiquity of trucks, which carry many low-density goods that are in low in total tonnage but are moved many miles.
Outlook for Transportation Energy Use
Since 1982, the Energy Information Administration (EIA) of the U.S. Department of Energy (DOE) has produced long-range energy projec-tions by using its National Energy Modeling System (NEMS). NEMS is a general equilibrium model that includes assumptions about many fac-tors expected to influence future U.S. energy use, including the rate of development and deployment of energy-saving technologies, trends in energy prices, the effects of new federal energy policies, and national eco-nomic and demographic trends.
DOE uses NEMS to produce its Annual Energy Outlook (AEO) cover-ing the next 25 years.4 The AEO projects and analyzes U.S. energy supply, demand, and prices. Although the AEO release for 2011 is now available, the projections referenced here are from the AEO issued in January 2010, when this report was being developed. In the January 2010 AEO reference case, EIA assumes that cars and light trucks will remain the dominant means of personal transportation in the United States, although the total amount of energy used by these vehicles is expected to remain relatively stable, increasing by only 10 percent from 2010 to 2035 (Figure 1-4). Planned increases in federal fuel economy and GHG performance stan-dards are assumed to counteract most of the upward pressure on energy demand that will be caused by a growing U.S. population and economy. Most of the NEMS-projected growth in transportation energy use is expected to come from freight trucks (Figure 1-5). NEMS assumes that trucking, like all other modes, will become more energy efficient over time; the growth in freight demand from an expanding economy is the cause of this mode’s increase in fuel use.
4 AEO 2010 includes a reference case and additional cases examining alternative energy prices and rates of technology development. http://www.eia.doe.gov/oiaf/archive/aeo10/index.html.

2006 2008 2010 2012 2014 2016 2018 2020 2022 2024 2026 2028 2030 2032 2034
Ener
gy U
se (t
rilli
on B
tu)
Light-duty vehiclesAutomobilesLight trucksMotorcyclesCommercial light trucks
20,000
18,000
16,000
14,000
12,000
10,000
8,000
6,000
4,000
2,000
0
figure 1-4
AEO 2010 reference case projections of energy use (in British thermal units) by light-duty vehicles to 2035.
20062007
20082009
20102011
20122013
20142015
20162017
20182019
20202021
20222023
20242025
20262027
20282029
20302031
20322033
20342035
Fuel
Ene
rgy
Cons
umpt
ion
(tri
llion
Btu
)
7,000
6,000
5,000
4,000
3,000
2,000
1,000
0
Freight trucksFreight railDomestic shipping
figure 1-5
AEO 2010 reference case projections of energy use (in British thermal units) by major domestic freight modes through 2035.

Study Purpose and Background 29
A number of demographic and macroeconomic factors drive the AEO projections. In addition to growth in population and gross domes-tic product (which are projected to increase by 0.9 and 2.5 percent per year, respectively), the assumed trend in energy prices is a critical fac-tor. Petroleum is assumed to remain the dominant source of fuel for all transportation modes. The AEO 2010 reference case assumes that the real price of gasoline will be 50 percent higher by 2035, rising from $2.69 to $3.91 per gallon. Diesel and jet fuel prices are projected to grow similarly. In the case of light-duty vehicles, gasoline consumption is pro-jected to remain flat during the period as a result of the tighter federal fuel economy and GHG performance standards as well as the increas-ing use of ethanol to replace some gasoline in compliance with federal renewable fuels mandates (Figure 1-6).
figure 1-6
AEO 2010 reference case projections of energy use (in British thermal units) by light-duty vehicles through 2035.
20062007
20082009
20102011
20122013
20142015
20162017
20182019
20202021
20222023
20242025
20262027
20282029
20302031
20322033
20342035
Fuel
Ene
rgy
Cons
umpt
ion
(tri
llion
Btu
)
18,000
16,000
14,000
12,000
10,000
8,000
6,000
4,000
2,000
0
Energy consumed from other fueltypes is too small to appear in chart
Motor gasolineEthanolDistillate fuel oil (diesel)

30 Policy Options for Reducing Energy Use and Greenhouse Gas Emissions from U.S. Transportation
For the U.S. economy as a whole, AEO 2010 projects that total energy consumption will be about 20 percent higher in 2035 than today (Fig-ure 1-7). The energy used by transportation, however, is projected to grow by 16 percent. Transportation’s share of national energy consump-tion will therefore remain fairly stable.
Transportation Energy Use and GHG Buildup
Concerns over energy consumption and GHG emissions are interrelated because most of the energy used throughout the world is derived from fossil fuels. In 2009, the United States emitted about 6.6 billion metric tons (6.6 Gt) of CO2-equivalent GHGs.5 While CO2 is also emitted from industrial processes such as cement manufacturing, the consumption of fossil energy is its main source, contributing about 82 percent of the total U.S. emissions of GHGs (Figure 1-8). Two other major GHGs—methane and nitrous oxide—make up most of the remaining emissions. In total,
1980 1990 2000 2009 2015
Qua
drill
ion
Btu
History Projections
Industrial
Transportation Residential
Commercial
203520250
10
20
30
40
figure 1-7
AEO 2010 reference case projections of U.S. energy consumption (in British thermal units) by major economic sector.
5 Because GHGs differ in their potential to affect warming, each gas is assigned a unique weight, called a global warming potential. This weighting is based on the heat-absorbing ability of each gas relative to CO2 over a defined time period. Each gas is thus assigned a CO2-equivalent (CO2-eq) value. The CO2-eq values in this report are calculated for a 100-year period.

Study Purpose and Background 31
the United States accounted for about 20 percent of world energy-related emissions of CO2 in 2007.6
The appendix explains why scientists and others are urging action to stabilize GHG concentrations by making deep emissions reductions over the next several decades. Determining by how much emissions will need to be reduced worldwide and in the United States over the next half century is complicated by a range of uncertainties. Among them are the degree of international action that will take place and the forces that will influence global emissions over a period of decades such as changes in population, economic development, and technology advancement. Even stabilization of emissions at current levels for the next four decades will present challenges if increases in population and economic growth continue as expected. Nevertheless, for reasons given in the appendix, annual emissions that are 50 to 80 percent lower in 40 years than they are today are widely viewed by scientists as being minimally necessary to limit the risk of dangerous changes in climate. Achievement of such deep reductions in the United States would have significant impacts on all energy-using sectors, including transportation.
figure 1-8
U.S. emissions of GHGs from human activity in 2009 (in millions of metric tons of CO2-eq).
GWP = global-warming potential.Source: http://www.eia.gov/environment/emissions/ghg_report/.
6 http://www.eia.gov/environment/emissions/ghg_report/pdf/tbl4.pdf.
Energy-related carbondioxide, 5,359.6, 82%
High-GWP gases,87.3, 1%
Methane,219.6, 3%
Nitrous oxide,730.9, 11%
Other carbon dioxide,178.2, 3%

32 Policy Options for Reducing Energy Use and Greenhouse Gas Emissions from U.S. Transportation
ghgs from transportation energy useThe combustion of a single gallon of gasoline, diesel, and other petro-leum fuels (such as jet fuel) yields between 19 and 23 lb of CO2. Accord-ingly, 1 metric ton (2,204 lb or 1,000 kg) of CO2 is emitted from every 95 to 115 gallons consumed. In burning approximately 200 billion gal-lons of gasoline, diesel, and jet fuel each year, U.S. transportation pro-duces about 1.8 Gt of CO2 annually.
While the main source of GHGs from transportation is the CO2 produced from the fuel burned to power vehicles, fossil energy is con-sumed and GHGs are emitted during the manufacture of these vehicles and the construction and maintenance of transportation facilities and infrastructure. In addition to the CO2 emitted from fuel combustion, CO2, methane, and other GHGs are emitted during the extraction, refining, and distribution of transportation fuels before they are ever pumped into the vehicle. Uncertainty with regard to the total amount of GHGs emitted from such “upstream” sources, including those residing outside the coun-try, is greater. EPA has estimated that for every 100 lb of CO2 emitted from the burning of conventionally derived gasoline, another 20 to 25 lb of CO2-equivalent gases is emitted during fuel production and distribution.7
The uncertainty with regard to GHG emissions grows when the effect of the production of alternative fuels on net GHG emissions is consid-ered. The potential exists for the production of biofuels, through the cultivation of land, to reduce the capacity of the world’s carbon sinks to store carbon and remove GHGs from the atmosphere. For example, conversion of land for the growing of biomass can release carbon stocks from soil, creating emissions of the GHGs CO2 and methane (CH4). It can also lead to the emission of the GHG nitrous oxide (N2O). Analyses of carbon cycle flows must account for the release of carbon stocks in assessing whether these fuel alternatives can help reduce the contribution of transportation to the atmospheric buildup of GHGs.
7 The estimation of total life-cycle GHG emissions from fuels, including petroleum fuels, requires many assumptions about the emissions characteristics of the fuel production process. EPA’s life-cycle figures for gasoline are derived from a presentation to the committee by Sarah Dunham, Director of EPA’s Transportation and Climate Division, “Update on EPA’s Transportation and Climate Activities,” July 16, 2009. These figures are consistent with those used by others, including Heywood (2008, 7), who assumes that petroleum fuel production and distribution processes add about 20 percent to total carbon emissions from petroleum fuel consumption.

Study Purpose and Background 33
other transportation sources of ghgs
Fully accounting for transportation’s GHG sources can become more com-plex as the scope of transportation-related activity and infrastructure is expanded, since CO2 and other GHGs are produced from transportation sources other than fuel consumption. Refrigerant leaks from vehicle air-conditioning systems, for example, are a source of hydrofluoro carbons, which are powerful and long-lived GHGs.8 Moreover, transportation activity is the source of other substances and disturbances that can affect climate. Aircraft, for instance, emit water vapor and other aerosols, which can encourage the formation of clouds, with positive or negative effects on the earth’s radiative balance. Although it is not a GHG, the black car-bon (or soot) emitted in exhaust from transportation vehicles that use diesel and other heavy fuels can settle on Arctic snow and increase the rate of melting and create other short-term warming effects. The magni-tude of the climate effects from these other substances will differ on the basis of numerous factors, including where and when the substances are released.
If the boundaries of the transportation sector are extended further, emissions sources can be considered even more extensive, encompass-ing the activities involved in the construction, operation, and mainte-nance of transportation facilities and the materials and energy used in the manufacture and disposal of transportation vehicles and their parts. Steel, aluminum, cement, and asphalt—key materials in transportation infrastructure and equipment—are produced through energy-intensive industrial processes that release CO2 from fossil fuel combustion. GHGs are also emitted through means other than energy use, including produc-tion processes that involve chemical reactions such as limestone calcina-tion during cement production. Fossil energy is consumed to heat and cool transportation-related structures and buildings, such as bus and train stations, airports, parking garages, marine terminals, and warehouses.
Many of these other transportation-related sources of GHG emissions are included in the emissions inventories for other economic sectors,
8 As explained later, EPA expects that reductions in GHGs (hydrochlorofluorocarbons) emitted from vehicle air-conditioning systems will be one means by which automobile manufacturers strive to meet the new federal GHG performance standards for cars and light trucks.

34 Policy Options for Reducing Energy Use and Greenhouse Gas Emissions from U.S. Transportation
such as buildings and manufacturing. Therefore, any conversion to new types of transportation vehicles and infrastructure that involves much different equipment, materials, and manufacturing processes will have implications (positive or negative) for the GHG emissions observed in these other sectors.
Report Organization
Chapter 2 presents an overview of the U.S. transportation system. It describes the scale, scope, and patterns of personal and goods transpor-tation in the United States and factors that have been driving trends in activity. It also describes the energy use and associated emissions char-acteristics of the modes, including factors that influence user demand for energy efficiency and emissions performance. The chapter portrays a transportation sector that is diverse and dynamic.
Chapter 3 discusses the decision-making and institutional context in which transportation policy choices will need to be made over the next several decades. Effective policy making will require the contribution of many different actors and an alignment of many different interests. The actors include both public and private entities, ranging from large orga-nizations to individual households. The chapter also discusses current policies affecting transportation energy use and emissions.
Chapter 4 examines some of the key factors that are likely to influence energy use and emissions in the modes that contribute to them the most. The focus of the discussion is on cars and light trucks, freight-carrying trucks, and passenger airlines. In each case, factors likely to have important effects on energy and emissions trends are identified, and projections of modal fuel use and emissions are developed to illustrate them. It is rec-ognized that some of these factors may be prime candidates for policies targeted to reduce transportation energy use and emissions.
The background and analyses in Chapters 2 through 4 allow for a more focused assessment of the main policy instruments available to reduce energy use and emissions in the U.S. transportation sector. Chap-ter 5 examines several policy options and their ability to affect the main sources of transportation energy use and emissions in the future. The options examined represent a range of approaches, from fuel taxes and
Study Purpose and Background 35
efficiency standards to a more targeted set of measures aimed at reducing household vehicle use. Because some of the policies are market-oriented, some are regulatory, and some are hybrids, they bring about different responses by users and suppliers of transportation fuels and vehicles. They also have different track records of implementation. The different responses that policies engender, and the varying prospects for policy implementation, are important considerations in deciding on the mix of policy instruments required to achieve energy and emissions goals.
Chapter 6 offers a summary assessment of the information and analy-ses in the report and the implications for policy making. Consideration is given to how a policy goal of deep reductions in transportation’s petro-leum use and GHG emissions over the next half century can be achieved from the kinds of policies currently in effect as well as other policies that will broaden the response. Adopting policies that will cause both the users and suppliers of transportation fuels and vehicles to respond with a strong interest in saving energy and reducing emissions is the funda-mental policy challenge.
References
abbreviationTRB Transportation Research Board
Council on Foreign Relations. 2006. National Security Consequences of U.S. Oil Dependency. http://www.cfr.org/content/publications/attachments/EnergyTFR.pdf.
Crane, K., A. Goldthau, M. Toman, T. Light, S. E. Johnson, A. Nader, A. Rabasa, and H. Dogo. 2009. Imported Oil and U.S. National Security. MG-838-USCC. Rand Corporation. http://www.rand.org/pubs/monographs/MG838.html.
Heywood, J. B. 2008. More Sustainable Transportation: The Role of Energy Efficient Vehicle Technologies. April 10. http://www.internationaltransportforum.org/ Topics/Workshops/WS1Heywood.pdf.
TRB. 1997. Special Report 251: Toward a Sustainable Future: Addressing the Long-Term Effects of Motor Vehicle Transportation on Climate and Ecology. TRB, National Research Council, Washington, D.C.


37
Transportation—the movement of people and goods—is central to economic activity and to the daily lives of Americans. A well-functioning transportation system allows people to access more places of work, obtain a wider range of goods and services, and connect socially over broader areas. It allows businesses to situate in locations that are best suited to accessing labor, raw materials, and customers. Until the 19th century, local travel was limited by the distance people could walk or ride under horse power. Overland goods transportation was limited to relatively small shipments moved by horse-drawn wagons over poorly built and main-tained roads. Wind- and human-powered ships could carry people or goods greater distances over the waterways, but at slow speeds and often at con-siderable risk. These circumstances placed restrictions on where people could live and work, how businesses could organize, and how societies could specialize and trade.
The application of steam power to inland and oceangoing ships and to locomotives operating on steel rails marked a dramatic break with the long history of nonmechanized transportation. By the end of the 19th century, electricity was being used to power streetcars in dozens of cities and the internal combustion engine was being introduced to power small auto-mobiles. These innovations, all made possible by the use of fossil fuels—first coal and then petroleum—led to radical increases in transportation speed and radical decreases in transportation costs. Changes in the locations and interactions of people and businesses followed the introduction of
U.S. Transportation Today2

38 Policy Options for Reducing Energy Use and Greenhouse Gas Emissions from U.S. Transportation
faster and cheaper modes of transport. Along with dramatic improvements in communications, advances in transportation were critical in enabling today’s socially and economically integrated world.
The progress in transportation has entailed large costs, many stem-ming from the fossil fuels used for energy. Since the phasing out of coal to power railroads and ships, the transport sector has become almost totally dependent on petroleum-based fuels and is now the largest single source of demand for petroleum in the United States and worldwide. Transportation has thus become a major source of emissions of carbon dioxide (CO2) and other greenhouse gases (GHGs) as well as the root cause of other environ-mental disturbances such as oil spills and leaks. In addition, because of its dependence on oil, transportation is the main reason for the country’s interest in ensuring the security of the world’s oil supplies.
This chapter presents an overview of the U.S. transportation system today. The scale, scope, and patterns of personal and goods transportation are described, and the energy use and associated emissions characteris-tics of the major transport modes are summarized. Some of the databases examined in this chapter, which was developed during 2009, have under-gone updates that could not be included here.1 While the updates do not appear to convey trends or relationships that are fundamentally different from those presented in the chapter, their analyses over the next several years should prove valuable for energy policy making.
Scale, Scope, and Patterns of Personal and Goods Transportation
Discussions of transportation generally distinguish between the trans-portation of people and the transportation of goods. The two activi-ties are measured differently and are believed to play different roles in the economy. Yet the boundary between them is not always distinct and tends to change over time. Consider the evolution of transporta-tion’s role in how people shop for goods. Before nearly every household
1 For example, during 2010 the U.S. Department of Transportation began releasing data from the 2009 National Household Travel Survey (NHTS). However, the release occurred too late for inclusion in this report, which thus cites the 2001 NHTS data.

U.S. Transportation Today 39
had access to an automobile, people walked or took public transit to do their shopping, and stores delivered goods that people could not carry home. People unable to access stores placed orders from cata-logs for delivery by mail. Both types of delivery would be counted as “goods” transportation. However, as more and more people began to use their personal vehicles to access stores, they transported most of what they purchased in their vehicles. Even though goods are moved by vehicle, the movements are now categorized as “personal” transporta-tion. Today, as a growing share of goods is being ordered over the Inter-net and delivered in packages to the buyer’s home or place of business, the distinction between personal and goods transportation is chang-ing once again (see Box 2-1). Over the past 10 years, transporting such packages has become a major business for the U.S. Postal Service and private transportation firms such as UPS and FedEx.
From the standpoint of sector energy use, the changing boundary between personal and goods transportation may be more than of aca-demic interest. Carriers such as UPS and FedEx have invested heavily in developing electronic systems that enable the tracking of packages as well as in optimizing delivery routes to reduce energy use and other costs. They are also experimenting with delivery vehicles that use fuels other than gasoline or diesel or that are gasoline–electric or diesel–electric hybrids. The net effect of this trend on transportation energy use remains unclear and may not be understood for some time. The shifting bound-ary between personal and goods transportation is also characteristic of transportation’s dynamic nature, which can complicate the forecasting of transportation trends over the course of many decades.
personal transportationThe transportation of people accounts for about two-thirds of total transportation energy consumption. Thus, knowledge of the current characteristics of this activity and the factors driving it is helpful in gaining insight into where transportation energy use and emissions may be heading.
The primary source of information on personal travel trends and patterns in the United States is the National Household Travel Survey (NHTS). The NHTS samples households living in both urban and rural
40 Policy Options for Reducing Energy Use and Greenhouse Gas Emissions from U.S. Transportation
areas. Respondents are asked to detail their trip-making activity, including trip purpose, mode, duration, and distance. An NHTS has been conducted every 5 to 8 years since 1969.2 Although the NHTS was most recently conducted in 2009, its final results were not released in time for this report, which refers to the 2001 NHTS results instead.
The U.S. Census Bureau defines “e-commerce” as the value of goods and ser-vices sold over the Internet. Other forms of in-home shopping include cata-log sales, with orders being mailed in and sales made by telephone. In 2008, the latest year for which data were available during this study, e-commerce accounted for 16.5 percent of all “shipments, sales, or revenue,” or $3.7 tril-lion. Approximately 92 percent of this total consisted of business-to-business transactions. The remainder, $288 billion, consisted of business-to-customer transactions. About half of this, $142 billion, consisted of retail sales—shopping from home by using the Internet.
According to the Census Bureau, e-commerce increased from 1.1 percent of retail sales ($34 billion) in 2001 to 3.6 percent of retail sales ($142 billion) in 2008. In general, conventional retail stores have not been very successful in developing e-commerce channels in parallel with their in-store shopping. In 2008, e-commerce sales by food and beverage stores accounted for only 0.2 percent of their total sales. The only sector to have achieved any signif-icant success is motor vehicle and parts dealers. With 2.5 percent of their 2008 retail sales accounted for by e-commerce, such dealers contributed 68 percent of all e-commerce sales made by stores. Most business-to- customer e-commerce is conducted by nonstore retailers, most of which are classified by the Census Bureau as “electronic shopping and mail order houses.”a The e-commerce activities of these retailers nearly tripled, increas-ing from $27 billion in 2001 to $111 billion in 2008.
aNonstore retailers other than electronic shopping and mail order houses consist of direct selling establishments (e.g., door-to-door sales), vending machine operators, mobile food services, and heating oil and propane dealers.
Source: U.S. Census Bureau, E-Stats, May 27, 2010, p. 2. http://www.census.gov/econ/estats/ 2008/2008reportfinal.pdf.
box 2-1
Growth of E-Commerce
2 The name of this travel survey has changed over the years, but all previous versions are referred to in this report as the National Household Travel Survey.

U.S. Transportation Today 41
The 2001 NHTS reported that during that year, individuals aged 5 and older made a total of 1.05 billion person trips3 each day, totaling some 10.4 billion person miles. For the year as a whole, the average household (consisting of 2.6 persons) made about 3,600 person trips and traveled approximately 35,200 person miles. In comparison, the corresponding numbers were 2,600 person trips and 22,800 person miles per household for 1983. Thus, over a period of less than 20 years, households increased their travel by about 50 percent.
The growth in household travel was the result of a confluence of demographic, social, and economic factors. For example, between 1983 and 2001
•Medianpersonalincomeroseby20percentinrealterms;•Theaveragenumberofmotorvehiclesperhouseholdrosefrom1.7to
1.9, while the percentage of households without a motor vehicle fell from14to8;
•Thenumberoflicenseddriversroseby43million,or30percent;•Thetotalnumberofworkersgrewby42million,or41percent;and•Thenumberoffemaleworkersgrewby23million,or51percent.
These data reflect fundamental changes that have been taking place in economic and demographic patterns in the United States over the course of decades, all of them influencing transportation. One of the most important was suburbanization. Although it began centuries ago, suburbanization accelerated in the second half of the 20th century. Suburbs started to take on a different function by becoming sources of economic and employment activity rather than merely being bed-room communities. The 1960 U.S. census, for example, reported that most metropolitan-area commuters traveled between suburban homes and center city jobs. By the 1980 census, the dominant flow was from suburb to suburb. By 2000, suburb-to-suburb commutes accounted for
3 Person trips consist of “daily trips” that have a one-way distance of under 50 miles and “long-distance trips” that reach or exceed 50 miles. Because of the way the NHTS data are collected, daily trips and long-distance trips are not mutually exclusive. Daily trips, or combinations of daily trips into home-to-home journeys, can result in travel of more than 50 miles from home. Therefore, these trips are included in estimates for both daily travel and long-distance travel.
42 Policy Options for Reducing Energy Use and Greenhouse Gas Emissions from U.S. Transportation
41 percent of all daily commute trips, compared with 18 percent for commutes from suburb to center city (Pisarski 2006, 53, Table 3-6). Between 1990 and 2000, commutes from suburb to suburb accounted for 64 percent of the growth in commute trips, while commutes from center city to center city accounted for only 3 percent of the growth (Pisarski 2006, 52, Figure 3-10).
Whether such a confluence of economic and demographic factors will emerge again is an important issue in projecting future growth in vehicle miles of travel (VMT) and thus in projecting transportation energy use and emissions. In making VMT projections for the U.S. Department of Transportation, Polzin (2006) acknowledges the important role of the various economic and demographic factors listed above in driving past growth in personal travel, particularly by automobile. He expects many of the same factors to continue to influence VMT, but to a lesser degree, for the following reasons:
• Stabilizinghouseholdsizeafterdecadesofdecline,• Stabilizingfemalelaborforceparticipationratesfollowingdecadesof
increase,• Stabilizing female share of licensed drivers following decades of
increase,• Stabilizing share of zero-vehicle households following decades of
decline, and•Transitioningofthebabyboomcohortpastpeaktravelyears.
In addition, there is evidence of saturation in vehicle ownership and time budgets for travel. Significant growth in VMT cannot come from shifts away from other modes, such as walking, bicycling, carpooling, or transit use, since activity in these modes is already fairly small. However, the influence of other emerging and anticipated economic and demo-graphic trends bears watching. For example, changes in household size and age structure may exert a significant role as most of the baby boom generation reaches retirement age. Smaller households with fewer com-muters may engage in less work-related travel but in more travel for other purposes such as shopping and dining out.

U.S. Transportation Today 43
Changing Purposes of Household TravelThe 2001 NHTS asked respondents to identify the reasons for their travel and provided 36 choices.4 Table 2-1 groups these choices into the seven general categories: to and from work, work-related business, shopping, other family and personal business, school and church, social and recre-ational, and other.
Although it is a common perception that trips to and from work, or “commuting,” account for the largest share of household travel, they do not. During the 1990s, the share of adults in the workforce stabilized and one-person households grew faster than multiperson households, moderating the rate of growth in commuting trips. In 2001 commut-ing accounted for just 16 percent of all household person trips and for approximately 19 percent of household person miles traveled. In contrast, “household-serving” travel—consisting of trips for shopping, errands, chauffeuring family members, and so forth—accounted for the largest share of travel, representing 44 percent of person trips and one-third of all household person miles. Shopping trips alone accounted for more person trips than commuting. Over the years, the number of shopping trips has increased relative to the number of commuting trips, as shown in Table 2-1.
The daily commute is still an important trip category because of its temporal and spatial peaking. However, between 1983 and 2001 trips for purposes other than commuting accounted for the lion’s share of growth in person trips per household (97 percent), average person miles traveled per household (83 percent), average vehicle trips per household (91 percent), and average VMT per household (77 percent).
Understanding these changing trends in personal travel is impor-tant in targeting transportation policy making to curb transportation energy use. The trends are intimately connected to more fundamental changes that have been taking place in the size and structure of house-holds, labor markets, information technologies, and patterns of urban-ization. The influence of these broader trends suggests the implausibility of significantly altering travel behavior through targeted transporta-tion policies. For example, policies aimed at changing commuting
4 A more detailed list of these reasons is given by Hu and Reuscher (2004).

tabl
e 2-
1 Pe
rson
Tri
ps
per
Hou
seh
old
an
d P
erso
n M
iles
Tra
vele
d p
er H
ouse
hol
d, 1
983
and
200
1, B
ased
on
NH
TS
Dat
a
Pe
rson
Tri
psp
erH
ouse
hold
A
vera
geA
nnua
lPer
son
Mil
esT
rave
led
per
Hou
seho
ld
Pe
rcen
tPe
rcen
t
Pe
rcen
tPe
rcen
t
Sha
re
Sha
re
Pe
rcen
t
S
hare
S
hare
Perc
ent
of
198
3of
200
1Ch
ange
Ch
ange
of
198
3of
200
1Ch
ange
Ch
ange
Tr
ipP
urpo
se
198
320
01
Trip
sTr
ips
198
3–20
01
198
3–20
01
198
320
01
PMT/
HH
PM
T/H
H
198
3–20
01
198
3–20
01
To o
r fro
m w
ork
537
565
20
16
28
5 4,
586
6,70
6 20
19
2,
120
46
(com
mut
e)
Wor
k-re
late
d 62
10
9 2
3 47
76
1,
354
2,98
7 6
8 1,
633
121
busi
ness
Shop
ping
47
4 70
7 18
20
23
3 49
2,
567
4,88
7 11
14
2,
320
90
All
othe
r fam
ily
456
863
17
24
407
89
3,31
1 6,
671
15
19
3,36
0 10
1 an
d pe
rson
al
busi
ness
Scho
ol a
nd
310
351
12
10
41
13
1,52
2 2,
060
7 6
538
35
chur
ch
Soci
al a
nd
728
952
28
27
224
31
8,96
4 10
,586
39
30
1,
622
18
recr
eati
onal
Oth
er
61
30
2 1
-31
-51
500
1,21
6 2
3 71
6 14
3
Allp
urpo
ses
2,62
8
3,58
1 10
0 10
0 95
3 36
22
,802
35
,244
10
0 10
0 12
,442
55
Non
com
mut
e 2,
091
3,01
6 80
84
92
5 44
18
,216
28
,538
80
81
10
,322
57
tr
ips
only
Note
: H
H =
hou
seho
ld; P
MT
= pe
rson
mile
s of
trav
el.
Source:
Hu
and
Reus
cher
200
4, Ta
ble
5, p
. 15.

U.S. Transportation Today 45
patterns, such as public investments in transit services, may be desir-able for many reasons such as alleviating traffic congestion, but they may not be as effective in reducing total transportation energy use as they have been previously.
Continued Dominance of Automobiles for Personal TravelBy the time of the 2001 NHTS, private automobiles dominated as the mode used for all trip types: work-related business trips (91 percent), family or personal business (including shopping) (91 percent), school or church trips (71 percent), social and recreational trips (81 percent), and “other” trips (67 percent). Whether measured by the number of person trips or the number of person miles traveled, the vast majority of house-hold travel is by personal vehicle. In 2001, personal vehicles accounted for 86 percent of daily person trips, followed by walking (8.6 percent), public transport (1.6 percent), and “other” (2.4 percent).5
Automobiles dominate not only local travel but also long-distance travel. In 2001 personal vehicles accounted for 91 percent of all long-distance per-son trips and 65 percent of long-distance person miles.6 Personal vehicles are used most for trips under 500 miles (95 percent of long-distance trips), but they also account for a majority (62 percent) of trips between 500 and 749 miles. Air transport does not become the dominant mode until trips exceed 750 miles. Even for such longer trips, the automobile offers flexibility in departure and arrival times, passenger- and cargo-carrying capacity, and utility for local travel on reaching the final destination.
There are many reasons for the dominance of cars and light trucks for personal transportation. The continued suburbanization of jobs as well as homes has profoundly affected the use of private vehicles for travel. In 1960, when the majority of commuters either lived and worked in cities or commuted from suburbs to cities, commuting by foot and public transit was still common. Cities had the densest public transport networks, and public transport systems offered good connections between suburbs and the city center.7 However, as the amount of suburb-to-suburb commuting
5 For daily trips, the “other” category includes bicycles.6 See Transportation Energy Data Book: Edition 27, 2008, p. 8-25. U.S. Department of Energy.7 The influence of public transit systems on urban and suburban development is well documented by Warner (1978) and Jones (1985).

46 Policy Options for Reducing Energy Use and Greenhouse Gas Emissions from U.S. Transportation
rose, the use of public transport fell, both in absolute terms and as a percentage of total commute trips. The relationships among household location, workplace location, trip-making activity, and automobile travel have been subjects of research for many years. The studies reveal the thorough integration of the automobile into the daily lives and work patterns of Americans.
goods transportationThe principal modes used to transport goods within the United States are truck, rail, barge, airplane, and pipeline.8 The transportation of goods accounts for approximately 28 percent of domestic transportation energy use and for about the same percentage of U.S. transport-related CO2 emis-sions. In 2007, the U.S. freight transport system moved nearly $12 trillion worth of goods weighing about 13 billion tons, and it moved these goods 619 miles on average per shipment.
Many goods shipments are small, weighing less than 50 pounds, and in the aggregate these many small shipments account for only 0.2 percent of the weight of all goods shipped. Nevertheless, many of these small ship-ments are moved long distances by truck and air and thus account for a significant amount of vehicle travel. On the other end of the spectrum, more than half of all shipments weigh more than 50,000 pounds, and about one-third weigh more than 100,000 pounds. Shipments weighing more than 100,000 pounds account for 57 percent of the total ton-miles hauled. They also account for the longest average shipment distance (595 miles). Shipments moved less than 50 miles account for about 33 percent of the value and 55 percent of the weight of all goods shipped. Although many of these large shipments are moved by rail and water, trucks are also a major mode of travel.
Diversity of Use of Trucks for Goods TransportationTable 2-2 shows the tonnage, ton-miles, and value of goods trans -ported in 2007 by each of the major freight-carrying modes, plus mode
8 The energy and CO2 emissions data referenced in this section exclude the transport of goods to and from the United States by air or water. Oil, natural gas, and petroleum products transported by pipeline are also excluded.

tabl
e 2-
2 Fr
eigh
t S
hip
men
t C
har
acte
rist
ics
by U
.S. T
ran
spor
tati
on M
ode,
200
7
Va
lue
Perc
entS
hare
To
ns
Perc
entS
hare
To
n-M
iles
Pe
rcen
tSha
re
Ave
rage
Mil
es
Ship
men
tVal
ue
Mod
eof
Tra
nspo
rtat
ion
($m
illi
ons)
of
Val
ue
(tho
usan
ds)
ofT
ons
(mil
lion
s)
ofT
on-M
iles
pe
rS
hipm
ent
($/t
on)
Allm
odes
11
,68
4,8
72
100
12,5
43,4
25
100
3,34
4,65
8
100
619
932
Truc
k 8,
335,
789
71
8,77
8,71
3 70
1,
342,
104
40
206
950
Rail
436,
420
4 1,
861,
307
15
1,34
4,04
0 40
72
8 23
4
Wat
er
114,
905
1 40
3,63
9 3
157,
314
5 52
0 28
5
Air
25
2,27
6 2
3,61
1 0
4,51
0 0
1,30
4 69
,863
Pipe
line
399,
646
3 65
0,85
9 5
S N
A
S 61
4
Mul
tipl
e m
odes
a 1,
866,
723
16
573,
729
5 41
6,64
2 12
97
5 3,
254
Oth
er a
nd u
nkno
wn
279,
113
2 27
1,56
7 2
33,7
64
1 11
6 1,
028
Note
: S
= sa
mpl
e in
suffi
cien
t; N
A =
not a
pplic
able
. Val
ues
may
not
add
to to
tal b
ecau
se o
f rou
ndin
g.a In
clud
es tr
uck
and
rail;
truc
k an
d w
ater
; rai
l and
wat
er; a
nd e
xpre
ss, p
arce
l, an
d sm
all p
acka
ge d
eliv
ery
serv
ices
.
Source
: B
urea
u of
Tra
nspo
rtat
ion
Stat
isti
cs a
nd T
rans
port
atio
n Co
mm
odit
y Fl
ow S
urve
y, U
.S. B
urea
u of
the
Cens
us, D
ecem
ber 2
009.

48 Policy Options for Reducing Energy Use and Greenhouse Gas Emissions from U.S. Transportation
combinations. Trucks are the leading mode of goods transportation under the three most common methods of ranking freight traffic: value of shipments (71 percent), tons shipped (70 percent), and ton-miles (40 percent).
The dominance of trucks reflects their flexibility and capability of handling a diversity of freight carried over a wide range of distances—from the high-value cargoes moved interstate by combination trucks to the dirt, debris, and gravel hauled by dump trucks locally. Figure 2-1 defines the weight categories for freight trucks used in the Census Bureau’s 2002 Vehicle Inventory and Use Survey (VIUS) and illustrates some of the types of trucks that fall into each weight category.9 The VIUS statistics provided in Table 2-3 show that a disproportionate share of truck miles is generated by a relatively small number of large vehicles weighing more than 50,000 pounds when fully loaded and traveling in excess of
33,001 or greater
Gross Vehicle Weight (lb) Weight Classes Typical Vehicle
Class 8
Dump
Short-noseconventionalwith van body
Cement
Single-axle van
Cab forwardwith van body
Heavy tandemconventional
Mediumconventional
Walk-in van
Stake
Fuel
Beverage
Recycling
Class 6
Class 5Class 4Class 3
Class 726,001–33,000
19,501–26,000
16,001–19,50014,001–16,00010,001–14,000
figure 2-1
Truck categories and typical vehicles in each category. Gross vehicle weight includes weight of empty vehicle plus payload.
9 2002 Economic Census: Vehicle Inventory and Use Survey (VIUS), U.S. Bureau of the Census. The 2002 VIUS is the most recent survey available because the U.S. Bureau of the Census no longer updates it. http://www.census.gov/prod/ec02/ec02tv-us.pdf.
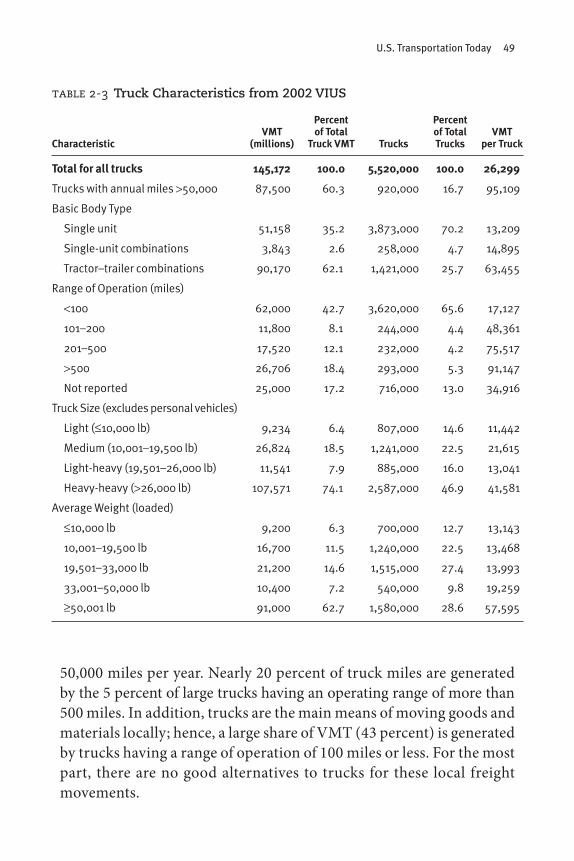
U.S. Transportation Today 49
table 2-3 Truck Characteristics from 2002 VIUS
Percent Percent VMT ofTotal ofTotal VMTCharacteristic (millions) TruckVMT Trucks Trucks perTruck
Totalforalltrucks 145,172 100.0 5,520,000 100.0 26,299
Trucks with annual miles >50,000 87,500 60.3 920,000 16.7 95,109
Basic Body Type
Single unit 51,158 35.2 3,873,000 70.2 13,209
Single-unit combinations 3,843 2.6 258,000 4.7 14,895
Tractor–trailer combinations 90,170 62.1 1,421,000 25.7 63,455
Range of Operation (miles)
<100 62,000 42.7 3,620,000 65.6 17,127
101–200 11,800 8.1 244,000 4.4 48,361
201–500 17,520 12.1 232,000 4.2 75,517
>500 26,706 18.4 293,000 5.3 91,147
Not reported 25,000 17.2 716,000 13.0 34,916
Truck Size (excludes personal vehicles)
Light (≤10,000 lb) 9,234 6.4 807,000 14.6 11,442
Medium (10,001–19,500 lb) 26,824 18.5 1,241,000 22.5 21,615
Light-heavy (19,501–26,000 lb) 11,541 7.9 885,000 16.0 13,041
Heavy-heavy (>26,000 lb) 107,571 74.1 2,587,000 46.9 41,581
Average Weight (loaded)
≤10,000 lb 9,200 6.3 700,000 12.7 13,143
10,001–19,500 lb 16,700 11.5 1,240,000 22.5 13,468
19,501–33,000 lb 21,200 14.6 1,515,000 27.4 13,993
33,001–50,000 lb 10,400 7.2 540,000 9.8 19,259
≥50,001 lb 91,000 62.7 1,580,000 28.6 57,595
50,000 miles per year. Nearly 20 percent of truck miles are generated by the 5 percent of large trucks having an operating range of more than 500 miles. In addition, trucks are the main means of moving goods and materialslocally;hence,alargeshareofVMT(43percent)isgeneratedby trucks having a range of operation of 100 miles or less. For the most part, there are no good alternatives to trucks for these local freight movements.
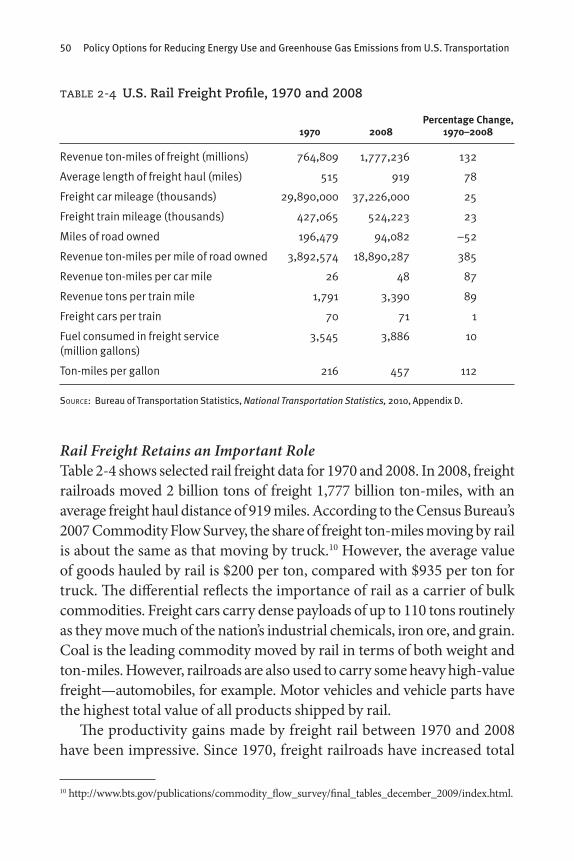
50 Policy Options for Reducing Energy Use and Greenhouse Gas Emissions from U.S. Transportation
Rail Freight Retains an Important RoleTable 2-4 shows selected rail freight data for 1970 and 2008. In 2008, freight railroads moved 2 billion tons of freight 1,777 billion ton-miles, with an average freight haul distance of 919 miles. According to the Census Bureau’s 2007 Commodity Flow Survey, the share of freight ton-miles moving by rail is about the same as that moving by truck.10 However, the average value of goods hauled by rail is $200 per ton, compared with $935 per ton for truck. The differential reflects the importance of rail as a carrier of bulk commodities. Freight cars carry dense payloads of up to 110 tons routinely as they move much of the nation’s industrial chemicals, iron ore, and grain. Coal is the leading commodity moved by rail in terms of both weight and ton-miles. However, railroads are also used to carry some heavy high-value freight—automobiles, for example. Motor vehicles and vehicle parts have the highest total value of all products shipped by rail.
The productivity gains made by freight rail between 1970 and 2008 have been impressive. Since 1970, freight railroads have increased total
table 2-4 U.S. Rail Freight Profile, 1970 and 2008
PercentageChange, 1970 2008 1970–2008
Revenue ton-miles of freight (millions) 764,809 1,777,236 132
Average length of freight haul (miles) 515 919 78
Freight car mileage (thousands) 29,890,000 37,226,000 25
Freight train mileage (thousands) 427,065 524,223 23
Miles of road owned 196,479 94,082 -52
Revenue ton-miles per mile of road owned 3,892,574 18,890,287 385
Revenue ton-miles per car mile 26 48 87
Revenue tons per train mile 1,791 3,390 89
Freight cars per train 70 71 1
Fuel consumed in freight service 3,545 3,886 10 (million gallons)
Ton-miles per gallon 216 457 112
Source: Bureau of Transportation Statistics, National Transportation Statistics, 2010, Appendix D.
10 http://www.bts.gov/publications/commodity_flow_survey/final_tables_december_2009/index.html.

U.S. Transportation Today 51
revenue ton-miles by 132 percent while cutting total miles of track by 52 percent. During the period, trains have become longer, and the average number of tons carried per railcar has increased by 87 percent. In addition, railroads have partnered with trucking firms to develop what is increasingly an intermodal freight network. More containerized freight is now moved by both modes, and truck trailers are carried on railcars for line-haul movements.
Although railroads and trucking companies partner with one another for some line-haul traffic and do not compete for local freight, they are competitors for long-haul shipments of low-value and time-insensitive shipments. This relatively small portion of the trucking business is the main candidate for saving energy by diverting truck ton-miles to rail.
The Container Revolution and Supply Chain ManagementThe magnitude of change that can occur in the transportation sector over the span of only a few decades is illustrated by two developments: the emergence of containerized freight and supply chain management systems. Although the containerized movement of freight did not occur on a large scale until the 1970s, most manufactured goods traveling internationally are now containerized. In addition, container movements have become more important domestically. In 2007, U.S. railroads hauled approximately 9 million containers, and the transportation of containers and truck trailers generated 22 percent of Class I railroads’ total revenue—more than coal, chemicals, ore, or any other single commodity (AAR 2008, 1). Container movements also account for a significant share of the total truck freight traffic on many major Interstate highways and for a significant share of total traffic in port and hub cities like Los Angeles and Chicago.
During the same time that containerization emerged, supply chain management also took on importance in freight transportation, influencing the total volume of shipments and average shipment size and distance.11 Thirty years ago, most businesses operated what were then known as “push” supply chains. Suppliers delivered materials to a manufacturer, who pushed products to a distributor or retailer and then to the customer.
11 This section is adapted from Freight Transportation Bottom Line Report: Freight Demand and Logistics (Cambridge Systematics 2009).
52 Policy Options for Reducing Energy Use and Greenhouse Gas Emissions from U.S. Transportation
Each business thus maintained a large and costly inventory of materials and products. In addition, excess supplies of critical materials were kept on hand to safeguard against shortages. Today, most businesses use “on-demand” or “just-in-time” supply chains, replenishing goods soon after they are sold. By tracking customer purchases as they occur, busi-nesses can reduce and centralize their inventories. This, in turn, increases the availability of working capital for firms. Inventory “turns,” a common measure of the speed with which material moves through a company’s supply chain, increased from an average of eight turns per year in 1995 to an average of 21 in 2005.
This cost-saving capability has been made possible by a number of changes. Among the most important are the economic deregulation and the subsequent restructuring of the freight transportation industry in the 1980s, which triggered strong competition and lower shipping prices; increasedpublic-sector investment intheInterstatehighway system, which reduced travel time and improved trip reliability for motor carriers;and thedevelopmentanddeploymentofnewtechnologies (e.g., intermodal freight containers, computers and related information technologies, bar coding, radio-frequency identification tags, and satellite communications) by shippers and carriers, which significantly improved the productivity and reliability of freight operations.
Elimination of inventory and immediate replenishment of stocks result in smaller shipment sizes (since units are consumed one by one) and more individual products per shipment (to make lot sizes economical to ship). This capability has increased the importance of transportation over warehousing and favored the use of faster and more reliable trucking and air shipments over rail and bulk shipments generally.
Energy Performance of Major Transport Modes
There are many modes of passenger and freight transportation, but only a few of them account for most of the sector’s energy use and GHG emissions. As noted in Chapter 1, three modes—light-duty vehicles, medium- and heavy-duty trucks, and commercial airlines—together account for 93 percent of the sector’s domestic energy use. These three modes are therefore the focus of the remainder of the discussion in this

U.S. Transportation Today 53
chapter, along with freight rail, public transit, and intercity passenger rail, which are often portrayed as the main modal alternatives.
energy characteristics of light-duty vehiclesAs noted earlier, light-duty motor vehicles—passenger cars and light trucks—account for the largest share of transportation activity, energy use, and GHG emissions. In 2007, the 237 million cars and light trucks registered in the United States were driven a total of 2.8 trillion miles, consuming 136 billion gallons of gasoline and diesel fuel (Table 2-5). The average passenger car on the road traveled 22.5 miles on each gallon of fuel, while the average light truck traveled 18 miles per gallon, for an average of 20.4 miles per gallon for all light-duty vehicles in the fleet.
Faster Growth in Vehicle Use Than in Energy UseTable 2-5 compares various light-duty vehicle energy attributes for 2007 with those for 1970. Over this period, the number of vehicles grew by 129 percent, while the average number of miles traveled per vehicle grew by 16 percent. Yet the total amount of fuel consumed grew by only 70 percent because fuel consumption per vehicle fell by about 26 percent.
table 2-5 Light-Duty Vehicle Energy Use Attributes, 1970 and 2007
PercentageIncrease,Attribute 1970 2007 1970–2007
Number of vehicle registrations 103,454,148 237,402,545 129
Average miles traveled per vehicle 10,081 11,720 16
Fuel consumed (million gallons) 90,192 136,170 70
Average fuel consumption per vehicle 775 574 -26 (gallons)
Average miles traveled per gallon of 13 20.4 57 fuel consumed
Average passengers per vehicle 1.9 1.64 -14
Average passenger miles per gallon 24.7 33.5 36 of fuel consumed
Source: Bureau of Transportation Statistics, National Transportation Statistics, 2010, Automobile Mode Summary.

54 Policy Options for Reducing Energy Use and Greenhouse Gas Emissions from U.S. Transportation
The source of the improvement in light-duty vehicle energy efficiency is the development and mass introduction of many fuel-saving technologies. Table 2-6 summarizes some of the more significant advances relating to vehicle power train characteristics. Notable among these improve-ments was the widespread introduction of front-wheel drive (FWD), which reduced vehicle weight. FWD vehicles were rare in 1975, but their numbers grew rapidly in the early 1980s. The numbers presented in Table 2-6 obscure trends specific to passenger cars and light-duty trucks. By 1988, more than 80 percent of passenger cars were configured with FWD. The light truck category did not exceed the 20 percent FWD level until 2005.12 Manual transmissions, once considered much more fuel-efficient than automatic transmissions, became more common during the late 1970s as fuel prices rose; they became less common, however, as fuel prices declined during the 1980s. Meanwhile, a grow-ing share of automatic transmissions added efficiency-improving gears and torque converters, while continuously-variable transmissions were introduced after 2000. Energy-saving radial tires became standard by the early 1980s, and fuel metering became more precise with the near-universal use of electronic fuel injection systems. Multivalve engines first appeared in cars during the mid-1980s and in light trucks during the 1990s. More recently, the share of engines with variable valve timing exceeded 75 percent by 2008, and cars equipped with turbochargers and gasoline–electric hybrid propulsion systems have become more common.
Increasing Fuel Economy PotentialMost of these trends in power train characteristics tended to improve the energy-efficiency potential of light-duty vehicles.13 As the top portion of
12 Light trucks consist of three distinct types of vehicles: pickup trucks, sport utility vehicles (SUVs), and minivans. Pickup trucks, to the extent they are used to haul loads, require rear-wheel drive or four-wheel drive. Even today, few pickup trucks have FWD. Since SUVs originally were derived from pickup truck platforms, they all had rear-wheel drive or four-wheel drive. But as more SUVs were built on car platforms, the percentage of these vehicles using FWD has grown. In 2008, 26 percent of SUVs had FWD and 59 percent had four-wheel drive. Since minivans were introduced in the early 1980s, most have been based on passenger car vehicles, and thus they are usually equipped with FWD. In 2008, 93 percent had FWD and 4 percent had four-wheel drive.13 The growth in the share of four-wheel drive vehicles had the opposite impact.

tabl
e 2-
6 C
han
ges
in P
ower
Tra
in C
har
acte
rist
ics
of L
igh
t-D
uty
Veh
icle
s ov
er T
ime
D
rive
trai
nTr
ansm
issi
on
Oth
erP
ower
Tra
inC
hara
cter
isti
cs
Mod
elY
ear
FWD
4W
D
Man
ual
Auto
Loc
kup
CVT
PFI
M
ulti
valv
eV
VT
Turb
oH
ybri
d
1975
5.
3 3.
3 23
.2
4.1
1980
25
.0
4.9
35.4
17
.8
5.
2
1985
47
.8
9.3
26.5
54
.4
18
.2
1990
63
.8
10.1
22
.2
71.2
70.8
1995
57
.6
16.2
17
.9
80.7
91.6
35
.6
2000
55
.5
20.2
9.
7 89
.5
99
.8
44.8
15
.0
1.3
2005
53
.0
26.8
6.
2 91
.4
2.3
99.7
65
.6
45.8
1.
7 1.
1
2008
53
.3
27.8
6.
7 85
.5
7.8
97.6
77
.4
57.7
2.
5 2.
5
Note
: FW
D =
fron
t-w
heel
dri
ve; 4
WD
= fo
ur-w
heel
dri
ve; a
uto
lock
up =
aut
omat
ic tr
ansm
issi
on w
ith
lock
up c
lutc
h; C
VT
= co
ntin
uous
ly v
aria
ble
tran
smis
sion
; PF
I = p
ort f
uel i
njec
tion
; mul
tiva
lve
= en
gine
wit
h m
ore
than
two
valv
es p
er c
ylin
der;
VV
T =
vari
able
val
ve ti
min
g.

56 Policy Options for Reducing Energy Use and Greenhouse Gas Emissions from U.S. Transportation
table 2-7 Fuel Economy Characteristics of Light-Duty Vehicles over Time
Cars LightTrucks
FuelEconomy(mpg) FuelEconomy(mpg)
Characteristic Ton-mpg Lab RoadAdjusted Ton-mpg Lab RoadAdjusted
Model Year
1975 27.6 15.3 13.1 24.2 13.7 11.6
1980 31.2 22.5 19.2 30.9 18.6 15.8
1985 35.8 25.0 21.3 33.7 20.6 17.5
1990 37.1 25.2 21.2 35.1 20.7 17.4
1995 38.3 24.7 20.5 35.7 20.5 17.0
2000 38.6 24.3 19.8 37.1 20.8 16.9
2005 41.0 24.8 19.9 40.2 21.4 17.2
2008 43.3 26.0 20.8 42.9 22.5 18.1
Average Annual Growth (%)
1975–2008 1.2 1.4 1.2 1.5 1.3 1.2
1975–1985 2.6 5.0 5.0 3.4 4.2 4.2
1985–2008 0.8 0.2 –0.1 1.1 0.4 0.1
Source: EPA, Light-Duty Automotive Technology and Fuel Economy Trends 1975–2008, and calculations by the committee.
Table 2-7 shows, the number of ton-miles (vehicle weight × miles driven) that a gallon of fuel could move an automobile grew from 28 in 1975 to 43 in 2008, or by an average of 1.2 percent per year. For light trucks, this metric improved from 24 ton-miles per gallon in 1975 to 43 ton-miles per gallon in 2008, or by an average of 1.5 percent per year.
Over the period, the average annual rate of growth in fuel economy, either as measured in Environmental Protection Agency laboratory tests (measured on a dynamometer simulating a driving cycle) or reflecting actual on-road operation, grew roughly in parallel with the growth in vehicle ton-miles per gallon. But as the lower portion of Table 2-7 shows, the trends were different during the first decade (1975–1985) and the next 23 years (1985–2008). Fuel economy improvement poten-tial grew more rapidly during the former period than during the latter (2.6percentperyearversus0.8percentperyearforcars;3.4percentper

U.S. Transportation Today 57
year versus 1.1 percent per year for light trucks). However, the rate of growth in fuel economy improvement substantially exceeded the rate of growth in fuel economy improvement potential during the former period, while during the latter period it lagged substantially (in the case of test measures of fuel economy) or essentially halted altogether (in the case of on-road fuel economy.)
The main cause of this lag in fuel economy outcomes relative to fuel economy potential is that vehicles became heavier and more powerful. As Figure 2-2 shows, between 1975 and the mid-1980s, the average weight of a new light-duty vehicle fell from just over 4,000 pounds to just over 3,200 pounds and the number of seconds required to accelerate from a standing start to 60 mph rose from 14.1 to 14.4. However, after the mid-1980s, vehicles started to become heavier. By 2008 the average vehicle weight exceeded its 1975 average level by almost 100 pounds and exceeded its mid-1980s low by about 900 pounds. Meanwhile, the 0-to-60-mph acceleration performance improved from an average of 14.4 seconds to 9.6 seconds. The growth in weight and acceleration performance absorbed nearly all of the potential improvement in fuel economy generated by the efficiency-improving technologies added during the period.
Wei
ght (
lb)
Acc
eler
atio
n Ti
me
from
0 to
60
mph
(s)
Model Year
1975 1980 1985 1990 1995 2000 2005
4,500
4,000
3,500
3,000
15
14
13
12
11
10
9
Time from 0 to 60 mph
Weight
figure 2-2
New passenger car weight and performance, 1975–2007.

58 Policy Options for Reducing Energy Use and Greenhouse Gas Emissions from U.S. Transportation
Declining Rates of Vehicle OccupancyAnother important trend shown in Table 2-5 is the fall in vehicle passen-ger occupancy. In 1970, the average passenger car transported 1.9 pas-sengers. By 2007, average occupancy had fallen to 1.6 passengers, or by 15 percent. Thus, while the number of vehicle miles per gallon grew by 57 percent over this period, the number of passenger miles per gallon grew by only 36 percent.
freight truck energy characteristicsFreight-carrying trucks are the second-largest energy-using and GHG-generating transportation mode. In 2006 these vehicles consumed about 40 billion gallons of fuel, representing about 19 percent of total transpor-tation energy use. Generalizations concerning energy characteristics and trends are more difficult to make for freight trucks than for passenger cars because they are produced in such a wide range of sizes and have such a wide range of functions. Table 2-8 compares the energy and use character-istics of the two broad categories of trucks, single-unit and combination trucks, for 1980 and 2006. Single-unit trucks, which are more numerous, tend to operate locally and carry relatively small payloads. Combination trucks travel many more miles per year on average, over longer distances, and with much larger payloads.
The total number of gallons of fuel consumed by freight trucks ofbothkindsgrewsignificantlyovertheperiod1980to2006;however,growth in total fuel use was much greater for combination trucks. Whereas the average number of miles traveled per gallon of fuel consumed grew 41 percent for single-unit trucks, it declined by 4 percent for combination trucks. This differential, however, does not mean that combination trucks were becoming less energy efficient. Average reported fuel economy for heavy-duty trucks increased between 1992 and 2002 by about 3.5 per-cent, indicative of improvements in engines and aerodynamics.14 The pattern of truck use appears to have changed in response to changes in the pattern of freight demand, and this change led to the increase in fuel consumption per mile. One change is that combination trucks are being operated more in urban environments now than in the past, and thus
14 Nearly all combination trucks are classified as heavy trucks.

U.S. Transportation Today 59
table 2-8 Freight Truck Energy Use Characteristics, 1980 Versus 2006
1980 2006Change
Characteristic Number Percent Number Percent (2006/1980)
Fuel consumed (million gallons) 19,960 37,918 1.9
Single-unit truck 6,923 34.7 9,843 26 1.42
Combination truck 13,037 65.3 28,075 74 2.15
Average fuel consumption per 3,447 4,300 1.25 vehicle (gallons)
Single-unit truck 1,583 1,480 0.93
Combination truck 9,201 12,944 1.41
Average miles traveled per gallon 5.4 5.9 1.09 of fuel consumed
Single-unit truck 5.8 8.2 1.41
Combination truck 5.3 5.1 0.96
Number of trucks registered 5,790,653 9,919,007 1.52
Single-unit truck 4,373,784 75.5 6,649,337 75.4 1.52
Combination truck 1,416,869 24.5 2,169,670 24.6 1.53
Average miles traveled per vehicle 18,736 25,290 1.35
Single-unit truck 9,103 12,081 1.33
Combination truck 48,472 65,773 1.36
Ton-miles (millions) 629,675 1,294,492 2.06
Vehicle miles (millions) 108,491 223,037 2.06
Rural highway total 68,776 63.4 120,086 53.8 1.75
Rural Interstate 25,111 23.1 51,385 23 2.05
Rural other arterial 24,789 22.8 39,626 17.8 1.6
Other rural roads 18,876 17.4 29,075 13 1.54
Urban highway total 39,715 36.6 102,951 46.2 2.59
Urban Interstate 13,135 12.1 39,731 17.9 3.02
Other urban streets 26,580 24.5 63,220 28.3 2.38
Source: Bureau of Transportation Statistics, National Transportation Statistics, 2008. http://www.bts.gov/publications/national_transportation_statistics/.

60 Policy Options for Reducing Energy Use and Greenhouse Gas Emissions from U.S. Transportation
they encounter more traffic congestion. Perhaps of more significance, combination trucks became larger and capable of carrying more cargo and thus delivering more ton-miles per gallon, even as average gallons consumed per vehicle mile declined. The relationships between vehicle payload, distance traveled, and vehicle miles per gallon are discussed in more detail in Chapter 4.
airline energy characteristicsPassenger airplanes are the third-largest user of transportation energy and emitter of GHGs domestically. These aircraft are but one component of the total U.S. civil aviation sector, which consists of about 225,000 air-craft operating from more than 5,000 public-use airports. The two main segments of the civil sector are commercial and general aviation (GA). Commercial aviation encompasses all air carriers engaged in scheduled, charter, and air taxi passenger and cargo services. GA is even broader in scope and includes all other nonmilitary aircraft used for recreational flying, commercial services, and business aviation.
Of the 225,000 aircraft in the civil fleet, about 80 percent are piston-engine airplanes that run on aviation-grade gasoline.15 Although a small percentage of these aircraft have multiple engines and are used for long-distance passenger travel, most have single engines and are used primarily for local services and recreational flying rather than for transportation purposes. Because the piston-engine fleet is lightly used, it consumes only about 20 percent of the total fuel used in the GA sector and less than 5 percent of all fuel used in civil aviation. Given their minor contribution to energy use and their limited role in transportation, these GA aircraft are not considered further in this report, which concentrates instead on the turbine-powered fleet used by air carriers and GA business aviation.
The jet fuel used by turbine aircraft is kerosene-grade. It is similar to diesel and has a higher energy and carbon density per volume than does gasoline. The larger jet aircraft, weighing more than 100,000 pounds, are used mainly for scheduled passenger service and hauling cargo. The
15 See data tables in FAA Aerospace Forecasts FY 2009–2025. http://www.faa.gov/data_research/aerospace_forecasts/2009-2025/.

U.S. Transportation Today 61
smallest jets, configured to seat fewer than 20 passengers, are used mainly in business aviation. As jets become larger, they tend to become more fuel efficient per passenger carried. For instance, a medium-sized 50-seat jet used by an airline will consume about 500 gallons of fuel per flight hour (or 10 gallons per passenger per flight hour), while a small five-seat GA jet will consume about 100 gallons per flight hour (or 20 gallons per passenger per flight hour).
Table 2-9 compares a number of important characteristics of domestic air carriers in 1970 with those in 2006. In contrast to the millions of freight trucks in operation, the number of turbine aircraft in the U.S. air carrier fleet is small—only about 6,800 in 2006, including those operating in domestic and international service. Yet these aircraft use about 35 percent as much energy as the entire fleet of medium and heavy trucks. The fuel demand by commercial air transport is a reflection of both their energy intensity and their high intensity of use. In 2006, each aircraft averaged 2.9 million gallons of fuel burned and produced 120 million revenue passenger miles, in addition to moving freight in its cargo compartment. Yet, as shown in Table 2-9, the amount of fuel, or energy, used per passenger mile has declined by 70 percent because of large gains in the airline industry’s economic efficiency.
table 2-9 U.S. Air Carrier Profile, 1970 and 2006
Change 1970 2006 2006/1970
Revenue passenger miles (thousands) 108,441,978 590,634,648 5.45
Revenue passenger enplanements (thousands) 153,662 675,212 4.39
Revenue ton-miles of freight (thousands) 2,708,900 15,859,729 5.85
Number of aircraft available for service 2,690 6,758 2.51
Seats per aircraft 103 114 1.11
Revenue passenger load factor (%) 49 79 1.62
Fuel consumed (million gallons) 7,857 13,458 1.71
Gallons per seat mile 27 55 2.04
Energy intensity (Btu/passenger mile) 10,185 3,070 0.30
Source: Bureau of Transportation Statistics, National Transportation Statistics, 2008, Table 4-21 and Appendix D, Air Carrier Profile.

62 Policy Options for Reducing Energy Use and Greenhouse Gas Emissions from U.S. Transportation
The energy intensity of air transport travel has been declining more rapidly than that of any other passenger transport mode. Between 1959 and 1995, average new aircraft energy intensity (measured in terms of energy consumed per passenger distance) declined by nearly two-thirds (Lee et al. 2001). Of that decline, 57 percent was attributed to improvements in engine efficiency, 22 percent to increases in aerodynamic efficiency, 17 percent to more efficient use of aircraft capacity through higher pas-senger and cargo load factors (rates of occupancy), and 4 percent to other changes, such as increased aircraft size and carrying capacity. Lee et al. (2001) surmise that one of the reasons for the continued improvement in energy intensity is the importance to airlines of finding ways to reduce their fuel costs to maintain profitability.
Figure 2-3 shows the energy intensity of large transport jet aircraft introduced from 1955 to 2000 as well as the total fleet average for the period 1970 to 2000. The fleet experienced the sharpest declines in energy intensity during the 1970s, owing to the large-scale introduction of jets equipped with energy-saving high-bypass turbofan engines. The fleet has experienced more gradual reductions since, through a series of incremental advances in computer-aided designs, the replacement of hydraulics with lighter electronics systems, better wing designs (such as the addition of winglets), and integration of the airframe with propulsion systems. At the same time, the efficiency gains stemming from gradual reductions in aircraft structural weight have enabled other changes in aircraft that may have added to energy consumption, such as the installation of more and heavier passenger entertainment systems (Lee et al. 2001).
rail freight energy characteristicsAs discussed earlier, freight railroads account for about 40 percent of freight ton-miles in the United States. However, they account for less than 9 percent of the energy used for transporting freight and about 2 per-cent of transportation energy consumption in total.16 Railroads, for the most part in the movement of bulk cargoes, consume about 4 billion gallons of diesel fuel annually, a number that has remained fairly constant
16 Rail freight energy data in this section are obtained from the Transportation Energy Data Book 29. http://cta.ornl.gov/data/tedb29/Edition29_Full_Doc.pdf.

U.S. Transportation Today 63
over the past 20 years even as ton-miles have increased substantially. Rail freight averages more than 400 ton-miles per gallon of diesel fuel, compared with an average of about 70 ton-miles per gallon for combi-nation trucks.
Since 1980, the number of ton-miles of freight that railroads can gen-erate by using 1 gallon of fuel has grown by 96 percent. This improvement is not due to any single or dramatic technological innovation but instead to the emergence of a more cost-conscious, competitive industry in the aftermath of its economic deregulation by Congress. Since deregulation, the railroads have rationalized their systems by eliminating inefficient services and equipment. They have also undertaken a series of focused energy improvement initiatives over a number of years to enhance operat-ing efficiency. For example, during the 1980s railroads began working with locomotive manufacturers to develop more efficient and more powerful locomotives. Consequently, today locomotives average 4,400 horsepower,
Ener
gy In
tens
ity
(MJ/
RPK
)
Year (or Year of Introduction for New Technology)
1955 1960 1965 1970 1975 1980 1985 1990 1995 2000
7
6
5
4
3
2
1
0
Short rangeLong range
B720-000B
B707-300
B707-300B
B707-100B
B727-200/231A
B737-100/200
B747-200/300
DC10-10
B747-100
B720-000
DC9-10
DC9-30
DC9-40
DC9-50
DC10-30
DC10-40
L1011-1/100/200B767-200/200ER A300-600/R/CF/RCF
B767-300/300ERA320-100/200
B747-400
MD-11
B777
L1011-500
MD80/DC9-80AII
B757-200
B737-300 B737-400A310-300
B737-500/600
figure 2-3
Trends in new commercial aircraft energy efficiency and fleet average efficiency. MJ=megajoules; RPK= revenue passenger kilometer
Source: Lee et al. 2001.

64 Policy Options for Reducing Energy Use and Greenhouse Gas Emissions from U.S. Transportation
compared with 3,000 in 1980. The more powerful locomotives have enabled the creation of larger trains, reducing fuel use per ton-mile.
Railroads have sought to reduce locomotive idling by equipping loco-motives with small auxiliary power units that allow the larger engine to be shut down when not in use, which saves fuel while keeping the unit’s batteries charged and its oil and cooling water warm. In addition, improved traction systems allow locomotives to pull higher-tonnage trains by reducing wheel slipping. Major advances have been made in controlling the coefficient of friction at the wheel–rail interface by utilizing wayside lubricators that lower the frictional drag on the train. Railcars are equipped with better wheel bearings and improved steering running gear that reduce curving forces, saving both energy and wear and tear on track and equipment. Finally, many improvements have been made in train-handling practices by equipping locomotives with Global Positioning System–based tracking systems that allow real-time coach-ing of locomotive crews on the most energy-efficient methods of moving a train over a territory.
The rail freight industry has established a goal of improving its ratio of freight carried to fuel consumption by 10 percent, from an average of 400 to 440 ton-miles per gallon.17 Further advances in the energy efficiency of freight rail may be important from the standpoint of rail profitability, but the effect on total transportation energy consumption is likely to be relatively small. If 2 billion ton-miles of freight are moved by rail, the fuel efficiency gains would save less than 500,000 gallons of diesel fuel, or the equivalent of less than 5 days’ worth of the fuel consumed by the nation’s freight trucks.
public transit energy characteristicsPublic transit in the United States accounts for approximately 1 percent of total passenger vehicle miles and about the same share of all transpor-tation energy. In terms of the market share of metropolitan travel, transit has been losing customers to private automobiles for decades. Nationally, only 2.1 percent of all metropolitan person trips were on public transit in 2001, compared with 86 percent by private vehicles, 10 percent by foot
17 http://www.aar.org/PubCommon/Documents/AboutTheIndustry/Overview.pdf.

U.S. Transportation Today 65
and bicycle, and 2 percent by other means. But the use of transit varies dramatically from place to place. Transit use is highest in the centers of the oldest and largest metropolitan areas but is virtually nonexistent in many smaller cities and towns. In 2006, the 10 largest of the 579 transit systems that receive federal funding carried 56 percent of all passengers (APTA 2008, 17).
Box 2-2 describes the main modes of public transit in the United States and their use. Although the figures indicate that transit’s role in total passenger travel is small nationally compared with automobiles, the role played by public transport in some locations—and the role it might play in the future—warrants attention.
Transit is generally thought of as highly energy efficient, and an explanation of why the data in Table 2-10 show that the average transit bus used 27 percent more energy per passenger mile than the average passenger car in 2006 is warranted. In comparison, the data for transit rail and commuter rail indicate that these modes did use about 20 percent less energy than a passenger car. What appears to be a paradox is explained by the operating characteristics of the different transit modes. When they are filled to capacity, transit buses are indeed energy efficient. But in 2006, the average transit bus carried only 9.2 passengers per mile.18 Such buses generally can accommodate 40 or more passengers. If buses always oper-ated with 40 seats filled (and the extra fuel required to haul these addi-tional passengers is ignored), the average transit bus energy use would be 72 percent below that of the average passenger car.19 The problem is that transit buses, along with other transit modes, cannot always run full. Demand for their services is heavily concentrated inbound during the morning rush hours and outbound during the evening rush hours, when the systems often operate near capacity. The design capacity of transit systems is determined by these spatial and temporal demand peaks. Although transit systems do operate fewer services during off-peak periods, their ability to make service adjustments is limited, vehicle types cannot
18 In 2006 the average commuter rail vehicle carried 34.2 passengers, and the average transit rail vehicle carried 24.4 passengers.19 Of course, if a car averaged more than 1.6 occupants, energy efficiency per passenger mile would be higher.

66 Policy Options for Reducing Energy Use and Greenhouse Gas Emissions from U.S. Transportation
Public transport consists of two broad types of services: fixed-route, fixed-schedule services (such as bus, streetcar, subway, and commuter trains) and demand-responsive services (such as taxis, shuttles, and specialized services for the elderly and disabled). Most passenger trips and miles are on fixed-route, fixed-schedule services. In 2005, three services—bus (which includes local and express services), commuter rail (which is daily railroad service between suburbs and central cities), and rail transit [which includes “heavy” (subway) and “light” (streetcar) rail service]—accounted for 96 percent of all public transport passenger miles.
Buses are the primary vehicles used in most systems. About 1,500 pub-lic transportation systems in the country offer fixed-route bus services (including many that do not receive federal aid). Buses are the most com-mon and heavily used form of public transport, carrying about 6 billion passengersa for 22.8 billion passenger miles in 2006 (riders average 3.9 miles per trip).b The more than 80,000 transit buses in the public transit fleet accounted for about 60 percent of all passenger trips by transit.
Heavy and light rail transit carried about 3.3 billion passengers in 2006 for 17.5 billion passenger miles. Commuter rail systems carried another 440 million passengers for 10.3 billion passenger miles.
Transit ridership figures vary dramatically across the United States, and even among large urban areas. Ridership in New York is exceptionally high by American standards. The more than 18 million people living and working in greater New York average more than 140 transit rides per year. In 2006, 36 percent of transit trips nationally were made in the greater New York City area. Though transit usage in New York compares favorably with that in many large Western European cities, few other large American cities have ridership levels even half that of greater New York. Only five other urban areas—metropolitan Boston, Chicago, San Francisco, Philadelphia, and Washington, D.C.—have annual transit ridership levels exceeding 80 trips per capita.c The nine metropolitan areas with more than 5 million residents (includingNewYork)accountfor73percentofalltransittrips;thosewith
box 2-2
Public Transit Use in the United States
aPassenger ridership figures are measured in “unlinked trips,” which means that a transferring rider would count as have made two or more passenger trips.bThe statistics cited in this section are from APTA 2008. http://www.apta.com/research/stats/.cIn the largest U.S. cities with rapid rail transit systems, middle- and high-income riders account for a larger portion of ridership, especially during the peak commuting periods. Transit accounts for about 85 percent of the peak-hour entrants in Manhattan, about two-thirds in downtown Chicago, and more than half in the central business districts of Boston, Philadelphia, San Francisco, and Washington, D.C.
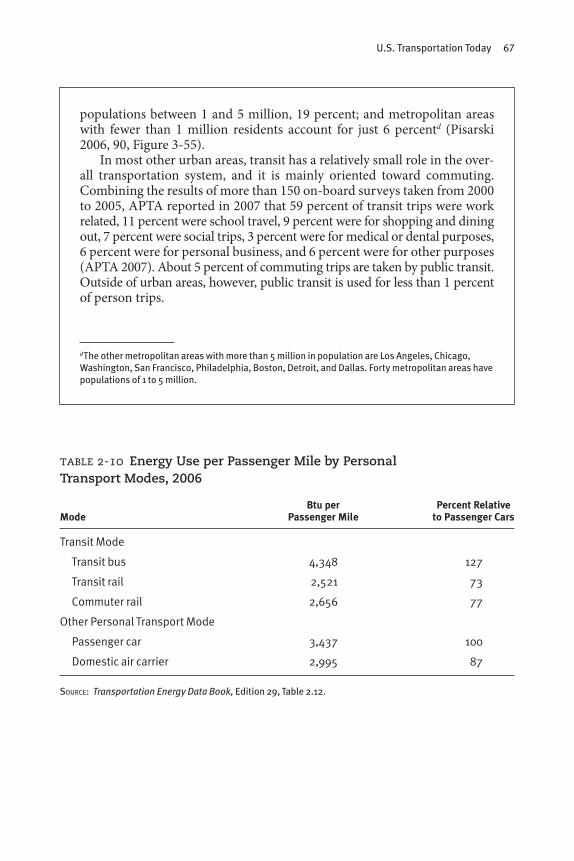
U.S. Transportation Today 67
populationsbetween1and5million,19percent;andmetropolitanareaswith fewer than 1 million residents account for just 6 percentd (Pisarski 2006, 90, Figure 3-55).
In most other urban areas, transit has a relatively small role in the over-all transportation system, and it is mainly oriented toward commuting. Combining the results of more than 150 on-board surveys taken from 2000 to 2005, APTA reported in 2007 that 59 percent of transit trips were work related, 11 percent were school travel, 9 percent were for shopping and dining out, 7 percent were social trips, 3 percent were for medical or dental purposes, 6 percent were for personal business, and 6 percent were for other purposes (APTA 2007). About 5 percent of commuting trips are taken by public transit. Outside of urban areas, however, public transit is used for less than 1 percent of person trips.
d The other metropolitan areas with more than 5 million in population are Los Angeles, Chicago, Washington, San Francisco, Philadelphia, Boston, Detroit, and Dallas. Forty metropolitan areas have populations of 1 to 5 million.
table 2-10 Energy Use per Passenger Mile by Personal Transport Modes, 2006
Btuper PercentRelativeMode PassengerMile toPassengerCars
Transit Mode
Transit bus 4,348 127
Transit rail 2,521 73
Commuter rail 2,656 77
Other Personal Transport Mode
Passenger car 3,437 100
Domestic air carrier 2,995 87
Source: Transportation Energy Data Book, Edition 29, Table 2.12.

68 Policy Options for Reducing Energy Use and Greenhouse Gas Emissions from U.S. Transportation
be readily changed, and labor agreements often limit the use of part-time workers. As a result, average energy efficiency per rider suffers.
Recent trends in public transit use do not indicate increased energy or emissions efficiency in the public transit sector. According to data from the American Public Transportation Association (APTA), vehicle hours of transit service nationwide increased by 34 percent between 1998 and 2008, but passengers per vehicle hour decreased by 10 percent, from 37.7 to 33.9. There are several reasons for these countervailing trends. The most significant may be the disproportionate growth of transit service in newer metropolitan areas and the suburbs of older cities where densities are lower and automobile use dominates.20
intercity passenger rail energy characteristicsIn the United States, most intercity passenger rail service is provided by a single company, Amtrak, which was created in 1971 to absorb nearly all of the passenger services of the nation’s railroads. Before Amtrak’s creation, passenger service had been losing large sums of money for decades and was being cut back severely by the railroads then providing it. Amtrak’s takeover was intended to ensure that at least some intercity passenger rail service remained.
On a passenger mile basis, intercity rail (Amtrak) is more energy efficient by about 25 to 35 percent than its chief competitors, aviation and personal vehicles, for long-distance markets of 200 to 800 miles. Inter-city rail, however, serves only about 500 stations nationwide and carries 5.5 billion passenger miles per year, which is less than 1 percent of total passenger miles. But in at least one corridor—the Northeast Corridor, running from Boston through New York City to Washington, D.C.—Amtrak handles a significant share of total traffic. In 2007, Amtrak’s share of combined rail and air traffic between New York City and Washington was 56percent;betweenNewYorkCityandBostonitssharewas41percent.21 The Northeast Corridor is by far the largest rail passenger corridor in the country. In 2007 it was responsible for 10 million passengers of Amtrak’s total ridership of 25.8 million. The next-largest corridor, the Pacific
20 http://www.apta.com/resources/statistics/Documents/FactBook/2011_Fact_Book_Appendix_A.pdf.21 Amtrak Annual Report 2007, p. 11.

U.S. Transportation Today 69
Surfliner, had 2007 ridership of 2.7 million.22 Three other corridors had a ridership of between 1.0 million and 1.5 million.23
Amtrak owns its Northeast Corridor tracks. These tracks carry little if any freight and are designed for passenger service. Outside the Northeast Corridor, Amtrak mostly runs on tracks owned by the freight railroads. These tracks are designed to accommodate freight trains, greatly limiting the speeds at which passenger trains can operate as well as the number of passenger trains that can be accommodated.
In recent years interest in developing high-speed passenger rail ser-vice in the United States has been growing. In February 2010 the Obama administration announced the provision of startup funds for a limited number of high-speed passenger rail systems around the country. California voters recently approved funding for a dedicated high-speed passenger rail system linking major cities in the state. Numerous studies have investigated the demand for and cost of high-speed intercity rail service. However, the question of what constitutes “high speed” remains to be determined. It is likely that none of these systems, except perhaps the one in California, will resemble the high-speed passenger trains that operate in Europe and Japan, in part because of the high cost of providing dedicated right-of-way.
The dense travel corridors of 200 to 800 miles, which are the target markets for this service, represent a small share of total passenger travel, most of which is local and served by automobile and is thus not a candidate for replacement by high-speed rail. The short- to medium-haul markets, where high-speed rail might be viable, are likewise served mainly by automobile, because many travelers (including families) are price-sensitive and are traveling not from center city to center city but from one sub-urban location to another. They value their private vehicle, even for longer-distance travel, because of its carrying capacity and ability to provide local transportation at the destination. High-speed rail may be most attractive for business travelers currently traveling distances
22 The Pacific Surfliner Corridor provides service between San Luis Obispo, Santa Barbara, Los Angeles, and San Diego.23 These were the Capital Corridor (1.5 million) serving San Francisco, San Jose–Oakland, Sacramento, andReno;theEmpireServiceCorridor(1.3million)servingNewYorkCity,Albany,Buffalo,andToronto,Canada; and theKeystoneCorridor (1.0million) servingHarrisburg,Philadelphia, andNew York City.

70 Policy Options for Reducing Energy Use and Greenhouse Gas Emissions from U.S. Transportation
of 150 to 500 miles. This application, which could be important in some corridors and would mainly substitute for air travel, is not likely to have large impacts on total transportation energy use and emissions.
system-level energy characteristicsIn considering the energy characteristics and related GHG emissions of individual modes, a major challenge is in recognizing how efforts to change the level of energy use in one mode can have systemwide implications for total transportation energy use. Because of their difficulty, such system-level analyses are rare. However, the need for such a vantage point has long been recognized.
A 1977 Congressional Budget Office (CBO) report, Urban Transpor-tation and Energy: The Potential Savings of Different Modes, suggests how to go about taking such a system-level approach for the transportation system. The CBO report appeared shortly after the first oil supply shock, when policy concern was focused for the first time on reducing trans-portation’s use of petroleum, and Congress requested comparisons of energy performance by various modes to inform energy-saving policies. When CBO conducted its analysis, the most frequently cited measure of energy performance was the direct amount of energy consumed per vehicle mile or ton-mile. CBO revealed how this measure was too narrow for the purpose of analyzing net energy effects from policy choices about transportation investments. CBO developed a framework for evaluating energy performance that considers the various interrelated components and sources of transportation energy use. Figure 2-4 shows an adaptation of the basic CBO framework.
The first level in the CBO framework, labeled “operations energy,” includes only the energy required to power the vehicles. The second level, “facility and operations energy,” adds to the first level the energy used to run and maintain stations and terminals, manufacture and maintain vehicles, and construct and maintain the way infrastructure used by vehicles. The third level, “modal energy,” recognizes that the means by which the mode is typically accessed by users can have energy implications. For example, public transit systems do not provide door-to-door service. To utilize them, riders must walk, bicycle, drive, or carpool to and from an access point. The additional energy required for this access, including any

U.S. Transportation Today 71
energy consumed because of travel circuity, must be included in calculat-ing the total energy performance of the provided transit service. Similar calculations could be made for the energy performance of freight rail that involves truck connections to and from freight rail terminals.
In analyzing the energy implications of enhancements to a particular transportation service (such as providing more frequent bus service),
Energy Impact Category Energy Components of NewTransportation Service
Energy used for propulsion of vehicles
Operationsenergy
Average occupancy or load factorper vehicle
Energy used for transportation facilityand vehicle maintenance
Energy used for transportationinfrastructure construction
Means of accessing new service
Fraction of total trip devoted to access
Origins of users of new service
Added circuity
Facilityandoperationsenergy
Modalenergy
figure 2-4
Framework for examining energy performance of transportation services.
Source: Adapted from CBO 1977.

72 Policy Options for Reducing Energy Use and Greenhouse Gas Emissions from U.S. Transportation
one must add a fourth level to the structure that subtracts energy that would otherwise have been consumed by the new users of the enhanced system. For example, the goal of the enhancement may be to induce high-way users to switch to less energy-intensive modes, such as mass transit or freight rail. Those switching to the new service may use less energy than they would have in using their previous forms of transportation. However, experience shows that enhancements to a transportation service will generate some new transportation users (those who previously did not travel, such as new commuters) or cause some current users of the same service to increase their use. In neither case will there be offsetting reductions in energy use from other modes.
As might be expected, it is difficult to obtain the information needed to make such comprehensive, system-level assessments of the complete energy or emissions impacts of transportation policy choices. Such a comprehensive assessment would need to analyze the energy and emissions impacts from investments extending beyond the transportation sector, such as the potential for transit investments to enable denser housing patterns that are more energy efficient. Various estimates of energy used (and GHGs produced) in the manufacturing, distribution, and disposal of transport vehicles, as well as in infrastructure construction and main-tenance and in accessing the mode, have been made. This information can provide insight into the net energy impacts of investing in an alternative mode of transportation. However, all such data tend to be highly site-specific and difficult to extrapolate widely. In this report, therefore, most of the information on transportation-related energy use and emissions is from the consumption of fuel used to power vehicles.
Considerations Affecting the Adoption of Fuel-Saving and GHG-Reducing Technologies
In 2005, the amount of fuel used by typical transportation vehicles ranged from 541 gallons per year for the average passenger car to 2.4 million gallons per year for the average commercial aircraft (Table 2-11). Fuel used in large amounts, as in the case of aviation, accounts for large costs, and accordingly carriers have an incentive to manage those costs, even when fuel prices are not rising. Between 2003 and 2008, fuel costs rose from

U.S. Transportation Today 73
14 to 31 percent of total operating costs for the 21 major U.S. air carriers, from 11 to 26 percent of total operating costs for the Class I railroads, and from 17 to 31 percent of the total operating costs (less rentals and purchased transportation) for the 11 publicly listed road freight carriers.24
Fuel is one of many inputs used in the production of transportation services. For commercial transportation activities, other important inputs include labor, maintenance expenses, and the costs of vehicle ownership. Different combinations of these inputs produce different levels of operating cost. Operating cost itself must be traded off against the revenue that can be generated by using vehicles with different fuel use characteristics or by using different vehicle operating patterns. Thus, fuel-intensive commercial transportation systems (such as air courier services offering overnight delivery of extremely time-sensitive documents and packages) exist in parallel with transportation systems having relatively low fuel intensities (such as barges moving bulk commodities). Also, opportunities to reduce the use of fuel may not be exploited if doing so would cause total operating expenses to increase or if their implementation would cause the transportation service in which they are used to lose demanded attributes such as speed or reliability.
table 2-11 Vehicle Miles Traveled and Energy Used per Vehicle per Year, 2005
AverageVehicleMiles AverageFuelUsedVehicleType perYearperVehicle perYearperVehicle(gallons)
Passenger car 12,427 541
Taxicab 58,333 3,523
Light truck 11,100 686
Single-unit truck 12,400 1,414
Combination truck 68,800 11,698
Transit bus 30,190 6,462
Rail freight locomotive 69,879 184,374
Commercial aircraft 1,003,000 2,384,924
24Sources:21majorU.S.aircarriers,BureauofTransportationStatistics,Form41,ScheduleP6;ClassIrailroads,AssociationofAmericanRailroads;and11majorpubliclytradedmotorcarriers,Publicly Traded Carrier Database.

74 Policy Options for Reducing Energy Use and Greenhouse Gas Emissions from U.S. Transportation
Commercial operators clearly have a strong incentive to take actions to reduce their fuel costs, but in doing so they must balance the need to avoid increasing their total operating costs or undermining the value of their services. Although carriers may try to pass the higher fuel costs on to their customers, there will be competitive incentives to seek means of reducing these costs (and gaining market share) by reducing the energy intensity of their services. During periods of high fuel prices, carriers may change the patterns of service they provide to save fuel. They may travel more slowly, configure their routes differently, and change the relative utilization of the vehicles in their fleets on the basis of fuel efficiency. However, they face limits on the adjustments they can make and still provide services that meet their customers’ needs. To illustrate the decision-making calculus, Box 2-3 describes the decision-making calculus of a taxicab operator.
In the face of rising fuel prices, owners of household vehicles face a somewhat different set of incentives in determining which vehicles they will purchase and how they will utilize them. They are not in the business ofsellingtransportationservices;forthem,transportationisameanstoan end. The automobile is used to travel to work, shop, conduct other forms of personal business, and socialize. To be sure, the cost of owning and operating private vehicles is significant.25 In 2006, 17.6 percent of the average household’s total spending was for transportation.26 Net outlays on vehicles accounted for 6.5 percent of total spending, while purchases of gasoline and oil accounted for 4.8 percent. Thus, when the average price of a gallon of gasoline jumped by about 40 percent from 2006 to mid-2008, consumers incurred an increase of nearly $600 in the average annual cost of operating a vehicle. Because the average household owns 1.9 vehicles, this increase represented a change of about 2 percent in a household’s annual spending. To minimize this expense, the household could adjust its vehicle use patterns, but most practical adjustments would have limited impact. In many cases, the greatest impact could come from
25 In 2007, the average “consumer unit” consisted of 2.5 persons and had 1.9 vehicles (U.S. Bureau of Labor Statistics, Consumer Expenditure Survey 2007, Table 48).26 Strictly speaking, the data in the Consumer Expenditure Survey refer to “consumer units.” A consumer unit differs slightly from a “household” as defined by the Census Bureau. The difference is small enough to ignore for purposes of this report.

U.S. Transportation Today 75
Consider the different ways that fuel costs influence the decision making of a taxicab owner–operator and the owner–operator of a personal light-duty vehicle. Both may own and operate the same make and model of vehicle. But the average taxicab is driven many more miles each year than is the typical private automobile—58,333 miles for the former versus 12,427 for the latter (Table 2-11). The average taxicab is less energy efficient than the average passenger car—17 versus 23 miles per gallon. The average taxicab is larger.AtypicaltaxicabsuchastheFordCrownVictoriaweighs4,100pounds;the average private automobile weighs about 3,000 pounds.a Therefore, it is not surprising that the average private automobile used 541 gallons per year in 2005 while the average taxicab used 3,523 gallons. Higher fuel prices will have a greater impact on taxicab fuel costs than they will on fuel costs for the typical automobile. With no change in driving, the increase in gasoline price from its average of $2.89 per gallon in 2006 to $3.98 per gallon in mid-2008 increased the annual costs incurred by the private vehicle owner by $589 to $2,153. For the taxicab owner–operator, the same increase in fuel prices raised annual fuel costs by $3,825 to $14,014. For the taxicab owner–operator, the increase in fuel prices raised the share of operating costs represented by fuel from 20 to 26 percent.
This implies that taxicab drivers should be especially interested in smaller, more fuel-efficient vehicles. A growing (but still small) number of taxicabs are hybrid vehicles. However, the taxicab owner–operator faces constraints that may not necessarily apply to the private driver. Taxicabs require more rear seat room and more room to carry luggage or goods. Therefore, the leeway for improving fuel economy by “downsizing” is likely to be less for taxicabs than for private use automobiles. Durability is also likely to be much more important to the taxicab owner–operator, since downtime for repair equates to lost revenue.
aThese weights are for the 2009 Ford Crown Victoria and the 2010 Toyota Camry. In calendar year 2008, the Camry was the largest-selling passenger car in the United States, with sales of 436,000 units. In that year, approximately 49,000 Ford Crown Victorias were sold.
Source: Automotive News.
box 2-3
Fuel Cost Calculus of a Taxicab Owner

76 Policy Options for Reducing Energy Use and Greenhouse Gas Emissions from U.S. Transportation
purchasingamorefuel-efficientvehicle;however,theoutlayrequiredmay be large, and it may not be offset by fuel savings for a number of years. Furthermore, in households with only one vehicle, the vehicle may need to be multipurpose, which may limit the degree to which a smaller, more fuel-efficient vehicle is practical. Unsure how long the fuel price increase will last, the consumer may be reluctant to make this outlay and change in vehicle type.
Of course, households adjust their vehicle use patterns in the face of higher fuel prices, and they tend to purchase more fuel-efficient vehicles when energy prices are high than when they are low. The sizes of these responses are generally modest. As discussed in more detail in Chapter 4, the short-run price elasticity of gasoline, reflecting changes that are made without purchasing new vehicles, is about 0.10. This means that a 10 percent increase in the fuel cost of driving will lead to a 1 percent decrease in miles traveled. The long-run price elasticity, which reflects the impact of both changes in vehicle use patterns and more fuel-efficient vehicles, is somewhat higher, on the order of 0.30.
Summary Assessment
The evolution of transport energy use over the past 40 years reflects the tugs of several conflicting forces. In general, transport vehicles of all types became more energy efficient as measured by the energy required per passenger mile or ton-mile of output. However, the demand for the trans-port services these vehicles provide has grown more rapidly than have increases in energy efficiency. There also has been a long-term shift toward more energy-intensive transport modes, particularly from walking and public transportation to cars and light trucks for passengers and from freight rail to truck for goods movement. Therefore, despite the improve-ments in vehicle energy efficiency, transport energy use has grown, and since nearly all energy used by transportation has been petroleum-based, GHG emissions have grown roughly in parallel.
If the United States is to reduce transport energy use and GHG emissions significantly over the next 40 years, the energy efficiency of individual transport modes will have to improve more rapidly than it did over the past 40 years. But the data presented in this chapter also

U.S. Transportation Today 77
suggest that this outcome by itself is not likely to be sufficient. Progress will almost certainly need to be made in reducing growth in activity by the most energy-intensive modes. The most important factor in reducing transport-related GHGs may be moving the transport sector away from its near-total dependence on petroleum-based fuels.
Subsequent chapters in this report describe ways in which such changes might be achieved. The challenge of making these changes, especially in affecting the amount of transportation activity and the modes used, should not be underestimated. Having evolved over many decades and reflecting countless decisions about where and how Americans live and businesses operate, today’s transportation systems cannot be easily or quickly altered. Figure 2-5 shows that since 1970, slight declines in miles traveled by cars and trucks have occurred only during periods of economic recession. The general upward trend in motor vehicle travel has been relentless and largely reflective of population growth and the many economic transactions and social interactions that increased mobility
0
0.5
1
1.5
2
2.5
3
3.5
1970
1972
1974
1976
1978
1980
1982
1984
1986
1988
1990
1992
1994
1996
1998
20002002
20042006
2008
VM
T (t
rilli
on)
figure 2-5
VMT by light- and heavy-duty vehicles on U.S. roads.
Source: Federal Highway Administration, Highway Statistics Series. http://www.fhwa.dot.gov/policyinformation/statistics.cfm.

78 Policy Options for Reducing Energy Use and Greenhouse Gas Emissions from U.S. Transportation
enables. The challenge will be in retaining these economic and social benefits, even as the transportation sector and its energy sources undergo substantial change.
References
abbreviationsAAR Association of American Railroads
APTA American Public Transportation Association
CBO Congressional Budget Office
AAR. 2008. Railroad Intermodal Transportation. Washington, D.C., June.APTA. 2007. A Profile of Public Transportation Passenger Demographics and Travel
Characteristics Reported in On-Board Surveys. Washington, D.C.APTA. 2008. Public Transportation Fact Book. Washington, D.C., June.Cambridge Systematics, Inc. 2009. Freight Transportation Bottom Line Report: Freight
Demand and Logistics. American Association of State Highway and Transporta-tion Officials, Washington, D.C.
CBO. 1977. Urban Transportation and Energy: The Potential Savings of Different Modes. Washington, D.C.
Hu, P. S., and T. R. Reuscher. 2004. Summary of Travel Trends: 2001 National House-hold Travel Survey. Prepared for the U.S. Department of Transportation and Federal Highway Administration. Dec. http://nhts.ornl.gov/2001/pub/STT.pdf.
Jones, D. W., Jr. 1985. Urban Public Transit: An Economic and Political History. Pren-tice Hall, Englewood Cliffs, N.J.
Lee, J. J., S. P. Lukachko, I. A. Waitz, and A. Schäfer. 2001. Historical and Future Trends in Aircraft Performance, Cost, and Emissions. Annual Review of Energy and the Environment, Vol. 26, pp. 167–200.
Pisarski, A. E. 2006. NCHRP Report 550/TCRP Report 110: Commuting in America III: The Third National Report on Commuting Patterns and Trends. Transportation Research Board of the National Academies, Washington, D.C.
Polzin, S. E. 2006. The Case for Moderate Growth in Vehicle Miles of Travel: A Critical Juncture in U.S. Travel Behavior Trends. Center for Urban Transportation Re-search, University of South Florida, Tampa. http://www.cutr.usf.edu/pdf/The%20Case%20for%20Moderate%20Growth%20in%20VMT-%202006%20Final.pdf.
Warner, S. B. 1978. Streetcar Suburbs: The Process of Growth in Boston, 1870–1900 (2nd ed.). Harvard University Press, Cambridge, Mass.

79
Chapter 2 shows the immense scope of the U.S. transportation system and the extent to which it is woven into the economy and the daily lives and activities of people. Tens of millions of households, businesses, and government entities own and operate passenger cars and light trucks. Tens of thousands more own and operate much larger commercial trans-portation vehicles, from heavy trucks and buses to aircraft, locomotives, and ships. Most of these vehicles are manufactured by a few hundred large multinational firms, but many require specialized fittings and equip-ment that are supplied by thousands of other firms. Most of the fuel used in transportation is supplied by about a dozen large oil companies, but thousands of other businesses deliver, distribute, and retail it.
The transportation enterprise in the United States consists of various passenger and freight modes that have much in common but also many fundamental differences. The physical infrastructure on which the fleet of mostly private vehicles operates is provided largely by governments across all jurisdictional levels. All states and thousands of county, city, and regional entities own and operate most of the nation’s highways and streets. The most heavily used ports and airports are run by state, local, and regional authori-ties, while the federal government owns and operates the air traffic control system and maintains and operates most inland waterways and harbor channels. Freight railroads own, operate, and maintain their rights-of-way, track, terminals, and other infrastructure, whereas most urban passenger transit systems are owned and operated by local and state governments.
Transportation Policy Landscape3

80 Policy Options for Reducing Energy Use and Greenhouse Gas Emissions from U.S. Transportation
The transportation sector’s scale and diversity present obstacles to attempts to reduce the sector’s total energy use and emissions through the adoption of mode- and vehicle-specific measures aimed at increasing the efficiency of vehicles and their operating environment, diversifying the mix of fuels used, and reducing the amount of transportation activity. Targeting various measures to specific modes, vehicles, and operating environments must involve many actors and interests, both public and private. The decentralized nature of policy making adds to the challenge. The federal government, for example, sets fuel economy standards for new cars and light trucks, but motor vehicle registration, operating requirements, and inspection and maintenance regulations are largely state responsibilities. The authority to tax transportation energy use resides at the federal, state, and local levels, as does ownership of much of the physical infrastructure used for transportation operations. The decen-tralization of decision-making authority presents challenges not only for coordinating policies but also for ensuring that government policies and practices are compatible with one another.
An understanding of the array of decision makers and actors influ-encing the transportation sector is essential in assessing alternative strategies to reduce energy use and greenhouse gas (GHG) emissions. For example, reducing automobile use to any significant degree by increasing the density of new housing and commercial development will require actions by states to induce or compel the participation of the many thousands of towns, counties, and municipalities that regulate local land use. Similarly, the benefits of federal regulations governing the fuel economy of heavy trucks and aircraft may be countered by inadequate investment in the maintenance and operations of highway and air traffic control systems, which could lead to increases in energy consumption. Accordingly, the major decision makers and actors in the transportation sector are discussed in the next section, along with key factors influencing their choices with respect to energy use.
The second half of the chapter reviews current federal, state, and local policies that have meaningful effects on the transportation sector’s energy use and GHG emissions, including discussion of how these policies came about. The policy landscape is fluid, as new policies and programs are being introduced, debated, withdrawn, and adopted. The chapter concludes

Transportation Policy Landscape 81
by discussing some new and proposed policies intended to reduce energy use and GHG emissions in transportation.
Overview of Decision Makers and Actors
In the nation’s passenger and freight modes, three broad groups of actors influence transportation energy use and emissions: (a) the suppliers of transportation vehicles, fuel, and infrastructure; (b) the owners and operators of the vehicles and providers of transportation services; and (c) the end users of transportation services. The composition, interests, and roles of each group often differ among modes. Strategies and policies to influence transportation energy use and emissions must recognize the varying incentives, interests, and capabilities of these actors. The main actors from each of these three groups in the domestic modes that con-tribute most of the sector’s energy use and GHG emissions—light-duty vehicles (cars and light trucks), freight-carrying trucks, and commercial aviation—are discussed below.
suppliers of vehicles, fuel, and infrastructureVehicle ManufacturersIn 2008, more than 70 million cars and trucks, including heavy trucks, were produced worldwide. Each year between 10 million and 15 million cars and light trucks are sold in the United States, the vast majority manu-factured by fewer than two dozen automotive companies. The relatively small number of firms manufacturing automobiles (at least in relation to the number who own them) has increased the practicality of regulat-ing and enforcing standards for vehicle design and performance in areas ranging from safety and emissions to fuel economy. Aircraft manufactur-ing is even more concentrated, especially for the large jet aircraft used for most scheduled passenger and freight service. Two aircraft manufacturers, Boeing and Airbus, make most of the large airliners used by U.S. carriers, while a half dozen other manufacturers provide the majority of small- and medium-size jet airliners. Although they are not subject to national energy efficiency standards, these manufacturers are heavily regulated for safety and must comply with standards for emissions of air pollutants such as oxides of nitrogen. As in the case of the automotive sector, the small number

82 Policy Options for Reducing Energy Use and Greenhouse Gas Emissions from U.S. Transportation
of aircraft suppliers makes regulation of manufacturers more practical than it would be for an industry consisting of hundreds or thousands of manufacturers. However, individual aircraft involve a fair amount of customization and configuring for their anticipated applications and market requirements. Setting standards for aircraft energy and emissions efficiency, therefore, presents a challenge fundamentally different from setting them for automobiles.
Manufacturers of heavy-duty trucks are even more varied than makers of automobiles and aircraft, since trucks are often built and configured in stages by multiple manufacturing and customization firms. A truck manufacturer, for example, may make and assemble the chassis, drive-train, and cab, while a second company builds and integrates the body and a third outfits the vehicle with specialized vocational equipment such as cranes, tanks, and mixers. As discussed in Chapter 2, because heavy trucks have a wide range of duty cycles, a single truck model may serve as the platform for dozens of truck types that differ dramatically in weight, aerodynamics, rolling resistance, and other attributes that affect energy performance. In addition, the trailers and containers that are hauled by trucks are typically made by another set of manufacturers, often built to the specifications of those whose goods are being shipped. Accordingly, trailers and tractors are often not optimized as a system for energy efficiency.
Fuel SuppliersGasoline is used by most light-duty vehicles, while diesel fuel is used by most heavy trucks and buses. According to the American Petroleum Institute, about 140 oil refineries process 15 million barrels of crude oil per day in the United States. About half of this product is refined by the largest 25 refineries, and 75 percent is refined by the largest 50.1 Six oil companies account for about half of U.S. refinery production.2 The petro-leum fuels supplied by these refineries are delivered by pipeline and truck to a distribution network consisting of about 170,000 retail and wholesale fuel outlets. Many outlets are owned and operated by oil companies, but
1 http://www.api.org/Newsroom/upload/09_September_Petroleum_Facts_at_a_Glance.pdf.2 http://www.eia.doe.gov/neic/rankings/refineries.htm.

Transportation Policy Landscape 83
most are independent businesses that purchase fuel for resale to the public. The cost of producing and delivering the fuel includes the cost of the crude; its refining, marketing, and distribution; and taxes. The prices paid by consumers at the pump reflect these costs, plus the profits of the retailers. According to the Energy Information Administration,3 if the market price of crude oil is $50 per barrel, then the crude oil will account for about half of the price charged for a gallon of gasoline at the pump when that price is $2.25 per gallon. Federal, state, and local taxes would account for 20 to 25 percent of the retail price, and refining, distribution, marketing, and retailer profits would make up the remaining 20 to 25 percent. Diesel fuel has comparable cost, tax, and price relationships. Because of the relatively small number of refiners and importers of gasoline and diesel fuel, most federal, state, and local fuel taxes are imposed on the refinery (or on the importer of refined products), which enables more efficient revenue collection.
Ethanol fuel is produced in half the states, most in the Corn Belt region of the Upper Midwest. Collectively, ethanol refiners produced about 9 billion barrels of the fuel in 2008, equivalent to 3 to 4 percent of total energy derived from gasoline consumption.4 Most of the product was consumed by cars and light trucks in blends with gasoline. Ethanol is now blended in virtually every gallon of gasoline sold in the country. Ethanol is used as a primary fuel to a much more limited degree, usually in blends of up to 85 percent (E-85) with gasoline; however, only about 7 million cars and light trucks are so-called flexfuel vehicles that can run on this high blend. About 2,000 filling stations are capable of dispensing E-85, most of them located in the Midwest.
Currently, nearly all ethanol used in the United States is produced from corn starch. A major R&D challenge is to produce the alcohol from cellulose, which is the main component of plant cell walls. An ability to make ethanol and other biofuels from cellulose would greatly expand the types and amount of biomass available for the fuel’s production, allowing the use of corn stover, rice straw, wood, and switch grasses. Other fuels
3 http://www.eia.doe.gov/pub/oil_gas/petroleum/analysis_publications/primer_on_gasoline_prices/html/petbro.html.4 http://www.ethanolrfa.org/industry/statistics/#EIO.

84 Policy Options for Reducing Energy Use and Greenhouse Gas Emissions from U.S. Transportation
besides ethanol could be made from cellulose, including fuels that more closely resemble gasoline and diesel fuel.
Together, gasoline, diesel fuel, and corn-based ethanol account for more than 99 percent of the liquid fuels used in transportation. The only other liquid fuel with appreciable usage is biodiesel, which is used by a relatively small number of trucks and buses. Biodiesel is typically made in the United States from soy oil and contains no petroleum but is usu-ally blended with regular diesel. About 450 million gallons of biodiesel was sold in the United States in 2007, mostly in 5 to 20 percent blends with diesel fuel.5 Research is also under way to test the use of biojet fuel blends made from algae and other biomass. A consortium made up of Boeing, jet engine makers, Air New Zealand, Continental Airlines, and Japan Airlines has flown test aircraft using several kerosene blends of up to 50 percent biofuel. The consortium is exploring new feedstocks and processes to reduce GHG emissions throughout the fuel’s production and use life cycle.
Infrastructure ProvidersThe mostly private owners of transport vehicles and suppliers of transport services operate over a built infrastructure of roads, airports, waterways, and airways that are to a great extent owned, maintained, and operated by government. A major exception is freight railroads, which own and operate their own networks. The configuration, management, and opera-tions of the publicly owned transportation networks can significantly affect modal energy use by influencing the circuity, speed, and efficiency of vehicle operations. Of the more than 2 million miles of paved roadway in the United States, nearly all is owned by state and local governments, who decide where additional investments in capacity are needed. For the most part, access to the road network is unrestricted, although various forms of user charges, such as fuel taxes and tolls, are levied to finance the network. Commercial airports are likewise provided mostly by state and local authorities, although the federal government helps fund and operates much of the airside infrastructure, including runways, radar, and tower services. The federal government has sole authority over the
5 http://www.biodiesel.org/pdf_files/fuelfactsheets/backgrounder.pdf.

Transportation Policy Landscape 85
use of the nation’s airspace and thus owns and operates the air traffic control system. In this capacity, it influences airline operating efficiency by affecting the routing, speed, and altitude of aircraft in the system.
The extensive government involvement in the supply and regulation of transportation infrastructure is important because infrastructure operations affect the energy intensity of transportation services. Govern-ments are responsible for making investments in energy- and time-saving traffic management technologies, such as computer-controlled traffic management systems that can relieve urban traffic congestion. New technologies that promise energy savings by better integrating vehicle and highway operations will therefore require strong public- and private-sector connections. The integration of aircraft and airspace systems is already occurring as part of the Next Generation Air Transportation System, which is expected to give airlines greater freedom to choose routes and speeds that can reduce their energy consumption.
The challenge to the public sector, which must pursue multiple goals from its investments in transportation infrastructure (e.g., safety, equity, and efficiency), will be in finding ways to ensure that its investments are compatible with other policies intended to motivate users of the infra-structure to conserve energy. For example, decisions about where to locate, how to finance, and where to add capacity to public transportation infrastructure can affect mode choice (e.g., using transit or driving) and contribute to broader changes in land use and urban form over time.
vehicle ownersCars and light trucks are the primary means of personal transportation in the United States. About 85 percent of these light-duty vehicles are owned by the country’s nearly 100 million households. According to 2007 data from the Bureau of Labor Statistics Consumer Expenditure Survey, each U.S. household own an average of nearly two cars and spends $8,200 per year (or about 13 percent of household pretax income) on them, includ-ing car payments, registration fees, maintenance expenses, and fuel pur-chases, which averaged $2,400 per household.6
6 http://www.bls.gov/cex/csxann07.pdf.

86 Policy Options for Reducing Energy Use and Greenhouse Gas Emissions from U.S. Transportation
The high rate of vehicle ownership means that policy changes threat-ening to raise the cost of owning and operating vehicles can be difficult for elected officials to achieve. In many respects, the private car has come to be viewed as a consumer good rather than as a source of revenue like a commercial vehicle. Automobile styling, acceleration, handling, and capacity are important attributes for individuals purchasing vehicles, and they often take precedence over characteristics that affect vehicle operating cost such as energy performance.
The diversity of the trucking business makes it difficult to generalize about the incentives of owners and users of medium and light trucks. National and regional trucking companies own fleets consisting of hundreds or thousands of tractors and trailers used in providing trans-portation services for others. These motor carriers take a strong interest in the energy performance of their vehicles in view of the extensive operations of their fleets, often averaging more than 125,000 miles per truck. As a result, fuel expenditures, along with labor, are among their largest operating costs, and carriers that successfully reduce their energy expense per ton-mile can gain additional business and profits by offering lower rates to shippers. The ownership and uses of the remainder of the nation’s truck fleet are too varied to summarize here. However, many medium and large vehicles are used as work trucks, not just for goods transportation. These trucks are not driven as far, and therefore energy performance may not be as important as other attributes such as their functional capabilities and durability.
The nation’s fleet of commercial aircraft is far smaller in number than the fleet of cars and trucks. The former, however, are operated at high levels of intensity. The primary operators of jet airplanes and other turbine aircraft are the mainline and regional airlines, which carry passengers and freight in scheduled service, and corporations that fly business aircraft.7 The approximately 10,000 turbine aircraft that are operated by airlines account for most of the energy used in commercial air transportation because of their intensity of use. Consequently, airlines care a great deal about energy efficiency, as discussed in the previous chapter.
7 Another class of operators is air taxis, which use some small jets and turboprops for short- to medium-haul, on-demand passenger and cargo transportation. They are a niche segment of air transportation and thus are not discussed further in this report.

Transportation Policy Landscape 87
users of transportation servicesExcept in some commercial applications such as taxi service, the owner of a car or light truck is usually the same as the user. Chapter 2 explains how these light-duty vehicles are used by households for trip-making purposes. The airlines own (or lease) aircraft, but the end users are passen-gers and freight shippers. The services that are demanded by these users, therefore, have a major influence on an airline’s decisions about aircraft characteristics. To illustrate, business travelers do not have the same priorities with respect to flight frequency as do leisure travelers. Business travelers value more frequent flights because of the high value they place on total travel time. Meeting this schedule demand has led to airlines’ using smaller aircraft such as regional jets in many markets because these aircraft are easier to fill when frequent flights are scheduled. Smaller aircraft, however, tend to use more energy per passenger mile than do larger airliners when both have high rates of occupancy. Thus, airlines must balance their interest in reducing fuel costs with their interest in meeting the service demands of customers.
Shippers of freight also have service demands that influence the energy intensity of the transportation services they choose. Manufacturers and distributors of high-value goods are interested in service timeliness, reliability, and security, whereas shippers of bulk commodities, such as coal, grains, and chemicals, tend to be more concerned with keeping transportation costs down for their lower-value cargoes. Accordingly, the former shippers are more inclined to demand air cargo and truck services, while the latter tend to use more energy-efficient rail services for their long-distance transportation needs.
policy implicationsTable 3-1 enumerates, generally, the array of actors in each of the three large energy-using transportation modes with respect to the supply of vehicles, fuel, and infrastructure and the ownership, operations, and use of vehicles. In all three modes—light-duty vehicles, trucking, and aviation—the users of transportation services number in the millions. The suppliers of vehicles, fuels, and infrastructure are far fewer in number. This numerical difference is one reason why many energy policies, such as mandates for the supply of renewable fuels and fuel economy regulations, are targeted to

88 Policy Options for Reducing Energy Use and Greenhouse Gas Emissions from U.S. Transportation
the latter group. The same can be said for policies designed for other pur-poses, such as transportation safety. Particularly in the case of cars and light trucks, there can be a great deal of risk involved in taking actions that are viewed as constraining the choices of the millions of consumers who own and operate these vehicles. As Crandall et al. (1986, 2) observed more than 20 years ago when they examined the regulation of the auto-mobile, the proliferation of cars to where they are the principal means of transportation has led to a U.S. policy framework that is, to a large extent, “designed to civilize this mode of transportation rather than to encourage wholesale substitution for it.” Most of the policies that are now in effect to control energy use and emissions in U.S. transportation remain consistent with this earlier description, as discussed in the next section.
Current Policies to Reduce Energy Use and Emissions
Various public policies and programs usually thought of as beyond the realm of transportation policy making can be construed as influencing transportation energy use and GHG emissions. For example, it is often
table 3-1 Approximate Numbers of Actors in the Main Energy-Using Modes of Transportation
CarsandLightTrucks HeavyTrucks PassengerAircraft
Vehicle suppliers
Fuel suppliers
Infrastructure (way and terminal) providers
Vehicle owners and operators
Users of transportation services
Dozens of manufacturers
Dozens of major oil companies; hundreds of fuel outlets
Hundreds (airports); one (Federal Aviation Administration) for airways
Dozens
Tens of millions
Dozens of manufacturers
Dozens of major oil companies; tens of thousands of fuel outlets
Thousands
Hundreds of millions
Hundreds of millions
Hundreds of manufacturers and builders
Dozens of major oil companies; tens of thousands of fuel outlets
Thousands
Tens of thousands
Hundreds of thousands or millions

Transportation Policy Landscape 89
argued that the federal income tax deduction for home mortgage interest has increased demand for bigger homes on larger lots, which has led to more spread out metropolitan areas that are conducive to travel by car rather than by walking or public transit. However, a review of these and other policies that could be affecting transportation energy use and GHG emissions in the United States is not practical. Instead, only major policies and programs whose main goal is to reduce transportation energy use and emissions are reviewed.
federal policiesAt the federal level, the most prominent examples of policies intended to reduce transportation energy use and emissions are automobile fuel economy standards, mandates for the supply of renewable fuels, tax incen-tives to promote electric vehicles, R&D support for the development of fuel cell and battery technologies, public funding for mass transit and carpool lanes, and fuel tax exemptions for ethanol and other biofuels.
Automobile Fuel Economy StandardsA long-standing federal program to reduce transportation energy use is the Corporate Average Fuel Economy (CAFE) program. Created by Congress in 1975, CAFE is administered by the U.S. Department of Transportation through the National Highway Traffic Safety Admin-istration (NHTSA). The U.S. Environmental Protection Agency (EPA) is responsible for testing vehicles and calculating their fuel economy values for NHTSA. For the light-duty sector, CAFE is the most signifi-cant means by which the federal government seeks to control energy use. The standards require automobile manufacturers to meet specific sales-weighted average fuel economy levels for the cars and light trucks they sell in the United States. The model year 2010 standard is 27.5 and 23.5 miles per gallon (mpg) for passenger cars and light trucks, respectively. In addition, the federal government imposes the so-called “gas-guzzler” tax on cars with the lowest fuel economy values and requires mpg label-ing for new cars and light trucks. EPA publishes a Green Vehicle Guide, and the U.S. Department of Energy (DOE) publishes a Fuel Economy Guide to inform consumers about the emissions and energy performance of new vehicles.

90 Policy Options for Reducing Energy Use and Greenhouse Gas Emissions from U.S. Transportation
The Energy Independence and Security Act of 2007 (EISA) led to changes in CAFE. The law mandates that the sales-weighted average fuel economy for new cars and light trucks (combined) be set at 35 mpg by model year 2020, a 30 percent increase over 2010 levels. The 35-mpg value is characterized as a minimum requirement, since NHTSA is always required to set the standard for any model year at the “maximum feasible” level on the basis of technological feasibility, economic practicality, and other considerations. EISA also requires automobile manufacturers to label new cars and light trucks with both their fuel economy and their GHG emissions performance ratings. NHTSA is required to educate the public about the benefits of alternative fuels and to establish a fuel efficiency rating system for tires used on passenger cars.
Energy Efficiency Standards for Larger TrucksEPA administers a number of voluntary programs in collaboration with the trucking industry that are intended to promote energy conservation, such as the SmartWay Partnership Program, which certifies products and services that reduce freight transportation–related energy use and emissions. EPA estimates that trucks certified by SmartWay are 20 percent more energy efficient than the average truck in the heavy fleet. However, this voluntary federal role in promoting freight energy efficiency may be changing. EISA mandates that NHTSA establish fuel economy regulations for medium- and heavy-duty vehicles. To inform its regulatory program, NHTSA asked the National Research Council to conduct an assessment of fuel economy technologies for such vehicles. The results of that study (NRC 2010) are being used by NHTSA in the development of the required regulations. Moreover, in May 2010, the Obama administration directed NHTSA to work with EPA to create a national policy to increase the fuel efficiency and GHG performance of trucks for model years 2014–2018.8 That policy plan was still being developed at the time of this study.
Tax Incentives for Alternative Fuels and VehiclesTo encourage the development and deployment of energy-efficient and alternative-fuel vehicles, the federal government also uses various tax
8 http://www.whitehouse.gov/the-press-office/president-obama-directs-administration-create-first-ever-national-efficiency-and-em.

Transportation Policy Landscape 91
incentives. A tax credit of 10 percent (up to $4,000) has been available to purchasers of electric cars and other clean-fuel hybrid, diesel, battery-electric, alternative fuel, and fuel cell vehicles.9 In 2009, buyers of plug-in hybrid electric vehicles were eligible for a tax credit ranging from $2,500 to $7,500. The 2009 American Recovery and Reinvestment Act made the tax credit available to 200,000 cars per manufacturer. It also provides $2 billion in grants for entities manufacturing advanced batteries for cars and provides a credit for buyers of small “neighborhood” electric cars, electric motorcycles, and three-wheeled electric cars. The law increases the tax credit for gas stations and other businesses that install fueling stations dispensing E-85, electricity, and natural gas.
Renewable Fuels MandateEISA also expands requirements for the use of biofuels. Congress had previously required EPA to implement a renewable fuel standard to ensure that gasoline contains a minimum volume of renewable fuel, which was set at 2.78 percent. EISA mandates that EPA increase the volume of renewable fuel required to be blended into gasoline to be used for motor fuel from 9 billion gallons in 2008 to 36 billion gallons by 2022. It fur-ther mandates that 21 billion of the 36 billion gallons come from sources meeting GHG performance requirements. For 2010, EPA requires that 8 percent of the total gasoline and diesel pool consist of renewable con-tent, although mostly from corn-based ethanol. The agency is required by EISA to establish life-cycle standards for GHG impacts of biofuels, including emissions from changes in land use due to fuel production. The life-cycle GHG emission reduction threshold for ethanol was set at 20 percent below petroleum gasoline. These emission reduction thresholds, however, were set at 50 percent or more for advanced biofuels, biomass diesel, and cellulosic biofuels. Consistent with EISA, the new standard requires that a larger percentage of the renewable fuel supply consist of these advanced biofuels, reaching 60 percent by 2022. In this way, the federal requirement for renewable fuels is intended to contribute to a reduction in transportation GHG emissions and oil imports.
9 There is a 60,000-vehicle limit per manufacturer before a phase-out period begins, which has already been reached by some car models.

92 Policy Options for Reducing Energy Use and Greenhouse Gas Emissions from U.S. Transportation
R&D SupportThe federal government has a number of programs that sponsor R&D on advanced transportation technologies aimed at improving energy efficiency and reducing emissions. They include DOE’s FreedomCar and Fuel Partnership programs, which focus on high-risk research to further technologies such as fuel cells, advanced hybrid propulsion, and advanced internal combustion engines. DOE also supports research on hydrogen fuel cells and biofuels and the 21st Century Truck Partnership, which seeks dramatic improvements in truck energy efficiency and reductions in emissions. At its laboratories in Ann Arbor, Michigan, EPA develops and assists in commercialization of clean and fuel-efficient vehicle tech-nologies, including hydraulic hybrids and clean diesel combustion.
A number of other R&D programs and projects that seek to improve transportation energy efficiency, reduce emissions, and create a more diversified energy base are scattered among other federal agencies. Examples include the research conducted by the National Aeronautics and Space Administration on energy-efficient wing designs, the Federal Highway Administration (FHWA) on intelligent systems to improve traffic flow, the Federal Railroad Administration on train handling to reduce locomotive fuel use, the Federal Transit Administration (FTA) on electric-drive buses, and the Federal Aviation Administration on air traffic management technologies and procedures to conserve fuel.
Federal Fuel Taxes and Infrastructure FundingFederal funding of transportation infrastructure has both direct and indirect effects on transportation energy use. The main source of federal aid to state and local governments for development of transportation infrastructure is the federal excise taxes imposed on transportation fuels. By far the largest source of these funds is the taxes levied on gaso-line and diesel fuel used by cars and trucks. According to the Ameri-can Petroleum Institute, the nationwide average tax on gasoline was 47 cents per gallon as of July 2009 (Table 3-2). The federal tax on gaso-line accounts for 18.4 cents of this total. The average state gasoline excise tax was 18.5 cents. Other taxes (such as applicable sales taxes, county and local taxes, underground storage tank fees, and other miscellaneous environmental fees) totaled 10.2 cents per gallon. The federal diesel tax

Transportation Policy Landscape 93
is 24.4 cents per gallon, and this tax is also accompanied by comparable state and local taxes.
Although most motor fuel taxes were introduced decades ago to finance road improvements—and not to motivate fuel conservation—they raise the retail price of gasoline and diesel by about 25 percent and thereby encourage some additional energy conservation. The federal gaso-line tax has remained unchanged since 1993, when it was last increased by 4.3 cents per gallon. In real terms, the value of the tax increase has declined by about 20 percent over the past two decades. Notably, alcohol fuels and other fuels that contain a blend of alcohol are taxed at a lower rate by the federal government and some states. The federal tax credit of 51 cents for every gallon of pure ethanol blended in gasoline represents a federal tax expenditure of about $9 billion per year.10 Federal taxes are also imposed on fuel used for general aviation, trains, and vessels traversing the inland waterways.
Most federal motor fuel tax revenues are returned to the states for highway and mass transit improvements. FHWA and FTA oversee the use of this federal aid to build and improve public transportation and
table 3-2 Gasoline Motor Fuel Taxes (cents per gallon), July 2009
TotalStateRegion StateExcise OtherState TotalState andFederal
Northeast 23.0 5.5 28.5 46.9
Mid-Atlantic 12.4 17.9 30.4 48.8
South Atlantic 13.1 12.1 25.2 43.6
Midwest 21.8 6.5 28.3 46.7
South 19.3 0.8 20.1 38.5
Mountain 22.9 0.2 23.0 41.4
West 20.5 19.0 39.5 57.9
United States 18.5 10.2 28.6 47.0
Source: http://www.api.org/statistics/fueltaxes/upload/State_MotorFuel_ExciseTax_Summary_7-2009.pdf.
10 Ethanol producers are protected from foreign competition by tariffs and taxes. They also receive a federal tax credit worth $0.45 per gallon. Producers of cellulosic ethanol receive a credit of $1.01 per gallon.

94 Policy Options for Reducing Energy Use and Greenhouse Gas Emissions from U.S. Transportation
highway systems. One of the programs funded through the federal-aid program is the Congestion Mitigation and Air Quality (CMAQ) Program, which provides funds to state and local governments for projects that are intended to reduce congestion and improve air quality. Some of the CMAQ activities presumably yield the collateral benefit of reducing transportation energy use and GHG emissions. For example, state and local governments can use CMAQ funds to promote carpooling, telecommuting, and public transit use; to purchase clean-fuel buses; to build pedestrian and bicycle paths; and to upgrade traffic signals to improve traffic flow.
state and local policiesMany policies and programs to reduce transportation GHG emissions are being pursued at the state and local levels as these governments exer-cise their decision-making authority in the areas of land use planning and infrastructure financing, investment, and operations. Because many important policy levers reside within state and local governments, these entities can serve as test beds for many policy instruments (Lutsey and Sperling 2008). To strengthen their influence, a number of states are also working together on energy and emissions reduction programs.
State and Local Fuel TaxationAs explained earlier, all states impose taxes on motor fuel, primarily to pay for transportation infrastructure. These tax programs could, in theory, be exploited for other purposes such as to create incentives for energy efficiency and conservation. However, most states, like the federal govern-ment, have found it difficult to raise fuel taxes, even to improve highway and transit systems. States have enjoyed greater success in enacting tax incentives to encourage the use of alternative fuels such as ethanol. About half the states impose lower taxes on ethanol and other biofuels. A few Corn Belt states have mandated increased use of biofuels. Massachusetts offers a fuel tax exemption for biofuels that yield a 60 percent reduction in life-cycle GHG emissions relative to the gasoline displaced.
State Energy and Emissions Performance StandardsIn seeking to establish their own energy and GHG performance stan-dards for products such as motor vehicles and appliances, states have long

Transportation Policy Landscape 95
encountered resistance from manufacturers and threats of preemption from the federal government. Only California has been granted author-ity under the federal Clean Air Act (CAA) to establish its own emissions performance standards for automobiles, although to do so it must obtain a waiver from EPA. No other state has similar authority, but federal law allows other states to adopt California’s EPA-approved standards in place of the federal standards.
In 2002, California enacted the so-called Pavley law (Assembly Bill 1493) calling for GHG-based performance standards for new cars and light trucks sold in the state. The law directs the California Air Resources Board (CARB) to set regulations that achieve the maximum feasible and cost-effective reduction of GHG emissions from cars and light trucks. CARB’s regulation governing GHG performance in 2016 vehicles would have been equivalent to a fuel economy standard of about 35 mpg. CARB has considered additional regulations that would lead to a 45 percent reduction in GHG emissions per mile by 2020 model year vehicles, which would be equivalent to achieving 43 mpg.11 CARB has estimated that adoption of this 2020 standard would reduce vehicle GHG emissions by 18 percent.12 More than a dozen states chose to adopt California’s 2016 standards,13 but EPA originally denied California’s request for a waiver. As discussed in more detail below, EPA has since allowed the waiver and issued a notice indicating its intention to regulate GHG emissions from light-duty vehicles in a manner that would meet the Pavley standard.
In addition to the Pavley law, California Assembly Bill 32, enacted in 2006, aims to cap California’s GHG emissions at 1990 levels by 2020.14 Along with California, about half the states have set GHG emissions reduc-tion targets, typically aimed at statewide emissions that are 75 percent or more below current levels by 2050. Although most state targets are only guidelines, a few states have passed laws mandating regulations and
11 California’s standards are stated as grams of GHGs per mile and do not directly equate to miles per gallon. The 43-mpg figure is estimated by CARB.12 http://www.cleancarscampaign.org/web-content/cleanairact/docs/pavleycafe_reportfeb25_08.pdf.13 Arizona, Connecticut, Maine, Maryland, Massachusetts, New Jersey, New Mexico, New York, Oregon, Pennsylvania, Rhode Island, Vermont, and Washington.14 This long-range goal is reflected in California Executive Order S-3-05 that requires an 80 percent reduction of greenhouse gases from 1990 levels by 2050.

96 Policy Options for Reducing Energy Use and Greenhouse Gas Emissions from U.S. Transportation
government programs to meet them. Again, California has been espe-cially active in this regard. Assembly Bill 32 requires CARB to develop a detailed plan indicating how GHG emissions cuts will be achieved in the state and to take specific actions for this purpose.15 CARB has therefore established a number of regulations affecting large trucks and buses. For example, trailers moved through the state are required to be fitted with aerodynamic efficiency components (such as side skirts) and low– rolling resistance tires. CARB also created a Goods Movement Emission Reduction Program in which local authorities, such as air quality districts and port authorities, can apply for state funds to be used for financial rewards to carriers and shippers who upgrade to cleaner and more efficient technologies.
More generally, CARB is putting in place a low-carbon fuel standard (LCFS) for fuels used by cars and trucks. California’s LCFS seeks a 10 per-cent reduction in the carbon intensity of transportation fuels from 2011 to 2020 by accounting for GHG emissions during each step in fuel production, distribution, and consumption.16 Several other states are considering a similar regulatory approach to reducing the carbon intensity of transpor-tation fuels. For example, the governors of 11 Midwestern states tasked a special working group to recommend the design of a regional LCFS.17 The governors of several Northeastern and Mid-Atlantic states have also declared their interest in developing a regional LCFS program.18
Local ActionsLocal governments can influence transportation energy use and emis-sions in a number of ways because they, along with states, are responsible for roadway operations, the supply of on-street parking, the provision of pedestrian and bicycle lanes, and the planning and zoning of land use. In addition to operating local street networks, counties and municipalities
15 http://www.arb.ca.gov/cc/scopingplan/document/psp.pdf.16 Depending on the circumstances, GHG emissions from each step can include carbon dioxide, methane, nitrous oxide, and other GHG contributors. Furthermore, the overall GHG contribution from each particular step is a function of the energy that the step requires. Thus, GHG intensity is typically expressed in terms of grams of carbon dioxide equivalent per megajoule.17 http://www.midwesterngovernors.org/MGA%20Energy%20Initative/LCFS/LCFS.htm.18 http://www.mass.gov/?pageID=eoeeapressrelease&L=1&L0=Home&sid=Eoeea&b=pressrelease&f=090105_pr_lcfs&csid=Eoeea.

Transportation Policy Landscape 97
often own and operate airports, marine ports, public transit systems, and intermodal freight and passenger facilities. They also manage large fleets of government vehicles. Local governments and their metropolitan planning organizations already have important roles in reducing local air pollution and traffic congestion, which are implemented through various means ranging from ridesharing programs and transit investments to ordinances governing truck and bus idling. Some localities are con-fronting the integration of climate policy into their land use and trans-portation planning processes. A few localities, such as Portland, Oregon, and Arlington, Virginia, have enacted comprehensive programs involving land use planning, transit investment, and parking policies. The programs are intended to reduce, or confer the side benefit of reducing, traffic congestion, energy use, and vehicle emissions.
Notably, California’s 2008 Senate Bill 375 directs CARB to establish targets for reducing emissions from passenger vehicles for each of the state’s 18 metropolitan planning organizations for 2020 and 2035. If these metro-politan regions develop integrated land use, housing, and transportation plans that meet the Senate Bill 375 targets, new projects in these regions can be relieved of certain review requirements of the California Environmental Quality Act.
New and Proposed Policies
Attempting to identify and explain all of the many energy and emissions mitigation measures proposed at the federal, state, and local levels is impractical because the proposals are constantly in flux. However, the Obama administration has supported the concept of national carbon pricing as a means of GHG mitigation, along with the aforementioned financial incentives for energy efficiency and alternative fuels and the creation of GHG performance standards for vehicles.
carbon pricing proposalsThe two competing methods of carbon pricing have long been considered to be carbon taxes and cap-and-trade programs. Both methods of pricing can create incentives for cost-effective emissions reductions. The former, which imposes a tax per unit of carbon dioxide (CO2) emitted, would

98 Policy Options for Reducing Energy Use and Greenhouse Gas Emissions from U.S. Transportation
need to be set and periodically adjusted to achieve desired emissions cuts. The latter would set a national quota, or cap, on emissions and create a limited number of emissions permits to be purchased by emitters. For a time, the cap-and-trade concept was the favored approach in congres-sional proposals, in part because such programs already exist in some regions of the country19 and abroad (for example, the European Union’s Emission Trading Scheme). Smaller-scale emissions trading programs had also been used successfully in the electric utilities industry to reduce sulfur emissions. President Obama, in his first address to a joint session of Congress on February 24, 2009, called for a national cap-and-trade program to reduce GHG emissions. However, federal cap-and-trade legis-lation has languished, and federal interest in carbon pricing generally was waning as this report was being drafted.
other policy approachesWhile legislative debate over carbon pricing proceeded, the CAA was taking on a more prominent role as a potential vehicle for reducing GHG emissions in transportation and other sectors. The CAA has long given EPA authority to set fuel quality and vehicle standards (including stan-dards for aircraft and other nonhighway vehicles) to reduce emissions of air pollutants that endanger public health or welfare. GHGs were not previously regulated as such a pollutant. In April 2007, however, the U.S. Supreme Court ruled that the CAA authorizes EPA to regulate GHG emis-sions if the agency determines that these emissions cause or contribute to air pollution that may reasonably be anticipated to endanger public health or welfare. In December 2009, the EPA administrator issued a finding that current and projected atmospheric concentrations of greenhouse gases, including CO2, threaten the public health and welfare of current and future generations. As mentioned earlier, EPA has already used its CAA authority to set GHG performance standards for cars and light trucks. This legisla-tive authority is expected to be used by the agency in the near future to control emissions from other transportation vehicles such as heavy-duty trucks and from stationary sources such as electric power plants.
19 The first U.S.-based trading system was the Regional Greenhouse Gas Initiative in the Northeast, which has been in operation since January 2009.

Transportation Policy Landscape 99
Summary Assessment
The transportation sector presents both challenges and opportunities for taking actions to reduce energy use and GHG emissions. The amount of energy used in transportation is a function of many factors, including the energy intensity of the vehicles, the environment in which they operate, and the extent to which they are used. The sector’s emissions of GHGs are further influenced by the types of energy used and their GHG impacts during consumption and production.
Transportation consists of three broad groups of actors: (a) the suppliers of transportation vehicles, fuel, and infrastructure; (b) the owners and operators of the vehicles and providers of the transportation services; and (c) the users of transportation services. The composition, interests, and roles of each differ, and they can vary greatly by mode. Thus, strategies and policies to influence transportation energy use and emissions must take these decision makers and their differing incentives, interests, and capabilities into account.
Although many federal, state, and local policies and programs affect transportation’s use of energy and emissions of GHGs, most were estab-lished for purposes other than GHG mitigation. The most relevant poli-cies are those seeking to improve the energy and GHG performance of vehicles and their operations, further the development and use of alternative energy sources, and reduce transportation fuel consumption by promoting the least energy-intensive modes of transportation. During the past decade, California, in particular, has been aggressively pursuing policies to reduce GHG emissions from motor vehicles. These state efforts, coupled with growing concerns over higher oil prices and energy security, have been factors in prompting changes at the federal level. Recent federal legislation mandates a 30 percent increase in fuel economy stan-dards by 2020, as well as the eventual establishment of fuel economy standards for medium- and heavy-duty trucks. Federal legislation also calls on fuel suppliers to increase the volume of renewable fuels used by cars and light trucks. The Obama administration has since developed GHG performance standards for new cars and light trucks to complement the higher fuel economy standards and is working on similar standards for trucks.

100 Policy Options for Reducing Energy Use and Greenhouse Gas Emissions from U.S. Transportation
It has been demonstrated that fuel economy and renewable fuel regulations can be implemented, but policies aimed at raising the price of energy and setting prices on GHG emissions have received compara-tively little support from policy makers. The CAA is emerging as a central means by which the federal government can influence energy use and emissions in the transportation sector and elsewhere. Meanwhile, many policy actions to reduce GHG emissions have emerged at the state and local levels. Because many important policy levers reside outside the federal government, these jurisdictions may serve as important test beds for energy and emissions policy.
References
abbreviationNRC National Research Council
Crandall, R. W., H. K. Gruenspecht, T. E. Keeler, and L. B. Lave. 1986. Regulating the Automobile. Brookings Institution, Washington, D.C.
Lutsey, N., and D. Sperling. 2008. America’s Bottom-Up Climate Change Mitigation Policy. Energy Policy, Vol. 36, pp. 673–685.
NRC. 2010. Technologies and Approaches to Reducing the Fuel Consumption of Medium- and Heavy-Duty Vehicles. National Academies Press, Washington, D.C.

101
As reported in Chapter 1, the U.S. Department of Energy’s Annual Energy Outlook for 2010 (AEO 2010)1 projects that motor vehicles will continue to be the transportation sector’s largest contributor to energy use and greenhouse gas (GHG) emissions two to three decades from now (see Figures 1-4 and 1-5). The nation’s cars, light trucks, and medium- and heavy-duty trucks and buses contribute more than 85 percent of the sector’s petroleum use and associated carbon dioxide (CO2) emissions. This dominance is largely because such vehicles serve most of the nation’s transportation activity, which is not expected to change fundamentally over the course of two to three decades. AEO 2010, therefore, projects that motor vehicles will continue to contribute nearly 80 percent of the sector’s energy use and emissions during the 2030s. The remaining 20 percent will be split among commercial airplanes and all other freight and passenger modes combined.
The AEO 2010 projections imply that progress in curbing energy use and emissions from the fleet of light- and heavy-duty motor vehicles, and to a lesser extent commercial airplanes, will be central in making deep cuts in transportation energy use and emissions during the next half century. Accordingly, Chapter 4 examines some of the key factors that are likely to influence trends in the amount of energy used and GHGs emitted from these modes. In particular, the discussion focuses on
Factors Driving Modal Energy Use and Emissions4
1 http://www.eia.doe.gov/oiaf/archive/aeo10/index.html.

102 Policy Options for Reducing Energy Use and Greenhouse Gas Emissions from U.S. Transportation
(a) the cars and light trucks that are owned and operated by households, since they make up about 90 percent of the light-duty motor vehicle fleet; (b) freight-carrying trucks, which consume most of the fuel used by the nation’s heavy-duty vehicles; and (c) passenger airlines, which are the main users of energy in commercial aviation. The chapter contains more detail on freight-carrying trucks, largely because this mode has received less attention than the other two with respect to energy- and emissions-saving trends and opportunities. For each mode, key factors that are likely to drive trends in energy and emissions are identified, and energy use and emissions projections are made to illustrate their effects. Presumably, policies that seek to reduce transportation energy use and emissions will need to modify or counter these driving factors.
Factors Influencing Trends in Light-Duty Vehicles
Trends in energy use and emissions by light-duty vehicles (LDVs) are largely a function of trends in the number of miles traveled by these vehicles and the energy-efficiency gains of new vehicles entering the fleet each year. How these two factors can influence trends in LDV energy use and emis-sions is described and illustrated, along with assumptions about changes in the carbon characteristics of the LDV fuel supply.
role of changes in household travelAccording to the Federal Highway Administration’s (FHWA’s) Highway Statistics,2 LDV vehicle miles of travel (VMT) grew by more than 3 percent per year from 1970 to 1990. During the 1990s, it grew at a more modest rate of 2 percent per year. As explained in Chapter 2, this rate of growth has slowed even more during the past decade for a number of reasons, including stabilizing household size (following decades of decline), stabiliz-ing female labor force participation rates (following decades of increase), and the transitioning of many members of the large baby boom cohort past their peak travel years.3 The AEO 2010 reference case projects VMT
2 http://www.fhwa.dot.gov/policy/ohpi/hss/hsspubs.cfm.3 The economic recession has slowed VMT growth even more in recent years. This is generally thought to be temporary and similar to what has occurred in past recessions.

Factors Driving Modal Energy Use and Emissions 103
to grow by only 1.6 percent per year from now until 2030.4 The anticipated moderation in VMT growth is one reason why cars and light trucks are expected to contribute a slightly smaller share of transportation’s total energy use and emissions over the next 20 years. Nevertheless, because LDVs will continue to account for most of the sector’s energy use and emissions in 2030, even larger reductions in the mode’s VMT growth may be required if deep reductions in total sector energy use and emis-sions are to be achieved.
Most of the nation’s fleet of cars and light trucks consists of private vehicles that are owned and operated by households. Consequently, trends in household demographics and associated trip-making patterns will significantly influence total LDV travel. To illustrate how changes in household trip making can influence VMT, the scenario in Table 4-1 posits alternative rates of growth in the average number of person trips per household by trip purpose (e.g., shopping, commuting). While such trips are made by various modes, they are dominated by LDVs. For the sake of simplicity, the scenario in Table 4-1 assumes that LDVs account for a constant share (60 percent) of all household person trips for the period 2010 to 2030 but that the factors driving growth in person trips are increased trip making for shopping, family errands, and other personal business. The assumed growth in importance of these purposes of house-hold travel is consistent with trends observed in national household travel surveys over the past several decades (see Chapter 2). The surveys suggest that person trips will grow about three times faster for shopping, family, and personal business than for commuting to and from work, which is often perceived incorrectly as the main reason for household trip making. Should this scenario hold, average VMT per household will increase by 10 to 15 percent over the next 20 years.
The above scenario implies that strategies aimed at reducing LDV use for commuting, such as support for carpooling and public transit, may not be as effective in tempering growth in household VMT as would policies aimed at reducing vehicle use for shopping and other non-work-related reasons for personal travel. Another important factor
4 http://www.eia.doe.gov/oiaf/aeo/excel/aeotab_7.xls.

104 Policy Options for Reducing Energy Use and Greenhouse Gas Emissions from U.S. Transportation
table 4-1 Scenario of Changing Household Travel Patterns, 2010–2030
TripPurpose
Shopping, Personal, Commuting FamilyBusiness AllOther Total
Annual growth in person trips 0.25 0.75 0.50 0.79 per household, 2010–2030 (%)
Vehicle trips for every person trip, 0.85 0.63 0.48 0.60 2010 and 2030 (held constant)
Miles per vehicle trip, 2010 and 2030 12 7.1 12.1 10.3 (held constant)
Person Trips per Household
2010 548 1,528 1,426 3,502
2030 597 1,838 1,660 4,095
Share of Household Person Trips (%)
2010 16 44 40 100
2030 15 44 41 100
Vehicle Trips per Household
2010 466 963 685 2,113
2030 507 1,158 784 2,449
VMT per Household
2010 5,592 6,837 8,288 20,717
2030 6,084 8,222 9,489 23,795
Note: The specific figures in this scenario are derived as follows: Total LDV VMT, projected to be 2.75 trillion in 2010 by AEO 2010, is multiplied by 0.9, the historic share of LDV VMT by house holds. The result, 2.48 trillion vehicle miles, is divided by the Census Bureau forecast of 119.6 million households in 2010, which yields an average household VMT of 20,717. In the 2001 National Household Travel Survey, commuter, shopping, personal, family, and all other vehicle trips accounted for 27, 33, and 40 percent of household VMT, respectively. The number of vehicle trips is computed by dividing VMT by the 2001 average trip length for each trip purpose. Person trips are then computed by applying the ratio of vehicle trips to person trips.
in total growth in VMT will be the rate of growth in the number of households. For the next three decades, Yi et al. (2006) forecast that the total number of U.S. households will grow by 0.7 to 1.1 percent per year, depending on assumptions about overall population growth and changes in family size, age structure, and marriage rates (Table 4-2). The higher growth rate is considered more likely if households continue

Factors Driving Modal Energy Use and Emissions 105
to become smaller and the U.S. population grows by 0.93 percent per year, as forecast by the U.S. Bureau of the Census.5 Persons living in smaller households average more VMT than do persons living in larger households. In the latter case, the vehicle miles for a household errand, such as shopping for groceries, are spread among a larger number of household members (Hu and Reuscher 2004). The assumption that the total number of U.S. households grows by 1 percent per year from 2010 to 2030 results in an estimate of about 145 million households by 2030, compared with about 120 million today. Even if average VMT per household were to remain static over the next two decades, total household VMT will increase by at least 20 percent.
Thus, household demographic trends must be considered as a factor influencing future transportation energy use and emissions. Because of the growth in U.S. population, a reduction in total household VMT would likely require major changes in the number, structure, and size of households, which are outcomes that transportation policy making alone cannot bring about. Nevertheless, transportation policies that can help reduce VMT per household may be able to amplify the effect of fuel taxes and other policies in curbing growth in transportation energy use and emissions.
table 4-2 Projected Ranges in the Number of U.S. Households, Total and One-Person
Total One-Person Percentageof Households Households AllHouseholdsHavingYear (millions) (millions) OneorTwoPersons
2010 121–122 33–34 26–28
2020 133–137 36–41 27–30
2030 143–153 38–48 27–31
2040 150–172 42–54 28–31
Percentage annual growth 0.7–1.1 0.8–1.5
Source: Yi et al. 2006.
5 http://www.census.gov/population/www/projections/summarytables.html.

106 Policy Options for Reducing Energy Use and Greenhouse Gas Emissions from U.S. Transportation
role of vehicle efficiency performanceIn 2006, the U.S. LDV fleet averaged 20.6 miles per gallon of gasoline (mpg), up almost 9 percent from 1990.6 The effects of even faster increases in fuel economy on energy use and emissions are worth considering. As a result of tighter federal fuel economy standards and new standards for vehicle GHG performance (as explained in Chapter 3), AEO 2010 projects that the combined mpg for new cars and light trucks will grow by 2.75 percent per year from 2010 to 2020. For the period extending to 2030, AEO 2010 projects an average improvement of 1.8 percent per year in the mpg of the fleet.
As shown in Figure 4-1, the AEO 2010 projections assume that new cars and light trucks sold between 2010 and 2030 will consist largely of vehicles powered by gasoline, although they will have increasingly efficient engines and other fuel-saving systems. By 2030, only about two-thirds of all new vehicles are expected to be solely gasoline powered. Diesel,
6 In this section, “miles per gallon” is in reference to a gallon of gasoline. The referenced 20.6 mpg is from FHWA 2007, Table VM-1. (See http://www.fhwa.dot.gov.)
0
2,000
4,000
6,000
8,000
10,000
12,000
14,000
New
Veh
icle
Sal
es (t
hous
ands
)
Gasoline ICE vehiclesPlug-in hybrid electric
TDI diesel ICEHybrid electric
Ethanol-flex fuel ICENatural gas
Electric vehicleFuel cell
20062007
20082009
20102011
20122013
20142015
20162017
20182019
20202021
20222023
20242025
20262027
20282029
2030
figure 4-1
Forecast new light-duty automobile sales by technology type, 2006–2030 (AEO 2010 reference case).
ICE = internal combustion engine; TDI = turbocharged direct injection.

Factors Driving Modal Energy Use and Emissions 107
ethanol, hybrid electric, and plug-in hybrid electric vehicles are projected to make up the remaining one-third of new vehicle sales. By 2030, the latter vehicles, having entered the fleet in large numbers during the 2020s, are projected to account for about 25 percent of the miles traveled by all LDVs (Figure 4-2).
An average rate of growth of 1.8 percent per year in fleet fuel economy is high compared with trends over the past 25 years, but the impact of the higher mpg on total LDV energy use would be largely offset by growth in household VMT, as discussed above. Indeed, the projection of a 1.6 percent per year rate of growth in LDV travel in AEO 2010 implies that nearly all of the fuel savings from the annual 1.8 percent increase in vehicle efficiency will be countered by increased vehicle use.
Table 4-3 illustrates how an average increase of 1.8 percent per year in the fuel economy of the fleet translates into changes in mpg for new vehicles (for all vehicles combined and for passenger cars and light trucks separately). This example assumes that light trucks account for about 54 percent of miles traveled by new vehicles. The average mpg of new vehicles entering the fleet would increase from 22.3 today to 31.6 by 2030, or by 41 percent. Of course, if light trucks become less popular, the
0
500
1,000
1,500
2,000
2,500
3,000
3,500
4,000
4,500
Mile
s Tr
avel
ed (b
illio
ns)
20062007
20082009
20102011
20122013
20142015
20162017
20182019
20202021
20222023
20242025
20262027
20282029
2030
Gasoline ICE vehiclesNatural gas technology
TDI diesel ICEElectric technology
Ethanol-flex fuel ICEFuel cell technology
figure 4-2
VMT by LDV technology set, 2006–2030 (AEO 2010 reference case).

108 Policy Options for Reducing Energy Use and Greenhouse Gas Emissions from U.S. Transportation
improvements in the average mpg of new vehicles could be lower and still achieve the same result. Thus, policies that discourage interest in SUVs and other light trucks may deserve consideration.
resulting trends in ldv energy use and ghg emissionsThe factors affecting future LDV energy use and GHG emissions dis-cussed in this section are household VMT and vehicle fuel economy. If trends in VMT and fuel economy were independent of one another, total LDV fuel consumption might be expected to fall by about 0.2 per-cent per year (the anticipated 1.6 percent annual growth in VMT would be more than offset by the 1.8 percent annual growth in fleet mpg result-ing from current legislation). However, VMT and fuel economy are not fully independent of one another because increases in vehicle fuel economy will cause the fuel-related cost of driving to go down in the absence of higher fuel prices. The reduction in fuel operating cost (that is, the reduction in fuel expenditures per mile driven) lowers the “price” of driving an additional mile and will thus prompt some addi-tional motorist demand for driving. The increase in travel demand is widely known as the “rebound effect.”
The size of the rebound effect associated with stricter fuel economy standards has been a topic of debate for decades. The literature contains a range of rebound effects associated with increases in vehicle fuel econ-omy. In the recent literature, Small and Van Dender (2007), who examined a pooled cross section of U.S. states for 1966 to 2004, found rebound
table 4-3 Growth in LDV Miles per Gallon, 2010–2030
2010Values 2030Values
New car miles per gallon 25.3 35.8
New light truck miles per gallon 19.8 28.0
Light truck share of new-vehicle VMT (%) 54.0 54.0
Combined new-vehicle miles per gallon weighted by VMT (assumes that light trucks account for 54% of new-vehicle VMT) 22.3 31.6
LDV fleet (on-road) average miles per gallon 20.7 29.6
Note: Vehicle miles per gallon values are intended to represent actual experience on the road. The figures shown are lower than the EPA test values by 20%.

Factors Driving Modal Energy Use and Emissions 109
effects of 4 and 21 percent for the short and longer runs, respectively.7 Other researchers have reported similarly low values (Schipper and Grubb 2000), while a few have reported much higher values [for example, Frondel (2004) found an increase exceeding 50 percent]. On the basis of a review of dozens of studies from the 1980s and 1990s, Graham and Glaister (2002) report short- and long-run rebound effects of 10 and 30 percent, respectively. This range is the one most commonly cited in the literature.
Small and Van Dender observed that the effect of fuel costs on total demand for driving is becoming smaller as household income rises. Their analysis of data from 2000 to 2004 suggests that the rebound effect has diminished to between 1 and 6 percent, with the higher value represent-ing the longer-term response. Others, such as Hughes et al. (2006) and Basso and Oum (2007), have observed similar declines over time. Small and Van Dender surmise that higher household incomes have rendered fuel costs per mile less significant relative to other costs associated with more travel, particularly the value of travel time.
On the basis of this evidence, the assumption that each 10 percent increase in vehicle fuel economy will produce about a 1 percent increase in VMT appears reasonable. This value aligns with recent lower estimates for longer-run responses while remaining within the range of rebound values traditionally cited. Thus, if fleet mpg is assumed to increase by an average of 1.8 percent per year over the next 20 years, VMT will like-wise increase by nearly 1.8 percent per year. The total increase in VMT (including the small addition from the rebound effect) would cancel most of the fuel savings that would otherwise have been achieved from the higher vehicle fuel economy. Figure 4-3 shows the resulting trend line, which is similar to projections of LDV fuel use in the AEO 2009 reference case.8
In considering trends in GHG emissions, changes that may occur in the GHG characteristics of the energy used by the LDVs must be taken into account. Of course, how LDV energy supplies will change over time is unknown. As a reference case, however, the assumption that gasoline will
7 Long-run responses to changes in the fuel cost per mile of driving are greater because consumers have more time to make changes, such as in their commuting distance.8 When these analyses were performed, AEO 2009 was the latest available AEO forecast.

110 Policy Options for Reducing Energy Use and Greenhouse Gas Emissions from U.S. Transportation
remain the dominant fuel used by the LDV fleet for at least the next two decades, and probably for much longer, appears reasonable. Indeed, this assumption is consistent with Argonne National Laboratory’s VISION model, whose reference case projections of the LDV energy supply are shown in Table 4-4.9 The VISION model assumes that in 2010 gasoline and ethanol will account for 94 and 5.4 percent, respectively, of LDV energy used, with the small remainder (<1 percent) consisting mostly of diesel. By 2030, the model assumes that gasoline will account for only 88 percent of LDV energy use, diesel for 2.5 percent, and ethanol for 8.8 percent.
0.0
20.0
40.0
60.0
80.0
100.0
120.0
140.0
160.0
20102011
20122013
20142015
20162017
20182019
20202021
20222023
20242025
20262027
20282029
2030
Bill
ion
gallo
ns
AEO 2009 LDV fuel useReference LDV fuel use
figure 4-3
Projections of total LDV fuel use, 2010–2030, chapter illustrative case compared with AEO 2009 reference case.
9 The VISION model was developed by Argonne National Laboratory to provide estimates of the potential energy use, oil use, and carbon emission impacts of advanced LDV and heavy-duty vehicle technologies and alternative fuels through 2100. The model consists of two Excel workbooks: a base case of U.S. highway fuel use and carbon emissions to 2100 and a copy of the base case that can be modified to reflect alternative assumptions about advanced vehicle and alternative fuel market penetration. The VISION model uses VMT projections from AEO 2009. http://www.transportation.anl.gov/modeling_simulation/VISION/index.html.

Factors Driving Modal Energy Use and Emissions 111
Translating these various trends in VMT, vehicle efficiency, and fuel supply composition into projections of LDV GHG emissions trends presents additional uncertainties. The burning of a gallon of gasoline creates about 19 pounds of CO2. However, estimation of the net effect of the substitution of ethanol for some gasoline on GHG emissions requires calculations of life-cycle emissions of each fuel, including emissions from fuel production and distribution. This is a complicated and controversial step, which, given the relatively small changes projected in the fuel supply (that is, ethanol increasing from 5.5 to 8.8 percent of energy use), is not merited. Thus, the fuel consumption trends shown in Figure 4-3 assume that gasoline will remain the dominant energy source for LDVs until 2030. If such trends play out, CO2 emissions from the burning of fuel by LDVs will remain steady over the next 20 years, holding at about 1,125 million metric tons per year (19 pounds of CO2 per gallon × 130,000 billion gallons/ 2,200 pounds per metric ton).
Heavy-Duty Trucks
As in the case of LDVs, the key factors influencing energy use and emis-sions by large trucks are growth in vehicle travel and energy efficiency. However, gauging energy efficiency trends in trucking can be complicated because the item of interest is the total amount of energy used to move a given amount of freight over a distance, not the mpg of individual vehicles. Thus, trends in total energy use by large trucks will depend on many factors,
table 4-4 Projected Shares of LDV Energy Use by Fuel Type, 2010–2030, from Argonne VISION Model (base case)
Compressed Year Gasoline Diesel NaturalGas F-TDiesel Biodiesel Ethanol Total
2010 94.0 0.5 0.1 0.0 0.0 5.4 100
2015 92.6 0.8 0.0 0.0 0.0 6.5 100
2020 90.7 1.2 0.0 0.1 0.0 7.8 100
2025 89.0 1.8 0.0 0.3 0.0 8.8 100
2030 88.2 2.5 0.0 0.4 0.1 8.8 100
Note: Shares are percentages. F-T = Fischer–Tropsch.

112 Policy Options for Reducing Energy Use and Greenhouse Gas Emissions from U.S. Transportation
from growth in freight demand to trends in truck payloads, average ship-ping distances, and vehicle efficiency characteristics.
role of truck travel and its determinantsThe major determinant of truck travel is the demand for freight, which is driven largely by growth in the national economy. Two other important factors are changes in average truck payload size and length of haul. The latter factors are, in turn, affected by changes in the overall geographic pattern of freight demand, particularly the rate of growth in long-distance versus local freight traffic.
The main metric used for measuring freight movement is tonnage. FHWA projects trucked freight tonnage for the next 20 years largely on the basis of assumptions about economic growth. For the period 2010 to 2030, FHWA expects tonnage to grow by an average of 2 percent per year, increasing from 13.2 billion tons to nearly 20 billion tons, or by about 50 percent (Figure 4-4). If the average truck payload and length of haul are assumed not to change over this time span, a 50 percent increase in freight tonnage would translate into an equivalent increase in truck VMT. However, the FHWA projections assume that long-distance
0
50
100
150
200
250
300
350
400
20102011
20122013
20142015
20162017
20182019
20202021
20222023
20242025
20262027
20282029
2030
Bill
ions
of V
MT—
100
mill
ion
tons
of f
reig
ht
Interstate tons (FAF) (2.6% annual growth)Intrastate tons (FAF) (1.8% annual growth)Metropolitan tons (FAF) (1.9% annual growth)
AEO 2009 truck VMT forecast (2.5% annual growth)
FHWA truck freight forecast(tons) (2.0% annual growth)
figure 4-4
FHWA truck freight forecasts for 2010–2030.

Factors Driving Modal Energy Use and Emissions 113
(interstate) freight tonnage will grow faster than tonnage moved within state (intrastate) and locally (metropolitan) (Figure 4-4). A disproportion-ate increase in long-distance trucking will cause larger increases in VMT relative to the increase in total freight tonnage.
A few simplifying assumptions based on FHWA’s freight tonnage forecasts can be made to illustrate how disproportionate growth in long-distance trucking can influence overall trends in truck travel (and in energy use). The FHWA tonnage forecasts distinguish between local, intrastate, and interstate freight. Each differs in average truck payload and distance traveled. In the case of local trucking, most trucks consist of single-unit vehicles carrying small loads. Because trucks often travel empty or with partial loads, these vehicles are assumed to average 3 tons of freight payload over a distance of 25 miles. Intrastate trucking tends to consists of a mix of single-unit and combination trucks. These trucks are assumed to average 8 tons of freight payload and 100 miles per haul. Nearly all longer-distance interstate trucking consists of combination trucks, which are assumed to average 14 tons of freight payload and 500 miles per haul.
These assumptions are applied to FHWA’s freight tonnage projections in Table 4-5. The table illustrates a division of freight tonnage, truck VMT, and ton-miles across the segments of the trucking business. Table 4-6 shows how truck VMT would trend for the single-unit and combination fleets on the basis of these divisions and additional assumptions about the share of local, interstate, and intrastate traffic moved by single-unit versus combination trucks.
On the basis of numerous simplifying assumptions, this scenario illustrates how changes in the nature and structure of freight markets and the trucking industry can affect trends in the overall energy performance of trucking, regardless of changes in the energy efficiency of the vehicles themselves. If FHWA’s projections of faster growth in long-distance freight demand are borne out, then VMT by combination trucks will grow faster (by 2.4 percent per year in this scenario) than VMT by single-unit trucks (1.9 percent). This trend, by itself, would lower the average mpg of trucks on the road because of the greater number of combination trucks in service. However, the same trend would reduce the average amount of energy used per ton-mile of trucked freight, since the larger combination trucks carry more tonnage per mile.

114 Policy Options for Reducing Energy Use and Greenhouse Gas Emissions from U.S. Transportation
role of vehicle energy efficiencyAccording to FHWA statistics for 2006,10 combination and single-unit trucks averaged 5.9 mpg of diesel fuel burned.11 In the AEO 2010 reference case, the mpg of the heavy-duty truck fleet is projected to reach 6.0 in 2010 and 6.9 by 2030, an improvement of 0.6 percent per year (Figure 4-5).
The AEO 2010 projections do not assume that significant state or federal policies are put into effect to increase truck energy efficiency between 2010 and 2030. The 0.6 percent annual improvement in vehicle mpg is expected to occur largely as a result of industry efforts to save on
table 4-5 Scenario Projections of Truck Freight, VMT, and Ton-Miles, 2010–2030
Local Intrastate Interstate Hauls Hauls Hauls Total
Tons
Number, 2010 (billions) 4.7 5.5 3.0 13.2
Share, 2010 (%) 36 42 22 100
Number, 2030 (billions) 6.9 7.9 5.0 19.7
Share, 2030 (%) 35 40 25 100
Annual growth rate, 2010–2030 (%) 1.9 1.8 2.6 2.0
VMT
Number, 2010 (billions) 39.3 92.1 105.7 237.1
Share, 2010 (%) 17 39 45 100
Number, 2030 (billions) 57.2 131.5 177.2 365.9
Share, 2030 (%) 16 36 48 100
Annual growth rate, 2010–2030 (%) 1.9 1.8 2.6 2.2
Ton-Miles
Number, 2010 (billions) 118 553 1,480 2,151
Share, 2010 (%) 5 26 69 100
Number, 2030 (billions) 172 789 2,480 3,441
Share, 2030 (%) 5 23 72 100
Annual growth rate, 2010–2030 (%) 1.9 1.8 2.6 2.4
10 http://cta.ornl.gov/data/chapter5.shtml.11 Miles per gallon figures in this section assume the fuel is diesel fuel.

Factors Driving Modal Energy Use and Emissions 115
table 4-6 Allocation of Projected VMT by Single-Unit and Combination Trucks, 2010–2030
2010 2030
Shareof Shareof Annual VMT TotalVMT VMT TotalVMT Growth (billions) (%) (billions) (%) Rate(%)
Local hauls (85% single unit, 39.3 17 57.2 16 1.9 15% combination)
Single unit 33.5 14 48.6 13
Combination 5.8 2 8.6 2
Intrastate hauls (50% single unit, 92.1 39 131.5 36 1.8 50% combination)
Single unit 46.1 19 65.7 18
Combination 46.1 19 65.7 18
Interstate hauls (15% single unit, 105.7 45 177.2 48 2.6 85% combination)
Single unit 5.3 2 8.8 2
Combination 100.4 42 168.3 46
Total 237.1 100 365.9 100 2.2
Single unit 84.8 36 123.3 34 1.9
Combination 152.4 64 242.7 66 2.4
012345678910
0
50
100
150
200
250
300
350
Mile
s pe
r Gal
lon
VM
T (b
illio
ns)
Medium-sized truck VMT Heavy-sized truck VMT
Medium-sized truck averagemiles per gallon
Heavy-sized truck averagemiles per gallon
2006 2008 2010 2012 2014 2016 2018 2020 2022 2024 2026 2028 2030
figure 4-5
Freight truck VMT and fuel economy forecasts, 2006–2030 (AEO 2010).

116 Policy Options for Reducing Energy Use and Greenhouse Gas Emissions from U.S. Transportation
fuel by way of changes in technology and operations. Although federal legislation (the Energy Independence and Security Act of 2007) now requires the setting of fuel economy standards for medium and heavy trucks, how these standards will be designed to affect vehicle efficiency levels remained unclear as the analyses for this chapter were being undertaken.
The AEO assumption that the trucking industry, acting largely in its self-interest, will continue to pursue improvements in energy performance is based on the importance of diesel fuel costs to motor carrier operations and profitability. Figure 4-6 shows the major operating expenses from 2006 for the “truckload” segment of the trucking industry. The truck-load segment consists of many trucking companies who haul freight over long distances. During 2006, diesel fuel prices were starting to rise, but they were still lower than they are today. Even then, diesel fuel purchases were the second-largest operating expense for these trucking companies, accounting for about one-quarter of truckload carrier operating expenses. Managing these costs, therefore, is crucial to the ability of the carriers to remain competitive with one another and with other transportation modes such as freight rail.
Tax and license4%
Communications1%
Labor44%
Fuel24%
Insurance6%
Maintenance10%
Depreciation11%
figure 4-6
Truckload carrier operating expenses, 2006.
Source: Global Insight, Inc.

Factors Driving Modal Energy Use and Emissions 117
The progress that will be made by the trucking industry in controlling fuel expenditures over the next two decades will almost certainly be driven by real and anticipated trends in the price of diesel fuel. Thus, some plausible scenarios for achieving energy savings in the trucking industry are considered below.
Opportunities to Increase the Energy Efficiency of New TrucksTable 4-7 shows a number of opportunities for changes in truck technologies and designs to increase the energy efficiency of the new combination trucks
table 4-7 Opportunities for Fuel-Saving Technology and Design Changes in New Combination Trucks, 2010–2030
MilesperGallon Improvement ResultingMilesper Relativeto2010 2030 GallonChangein Trucks(averaging Penetration NewTrucksfromAreaofOpportunity 5.5mpg)(%) (%) 2010to2030(%)
Diesel combustion efficiency 3 85 2.6
Waste heat recovery 3 75 2.3
Oxides of nitrogen after-treatment 2 80 1.6
Additional engine friction reduction 2 90 1.8
Engine auxiliaries (water/oil pump) 2 75 1.5
Transmission and driveline 1 80 0.8 efficiency
Power train integration 5 75 3.8
Cooling optimization 1 50 0.5
Improvements to other auxiliaries 2 75 1.5
Additional aerodynamic 3 80 2.4 improvements
Weight reduction 1 75 0.8
Mild long-haul electric hybrid 2 50 1.0
Full electric hybrid 30 5 1.5
Truck designs better optimized for 25 5 1.3 cargo and capacity needs
New truck fuel economy (starting at 6.75 mpg (up 23% 5.5 mpg for 2010 trucks) from 5.5 mpg)
Average annual improvement 1.1

118 Policy Options for Reducing Energy Use and Greenhouse Gas Emissions from U.S. Transportation
entering the fleet each year over the next two decades. These fuel-saving opportunities—which were first identified by the committee and then verified against the technologies examined in recent National Research Council reports (NRC 2010a; NRC 2010b)—range from improving diesel combustion and driveline efficiency to the use of electric hybrid systems and aerodynamic designs. In each case, the committee estimated how deeply the change in technology or design could penetrate the combina-tion truck fleet to increase the average mpg of new trucks. The estimates recognize that different technologies are likely to have different levels of applicability to individual segments of the combination truck fleet. For example, trucks that are used mainly for long-distance travel are less likely to benefit from full hybridization than are combination trucks used locally in urban (stop-and-go) traffic conditions. On the other hand, the former trucks are more likely to benefit from improvements in vehicle aerodynamics and advances in auxiliary power units that can reduce engine idling in sleeper mode.
The many fuel-saving design and technology opportunities shown in Table 4-7 suggest the potential for significant improvements in the energy efficiency of new combination trucks that enter the fleet from 2010 to 2030. On the basis of the assumption that trucks entering the fleet in 2010 averaged 5.5 mpg, the scenario in Table 4-7 suggests that exploiting these technology and design changes could lead to new trucks averaging 6.75 mpg by 2030, an average increase of 1.1 percent per year.
Table 4-8 identifies a similar list of opportunities for technology and design changes to increase fuel economy in the single-unit fleet, again checked against opportunities examined in the other National Research Council reports. The fuel-saving opportunities differ somewhat from those identified for combination trucks because of differences in how the two kinds of trucks are used. Hybrid electric technology, in particular, represents a major fuel-saving opportunity for single-unit trucks operat-ing mainly in urban environments. This technology, therefore, contributes significantly to the faster improvements in mpg estimated for single-unit trucks relative to combination trucks.
Overall, the estimates of market penetration and impact on fuel econ-omy in the scenario in Table 4-8 imply a plausible rate of mpg improvement of 1.4 percent per year. On the basis of the assumption that single-unit

Factors Driving Modal Energy Use and Emissions 119
table 4-8 Opportunities for Fuel-Saving Technology and Design Changes in New Single-Unit Trucks, 2010–2030
Milesper GallonImprovement MaximumPenetration ResultingMilesper Relativeto2010 (increaseamong GallonChangein Trucks(averaging newtrucksrelative NewTrucksfromAreaofOpportunity 8.5mpg)(%) to2010trucks)(%) 2010to2030(%)
Fuel combustion 3 60 1.8 efficiency
Waste heat recovery 3 20 0.6
Oxides of nitrogen 2 70 1.4 after-treatment
Additional engine 2 50 1.0 friction reduction
Engine auxiliaries 2 75 1.5 (water/oil pump)
Transmission and 1 60 0.6 driveline efficiency
Power train integration 5 50 2.5
Cooling optimization 1 20 0.2
Improvements in other 2 25 0.5 auxiliaries
Additional aerodynamic 3 10 0.3 improvements
Weight reduction 1 50 0.5
Full hybrid 30 40 12.0
Trucks designed to 25 40 10.0 optimize cargo and capacity
New truck fuel economy 11.3 mpg (up 33% (starting at 8.5 mpg) from 8.5 mpg)
Average annual 1.4 improvement
trucks averaged 8.5 mpg in 2010, a 1.4 percent annual rate of increase would result in an average of 11.3 mpg by 2030.
Implications for Fleetwide Fuel EfficiencyThe extent to which the improvements in new truck energy performance estimated above would translate into fleetwide mpg increases would

120 Policy Options for Reducing Energy Use and Greenhouse Gas Emissions from U.S. Transportation
depend on how fast the newer fuel-efficient trucks enter the fleet. Fleet turnover tends to occur at a slower pace for single-unit trucks than for combination trucks, primarily because of the much higher annual mileage accrued by the latter. Figure 4-7 shows the differences in age distribution of combination and single-unit trucks relative to their VMT. Because combination trucks require a high level of reliability for long-haul service, they are replaced by newer trucks when they reach high mileage (which can occur within 4 or 5 years). The fleetwide effects of increasing new-truck fuel economy will therefore occur more rapidly for combination trucks than for single-unit trucks, which average more years in service. Applying the age distributions in Figure 4-7 to the estimates above for annual increases in new truck mpg leads to an average mpg growth of 1 percent per year for the entire single-unit fleet and 0.8 percent per year for the entire combination fleet.
Other Fuel-Saving Opportunities in Truck Operations and MaintenanceThe rate of increase in mpg per year for the truck fleet in the illustrative scenario given here, 0.8 to 1 percent per year, exceeds the 0.6 percent
0
5
10
15
20
25
Age of Truck (years)
Shar
e of
VM
T (w
ithi
n ea
ch tr
uck
fleet
)(%
)
Combination fleetSingle-unit fleet
<1 1 2 3 4 5 6 7 8 9 10 11 12 13 14 15 16 17 18 19
figure 4-7
VMT distribution of trucks by age.
Source: 2002 Vehicle Inventory and Use Survey.

Factors Driving Modal Energy Use and Emissions 121
annual improvement in AEO 2010. The reason for the difference is that the scenario given here assumes that a wider array of opportunities for new technologies and design changes are all successfully exploited. In addition to these technological opportunities, there are opportunities for saving fuel through changes in truck operations and maintenance practices. A number of such opportunities are shown in Table 4-9. They include reducing the incidence of engine idling, limiting operations at higher travel speeds, more direct routing of shipments, and improving trailer aero-dynamics and overall maintenance.
Some of the opportunities shown in Table 4-9 are already being exploited by large motor carriers that have invested in sophisticated fleet energy management systems. More widespread utilization will likely occur during the next 20 years if diesel fuel prices continue to be a significant operating expense. Combination trucks would be the primary candi-dates for more aggressive energy-saving improvements in operations and maintenance, but comparable opportunities may exist for carriers who operate single-unit fleets. Table 4-9 suggests that fleet mpg can be increased by 0.9 and 0.4 percent per year for the combination and single-unit fleets, respectively.
Total Increase in Trucking Fuel EfficiencyUnless the price of diesel fuel increases substantially, the expectation that all of the fuel-saving opportunities identified in the scenarios developed here will be exploited to their full potential over the next two decades may be optimistic. If they are exploited, however, the trucking industry would experience an increase in mpg on the order of 1.7 and 1.4 percent per year for the combination and single-unit fleets, respectively (see Figure 4-8). The result would be an increase from 5.5 to 7.8 mpg (41 percent) for the combination fleet and 8.5 to 11.3 mpg (33 percent) for the single-unit fleet.
trends in trucking energy use and ghg emissionsThe truck travel scenario in Table 4-6 assumes that VMT will increase by an average of 1.9 percent per year for single-unit trucks and 2.4 percent per year for combination trucks from 2010 to 2030. Additional scenarios assume that the average mpg of the single-unit and combination fleets will increase 1.4 percent and 1.7 percent per year, respectively. Combining

122 Policy Options for Reducing Energy Use and Greenhouse Gas Emissions from U.S. Transportation
table 4-9 Opportunities for Saving Fuel Through Changes in Truck Operations and Maintenance, 2010–2030
MaximumPenetration Fleetwide (increasewithin ResultingChangeOperationsandMaintenance Improvementin fleetrelativeto inFleetMilesPractice MilesperGallon(%) 2010fleet)(%) perGallon(%)
Combination Trucks
Lower rolling resistance 3 60 1.8 replacement tires
Trailer gap controls/ 2 20 0.4 vortex stabilizer
Smart navigation 2 70 1.4
Driver training 4 50 2.0
Idle reduction or 6 75 4.5 elimination
Road maximum speed 10 60 6.0 reduced about 7 mph (from assumed 65 mph)
Trailer maintenance and 7 50 3.5 system compatibility with respect to tires, weight, aerodynamics (e.g., adding skirting and changes in trailer design)
Total fleet improvement 19.6 in miles per gallon
Average annual 0.9 improvement
Single-Unit Trucks
Lower rolling resistance 3 75 2.3 tires
Smart navigation 2 25 0.5
Driver training 4 50 2.0
Idle reduction or 6 10 0.6 elimination
Road maximum speed 10 25 2.5 reduced about 7 mph (from 65 mph)
Total improvement in 7.9 miles per gallon
Average annual 0.4 improvement

Factors Driving Modal Energy Use and Emissions 123
these VMT and mpg projections implies that total fuel consumption from 2010 to 2030 will increase by 9 percent for the single-unit fleet and 12 percent for the combination-vehicle fleet. The trucking industry as a whole would experience an 11 percent increase in fuel consumption from 2010 to 2030 (Figure 4-9).
If diesel remains the dominant fuel for trucking over this period, the effects on GHG emissions can be calculated by assuming the emission of 22 pounds of CO2 from the burning of each gallon of diesel fuel. Accord-ingly, CO2 emissions would increase at the same rate as the projected
figure 4-8
Projected growth (miles per gallon) for new trucks and the overall fleet of single-unit and combination trucks, 2010–2030.
4.00
5.00
6.00
7.00
8.00
9.00
10.00
11.00
12.00
20102011
20122013
20142015
20162017
20182019
20202021
20222023
20242025
20262027
20282029
2030
Mile
s pe
r Gal
lon
Combination fleet miles per gallon without operations improvements (0.8% per year)
Single-unit fleet miles per gallon without operations improvements (1% per year)
Miles per gallon of new combination trucks (1.1% per year)
Miles per gallon of new single-unit trucks (1.4% per year)
Total miles per gallon of combination fleet (1.7% per year)
Total miles per gallon of single-unit fleet (1.4% per year)
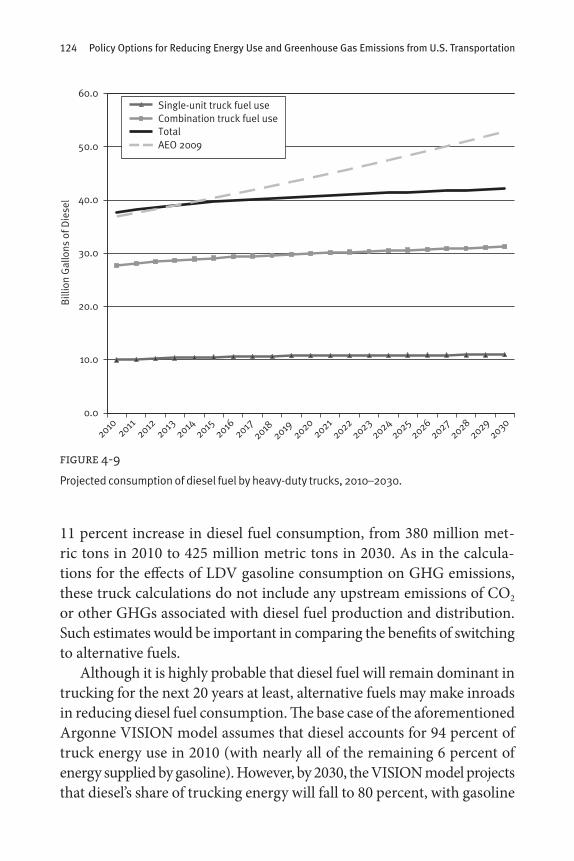
124 Policy Options for Reducing Energy Use and Greenhouse Gas Emissions from U.S. Transportation
11 percent increase in diesel fuel consumption, from 380 million met-ric tons in 2010 to 425 million metric tons in 2030. As in the calcula-tions for the effects of LDV gasoline consumption on GHG emissions, these truck calculations do not include any upstream emissions of CO2 or other GHGs associated with diesel fuel production and distribution. Such estimates would be important in comparing the benefits of switching to alternative fuels.
Although it is highly probable that diesel fuel will remain dominant in trucking for the next 20 years at least, alternative fuels may make inroads in reducing diesel fuel consumption. The base case of the aforementioned Argonne VISION model assumes that diesel accounts for 94 percent of truck energy use in 2010 (with nearly all of the remaining 6 percent of energy supplied by gasoline). However, by 2030, the VISION model projects that diesel’s share of trucking energy will fall to 80 percent, with gasoline
0.0
10.0
20.0
30.0
40.0
50.0
60.0
Bill
ion
Gal
lons
of D
iese
l
Single-unit truck fuel useCombination truck fuel useTotal AEO 2009
20102011
20122013
20142015
20162017
2018
2019
20202021
20222023
20242025
20262027
20282029
2030
figure 4-9
Projected consumption of diesel fuel by heavy-duty trucks, 2010–2030.

Factors Driving Modal Energy Use and Emissions 125
continuing to account for about 5 percent. Biodiesel and synthetic diesels are projected to account for 15 percent (2 and 13 percent, respectively). Whether these alternative fuels result in increased or decreased life-cycle emissions of GHGs will be an important question.
Air Passenger Transportation
Commercial airlines provide both passenger and cargo transportation service, with the former accounting for about 90 percent of aircraft miles and fuel consumption. The demand for air passenger service is positively correlated with income: wealthier individuals, who have greater mobility demands in general, seek out faster modes of transportation and are willing and able to pay for more expensive air travel. Increasing affluence and economic development globally are expected to contribute to growing demand for air passenger service, both domestically and internationally.
Nearly all passenger airplanes use turbine engines powered by jet fuel. Most of the fuel is burned while at cruise, followed by the takeoff, taxi, and landing phases of the flight. The percentage burned in each phase depends on the design and weight of the aircraft and its engines, the distance traveled, and the manner in which the aircraft is operated. In addition, parked aircraft operate auxiliary power units that consume energy and emit CO2 to varying degrees, depending on how the units are powered. At the airport, the vehicles and equipment that service aircraft contribute to the transportation sector’s emission of GHGs, mainly from the production of CO2 from the use of gasoline and diesel fuel. Energy use and emissions from these service vehicles are not well documented, and some of their fuel use may be included in energy figures for motor vehicles.12 The energy used by other airport vehicles, such as shuttle buses, is included in the totals for motor vehicles.
In contrast to other modes, a large portion of emissions occurs at altitude: in the lower troposphere during aircraft ascent and descent and in the upper troposphere and lower stratosphere during cruise. Whereas
12 The Transportation Research Board’s Airport Cooperative Research Program has completed a Guidebook on Preparing Airport Greenhouse Gas Emissions Inventories (Kim et al. 2009), which is intended to help in conducting inventories and thus may clarify airport ground emissions. http://onlinepubs.trb.org/onlinepubs/acrp/acrp_rpt_011.pdf.

126 Policy Options for Reducing Energy Use and Greenhouse Gas Emissions from U.S. Transportation
altitude is not particularly relevant for CO2 emissions, it can be important for other substances, including water vapor, aerosols, oxides of nitrogen, black carbon, and sulfur oxides. When these substances are released at higher altitudes, they can cause changes in atmospheric chemistry and in physical processes (such as contrail and cloud formation) that enhance radiative forcing. Unlike CO2, emissions of these substances, and the physical and chemical effects that ensue, are influenced by factors other than total fuel consumption. Their impacts can vary considerably depending on where in the atmosphere the fuel is burned, atmospheric conditions, the efficiency of combustion, and numerous other factors. As a result, it has proved difficult to translate emissions from aviation fuel consumption into CO2–equivalent values that are normalized for global warming potential.
In the case of passenger air service, the following are key factors that influence trends in energy use and CO2 emissions:
• Passengerdemand,• Flightdistances,•Aircraftsizeandcapacityutilization(e.g.,loadfactors),•Aircraftenergyefficiencycharacteristics(e.g.,weight,aerodynamics,
engine efficiency), and•Operationalenvironment.
Higher passenger demand will generally lead to more flights and thus more fuel consumption. Higher passenger demand, however, can also increase aircraft load factors (occupancy rates), leading to a reduction in energy consumed per passenger mile. Increased demand can also lead to the use of larger aircraft, which usually consume less energy per passenger mile than smaller aircraft when they maintain high occupancy. Because the taxi, takeoff, and climb phases of flight are the most fuel-intensive, shorter flights tend to consume more fuel per passenger mile than longer flights involving longer distances in cruise.13 Finally, newer aircraft tend to be more energy efficient than older aircraft because of technology improve-
13 This relationship, in which larger aircraft and longer flight distances lead to reduced fuel consump-tion per passenger mile, can weaken for large aircraft flying very long distances because these trips will require more fuel storage that adds weight and leads to more fuel burn.

Factors Driving Modal Energy Use and Emissions 127
ments. Thus, trends in any of these key factors—such as shorter or longer flight lengths, the use of larger or smaller aircraft, changes in takeoff and landing procedures and cruise speeds, and the more rapid development and diffusion of newer aircraft into the fleet—can have major implications for fuel consumption and CO2 emissions from air transportation. Trends in the system-level CO2 impacts of fuel, including the increased avail-ability and use of alternatives with lower life-cycle emissions per unit of energy, are another factor (Kar et al. 2010).
Each year the Federal Aviation Administration (FAA) publishes long-range forecasts for aviation demand, typically covering a 15- to 20-year period.14 Included in the forecasts are projections of average aircraft load factors, flight distances, seating capacity, and fuel consumption. The forecasts, which make various assumptions about economic growth and structural changes in the aviation industry, provide a reasonable basis for projecting modal energy use and CO2 emissions.
faa traffic and fuel use forecastsFAA projects that total passenger enplanements on domestic airlines will increase by 2.7 percent per year from 2010 to 2025 (Table 4-10).15 The total miles traveled by the enplaned passengers are forecast to increase at an even faster rate of 3.4 percent per year, owing largely to an expected increase in the average trip length. Even with these assumptions of growth in travel, passenger airline fuel consumption is projected to grow by only 1.9 percent per year from 2010 to 2025, implying a reduction of 1 to 2 percent per year in the average amount of energy consumed per passenger mile. According to Lee et al. (2001), energy-efficiency improvements of this magnitude are consistent with historical precedent and with other estimates that consider the prospects of increases in energy efficiency of new aircraft and changes in operational procedures, such as more direct routing. These researchers estimate 1.2 to 2.2 percent annual improve-ments in energy efficiency over the next two decades. They discuss the potential for new technologies, materials, and practices to achieve higher engine efficiencies (e.g., through higher temperatures and pressures),
14 http://www.faa.gov/data_statistics/aviation/aerospace_forecasts/2008-2025/.15 https://www.faa.gov/data_research/aviation/aerospace_forecasts/2009-2025/media/2009%20Forecast %20Doc.pdf.
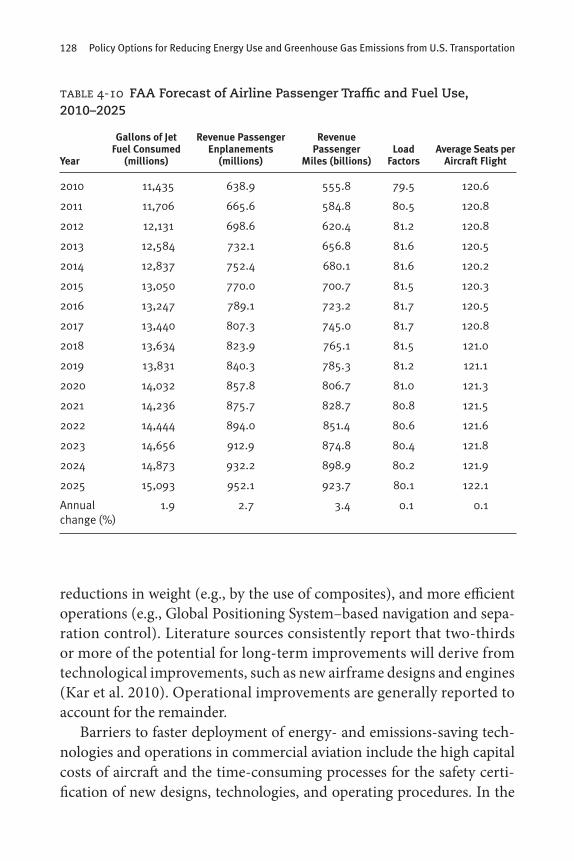
128 Policy Options for Reducing Energy Use and Greenhouse Gas Emissions from U.S. Transportation
table 4-10 FAA Forecast of Airline Passenger Traffic and Fuel Use, 2010–2025
GallonsofJet RevenuePassenger Revenue FuelConsumed Enplanements Passenger Load AverageSeatsperYear (millions) (millions) Miles(billions) Factors AircraftFlight
2010 11,435 638.9 555.8 79.5 120.6
2011 11,706 665.6 584.8 80.5 120.8
2012 12,131 698.6 620.4 81.2 120.8
2013 12,584 732.1 656.8 81.6 120.5
2014 12,837 752.4 680.1 81.6 120.2
2015 13,050 770.0 700.7 81.5 120.3
2016 13,247 789.1 723.2 81.7 120.5
2017 13,440 807.3 745.0 81.7 120.8
2018 13,634 823.9 765.1 81.5 121.0
2019 13,831 840.3 785.3 81.2 121.1
2020 14,032 857.8 806.7 81.0 121.3
2021 14,236 875.7 828.7 80.8 121.5
2022 14,444 894.0 851.4 80.6 121.6
2023 14,656 912.9 874.8 80.4 121.8
2024 14,873 932.2 898.9 80.2 121.9
2025 15,093 952.1 923.7 80.1 122.1
Annual 1.9 2.7 3.4 0.1 0.1 change (%)
reductions in weight (e.g., by the use of composites), and more efficient operations (e.g., Global Positioning System–based navigation and sepa-ration control). Literature sources consistently report that two-thirds or more of the potential for long-term improvements will derive from technological improvements, such as new airframe designs and engines (Kar et al. 2010). Operational improvements are generally reported to account for the remainder.
Barriers to faster deployment of energy- and emissions-saving tech-nologies and operations in commercial aviation include the high capital costs of aircraft and the time-consuming processes for the safety certi-fication of new designs, technologies, and operating procedures. In the

Factors Driving Modal Energy Use and Emissions 129
case of low-GHG fuels for aviation, these barriers are especially high, and they are accompanied by the limited availability of suitable energy-intensive fuels (Kar et al. 2010).
projections of energy use and ghg emissionsFAA forecasts that fuel use by air passenger transportation will increase from 11.4 billion gallons in 2010 to 15.1 billion gallons in 2025, an annual growth rate of 1.9 percent. One gallon of jet fuel emits about 21.1 pounds of CO2. Thus, extrapolating the FAA energy projections for an additional 5 years implies that jet fuel use will reach 16.6 billion gallons by 2030 and that CO2 emissions will reach 159 million metric tons.
Other Modes
The modes of transportation not covered above contribute less than 5 percent of the sector’s energy use and CO2 emissions. The relatively small contribution results from a combination of higher energy effi-ciency and lower traffic activity. Thus, focusing on these modes to achieve reductions in total transportation energy use and emissions will provide marginal gains at best. Collectively, for example, the nation’s public transit systems—buses and rail—account for less than 1 percent of passenger miles and less than 1 percent of transport energy use and GHG emissions. Freight railroads account for a large share of long-haul freight traffic (about 38 percent of ton-miles), but they already operate with a level of energy efficiency, especially compared with trucks. Rail freight averages more than 400 ton-miles per gallon of diesel, compared with about 70 ton-miles per gallon for combination trucks. As noted in Chapter 2, railroads are striving to raise this figure over the next decade. However, the total energy and emissions saved would be minimal in light of the mode’s already low energy demand.
Summary Assessment
Figure 4-10 shows the various projections in this chapter for energy-related CO2 emissions by cars, trucks, and passenger airlines. In addition, trends for other modes (which already contribute little to sector energy

130 Policy Options for Reducing Energy Use and Greenhouse Gas Emissions from U.S. Transportation
use and emissions) are shown under the simplifying assumptions that they will grow at historical rates and maintain existing levels of energy efficiency. Currently, passenger cars and light trucks (LDVs) account for about two-thirds of transportation energy use and emissions. Largely because of increases in vehicle efficiency standards, these vehicles are projected to account for about 57 percent of energy use and emissions in 2030. Heavy trucks, which contribute about 22 percent of the sector’s energy use and emissions, are projected to account for the same share in 2030. Finally, passenger airlines are projected to increase their share from 6 to 8 percent.
The factors considered in projecting these trends suggest where opportunities may lie for reducing transportation energy use and emis-sions over the next two to three decades. For cars and light trucks, these opportunities are likely to include
• Furtherincreasingtheenergyefficiencyofvehiclesintroducedafter2020 in an attempt to exceed the goal of 35 miles per gallon required in current legislation;
0
250
500
750
1,000
1,250
1,500
1,750
2,000
2,250
Mill
ions
of M
etri
c To
ns o
f CO
2
General aviation(gasoline)Motorcoach(diesel)Transit busand van (diesel) Business aviation(jet fuel)Domesticwater (diesel)Air cargo(jet fuel) Rail freight(diesel)Single-unittruck (diesel)Air passenger(jet fuel)Combinationtruck (diesel)LDV (gasoline)
20102011
20122013
20142015
20162017
20182019
20202021
20222023
20242025
20262027
20282029
2030
figure 4-10
Reference projections of CO2 emissions from the U.S. transportation sector.

Factors Driving Modal Energy Use and Emissions 131
•Moderatingtherateofgrowthinprivate-vehicleusebyhouseholds,particularly for the fastest-growing reasons for personal trip making, such as discretionary trips for shopping and services; and
•Diversifyingthefuelsupplytoreducedependenceongasolineandtofavor energy sources whose production and consumption both result in lower emissions of GHGs.
For freight-carrying trucks, the opportunities are likely to include
•Acceleratingthedevelopmentandintroductionoffuel-savingtruckdesigns and technologies,
• Encouraging thewidespread adoption by fleet operators ofmoreenergy-efficient operations and maintenance practices, and
•Diversifyingthefuelsupplytoreducedieselconsumptionandtofavorenergy sources whose production and consumption both result in lower emissions of GHGs.
For passenger airlines, the opportunities are likely to include
•Acceleratingfleetturnovertohastenearlyentryofnext-generationaircraft that are more efficient in using energy and produce fewer emissions and
• Enablingmoreefficientairlineroutingandoperationsthroughtheuseof improved air traffic management procedures and systems.
Policy approaches that seek to exploit these and other opportunities are considered in Chapter 5.
References
abbreviationsFHWA Federal Highway Administration
NRC National Research Council
Basso, L. J., and T. H. Oum. 2007. Automobile Fuel Demand: A Critical Assessment of Empirical Methodologies. Transport Reviews, Vol. 27, No. 4, pp. 449–484.
FHWA. 2007. Highway Statistics 2006. U.S. Department of Transportation, Washington, D.C.

132 Policy Options for Reducing Energy Use and Greenhouse Gas Emissions from U.S. Transportation
Frondel, M. 2004. Empirical Assessment of Energy-Price Policies: The Case for Cross-Price Elasticities. Energy Policy, Vol. 32, No. 8, pp. 989–1000.
Graham, D., and S. Glaister. 2002. Review of Income and Price Elasticities of Demand for Road Traffic. Working paper. Center for Transport Studies, Imperial College of Science, Technology, and Medicine, London.
Hu, P. S., and T. R. Reuscher. 2004. Summary of Travel Trends: 2001 National Household Travel Survey. Prepared for the U.S. Department of Transportation and Federal Highway Administration. http://nhts.ornl.gov/2001/pub/STT.pdf.
Hughes, J. E., C. R. Knittel, and D. Sperling. 2006. Evidence of a Shift in the Short-Run Price Elasticity of Gasoline Demand. National Bureau of Economic Research Working Paper W12530. http://ssrn.com/abstract=931375.
Kar, R., P. A. Bonnefoy, and R. J. Hansman. 2010. Dynamics of Implementation of Mitigating Measures to Reduce CO2 Emissions from Commercial Aviation. Report ICAT-2010-01. International Center for Air Transportation, Massachusetts Institute of Technology, Cambridge, June. http://dspace.mit.edu/bitstream/ handle/1721.1/56268/Kar_et_al_ICAT_Report.pdf?sequence=1.
Kim, B., I. A. Waitz, M. Vigilante, and R. Bassarab. 2009. ACRP Report 11: Guidebook on Preparing Airport Greenhouse Gas Emissions Inventories. Transportation Research Board of the National Academies, Washington, D.C.
Lee, J. J., S. P. Lukachko, I. A. Waitz, and A. Schäfer. 2001. Historical and Future Trends in Aircraft Performance, Cost, and Emissions. Annual Review of Energy and the Environment, Vol. 26, pp. 167–200.
NRC. 2010a. Real Prospects for Energy Efficiency in the United States. National Academies Press, Washington, D.C.
NRC. 2010b. Technologies and Approaches to Reducing the Fuel Consumption of Medium- and Heavy-Duty Vehicles. National Academies Press, Washington, D.C.
Schipper, L., and M. Grubb. 2000. On the Rebound? Feedback Between Energy Intensities and Energy Uses in IEA Countries. Energy Policy, Vol. 28, pp. 367–388.
Small, K. A., and K. Van Dender. 2007. Fuel Efficiency and Motor Vehicle Travel: The Declining Rebound Effect. Energy Journal, Vol. 28, No. 1, pp. 25–51.
Yi, Z., K. C. Land, Z. Wang, and D. Gu. 2006. U.S. Family Household Momentum and Dynamics: An Extension and Application of the ProFamy Method. Population Research and Policy Review, Vol. 25, No. 1, pp. 1–41.

133
There is a scientific consensus that deep cuts in emissions of carbon diox-ide (CO2) and other greenhouse gases (GHGs) will be needed over the next half century to limit the risks of global climate change. However, science cannot advise on how much or how quickly emissions should be reduced in any specific country or in any individual sector of the econ-omy. Where and how emissions should be reduced are choices that will need to involve many nonscientific considerations, such as the effects of alternative mitigation strategies on equity and the economy, as well as pragmatic aspects of policy implementation. The scientific consensus suggests that deferring these policy actions and allowing emissions to continue to rise unabated will increase the challenge of stabilizing atmo-spheric concentrations of GHGs at less risky levels.
Transportation Policies in the National Context
From the standpoint of national policy, a carbon pricing system is widely viewed as having the potential to affect emissions in the broadest and most economically efficient manner. Pricing emissions of CO2 and other GHGs, whether through the adoption of a national cap-and-trade pro-gram, a carbon tax, or a hybrid approach, would increase the cost of using all carbon-rich energy sources across all sectors of the economy. The higher prices, however, would affect individual sectors differently. [A Congressional Budget Office report provides a comparison of carbon
Policy Options to Reduce Transportation’s Energy Use and Greenhouse Gas Emissions
5

134 Policy Options for Reducing Energy Use and Greenhouse Gas Emissions from U.S. Transportation
pricing options (CBO 2008).] In the transportation sector, the higher-priced gasoline, diesel fuel, and jet fuel would prompt greater interest in vehicles that are designed and operated to be more efficient, fuels having lower carbon-cycle impacts, and less energy- and emissions-intensive transportation modes. Similar responses would occur in other sectors, but to varying degrees depending largely on the cost and options for sub-stituting lower-carbon energy sources.
Various economic models are used to predict the carbon prices needed to achieve different emissions reductions across the economy over time. All of the models, which estimate the costs associated with reducing emis-sions in each sector, assume that the least costly means of cutting emis-sions are pursued first. Figure 5-1 shows the modeled emissions prices (stated in terms of constant dollars per CO2-equivalent metric ton)1 that would be required to achieve CO2-eq emissions trajectories leading to a 50 to 80 percent reduction in U.S. annual emissions by 2050. The estimated prices are calculated by the Stanford University Energy Modeling Forum (EMF-22) on the basis of runs from several economic models, each using different assumptions about the costs associated with developing and deploying emissions-reducing technologies (Fawcett et al. 2009). Accord-ing to these models, prices starting at $25 to $75/CO2-eq t and rising to $225 to $500/CO2-eq t would be required to achieve an 80 percent reduc-tion in emissions by 2050. Even to achieve a 50 percent reduction, carbon prices would need to reach $100 to $300/CO2-eq t by 2050.
Table 5-1 shows how a $50 carbon price would affect the retail price of various fossil fuels used in the national economy today. Crude oil prices would go up about 40 percent compared with August 2010 levels,2 caus-ing gasoline prices to increase by about $0.50 per gallon, which is 15 to 20 percent higher than August 2010 gasoline prices. In effect, each $1/CO2-eq t increase in price would cause crude oil prices to increase by about $0.43 per barrel and retail gasoline prices to increase by about $0.01 per gallon. In comparison, a $50/CO2-eq t price would bring about a 140 percent increase for the electric power sector in the cost per ton
1 Carbon prices are stated throughout this chapter in terms of dollars per CO2-equivalent metric ton ($/CO2-eq t). See Chapter 1 (page 30) for a definition of CO2-equivalent.2 Commodity prices fluctuate; hence, the figures quoted in this section are illustrative only.

0
50
100
150
200
250
300
350
400
450
500
2020 2025 2030 2035
(a)
(b)
2040 2045 2050
$/C
O2-
eq t
(200
5 U
.S. $
) $
/CO
2-eq
t (2
005
U.S
. $)
0
50
100
150
200
250
300
350
400
450
500
2020 2025 2030 2035 2040 2045 2050
ADAGE
MRN-NEEM
EPPA
IGEM
MERGE (opt)
MiniCAM (base)
ADAGE
MRN-NEEM
EPPA
IGEM
MERGE (opt)
MiniCAM (base)
figure 5-1
Emissions prices ($/CO2-eq t) required to achieve annual emissions trajectories leading to an (a) 80 percent and (b) 50 percent annual emissions reduction by 2050, according to various climate change economic models studied by the Stanford Energy Modeling Forum. The 80 percent and 50 percent pathways are representative of cumulative emis-sions budgets of 167 Gt CO2-eq and 203 Gt CO2-eq budgets for the period 2010 to 2050.
Source: Fawcett et al. 2009.

136 Policy Options for Reducing Energy Use and Greenhouse Gas Emissions from U.S. Transportation
of coal, which is currently a relatively inexpensive hydrocarbon, but one that is carbon-intensive.
Table 5-2 summarizes EMF-22 model runs that estimate the emissions response from transportation that would be needed to bring about 50 to 80 percent emissions reductions by 2050. The models produce varying estimates of transportation’s contribution, but all consistently predict that transportation will contribute less to emissions reductions than most other energy-using sectors. The reason is that all of the models assume that other sectors have less costly means of responding to the higher-priced emissions by reducing energy use or substituting energy alternatives.
Runs of the U.S. Department of Energy’s National Energy Modeling System (NEMS) offer a more detailed picture of the anticipated trans-portation response to carbon emissions pricing. Table 5-3 shows NEMS-generated results from a recent study by Resources for the Future and the National Energy Policy Institute (RFF-NEPI) in which prices are assumed to reach $50/CO2-eq t by 2030. The $50 price was selected for analytical purposes only, but it is consistent with the price that the EMF-22 model runs indicate would be needed in the near term to put the United States on a trajectory to reduce national emissions by half by midcentury. The RFF-NEPI study calculates that an emissions price of $50/CO2-eq t will cause gasoline prices to increase by about $0.35 per gallon, or by nearly
table 5-1 Estimated Effect of an Emissions Price of $50/CO2-eq t on Key Fuel Prices
MarketPricein AddedCost($)fromGHG Fuel August2010($) Contribution($50/CO2-eqt) TotalEnd-UserPrice($)
Crude oil 55.12/bbl 21.40/bbl 76.52 (up 39% over market price)
Gasoline 2.54/gal 0.44/gal 2.98/gal (up 17%) product
Utility coal 46.00/short ton 110.53/short ton 156.53/short ton (up 140%)
Note: According to the Energy Information Administration, utility coal in the United States averages about 207 lb of CO2 per million Btu. Gasoline and diesel fuel average 160 lb of CO2, and natural gas averages 117 lb of CO2 per million Btu. http://www.eia.doe.gov/cneaf/coal/quarterly/co2_article/co2.html.
Source: EIA August 2010 Monthly Energy Review (http://www.eia.doe.gov/mer/overview.html).

Policy Options 137
10 percent. This percentage increase is much smaller than the percentage increase in the price of coal. Accordingly, the RFF-NEPI modeling runs predict that CO2-eq emissions from the coal-intensive electric power sec-tor would fall by nearly 30 percent by 2030. In comparison, emissions from transportation are predicted to fall by less than 5 percent by 2030.
These model results portray the broader national context in which GHG reductions will need to occur. They indicate how reducing emis-sions in one sector will affect the amount of reductions that will be needed from other sectors. Accordingly, sector-specific policies, which seek emissions reductions from one sector at a time, may not be the most effective or economically efficient means of bringing about economywide emissions reductions.
Although this report acknowledges the importance of using carbon prices to create incentives for long-term and economywide reductions in GHG emissions, it is focused on examining other policies that can yield energy and emissions savings specifically from the transportation sector. There are many reasons for considering sector-based policies.
table 5-2 Emissions Changes Needed from Transportation Sector to Achieve Alternative U.S. Carbon Emissions Reduction Targets, According to Models Run in Stanford EMF-22 Study
Model’sEstimatedPercentageChange inAnnualTransportationEmissions,Model 2010–2050
80 Percent Reduction Target
ADAGE (RTI International) -33
EPPA (Massachusetts Institute of Technology) -6
MiniCAM (Joint Global Change Research Institute ) -22
MRN-NEEM (CRA International) -17
50 Percent Reduction Target
ADAGE 17
EPPA 28
MiniCAM -22
MRN-NEEM -11
Source: Fawcett et al. 2009.

tabl
e 5-
3 R
FF-N
EPI
Proj
ecti
ons
of U
.S. E
ner
gy C
onsu
mp
tion
an
d G
HG
Em
issi
ons
from
Maj
or E
con
omic
Sec
tors
A
ssu
min
g Em
issi
ons
Pric
ing
and
Com
par
ison
wit
h P
roje
ctio
ns
from
AEO
200
9 R
efer
ence
Cas
e
20
15
2020
20
25
2030
Perc
entC
hang
e
Perc
entC
hang
e
Perc
entC
hang
e
Perc
entC
hang
e
Am
ount
fr
omA
EO2
009
Am
ount
fr
omA
EO2
009
Am
ount
fr
omA
EO2
009
Am
ount
fr
omA
EO2
009
Ass
umed
CO
2-eq
pri
ce
16.3
3
23.3
4
33.3
5
47.6
5 (2
007$
per
CO
2-eq
t)
Real
gro
ss d
omes
tic
13.4
-0
.2
15.3
-0
.3
17.5
-0
.4
19.8
-0
.5
prod
uct (
trill
ions
200
7$)
Tota
l CO
2-eq
em
issi
ons
6,85
2 -5
6,
827
-8
6,83
3 -1
1 6,
750
-15
(mill
ions
of C
O2-
eq t)
El
ectr
icit
y 2,
158
-9
2,16
0 -1
2 2,
083
-18
1,87
5 -2
9
Tr
ansp
orta
tion
1,
910
-1
1,88
3 -1
1,
893
-3
1,93
9 -4
In
dust
rial
94
1 -1
92
9 -2
92
1 -4
87
9 -7
Prim
ary
Ener
gy C
onsu
mpt
ion
(qua
drill
ion
Btu
)
Pe
trol
eum
38
.4
0 38
.0
-1
38.3
-2
38
.8
-3
N
atur
al g
as
21.7
0
21.7
-2
22
.9
-4
22.2
-8
Co
al
21.1
-1
1 21
.2
-13
19.9
-1
9 18
.1
-29
N
ucle
ar
8.7
0 9.
4 3
10.6
15
12
.4
34
R e
new
able
s 10
.2
8 11
.7
13
13.2
17
15
.3
31
Source:
Kru
pnic
k et
al.
2010
.

Policy Options 139
One major reason is transportation’s near total dependence on oil, with its environmental and national security implications (as discussed else-where). In addition, there is no guarantee that a national carbon pricing program will be instituted soon, and thus sector-based interventions may be the next best means of achieving emissions savings over the near to medium term.
Transportation-Specific Policy Options
The remainder of this chapter considers the following six types and tar-gets of policy interventions that are candidates for reducing U.S. trans-portation’s use of petroleum and emissions of GHGs:
1. Transportation fuel taxes,2. Vehicle efficiency standards,3. Feebates and other financial incentives to motivate interest in efficiency,4. Low-carbon standards for transportation fuels,5. Measures to curb private vehicle use, and6. Measures targeted to the other main passenger and freight modes.
These six items encompass a mix of pricing and regulatory measures but by no means cover all possible policy tools and designs. For example, the many ways in which government tax incentives, subsidies, and sup-ply mandates can be used to promote the development and introduc-tion of specific types of vehicle and energy technologies such as electric cars, biofuels, and hydrogen are not considered. This report does not examine the advantages and disadvantages of furthering specific vehicle or energy technologies as a way to reduce transportation’s use of energy and emissions of GHGs. Policy approaches that are used to favor specific technological solutions, therefore, are not examined here. Similarly, the discussion does not consider the various means by which government can support technology R&D. A companion report (TRB 2009c) exam-ines R&D needs in this area. How government can support R&D is not a transportation-specific matter and has been examined in many other studies (for example, NRC 2001).

140 Policy Options for Reducing Energy Use and Greenhouse Gas Emissions from U.S. Transportation
Transportation Fuel Taxes
Fuel taxes are long-standing sources of government revenue for the construction, maintenance, and operation of the nation’s transportation infrastructure, particularly the highway system. These taxes, which vary by mode, are applied on a per gallon basis to gasoline, diesel fuel, jet fuel, and other refined petroleum products. As discussed in Chapter 3, the current federal tax on gasoline used by motor vehicles is $0.184 per gal-lon, and state gasoline and diesel taxes average about the same, leading to a combined tax of around $0.35 per gallon. The federal government and many states impose taxes on the fuels used by vessels operating on the inland waterways, railroads, domestic airlines, and commercial and general aviation. In some states, operators may also pay an ad valorem tax based on the retail price of the fuel, rather than (or in addition to) the more typical fixed levy per gallon.
A policy that increased the taxes on the fuels used in each transpor-tation mode or that imposed a broader-based tax on each barrel of oil sold would lead to higher-priced fuel, which would increase consumer demand for more efficient vehicles and operations. Depending on the size of the tax, it would also have a moderating effect on transportation demand while prompting interest in less energy-intensive modes.
projected effects of higher fuel taxes on transportation energy demandA number of studies have examined the potential effect of higher-priced fuel on transportation fuel consumption and GHG emissions. The afore-mentioned 2010 study by RFF-NEPI (Krupnick et al. 2010), which examined a range of policies for reducing GHG emissions and oil con-sumption, used a modified version of NEMS to assess various policy options and their effects on both oil consumption and CO2 emissions. The study’s examination of an oil tax assumes that a constant tax per unit of energy is applied across all refined oil. The tax is assumed to begin at a rate equivalent to adding $1.27 per gallon to the price of gasoline and then to increase by 1.5 percent per year, totaling $1.73 in taxes by 2030. As might be expected, this broader-based tax on oil was found to be far more effective in reducing total petroleum use and CO2 emissions (across all

Policy Options 141
modes and sectors) than a tax of equivalent size levied only on the gaso-line and diesel fuel used by cars, buses, and trucks. It yielded cumulative reductions of 7.4 percent in oil use and 3.8 percent in CO2 emissions, whereas the tax increase confined to motor vehicle fuel led only to half this reduction. Because of the design of the NEMS model,3 the projected energy and emissions savings result largely from reductions in vehicle miles traveled (VMT) rather than from increases in vehicle efficiency. In the case of the oil tax, for example, VMT was 6 percent lower in 2030 than projected by the AEO 2009 reference case.
In another study of policy options, Morrow et al. (2010) used NEMS to predict how gasoline use by cars and light trucks would respond to an escalating gasoline tax that is coupled with a national carbon price. By gradually increasing the gasoline tax and assuming a $0.46 per gallon carbon price, the study estimates how high gasoline prices must rise to cause gasoline consumption to be 25 percent lower by 2030 than the level projected in the AEO 2009 reference case. The calculated price is $8.70 per gallon, achieved through a combination of market price increases, higher gasoline taxes, and a carbon price. Morrow et al. characterize the tax increases that would be needed to achieve this price as aggressive, especially when the minimal success in raising gasoline taxes during the past two decades is considered.
Apart from the questions about the economic and equity effects of such high gasoline prices and whether they could be implemented (as a practical matter), all of these studies, and the models they use, acknowl-edge the uncertainty associated with how consumers and businesses are likely to respond to escalating fuel prices. The NEMS model con-tains assumptions about how consumers will respond, but this response remains an area of controversy despite a body of literature on the subject. The next subsection reviews some of this literature. Particular attention is given to studies of how private motorists and motor carriers respond to higher gasoline and diesel fuel prices, since they account for about 85 percent of transportation fuel use.
3 A shortcoming of using NEMS is that the model already assumes that vehicle efficiency will increase over the next decade because of legislatively mandated increases in vehicle fuel economy standards. Fuel prices, therefore, are assumed to have little effect on the level of efficiency of the fleet.

142 Policy Options for Reducing Energy Use and Greenhouse Gas Emissions from U.S. Transportation
Evidence of the Response by Private Motorists to Higher Gasoline PricesThere is a considerable literature on how private motorists respond to higher gasoline prices. As discussed in Chapter 4, Small and Van Dender (2007) have modeled how changes in gasoline prices affect fuel demand, separating the effects on VMT and on vehicle fuel economy. In analyz-ing data covering 1966 to 2001, they found that the short-run response to a 10 percent increase in gasoline prices is a 0.9 percent reduction in gasoline consumption. About half the consumption decline is caused by a reduction in driving, while the other half is attributable to an increasing share of VMT from more fuel-efficient vehicles. Findings for the longer-run response, consisting of a time span in which motorists can make more substantive changes in their vehicles and driving patterns, suggest that each 10 percent increase in gasoline prices reduces fuel consumption by 4 to 5 percent. Again, about half of the consumption decline derived from a reduction in driving, while the other half derived from an increase in vehicle fuel efficiency. These estimates of long-run fuel price elasticity as it relates to VMT are comparable with the elasticity values in NEMS (which assumes that each 10 percent increase in gasoline prices yields a 3 percent decrease in VMT).
By extending their analysis for the period 2000 to 2004, Small and Van Dender assessed whether fuel price elasticities have been changing over time. They found that elasticities have been diminishing: during this period each 10 percent increase in fuel prices led to a 0.4 percent decline in gasoline consumption in the short run and a 2.3 percent decline in the long run. The major reason for the weakened response is that VMT barely declined in response to higher gasoline prices (going down by only 0.1 percent in the short run and about 0.6 percent in the longer run). The authors surmised that higher household incomes have rendered higher fuel costs less significant to motorists than the savings in travel time that cars and light trucks offer relative to switching to other travel options such as walking and public transit.
This “income effect” is an important consideration for policy mak-ing. If the amount of driving by motorists is becoming less responsive to higher fuel costs as incomes go up, then fuel taxes may need to be raised to higher levels to have the desired effects on total fuel consumption.

Policy Options 143
Similarly, vehicle fuel efficiency gains will need to be even larger to com-pensate for the weaker VMT response. However, these price elasticity estimates were derived from a period during which fuel prices were rela-tively low and stable. Extrapolation of this observed VMT response to a period in which fuel prices are assumed to be rising much faster and to much higher levels may not be appropriate.
How higher-priced fuel affects consumer demand for vehicle fuel effi-ciency is another topic of interest for fuel tax policy. In general, a rational consumer would be expected to seek higher vehicle fuel economy when gasoline prices are high and expected to rise. Presumably, the consumer would be willing to pay for fuel-saving technologies that in present-value terms produce net savings in fuel expenditures over a vehicle’s service life. There is a commonly held view, however, that consumers do not rec-ognize or take into account all of the lifetime fuel savings offered by more fuel-efficient vehicles. These views have been persuasive for the modelers of NEMS, which assumes that consumers only consider the first 3 years of a car’s prospective fuel costs in making car purchase decisions and even discount these costs at an annual rate of 15 percent. The practical outcome of this assumption is a modeled consumer who is not willing to invest heavily in fuel-saving technologies.4
The assumption of NEMS modelers that consumers place a low value on the fuel-saving potential of a new car is consistent with and may derive from the literature in the energy economics field that finds an energy-efficiency gap whereby households and businesses tend to under-invest in energy-saving technologies. For example, in one of the earliest papers on the subject, Hausman (1979) found that consumers purchas-ing appliances applied discount rates of about 25 percent per year to the stream of future energy savings. In the years since, a number of other studies of energy-saving choices have found similar (and even higher) implied discount rates for a number of consumer products (Gillingham et al. 2006).
4 To illustrate the implications of these assumptions, Small (2010) assessed the long-run responsiveness of the fleet fuel economy to fuel price changes built into NEMS for 2030. In 2030, the fuel price is 82 percent higher than in 2010, and the implied long-run elasticity of fuel efficiency with respect to fuel price is 0.10. In comparison, a literature review by Parry and Small (2005) found a central value for this elasticity of 0.33. Thus, the responsiveness of fuel efficiency of the fleet in NEMS is lower than in the rest of the literature.

144 Policy Options for Reducing Energy Use and Greenhouse Gas Emissions from U.S. Transportation
With respect to automobiles, there is a growing body of empirical work estimating how consumers make trade-offs in vehicle price and future fuel savings when they make purchase decisions.5 Some of the studies support the hypothesis that consumers undervalue fuel economy, while others do not. Recently, for example, Beresteanu and Li (2011) ana-lyzed sales of hybrid vehicles to infer the trade-off between fuel savings and vehicle price. They found that buyers of these cars applied a low discount rate to fuel savings but noted that this result may have reflected the strong environmental values of a niche set of consumers. In contrast, Allcott and Wozny (2009), using a large data set of new and used car sales, found that consumers are only willing to pay $0.37 for more fuel-efficient vehicles to reduce expected discounted gasoline expenditures by $1. On the other hand, a study of new vehicle pricing by Langer and Miller (2008) found that manufacturers increase the sales price of fuel-efficient vehicles following gasoline price spikes in ways that are consis-tent with a recognition by these car manufacturers that consumers do value vehicle fuel economy when gasoline prices are high.
Although these price–demand relationships are not settled, there is a fair amount of literature supporting the idea that consumers can be short-sighted with respect to fuel economy savings. To explain this response, Greene (2011) contends that consumers are generally loss averse: they are reluctant to pay higher up-front costs for the uncertain future savings in fuel. Another possible source of this response may be that the trade-off between vehicle price and fuel economy price can be a particularly complex calculation for car buyers, requiring them to anticipate future gasoline prices and to be aware of the added value that higher vehicle efficiency can bring in the future market for their cars once used. In addition, consumers may incur high transaction costs in obtaining and understanding information about fuel-saving technolo-gies or in isolating attributes that contribute to fuel economy from those that affect other aspects of vehicle performance. Turrentine and Kurani (2007) found that car owners had little understanding of the relationship between vehicle fuel economy and vehicle purchase price. Hence, some researchers have argued that when the cost of obtaining such informa-
5 For a review of the literature, see Greene (2010).

Policy Options 145
tion is high, consumers will use simple experience-based techniques to guide their purchase decisions. For example, they may use 3- or 5-year payback rules and thus neglect the full stream of fuel savings over the vehicle’s much longer service life.
Another line of argument is that the observed reluctance to invest in fuel-saving vehicle technologies may be a manifestation of consumers’ unwillingness to sacrifice some other highly valued vehicle attribute in return for fuel savings. For example, high fuel efficiency is often associated with lower acceleration performance. Thus, while consumers may appear to be underinvesting in fuel economy, they may simply be trading off fuel savings for some other desired vehicle characteristics. These sacrifices are sometimes referred to as the hidden costs of fuel economy improvements. If it is descriptive of consumer decision making, such behavior does not represent a market failure. Instead, it is a reflection of fuel prices being too low for consumers to place a higher value on the fuel saved from increased energy efficiency relative to the sacrifice that must be made in vehicle styl-ing, handling, size, or some other aspect of performance.
Understanding these dimensions of consumer decision making is important in designing policies to reduce vehicle energy use and GHG emissions. If market barriers such as information gaps severely limit the ability of consumers to account for fuel savings, fuel taxes and other pric-ing policies to reduce energy use and reduce GHG emissions may prove to be much less effective than expected unless these barriers are overcome. Under these circumstances, regulations that require vehicle manufactur-ers to increase the fuel economy of their vehicles may be a more appealing approach. On the other hand, if consumers only appear to be short-sighted in their valuation of future fuel savings but are actually placing a higher value on other vehicle attributes given the relatively low cost of gasoline, policies that raise fuel prices may provide ample incentive for consumers to start demanding fuel-saving vehicle designs and technologies.
Responses to High Fuel Prices in Other ModesThe behavior of private motorists in responding to higher fuel prices should be distinguished from the behavior of commercial carriers offer-ing passenger and freight transportation services. As explained in Chap-ter 2, motor carriers and air carriers have demonstrated a long-standing

146 Policy Options for Reducing Energy Use and Greenhouse Gas Emissions from U.S. Transportation
sensitivity to the price of fuel, because they travel long distances and function in highly competitive industries in which fuel expenditures account for 20 percent or more of operating costs. Carriers who are cost-conscious and capable of holding down fuel costs through investments in fuel-saving technologies and practices are in a better position to price their transportation services competitively. Furthermore, when higher fuel prices cause freight carriage prices to go up generally, the shippers of goods who pay for these services can respond in ways that reduce their shipping costs. For example, they may adjust the size, density, and fre-quency of their shipments; the configuration of their distribution net-works; and the mix of freight modes they use. Hagler Bailly estimates that the average long-run price elasticity of truck freight is -0.4, which means that a 10 percent increase in trucking rates causes a 4 percent decline in the demand for truck service.6 Similarly, in summarizing a number of esti-mates of freight price elasticities, Small and Winston (1999) found that most values fall within the range of -0.25 to -0.35.
A similar sensitivity to fuel prices can be found in the long-distance passenger modes. The demand for airline service, for example, is espe-cially price-sensitive in leisure markets, where travelers often have a choice of traveling by car, bus, or train or of forgoing travel altogether when air fares are high. Price elasticities on the order of -0.4 for all air travel demand—which includes the less price-sensitive business travel market—suggest that a 10 percent increase in air fares will cause a 4 per-cent reduction in passenger demand (Small and Winston 1999). Because fuel is a major operating expense of airlines, higher-priced jet fuel leads to multiple fuel-saving responses by airlines, particularly through the use of more efficient aircraft but also through changes in operations, such as conserving fuel during ground operations (taxiing, idling), increasing the rate of aircraft utilization (increasing load factors and aircraft seat-ing density), and adjusting scheduling and routing. Of course, airlines must balance interest in saving fuel with competing passenger demands for services, as evidenced by the increased provision of onboard enter-tainment systems that add weight to aircraft. Airlines also recognize that departure frequencies are important in some market segments, such as in
6 www.tc.gc.ca/Envaffairs/subgroups1/fuel_tax/study1/final_Report/Final_Report.htm.

Policy Options 147
business markets, which can lead to the use of smaller jets that are easier to fill with passengers when more frequent trips are scheduled. These aircraft burn more fuel per passenger mile than do larger aircraft.7
The airline response to higher fuel prices can be hindered by the large capital investment required to obtain new aircraft. The economic life span of a single airplane can range from 20 to 35 years, while the life span of a family of airplanes can last even longer (Lee et al. 2001). The long life spans (far in excess of those for cars and trucks) can slow the rate of increase in the fuel efficiency of the fleet at large.
taxes to reduce fuel price volatilityInasmuch as fluctuations in retail fuel prices make it riskier to invest in alternative energy supplies and energy-saving technologies, a fuel tax may be structured to help counter this volatility. Raising fuel taxes to very high levels so that they make up the major portion of the retail price of gasoline and diesel (as is found in Europe) will by itself dampen the effect of volatile crude oil prices on the retail prices paid by motorists for gaso-line. But fuel tax policies can also be designed in other ways to dampen this price volatility, especially if the primary goal is to create an environ-ment more conducive to industry and consumer investments in energy efficiency and alternative fuels. One example of such a design is a variable tax that moves inversely with the price of crude oil.8 Borenstein (2008), for example, has analyzed the concept of a variable oil tax targeted at ensuring a minimum retail price for gasoline. Borenstein showed how a variable tax applied to a barrel of crude oil can ensure a target price for gasoline (for example, $3.00 per gallon) even as crude oil prices fluctuate. The frequency of adjustments to the variable tax would depend on the volatility of crude prices. Various entities have endorsed the general con-cept of a variable oil tax, including the Alliance of Automobile Manufac-turers9 and the California Secure Transportation Energy Partnership.10
7 http://www.theicct.org/documents/0000/0974/ICCT_Aircraft_Efficiency_final.pdf.8 http://www.ucei.berkeley.edu/PDF/csemwp182.pdf.9 http://www.its.ucdavis.edu/events/outreachevents/asilomar2009/presentations/Keynote%20Presentations/McCurdy_Asilomar_2009.pdf.10 http://www.calstart.org/Libraries/Policy_Documents/CalSTEP_recommendations_to_Commission_on_21st_Century_Economy.sflb.ashx.

148 Policy Options for Reducing Energy Use and Greenhouse Gas Emissions from U.S. Transportation
Because such a variable tax would not be a stable source of govern-ment revenue, its purpose would need to be linked to stimulating interest in diversifying the energy supply and not financing highway infrastruc-ture. The most significant practical challenge in administering such a variable tax is the potential for consumer resistance to sharp tax increases (and the loss of a fuel-savings windfall) when world oil prices are fall-ing. Although this challenge exists in making adjustments to all types of fuel taxes (including traditional taxes per gallon), it could be particularly problematic for a variable tax that must undergo repeated adjustments (and thus repeated scrutiny) when crude oil prices are volatile.
fuel tax implementation challengesA number of practical issues warrant consideration in assessing fuel taxes as a policy option for reducing energy use and GHG emissions in transportation. A critical one is the long-standing reluctance of elected officials to raise fuel taxes even slightly. Gasoline taxes generate more rev-enue than any other transportation fuel tax. However, the combination of inflation and improvements in vehicle fuel economy has led to declin-ing tax revenue relative to inflation and increased VMT. The federal tax on gasoline was last raised in 1993, despite repeated calls since then for higher fuel taxes to finance the transportation system. For example, in its assessment of future surface transportation investment requirements, the congressionally mandated National Surface Transportation Policy and Revenue Study Commission (2007) concluded that revenues required to meet the nation’s highway infrastructure needs over the next several decades are equivalent to $0.60 to $1.00 per gallon of fuel consumed.11 To help close this gap, the commission recommended that federal motor fuel taxes be increased by $0.05 to $0.08 per gallon annually over the next 5 years and then adjusted regularly for inflation. Three years later, these tax policy recommendations have not been pursued (National Surface Transportation Policy and Revenue Study Commission 2007; TRB 2006).
The fact that European and Japanese motorists pay gasoline taxes that are 5 to 10 times higher than those in the United States is often presented as evidence that higher rates can be achieved in this country.
11 http://transportationfortomorrow.org/final_report/vol_1_chapter_1.aspx.

Policy Options 149
This assumption may be valid; however, Japan and European countries introduced high fuel taxes long before a majority of their citizens owned automobiles. These levies were originally instituted as luxury taxes to support government funding generally and to support domestic energy production. An increase in taxes in the United States to similar levels would occur in an environment where automobiles have long been com-monplace. The use of fuel tax revenues to support general government funding might be more acceptable to consumers if the tax supplanted other less popular (or less efficient or less equitable) forms of taxation. How the revenues from higher fuel taxes are allocated and recycled back into the economy would need to be a major consideration in the design of such a policy and would probably be central to any debate over the policy’s design and its prospects for implementation.12
Vehicle Efficiency Standards
Table 5-4 shows the extent to which vehicle efficiency standards are being implemented and proposed around the world as a means of curbing transportation fuel use and GHG emissions. Automobile fuel economy standards have been in effect for more than 30 years in the United States through the Corporate Average Fuel Economy (CAFE) program. The federal Energy Independence and Security Act of 2007 calls for major increases in passenger car and light truck CAFE standards over the next decade. It mandates that new cars and light trucks sold in model year 2020 test for a combined average fuel economy of 35 miles per gallon (mpg), equivalent to an annual increase in new vehicle mpg of about 3 percent per year. As explained earlier in this report, the higher CAFE standards have recently been coupled with GHG performance standards for cars and light trucks administered by the U.S. Environmental Protec-tion Agency (EPA). The GHG standards are likely to be met by manufac-turers largely through accelerated fuel efficiency improvements, causing the 35-mpg mark to be reached by 2016. Achievement of these efficiency standards by the industry would represent the largest sustained increase
12 Some studies have examined the issue of the recycling of revenues, including the cited RFF-NEPI study (Krupnick et al. 2010).

150 Policy Options for Reducing Energy Use and Greenhouse Gas Emissions from U.S. Transportation
in new vehicle fuel efficiency since the early 1980s, when vehicle fuel economy standards and gasoline prices were rising in conjunction.13
One recent change in the CAFE standards, which will also apply to the new GHG performance standards, is a switch to standards based on vehicle “footprints” (or “attributes”), which are intended to make it easier for manufacturers of vehicles of many different sizes and types to comply with the standards and to address other concerns. This program change,
table 5-4 Existing and Proposed Vehicle Fuel and GHG Efficiency Standards in the United States and Other Countries
Unadjusted Countryor ModelYear Standard FleetTarget TargetedRegion Effective Type orMeasure Structure Fleet
United States
Canada (proposal)
European Union
Australia
Japan
China (proposal)
South Korea (proposal)
Source: German and Lutsey 2010.
2016
2016
2015
2010
2015
2015
2015
Fuel economy, GHG
GHG
GHG
GHG
Fuel economy
Fuel economy
Fuel economy, GHG
34.1 mpg (14.5 km/L) or 250 g of CO2/mile (155 g of CO2/km)
155 g of CO2/km
130 g of CO2/km
222 g of CO2/km
16.8 km/L
14.2 km/L
17 km/L or 140 g of CO2/km
Footprint-based corporate average
Footprint-based corporate average
Weight-based corporate average
Single average
Weight-based corporate average
Weight-based per vehicle and corporate average
Weight-based corporate average
Cars, light trucks
Cars, light trucks
Cars, light trucks
Cars, light trucks
Cars
Cars, light trucks
Cars, light trucks
13 Although the new standards for GHGs can also be met through means other than improving fuel economy (e.g., by reducing emissions from air-conditioning systems), most of the improvements will be attained through fuel economy increases.

Policy Options 151
which is described below, made support for higher fuel economy stan-dards easier to gain and may do so in the future. However, by essentially holding smaller vehicles to higher fuel economy targets than larger vehi-cles, the newly designed program could make consumers less inclined to buy the more fuel-efficient smaller vehicles. Such an unintended effect could make it more difficult for manufacturers to meet the fleetwide 35-mpg target, since declining interest in smaller vehicles will require that more of the improvement in efficiency come from larger vehicles.
implications of attribute-based standardsUnder the newly revised CAFE program, each manufacturer’s fuel econ-omy average will be defined as a function of the footprints of its vehicles—that is, each vehicle’s track width multiplied by its wheelbase.14 This change in program design was largely a response to the difficulties encountered by domestic automobile manufacturers in meeting a single mpg standard averaged over the wide variety of car and light truck models and types that each makes.15 In addition, the traditional single-vehicle-type standards (one applied to cars and another applied to light trucks) had long been criticized over concern that they caused manufacturers to produce smaller and lighter vehicles in which occupants are at greater risk of serious injury from a crash. The attribute-based approach is intended to reduce the incentive to downsize vehicles and thus to cause manufacturers to pay greater attention to developing fuel-saving technologies for each footprint class. As shown in Table 5-4, attribute-based design, whether linked to the vehicle’s footprint or another attribute such as vehicle weight, is becoming more popular for vehicle efficiency regulatory programs worldwide.
As noted above, another potential disadvantage of the switch to attribute-based standards is that it may become more difficult and more costly (in terms of the technologies required) to achieve the program’s mpg and GHG performance targets. The reason is that automobile
14 The National Highway Traffic Safety Administration elected to use footprint as the defining attribute over weight because of the potential for a weight-based system to deter manufacturers from seeking out lightweight materials. Under a weight-based system, a lighter vehicle could be subject to even more stringent fuel economy targets.15 This means that a manufacturer that makes primarily smaller vehicles does not have to spend as much to comply as manufacturers of larger vehicles. This is especially a problem if a country’s domestic automakers are the ones making the larger vehicles, as in the United States.

152 Policy Options for Reducing Energy Use and Greenhouse Gas Emissions from U.S. Transportation
manufacturers will no longer gain a compliance advantage by encourag-ing consumers to buy smaller cars or light trucks to achieve the previous standard, which was based on the average mpg of all passenger cars or light trucks sold.
In practice, the higher CAFE and GHG efficiency standards will con-tinue to encounter the problem of motorists having limited financial incen-tive to demand higher vehicle efficiency if fuel prices remain relatively low or decrease. Should consumers continue the past pattern of demanding large vehicles, which have larger footprints and are subject to lower fuel economy standards, meeting the 35-mpg standard for the combined fleet will be more challenging. Success in meeting the higher standard, there-fore, will depend even more on progress in furthering the effectiveness and affordability of fuel-saving technologies that can be applied to larger vehi-cles. If this progress does not materialize, consumers may face the choice of higher-priced vehicles or sacrifices in vehicle size and performance. Absent higher energy prices, consumers may be reluctant to accept this choice and may demand weaker (or static) standards instead.
consumer acceptance of stricter standardsExaminations of the technological potential for increasing light-duty vehi-cle efficiency suggest that fuel economy can be increased by 3 to 4 percent per model year over the next two decades by using a range of technologies that are emerging or becoming available (NRC 2010a; Bandivadekar et al. 2008). If mpg continues to grow by an average of 4 percent per model year from 2010 to 2030, as is now required for the next 5 years, the average fuel economy of new light-duty vehicles will reach 49 mpg by 2030. At current rates of fleet turnover, this increase in new vehicle mpg would cause the on-road average for the fleet to reach 38 mpg (up an average of 3.1 per-cent per year).16 If VMT increases by 1.5 percent per year over this period, plus another 0.2 percent per year due to a rebound effect from the higher vehicle fuel economies, total fuel consumption will decrease by about 1.4 percent per year, a reduction of about 25 percent in 2030 compared with consumption today.
16 The rate of growth in mpg for the entire on-road fleet is slower than that for new vehicles because of the lag in the impact of the standards as older vehicles are retired.

Policy Options 153
Whether such a large savings in fuel can be achieved will depend on more than technology-driven gains in vehicle efficiency. It will also depend on whether consumers accept the more energy- and emissions-efficient vehicles required by the standards. Vehicles will need not only to be priced acceptably but also to have performance qualities that are desired by consumers. The more that consumers are financially moti-vated to care about efficiency, the more willingly they will trade off some or all of these qualities for enhanced fuel-saving performance. The importance of consumer demand is revealed by the experience of the 1990s. During that period, gasoline prices were falling, which renewed consumer interest in larger vehicles in the form of light trucks that are subject to lower CAFE standards. Because the advances occurring at the time in fuel-saving technologies (e.g., lighter materials, fuel-injection systems, front-wheel drive) were utilized to make these larger vehicles more energy efficient, the result of the technological advancement was a small change in total energy consumption. For this entire period of declining fuel prices, the CAFE standards were unchanged, as motorists expressed little interest in raising the standards.
vehicle efficiency standards in other modesAlthough nearly all experience with fuel efficiency standards derives from light-duty vehicles, Congress has mandated the development of fuel effi-ciency standards for medium- and heavy-duty vehicles.17 A significant challenge in setting standards for this mode, and for others that provide passenger and freight service, is finding a suitable regulatory measure of efficiency. The most common efficiency metric used for light-duty vehicles, gallons of fuel consumed per vehicle mile, is less suited to freight trucks and passenger aircraft, which encompass a diversity of vehicle types, carry-ing capacities, and end-user applications. To set a single mileage-based standard for freight trucks, for example, could favor smaller vehicles with less hauling capacity and thus inadvertently result in more trucks on the road and an increase in overall fuel consumption. Similarly, a mileage-based standard for aircraft would need to take into account the variability
17 The Energy Independence and Security Act of 2007 (Public Law 110-140, December 19, 2007), Section 108, requires the U.S. Department of Transportation to establish fuel economy standards for medium- and heavy-duty vehicles.

154 Policy Options for Reducing Energy Use and Greenhouse Gas Emissions from U.S. Transportation
in aircraft designs, each optimized for flying different stage lengths and with different passenger loads. Across all of these freight and passenger modes, the metrics for efficiency may need to be based on the regulated vehicle’s productivity, such as its fuel consumption per ton-mile carried or passenger mile flown.
Heavy-duty trucks are often built and customized in stages by multiple manufacturers. Thus, determining the point in the truck manufacturing and assembly process at which an efficiency standard should be applied (and who would be held accountable) could be difficult: two trucks con-figured with similar power trains and frames could have substantially different fuel consumption characteristics depending on differences in their weight, rolling resistance, and aerodynamics that are introduced during the latter stages of customization. The trailers in tractor–trailer combinations are interchangeable, often owned by shippers (and not car-riers), and built separately from the tractor. Under these circumstances, whether the mandated level of efficiency for the tractor is being achieved when it is configured in combinations would be even more difficult to determine. The complexities of these regulatory issues as they pertain to large trucks are discussed in more detail in a National Research Council (NRC) report examining technologies and approaches for reducing the fuel consumption of medium- and heavy-duty vehicles (NRC 2010b). In the case of aircraft, any fuel efficiency standard would need to be com-patible (in scale and schedule of change) with the requirement of safety assurance and would need to recognize that new or reengineered designs will be subject to long and complex certification procedures. Such a stan-dard would have to avoid inadvertently impeding the introduction of safety innovations.
Feebates as Financial Incentives
Financial incentives that prompt consumers to demand vehicle energy and GHG efficiency may become increasingly necessary as efficiency standards are raised. Several programs intended to create such interest are already in effect. Among them are the provision of income tax credits to buyers of electric vehicles (EVs) and the long-standing “gas-guzzler” tax, which is intended to reduce demand for cars with low fuel economy. Tax subsidies

Policy Options 155
such as the federal EV credit are also intended to stimulate manufacturer interest in developing these vehicles and to accelerate their introduction.
Subsidylike programs could be designed in many ways to promote consumer and manufacturer interest in favored types of vehicles and technologies (such as EVs) or to stimulate greater consumer and sup-plier interest in vehicle fuel and GHG performance generally. They are not described here. Instead, this report examines a single policy instrument—a “feebate”—to illustrate how a subsidy program might be introduced to motivate interest in vehicle fuel and emissions efficiency but without the program being designed to favor a specific technology. The idea behind a feebate program is to combine a financial disincentive for the purchase of a low-performing vehicle with a financial incentive for the purchase of a higher-performing vehicle.18 Under such a program, all new vehicles would be tested to determine their level of efficiency relative to a prescribed performance threshold, such as miles per gal-lon or grams of CO2-eq per mile. Buyers of vehicles would be charged a graduated fee based on by how much the vehicle falls below the threshold or provided a graduated rebate depending on by how much the vehicle exceeds the threshold.
As described in Chapter 3, the federal government has long imposed a gas-guzzler tax on manufacturer sales of cars that test at 22.5 mpg or lower. In this respect, the program raises the prices of these cars and discourages consumer interest in them. However, these taxes apply to a small share of passenger cars sold and are not accompanied by a rebate program that motivates interest in highly efficient vehicles. One of the perceived advantages of the feebate approach is that it would establish a consistent and known price for developing and introducing efficiency-enhancing technologies. Whereas vehicle manufacturers do not currently have a strong incentive to exceed fuel economy standards, feebate pro-grams would encourage them to make vehicles more efficient in response to pricing and consumer demand.
As shown in Table 5-5, a number of countries are beginning to adopt feebatelike programs to create consumer demand for efficiency.
18 For more discussion of feebates and other incentives, see Greene (2009), Greene et al. (2005), and German and Meszler (2010).

tabl
e 5-
5 C
omp
aris
on o
f Fe
ebat
e an
d R
elat
ed F
ee P
rogr
ams
by C
oun
try
Fr
ance
Ir
elan
dG
erm
any
Uni
ted
Sta
tes
Cana
da
Type
of p
rogr
am
Flee
t aff
ecte
d Pi
vot p
oint
Dev
iati
on fr
om
a tr
ue fe
ebat
e
syst
em
Source:
Der
ived
from
Ger
man
and
Mes
zler
201
0.
Feeb
ate
Ligh
t-du
ty v
ehic
les
be
twee
n 96
mpg
(6
0 g
of C
O2/
km)
and
25 m
pg
(300
g o
f CO
2/km
)
Abo
ut 4
2 m
pg
(140
g o
f CO
2/km
)
Inco
mpl
ete
co
vera
ge
Not
con
tinu
ous
Fee
(tax
onl
y)
Ligh
t-du
ty v
ehic
les
betw
een
49 m
pg
(120
g o
f CO
2/km
) an
d 28
mpg
(2
25 g
of C
O2/
km)
N/A
Fees
onl
y
Inco
mpl
ete
co
vera
ge
Not
con
tinu
ous
Fee
(tax
onl
y)
All
light
-dut
y ve
hicl
es
N/A
Fees
onl
y
Ann
ual o
nly
Som
e fe
es b
ased
on
eng
ine
size
Fee
(tax
onl
y)
(gas
-guz
zler
fee)
Cars
less
than
22
.5 m
pg
N/A
Fees
onl
y
Doe
s no
t cov
er
maj
orit
y of
flee
t
Not
con
tinu
ous
Non
cont
inuo
us fe
ebat
e
Ligh
t-du
ty v
ehic
les
with
var
ied
mile
s pe
r ga
llon
cove
rage
Abo
ut 2
4 m
pg fo
r car
s an
d 22
mpg
for
othe
rs
Diff
erin
g fe
ebat
e sc
hedu
le b
y ve
hicl
e ty
pe
Maj
orit
y of
flee
t fal
ls in
to z
ero
feeb
ate
band
Not
con
tinu
ous

Policy Options 157
In principle, financial incentive programs such as feebates could be applied to other modes such as large trucks and aircraft. However, the feasibility of structuring a program for these modes would depend in large part on establishing appropriate productivity-related efficiency metrics for vehicle efficiency.
Low-Carbon Fuel Standards
description of standardsTwo fuel-oriented programs have recently been adopted in the United States to promote the replacement of the petroleum-based fuels used by cars and trucks with biomass-based and other alternative fuels having lower GHG emissions. The first program, adopted at the federal level, is EPA’s Renewable Fuel Standard (RFS), which sets a timetable for the replacement of petroleum-based motor fuels by a specific volume of renewable fuels. EPA recently instituted the second generation of this program, known as RFS2, in compliance with federal law (the Energy Independence and Security Act of 2007) that requires a greatly expanded supply of renewable fuels attaining certain GHG performance thresh-olds. The second program, adopted by California, is a low-carbon fuel standard (LCFS), which requires transportation fuel suppliers to reduce gradually the average GHG emission impacts of their fuels, including those of the fuel production process. Both the California and EPA pro-grams apply mainly to cars and trucks.
Although both programs are designed to cause petroleum to be replaced by lower-carbon fuels, the two pursue this goal differently.19 California’s LCFS requires a gradual reduction in the carbon intensity of the fuel sold in the state by lowering the average GHG emissions per gallon of fuel con-sumed. The California program currently calls for a 10 percent reduction in GHG emissions (grams of CO2-eq) per unit of energy used in transpor-tation fuels by 2020. To implement the standard, the program establishes a default value for the GHG life-cycle emissions associated with a wide range of fuel types including biofuels and other alternatives such as natural gas.
19 Much of the description of the LCFS program in California is derived from Sperling (2010).

158 Policy Options for Reducing Energy Use and Greenhouse Gas Emissions from U.S. Transportation
Fuel suppliers are free to sell whatever mix of fuel types suits them best; however, the average GHG performance of the mix must meet the LCFS. In seeking compliance, the supplier can also petition for the use of a lower emissions value for its fuels if justified, for example by demonstrating that fuel production processes are low in GHG emissions. Because GHGs are emitted during the “upstream” process of fuel production, storage, and distribution, the LCFS covers all of these emissions sources in addition to emissions from fuel combustion. In so doing, carbon-intensive fuel pro-duction processes, such as the production of gasoline from tar sands, are covered by the standards.
The federal RFS2 program, in comparison, focuses exclusively on bio-fuels as the means of GHG reduction. The program mandates that fuel suppliers sell certain volumes of biofuels over specified time periods and that a specified amount of this fuel meet designated GHG performance thresholds. For example, the program mandates that 36 billion gallons of biofuels be included in the transportation fuel supply by 2022, includ-ing at least 16 billion gallons produced from cellulosic feedstock that achieves at least a 60 percent reduction in GHG emissions in comparison with gasoline and diesel fuels.
Thus, a fundamental difference between California’s LCFS and the federal RFS2 is that the former program does not require the supply of specific types of fuels or specific methods of GHG reduction. The program, instead, is designed to be performance-based. It incorporates various features intended to motivate energy suppliers to seek innova-tive ways of reducing GHGs emitted from the burning and produc-tion of fuel. Although RFS2 mandates the supply of cellulosic biofuels, which provides an incentive for their development, it does not provide incentives for the development of other fuel alternatives or processes for reducing GHGs during fuel production. Key to the California LCFS is a provision allowing fuel suppliers to buy and sell emissions credits when they exceed or fall short of the standard. Oil refiners and import-ers, for example, can buy credits from a supplier of low-carbon biofuels to offset the emissions from their supplies of gasoline and diesel fuels. In this way, the tradable credits provision is intended to reward energy suppliers who are innovative and able to produce low-carbon fuels at lower cost.

Policy Options 159
lcfs implementation and effectiveness issuesA number of jurisdictions in this country and abroad are considering an LCFS,20 but California is the furthest along in implementation.21 There are several challenges to full implementation of an LCFS. As is true of any carbon emissions pricing or regulatory program, program administra-tors must have a practical means of measuring and accounting for the emissions. As mentioned above, California is using a “default and opt-in” approach whereby regulators assign different fuel types default values for CO2-eq emissions per energy unit. The fuel supplier can either accept these values or provide evidence that its production system leads to lower emissions. The major challenge in this regard is that the state must develop default values for many types of biofuels and biofuel production processes, each of which can have different sources of GHG emissions depending on such factors as land use changes associated with crop cultivation.
Furthermore, for an LCFS program to yield net reductions in GHG emissions, its coverage must extend beyond a single state or region. A state-based LCFS program, for example, will not preclude regional or national fuel suppliers from shifting their higher-carbon energy supplies to other states or regions. This “leakage” problem can nullify the emissions benefits of such a program. An LCFS that has a larger area of coverage—beyond one state or a region—would raise the cost of such behavior and thus increase the likelihood of achieving the targeted cuts in emissions.
Measures to Curb Private-Vehicle Travel
The nation’s 115 million households own and operate more than 225 mil-lion cars and light trucks and account for about 90 percent of all VMT by light-duty vehicles. More than three-quarters of these households are located in metropolitan areas, and they alone account for about 40 per-cent of all CO2 emitted from transportation. Hence, any serious effort to reduce energy use and emissions from transportation must cut the
20 For example, the European Union is moving toward an LCFS through its Fuel Quality Directive. In addition, 11 Northeastern and Mid-Atlantic states signed an agreement in January 2009 committing to cooperation in developing a regional LCFS.21 The standard was adopted in April 2009 and set to take effect in January 2010. http://www.energy.ca.gov/low_carbon_fuel_standard/.

160 Policy Options for Reducing Energy Use and Greenhouse Gas Emissions from U.S. Transportation
amount of energy used and GHGs emitted from private vehicles, espe-cially those in metropolitan areas.
All of the policy interventions covered so far in this chapter would affect the energy efficiency and use of household vehicles. However, addi-tional measures that further reduce the use of these vehicles may be war-ranted. For example, fuel economy standards lower the fuel cost per mile of driving and thus lead to some additional VMT, which would offset some of the fuel and emissions savings sought by the standards. Addi-tional policies aimed at tempering the growth in motor vehicle travel, therefore, may complement this regulatory program.
Focusing on the vehicle travel that takes place in metropolitan areas may be warranted because such locations account for a substantial por-tion of vehicle travel. Moreover, metropolitan areas presumably offer the greatest opportunity for reducing automobile travel through investments in alternative modes of transportation such as walking, bicycling, and public transit. Within metropolitan areas, the most significant sources of VMT are the households residing in the expanding suburbs. Today, more than half of the U.S. population lives in suburbs, which in comparison with the cities they surround have lower densities, more separation of land uses, more parking and road capacity, higher levels of motor vehicle ownership and use, and less walking and transit use.
moderating growth in metropolitan drivingIn examining the various policy instruments available to curb driving in metropolitan areas, it is helpful to consider how the urban concen-tration of people, businesses, and activities influences the amount and pattern of personal travel. Compared with residents of more dispersed rural areas, urban residents must travel shorter distances on average between their origins and destinations. The shorter average trip distances can reduce VMT and make mass transit, walking, and bicycling more competitive with driving. At the same time, the concentration of trip ori-gins and destinations in urban areas can lead to more traffic congestion and slower travel in transportation corridors and to more competition for scarce parking spots. In addition, travel in these congested areas can be energy intensive due to frequent cold starts, engine idling, and stop–start operations. Given these basic relationships, urban transportation

Policy Options 161
policies aimed at moderating growth in household VMT tend to focus on (a) creating more compact patterns of land development that further reduce average trip lengths and increase the appeal of alternatives to driving, (b) expanding the array of transportation options available to enable less reliance on the private automobile, and (c) increasing the price of park-ing to make driving less economical in comparison with other modes. Policies affecting each of these areas are discussed below.
Compact Land Development PoliciesCompact land development policies are broadly aimed at increasing the concentration of households and businesses in metropolitan areas, resulting in trip origins and destinations that are closer to each other. Their aims are to reduce VMT by making travel by foot or bicycle more practical and to create the traffic densities needed to make traditional fixed-route transit services more competitive with the private automobile.
The connections between urban land use patterns and household trip making and mode choice have been subjects of research and policy debate for years. A Transportation Research Board (TRB) report (TRB 2009b) examined the research into these connections in detail. The report concluded that urban areas that develop at higher residential and employment densities are, in general, likely to generate less VMT than their more spread-out counterparts, especially if alternative modes are convenient and affordable. Illustrative scenarios developed in the report suggest that “significant increases in more compact, mixed-use develop-ment will result in modest short-term reductions in energy consump-tion and CO2 emissions, but these reductions will grow over time” (TRB 2009b, 6). However, the report concedes an uncertainty about this rela-tionship. It states that “problems of measurement, issues of scale, and adequate controls for confounding variables (e.g., socioeconomic fac-tors, self-selection) have resulted in widely varying results concerning the importance of changes in land use and the magnitude of their effects on travel” (TRB 2009b, 89). Acknowledging these uncertainties in the magnitude and timing of the relationships between VMT and compact patterns of land development, the report nevertheless recommends that policies that support the ability of this development to reduce VMT should be encouraged.

162 Policy Options for Reducing Energy Use and Greenhouse Gas Emissions from U.S. Transportation
As detailed in the TRB report, most of the policy levers available to influence urban land use are held by state and local governments, mostly by the latter (TRB 2009b, 8–9). Some states have sought to encourage more centralized land use planning that favors more compact devel-opment, but their means for doing so are often limited. For example, Lewis et al. (2009) examined the implementation and effects of Mary-land’s “smart growth” initiative, which was considered to be one of the nation’s pioneering state-level programs aimed at influencing regional patterns of development when it was instituted in 1997. By establishing priority funding areas (PFAs) agreed to by local governments, the state sought to contain development by concentrating state infrastructure spending in these areas. However, the authors found that the PFAs had limited impact because most of the funds for financing land development continued to come from local and private sources. Similarly, a recent examination of the effects of Florida’s growth management program on development found that the state program led to lower population den-sities in urban areas while it produced higher population densities in suburban areas (Boarnet et al. 2011). The reason for this outcome, the authors surmise, is that the state program had limited influence over land use regulation but was effective in channeling development to suburban places with available infrastructure.
The experiences in Florida and Maryland illustrate how state influence on local land development patterns can be important but tends to be exer-cised mainly through the funding of transportation infrastructure and environmental regulation. The challenge is in making the state and federal roles more influential in encouraging metropolitan development patterns that are less automobile-oriented. In forming the Transportation and Cli-mate Initiative, a dozen state transportation, environment, and energy officials from the Northeast and Mid-Atlantic regions have declared their intention to collaborate in the development and demonstration of poli-cies and programs that can promote mixed-use development and support alternatives to driving as a way to reduce transportation energy use and GHG emissions.22 In addition, California has recently embarked on an effort to leverage its transportation infrastructure funds and environ-
22 http://www.georgetownclimate.org/state/files/TCI-declaration.pdf.

Policy Options 163
mental regulation to encourage local communities to favor development patterns that can help moderate growth in VMT. A state law passed in 2008 known as SB 375 requires that the California Air Resources Board develop regional GHG emissions reduction targets applicable to cars and light trucks for 2020 and 2035. The 18 metropolitan planning organiza-tions (MPOs) in the state are charged with developing a plan and strate-gies to meet these targets through reductions in VMT in their respective regions. As an incentive for compliance, private developers will get relief from certain environmental reviews under California law when their projects are consistent with the MPO plan and strategies. In addition, state transportation funding is tied to the development of such a regional plan. Because county and municipal governments are not required to follow the plan, whether this state program will influence the many local decisions concerning land development patterns and density remains to be seen.
Encouraging Personal Travel by Means Other Than Private VehiclesIn urban areas, the main alternatives to automobiles for local personal travel are walking, bicycling, and public transit. All three alternatives tend to be slower than driving for most trips, offer less protection from weather, and are not well suited for carrying and securing personal items. Favorable land development patterns require both a concentration and a mix of land uses to maximize the number of trip-making opportunities available by foot. The utility of a bicycle also increases when origins and destinations are clustered, but this utility can be reduced where congested roads create safety hazards. In the United States, utilitarian cycling has traditionally been highest in university towns, such as Boulder, Colorado; Davis, California; Eugene, Oregon; Madison, Wisconsin; and Palo Alto, California. Recently, however, some larger cities—such as Chicago, Illi-nois; Portland, Oregon; San Diego, California; and Washington, D.C.—have been actively encouraging cycling, with reported success, through the provision of dedicated travel lanes and bicycle-sharing programs. Relative to walking and bicycling, public transit has been the recipient of much more government attention and resources over the past several decades. In the nation’s older, larger cities, public transit continues to play a significant role in personal transportation, both for commuting and for other travel activity. However, for the nation as whole, more than

164 Policy Options for Reducing Energy Use and Greenhouse Gas Emissions from U.S. Transportation
85 percent of all metropolitan trips are made in private vehicles, com-pared with only about 3 percent by public transit.
Continued public support for these modes is an option for making them even more competitive with driving in urban areas. However, simply investing more money in public transit in the same manner as in the past may not prove fruitful in reducing transportation energy use and emis-sions. Public transit now accounts for about 20 percent of all government surface transportation expenditures (Taylor, Miller, et al. 2009). During the past 30 years, significant investments have been made in new and extended suburban rail transit services, causing the nation’s total transit rail miles to grow by more than 25 percent since 1993. As metropolitan areas have spread out, pressure to extend new transit investments into sprawling, less-transit-friendly suburbs has been increasing, contributing to declining service efficiency (e.g., fewer passengers per revenue vehicle hour).
Despite these rail investments, most regular public transit users con-tinue to come from low-income urban households with limited access to private vehicles. Bus transit, in particular, is most competitive with private vehicles in these lower-income urban markets because this ser-vice is more affordable and can be offered with high frequency in city locations with higher population and ridership densities. Thus, policies that keep bus fares low and increase service frequency (i.e., reduce wait times) have proved to be highly effective in attracting additional transit patronage (Taylor, Miller, et al. 2009). In general, whether the transit ser-vice consists of bus or rail, experience suggests that service investments alone cannot ensure heavy patronage. Research suggests a number of practical steps that can also help boost transit patronage concurrent with service investments. They include providing more frequent service on heavily traveled transit lines to reduce waiting times at stops, increasing safety monitoring of riders, and providing real-time traveler information at transit stops to reduce the perception of an excessive time penalty from traveling by transit (Taylor, Iseki, et al. 2009).
Increasing transit’s appeal and utility has many potential benefits, espe-cially by reducing traffic congestion and travel delays during peak travel periods. However, public transit accounts for a small share of household person trips, and even a 25 percent increase in transit ridership would

Policy Options 165
have limited impacts on total energy use and emissions from automobile travel. To bring about much larger impacts on energy and emissions may require changes in the provision and nature of transit services that are far more dramatic than the marginal effects of increases in transit service quality and capacity. It would likely require innovations both in transit technology and in how these services are organized, funded, and pro-vided by the public and private sectors. Given transit’s many functions in urban communities, bringing about such fundamental change may require an alignment of many interests in addition to curtailing transpor-tation energy use and emissions. A combination of higher energy prices, increasing traffic congestion, and new capabilities offered by advance-ments in transportation and information technology may be necessary to create an environment receptive to such change over time.
Pricing ParkingPricing parking represents an opportunity for curtailing at least some pri-vate driving in urban areas. However, in most urban locations in the United States, including many city centers, motorists do not pay to park. Indeed, in many urban areas the cost of supplying parking is capitalized in the cost of developing a building, as many local zoning requirements compel developers to provide off-street parking. The result is an excess supply of parking spaces, which drives the market price of parking to zero. Shoup (1997), who has written extensively on parking behavior and policies in the United States, estimated that urban motorists often save more from this built-in subsidy when they make a trip for commuting or shopping than they spend on the gasoline consumed for the travel. In addition, he finds that the expectation of being able to locate free or underpriced street park-ing in many commercial districts encourages motorists to drive exces-sively in search of a parking space, consuming fuel and emitting GHGs in the process (Shoup 1997; Shoup 2006; Shoup 2007).
Charging market-clearing prices for off-street and on-street parking and allowing developers to decide for themselves how much parking to provide are policy options that Shoup believes would shift more of the cost burden of vehicle use to drivers and thereby motivate more drivers to forgo travel or use alternative modes. He has proposed other complementary

166 Policy Options for Reducing Energy Use and Greenhouse Gas Emissions from U.S. Transportation
measures that would foster such behavior, such as encouraging employers to give their commuting employees the option of receiving cash or a transit subsidy in lieu of unpriced or subsidized parking (Shoup 2005).
Most parking is controlled by local government and thus often viewed as central to economic development. In this regard, policies that increase the cost of parking are often resisted by local businesses out of concern that more costly parking will discourage workers and shoppers. However, many of the benefits of reduced traffic congestion, as well as the genera-tion of parking revenues, would be conferred on the local community. Building the local support needed to raise the cost of parking will require the balancing of the two sets of interests.
pricing road useAn often-cited dilemma of policies aimed at reducing solo driving is that the resulting reductions in traffic congestion could reduce the cost of driving and thus induce some additional vehicle travel. This effect, termed “latent demand” by transportation analysts, is conceptually sim-ilar to the rebound effect of reducing the fuel cost of driving through improvements in vehicle fuel economy. Some of the policies discussed above, such as raising fuel taxes and pricing parking, can help counter this effect by making driving more costly. A related option is to price road use directly, such as by charging higher tolls and even assessing a fee on each mile of vehicle travel, known as VMT charging.
Although the concept of charging directly for road use through toll-ing is not new, interest in using tolls to relieve traffic congestion has been growing in the United States and worldwide. The focus has been on the use of tolls that vary on the basis of traffic levels. Nearly 100 variable toll-ing facilities are in operation, are in development, or are being planned around the world.23 Implementation of variable tolls in the United States has typically been confined to newly constructed facilities because of the resistance that would be encountered in charging motorists for the use of existing facilities that were previously unpriced. Whether variable tolls reduce overall VMT is unclear, since some of the motorists affected by
23 For more information on these projects and their rationale, see the special issue on congestion pricing in the July–August 2009 TR News (http://onlinepubs.trb.org/onlinepubs/trnews/trnews263toc.pdf).

Policy Options 167
the tolls will shift their driving to other roads or other times of the day when tolls are lower. Systemwide congestion pricing has not been tried in any U.S. community. Thus, while facility-specific charges can yield congestion benefits in individual highway corridors, the narrow scope of most applications is likely to limit their overall potential to reduce vehicle use, fuel consumption, and emissions at the metropolitan level.
For road pricing initiatives to have a broader effect on VMT and energy use would presumably require the use of more universal forms of road pricing, such as charging motorists per mile of travel anywhere on the highway system. Gasoline taxes already increase the per mile cost of driving. For example, a $0.50 tax per gallon adds $0.02 to the per mile cost of driving a car that averages 25 mpg. However, in light of the difficul-ties encountered over the past two decades in raising fuel taxes, VMT charges are viewed by some as potentially viable options for both raising revenues to finance transportation infrastructure and helping curb growth in vehicle use. For this reason, a TRB (2006) report, The Fuel Tax and Alternatives for Transportation Funding, recommended the pilot testing of road use metering and mileage charging. Subsequently, a report by the congressionally mandated National Surface Transportation Infrastructure Financing Commission (2009) urged the creation of a new transportation finance system that would use targeted tolling and more direct user fees based on miles driven. The commission concluded that to generate the same revenue as current federal, state, and local taxes on gasoline, the fee would need to average about $0.025 per mile. To have a significant impact on the total amount of driving, however, mileage-based charges would presumably need to be much higher than $0.025 per mile.
VMT charges have been used in the United States and abroad to a limited extent. Oregon, for example, has instituted a pilot program in which partic-ipants agree to pay a fee based on miles driven, as derived from odometer readings. Oregon also collects weight–distance taxes from motor carriers in lieu of diesel taxes. Germany has instituted a system of charging trucks tolls on the basis of miles traveled, exhaust emissions, and number of axles. In this program, the charges are calculated by using onboard Global Posi-tioning System equipment and wireless communication devices.
A concept related to VMT fees is “pay-as-you-drive” automobile insurance. These programs charge insurance on the basis of miles driven,

168 Policy Options for Reducing Energy Use and Greenhouse Gas Emissions from U.S. Transportation
with payments made at each vehicle refueling. These incremental fees are intended to provide drivers with a direct signal about the effect of each additional mile driven on the risk of having an accident. Such a mileage-based means of paying for accident insurance would likewise cause motorists to have increased awareness of the costs inherent in driv-ing an additional mile and thus greater monetary incentive to conserve on mileage. Pay-as-you-drive insurance is being tested in Oregon and used in a number of places, including locations in Israel, the Netherlands, and the United Kingdom (Greenberg 2009). A Brookings Institution study (Bordoff and Noel 2008) estimates that if motorists paid for acci-dent insurance through such a program, they would average $0.07 per mile in insurance fees and reduce their total driving by about 8 percent.
Measures Targeted to Freight and Passenger Service
Medium- and heavy-duty trucks account for about 20 percent of the energy used in the transportation sector, which makes trucking the sec-tor’s second-largest user of energy and contributor of GHG emissions. Airlines carrying passengers and cargo account for nearly 10 percent of transportation energy use. Many of the policies already examined in this chapter, such as transportation fuel taxes and vehicle efficiency standards, could be applied to trucks and conceivably to aircraft. Indeed, Congress has required the development of fuel efficiency standards for trucks, and EPA is likely to institute GHG efficiency standards for these vehicles and perhaps other large transportation vehicles at a future date.
Some of the challenges associated with designing and administering vehicle efficiency standards for trucks and aircraft have already been noted. Because of the sensitivity of motor carriers and airlines to fuel costs, higher taxes on diesel and jet fuels appear to hold the greatest potential for prompting reductions in energy use and emissions in these modes. In the absence of such energy pricing, the various incremental measures described below may be helpful in achieving marginal reduc-tions in trucking and aviation energy use and emissions. However, the measures are not likely to spur fundamental changes in the energy use and emissions patterns of these freight and passenger modes.

Policy Options 169
harmonizing other modal policies with efficiency goalsPolicies to reduce energy use and emissions in trucking and aviation should take into account how the array of regulatory and tax policies may be influencing the energy and emissions characteristics of these modes. For example, trucks are subject to federal and state size and weight regula-tions. On the one hand, these regulations can have a direct impact on the energy performance of trucks to the extent that they preclude the use of aerodynamic features such as boat tails, hybrid power trains, and exhaust energy recovery systems because of their implications for overall truck length and weight. Perhaps more important, truck size and weight limits can lead to higher energy consumption per freight ton-mile, since the energy efficiency of trucking tends to increase for vehicles having larger hauling capacity. Of course, truck size and weight limits were enacted for many reasons, most notably to ensure traffic safety and to guard against pre-mature road wear and bridge damage. The aforementioned NRC (2010b) report on reducing the fuel consumption of medium- and heavy-duty vehicles recognizes the role that these size and weight regulations have in preventing safety hazards and excess road damage. The report never-theless recommends that explicit consideration be given to the energy and emissions implications of these regulations when they are adjusted, as they are periodically.
Another area where harmonization of existing policies and energy- and emissions-saving goals may be desirable is in the setting of National Ambient Air Quality Standards (NAAQS) applicable to transportation vehicles. Both trucks and aircraft have long been subject to the NAAQS established by EPA under the Clean Air Act (CAA). To date, however, the standards apply only to the so-called “criteria” pollutants such as par-ticulate matter, hydrocarbons, carbon monoxide, and oxides of nitrogen (NOx). The recent decision to regulate GHG emissions under the CAA will therefore presumably require a balancing of interests in finding ways to reduce all of these regulated emissions, which can involve trade-offs. For example, improvements in the fuel efficiency (and thus carbon effi-ciency) of trucks has slowed in recent several years, partly because of the controls required for limiting emissions of NOx and particulate matter. Changes in the design and performance of diesel engines to meet these

170 Policy Options for Reducing Energy Use and Greenhouse Gas Emissions from U.S. Transportation
standards have tended to degrade engine thermal efficiency and, in the process, reduce fuel efficiency. Similarly, increasing the energy efficiency of jet engines can lead to the production of more NOx emissions as a result of higher peak engine temperatures.
The tax treatment of trucks may also be a candidate for more coordina-tion with energy and emissions policy making. Consideration, for exam-ple, may be given to how truck excise taxes and registration fees affect the rate of fleet turnover and the willingness of trucking companies to invest in more expensive vehicles designed with energy-saving features. Struc-turing these taxes and fees so that they do not inadvertently discourage the introduction of more efficient vehicles and the retirement of inefficient vehicles will be important. Substituting other charges based on vehicle use and fuel consumption for these taxes and fees, for example, may be more compatible with national energy- and emissions-saving goals.
infrastructure investment and management for efficient operationsThe federal government provides the navigation aids and manages the airways in which passenger and cargo airlines fly. It also provides aid to state and local governments for the construction and operation of the highway system and airport runways. State and local governments own, maintain, and operate the vast highway system and most of the nation’s commercial airports. Hence, government decisions about how these facili-ties and systems are configured, maintained, and managed affect the effi-ciency of both trucking and air carrier operations, including their energy and GHG performance.
Because trucks use the public highways, government management of and investments in this infrastructure can be critically important to truck operating efficiencies. At the operational level, state and local governments establish the rules governing traffic flow on the highways, including travel speeds. A number of countries require that large trucks operating on public roads travel at speeds lower than those of cars and light trucks and mandate the use of speed-governing systems. All mod-ern trucks used for long-haul transportation are equipped with such systems, which can be programmed by fleet owners or preset in the factory to limit maximum speed. The European Union limits the maxi-

Policy Options 171
mum road speed for trucks to 90 km/h (56 mph). Since each mile per hour increase in speed above 55 mph increases fuel use by more than 1.5 percent, government-mandated use of road speed limiters and aggressive enforcement of speed limits may represent an early means by which public policies can help reduce truck fuel use. Whether such speed limits would be useful would depend on the implications for traffic flow and safety. Nevertheless, this is an area in which early actions could further the goal of reducing transportation energy use and emissions.
There may be other opportunities to increase system energy efficiency. For example, long-haul trucks operating at lower speeds and in longer combinations may function more efficiently and with greater safety in dedicated truck lanes, especially when they travel through transportation corridors with heavy traffic. In deciding on the merits of such infrastruc-ture investments, the implications for transportation system energy use and emissions would deserve attention. Truck operations are already a focus area for state and federal investments in the many advanced tech-nologies and automated systems that make up intelligent transportation systems (ITS). Compared with building new physical infrastructure, ITS has been viewed as an inexpensive means of increasing highway capacity and operating efficiency. Investments in real-time traffic information, integrated traffic control systems, and automated toll collection, for example, can reduce congestion and make truck operations more energy efficient in the process.
In the case of aviation, the federal government’s role in managing the national airspace and associated infrastructure can have a substantial impact on airline energy use. The federal influence over airline opera-tions is far greater than over truck operations, because airline operations are strictly controlled by Federal Aviation Administration regulations and air traffic control services. Traffic congestion, both in the airways and at airports, increases airline energy use. Thus, investments and actions that increase system operating efficiency and capacity can be comple-mentary to the goal of reducing sector energy use and emissions. These actions may range from improved coordination by airlines and air traffic controllers in the selection of the most fuel-efficient routes and cruise speeds to major public investments in the national infrastructure of run-ways, taxiways, and air traffic control systems.

172 Policy Options for Reducing Energy Use and Greenhouse Gas Emissions from U.S. Transportation
public investments to shift traffic to less energy-intensive modesMany of the opportunities discussed above to improve the operating effi-ciency of the highway and aviation systems would probably also make these modes more appealing for passenger and freight service. In this respect, the improvements could increase the competitive advantage of trucks and airlines over other modes that are more energy efficient for long-distance passenger and freight service. The main competitors of airlines for inter-city passengers are cars and light trucks, as well as motor coaches and rail to a much more limited degree. In these intercity passenger markets, any improvements to aviation infrastructure and operations could lead to modal diversion away from driving, which may or may not lead to more energy-efficient travel. For trucks, however, the main competitor for long-distance freight hauling is railroads, which are very energy efficient. Thus, any diversion from rail to trucking could lead to increased energy use on a systemwide basis. The effect of public highway investments on the com-petitive advantage of trucking over rail has been an issue in transportation investment policy making for decades (TRB 1996).
Ensuring that transportation infrastructure policies do not inadver-tently favor the more energy-intensive modes may require that special attention be given to opportunities for improving the efficiency of the entire freight system. For example, railroads and trucks increasingly share in the movement of some freight, as railroads provide the line-haul service for intermodal containers and “piggybacked” trailers while trucks move these containers and trailers locally. To aid in providing such ser-vices, railroads have made significant capital investments in their main-line capacity and in building support facilities for containers and trailers. However, in practice, government assistance is often needed to facilitate these large and complex intermodal projects, since they often require coordinated improvements to private rail facilities and public waterways and highways, including local access roads and streets (TRB 2009a).
Even a relatively small diversion of truck freight to rail could have major implications for railroad capacity and operations. For example, the higher value commonly moved by truck requires much more timely movement than is typical for freight moved by rail. Serving this time-sensitive freight could put more stress on railroads because of the need to dedicate tracks

Policy Options 173
and trains. Hence, railroads have sought government incentives and assistance in meeting certain capital needs, such as increasing tunnel and bridge clearances for double-stacked containers and eliminating railroad–highway grade crossings. A number of public–private funding partner-ship programs already exist for such projects, such as credit assistance programs and private activity bond financing, and railroads have advo-cated tax credits to help pay for some capacity-enhancing infrastructure. Additional government support of this type would probably be required to accommodate much larger shifts of truck traffic to rail.
Summary Assessment
Six general types of policy approaches are considered in this chapter as options for reducing transportation’s use of energy and emissions of GHGs:
•Transportationfueltaxes,•Vehicleefficiencystandards,• Feebatesandotherfinancialincentivestomotivateinterestinefficiency,• Low-carbonstandardsfortransportationfuels,•Measurestocurbprivatevehicleuse,and•Measurestargetedtotheothermainpassengerandfreightmodes.
Fuel taxes are a long-standing source of government revenue for the construction, maintenance, and operation of the nation’s transportation infrastructure. Raising fuel taxes would generate responses comparable with those of carbon pricing. The higher-priced fuel would encourage the use of more energy-efficient vehicles and adoption of more energy-efficient operating practices. It would also temper demand for energy-intensive transportation activities. If the tax is structured to favor low-carbon fuels, it could also assist in lowering the carbon contribution from the transporta-tion fuel supply. However, there is much uncertainty about how consumers and businesses would respond to higher fuel prices.
At least among private motorists, there is evidence that responsiveness to changes in fuel costs may be decreasing as household income and the value of time rise (favoring faster automobile travel over other modes). Findings that VMT, in particular, is becoming less sensitive to higher fuel

174 Policy Options for Reducing Energy Use and Greenhouse Gas Emissions from U.S. Transportation
costs suggest that fuel tax increases will need to be high to affect overall energy demand—rising by $5.00 per gallon to reduce gasoline consump-tion on the order of 25 percent over the next two decades. How sustained higher fuel prices would affect energy use by the other energy-intensive modes of freight and passenger transportation, trucking and aviation, is also unclear because of limited experience with such high prices. Never-theless, because these modes are highly competitive and sensitive to costs, they have tended to be responsive to changing energy prices.
A number of practical issues warrant consideration in assessing fuel taxes as a policy candidate for reducing energy use and GHG emissions. Perhaps the most important one is the long-standing reluctance of elected officials at all levels to raise fuel taxes even marginally. To many observ-ers, this experience suggests that raising fuel taxes substantially to curtail energy demand and emissions would be a nearly insurmountable chal-lenge. However, sustained higher fuel taxes would generate substantial government revenues that could be used to replace other taxes or provide other government services. Indeed, it is difficult to envision a scenario in which policy makers could generate public support for higher fuel taxes without offering a compelling plan for use of the revenues.
At least in recent years, raising vehicle efficiency standards has proved to be more practical than raising fuel taxes to any substantial degree. Efficiency standards have long been the principal means by which the federal government has sought to reduce oil use by cars and light trucks and, more recently, to control emissions of GHGs. Such standards are likely to be applied in other transportation modes. Recent increases in automobile fuel economy standards, coupled with GHG performance standards, are likely to contribute significantly to stabilizing petroleum use and emissions from the light-duty vehicle fleet over the next decade or more. Vehicles with much higher fuel economy will cost less to drive (in terms of fuel expenses), which may prompt an increase in VMT, espe-cially if fuel prices do not increase significantly.
If vehicle energy efficiency goes up faster than fuel prices, motorist demand for energy savings may weaken further, complicating efforts to raise the efficiency standards over time. Preventing such an outcome may prove crucial in sustaining public support for efficiency standards. Finan-cial incentives such as feebate programs may motivate greater interest

Policy Options 175
in energy and emissions efficiency, among both buyers and suppliers of vehicles and energy. LCFS programs and others that encourage energy providers to innovate and develop new fuels to diversify the fuel supply may prove helpful in achieving the much longer-term goal of a fuel sup-ply having limited impacts on the carbon cycle.
To temper growth in VMT may require policies that work hand-in-hand with energy pricing and vehicle efficiency standards, such as land use planning and transportation investments that emphasize compact development and alternative modes of travel. In this area, however, many of the relevant policy levers are held by local governments.
Coordinating the decisions of the dozens of local governments that make up each metropolitan area complicates VMT reduction through these means. Whether incentives for regionwide VMT targets can be cre-ated by the financial and regulatory programs of federal and state govern-ment is now being explored in California. Similar experiments in other jurisdictions will be vital in assessing whether these policy actions can have a complementary role in reducing transportation energy use and emissions.
References
abbreviationsCBO Congressional Budget Office
NRC National Research Council
TRB Transportation Research Board
Allcott, H., and N. Wozny. 2009. Gasoline Prices, Fuel Economy, and the Energy Paradox. Department of Economics, Massachusetts Institute of Technology, Cambridge, Nov.
Bandivadekar, A., K. Bodek, L. Cheah, C. Evans, T. Groode, J. Heywood, E. Kasseris, M. Kromer, and M. Weiss. 2008. On the Road in 2035: Reducing Transportation’s Petroleum Consumption and GHG Emissions. Laboratory for Energy and the Environment, Massachusetts Institute of Technology, Cambridge.
Beresteanu, A., and S. Li. 2011. Gasoline Prices, Government Support, and the Demand for Hybrid Vehicles in the United States. International Economic Review, Vol. 52, No. 1, pp. 161–182.
Boarnet, M. G., R. B. McLaughlin, and J. I. Carruthers. 2011. Does State Growth Management Change the Pattern of Urban Growth? Evidence from Florida. Regional Science and Urban Economics, Vol. 41, No. 3, pp. 236–252.

176 Policy Options for Reducing Energy Use and Greenhouse Gas Emissions from U.S. Transportation
Bordoff, J. E., and P. J. Noel. 2008. Pay-as-You-Drive Auto Insurance: A Simple Way to Reduce Driving-Related Harms and Increase Equity. Brookings Institution, Wash-ington, D.C. http://www.brookings.edu/papers/2008/07_payd_bordoffnoel.aspx.
Borenstein, S. 2008. The Implications of a Gasoline Price Floor for the California Budget and Greenhouse Gas Emissions. Working paper CSEM WP 182. University of California, Berkeley.
CBO. 2008. Policy Options for Reducing CO2 Emissions. Publication 2930. Washington, D.C., Feb. http://www.cbo.gov/ftpdocs/89xx/doc8934/02-12-Carbon.pdf.
Fawcett, A. A., K. V. Calvin, F. C. de la Chesnaye, J. M. Reilly, and J. P. Weyant. 2009. Overview of EMF 22 U.S. Transition Scenarios. Energy Economics, Vol. 31, pp. S198–S211. http://emf.stanford.edu/files/res/2369/fawcettOverview22.pdf.
German, J., and N. Lutsey. 2010. Size or Mass? The Technical Rationale for Selecting Size as an Attribute for Vehicle Efficiency Standards. International Council on Clean Transportation.
German, J., and D. Meszler. 2010. Feebate Review and Assessment: Best Practices for Feebate Program Design and Implementation. International Council on Clean Transportation.
Gillingham, K., R. G. Newell, and K. L. Palmer. 2006. Energy Efficiency Policies: A Retrospective Examination. Annual Review of Environment and Resources, Vol. 31, pp. 161–192.
Greenberg, A. 2009. Designing Pay-per-Mile Auto Insurance Regulatory Incentives. Transportation Research D, Vol. 14, No. 6, pp. 437–445.
Greene, D. L. 2009. Feebates, Footprints and Highway Safety. Transportation Research D, Vol. 14, No. 6, pp. 375–384.
Greene, D. L. 2010. How Consumers Value Fuel Economy: A Literature Review. Techni-cal Report EPA-420-R-10-008. U.S. Environmental Protection Agency, March.
Greene, D. L. 2011. Uncertainty, Loss Aversion, and Markets for Energy Efficiency. Energy Economics, Vol. 33, No. 4, pp. 608–616.
Greene, D. L., P. D. Patterson, M. Singh, and J. Li. 2005. Feebates, Rebates and Gas-Guzzler Taxes: A Study of Incentives for Increased Fuel Economy. Energy Policy, Vol. 33, pp. 757–775.
Hausman, J. A. 1979. Individual Discount Rates and the Purchase and Utilization of Energy Using Durables. Bell Journal of Economics, Vol. 10, No. 1, pp. 33–54.
Krupnick, A. J., I. W. H. Parry, M. A. Walls, T. Knowles, and K. Hayes. 2010. Toward a New National Energy Policy: Assessing the Options. Resources for the Future, Washington, D.C., Nov.
Langer, A., and N. Miller. 2008. Automobile Prices, Gasoline Prices, and Consumer Demand for Fuel Economy. Economic Analysis Group Discussion Paper EAG 08-11. Department of Economics, University of California at Berkeley, Dec.

Policy Options 177
Lee, J. J., S. P. Lukachko, I. A. Waitz, and A. Schäfer. 2001. Historical and Future Trends in Aircraft Performance, Cost, and Emissions. Annual Review of Energy and the Environment, Vol. 26, pp. 167–200.
Lewis, R., G.-J. Knaap, and J. Sohn. 2009. Managing Growth with Priority Funding Areas: A Good Idea Whose Time Has Yet to Come. Journal of the American Planning Association, Vol. 75, No. 4, pp. 457–478.
Morrow, W. R., K. Sims-Gallagher, G. Collantes, and H. Lee. 2010. Analysis of Policies to Reduce Oil Consumption and Greenhouse Gas Emissions from the U.S. Transportation Sector. Energy Policy, Vol. 38, No. 3, pp. 1305–1320.
National Surface Transportation Infrastructure Financing Commission. 2009. Paying Our Way: A New Framework for Transportation Finance. http://financecommission. dot.gov/Documents/NSTIF_Commission_Final_Report_Mar09FNL.pdf.
National Surface Transportation Policy and Revenue Study Commission. 2007. Trans-portation for Tomorrow: Report of the National Surface Transportation Policy and Revenue Study Commission. http://transportationfortomorrow.com/final_report/index.htm.
NRC. 2001. Energy Research at DOE: Was It Worth It? Energy Efficiency and Fossil Energy Research 1978 to 2000. National Academy Press, Washington, D.C.
NRC. 2010a. Real Prospects for Energy Efficiency in the United States. National Academies Press, Washington, D.C.
NRC. 2010b. Technologies and Approaches to Reducing the Fuel Consumption of Medium- and Heavy-Duty Vehicles. National Academies Press, Washington, D.C.
Parry, I. W. H., and K. A. Small. 2005. Does Britain or the United States Have the Right Gasoline Tax? American Economic Review, Vol. 95, No. 4, pp. 1276–1289.
Shoup, D. 1997. The High Cost of Free Parking. Journal of Planning Education and Research, Vol. 17, pp. 3–20. http://www.uctc.net/papers/351.pdf.
Shoup, D. 2005. Parking Cash Out. American Planning Association, Chicago, Ill.Shoup, D. 2006. Cruising for Parking. Transport Policy, Vol. 13, No. 6, Nov., pp. 479–486.Shoup, D. 2007. Gone Parkin’. New York Times. http://www.nytimes.com/2007/03/29/
opinion/29shoup.html?ex=1332820800&en=cdabf3ece6c4a862&ei=5088& partner=rssnyt&emc=rss.
Small, K. A. 2010. Energy Policies for Automobile Transportation: A Comparison Using the National Energy Modeling System. Resources for the Future and National Energy Policy Institute, June. http://www.rff.org/Documents/Features/NEPI/RFF-BCK-Small-AutoPolicies.pdf. Accessed June 29, 2010.
Small, K. A., and K. Van Dender. 2007. Fuel Efficiency and Motor Vehicle Travel: The Declining Rebound Effect. Energy Journal, Vol. 28, No. 1, pp. 25–51.
Small, K. A., and C. Winston. 1999. The Demand for Transportation: Models and Applications. In Essays in Transportation Economics and Policy (J. A. Gómez-Ibáñez,

178 Policy Options for Reducing Energy Use and Greenhouse Gas Emissions from U.S. Transportation
W. B. Tye, and C. Winston, eds.), Brookings Institution Press, Washington, D.C., pp. 11–55.
Sperling, D. 2010. Policies to Promote Low-Carbon Transportation Fuels: What Works? TR News, No. 268, May–June, pp. 29–31.
Taylor, B. D., H. Iseki, M. A. Miller, and M. Smart. 2009. Thinking Outside the Bus: Understanding User Perceptions of Waiting and Transferring in Order to Increase Transit Use. UCB-ITS-PRR-2009-8. California Partners for Advanced Transit and Highways, Berkeley.
Taylor, B. D., D. Miller, H. Iseki, and C. Fink. 2009. Nature and/or Nurture? Analyzing the Determinants of Transit Ridership Across U.S. Urbanized Areas. Transportation Research A, Vol. 43, No. 1, pp. 60–77. DOI: 10.1016/j.tra.2008.06.007.
TRB. 1996. Special Report 246: Paying Our Way: Estimating Marginal Social Costs of Freight Transportation. TRB, National Research Council, Washington, D.C. http://onlinepubs.trb.org/onlinepubs/sr/sr246.pdf.
TRB. 2006. Special Report 285: The Fuel Tax and Alternatives for Transportation Fund-ing. TRB, National Research Council, Washington, D.C.
TRB. 2009a. Special Report 297: Funding Options for Freight Transportation Projects. Transportation Research Board of the National Academies, Washington, D.C.
TRB. 2009b. Special Report 298: Driving and the Built Environment: The Effects of Compact Development on Motorized Travel, Energy Use, and CO2 Emissions. Transportation Research Board of the National Academies, Washington, D.C.
TRB. 2009c. Special Report 299: A Transportation Research Program for Mitigating and Adapting to Climate Change and Conserving Energy. Transportation Research Board of the National Academies, Washington, D.C.
Turrentine, T., and K. Kurani. 2007. Car Buyers and Fuel Economy? Energy Policy, Vol. 35, pp. 1213–1223.

179
This report examines U.S. transportation’s consumption of petroleum fuels and the public interest in reducing this consumption to enhance the nation’s energy security and help control emissions of carbon dioxide (CO2) and other greenhouse gases (GHGs) that threaten climate change. It describes how over many decades the transportation sector has come to exert increasing influence over where Americans reside, work, shop, and socialize and how U.S. businesses are structured and operate. As the dominant source of energy for nearly all modes of transportation, petroleum has become so vital that controlling its adverse side effects presents many complex public policy challenges.
The transportation sector accounts for more than two-thirds of the petroleum fuel consumed each year in the United States. The burning of this carbon-rich fuel in transportation accounts for about one-quarter of all CO2 emissions from U.S. energy consumption. Because CO2 is a power ful GHG whose molecules can remain in the atmosphere for decades, these emissions contribute to growing concentrations of GHGs in the atmosphere. Scientific analyses and models indicate a need to stabilize these concentrations by the middle of the century to control adverse effects on climate. To achieve this stability, the models suggest that annual emissions in three or four decades will need to be cut by up to 80 percent, even as population and the economy are projected to grow.
The report reviews policy options for bringing about desired energy consumption and GHG emissions reductions from the U.S. transportation
Informing the Choices Ahead6

180 Policy Options for Reducing Energy Use and Greenhouse Gas Emissions from U.S. Transportation
sector. Environmental problems have been the subject of public policies to regulate transportation’s use of energy in the past. More than 40 years ago, the mitigation of local and regional air pollution caused by the burn-ing of gasoline, diesel, and other petroleum fuels became a major goal of national energy, environmental, and public health legislation. The resulting regulatory actions, which consist of measures governing fuel composition, pollution control technologies, and vehicle maintenance and refueling pro-cedures, have led to sharp reductions in the sector’s emissions of carbon monoxide, lead, sulfur, oxides of nitrogen, and other substances harmful to public health and the environment. A similar commitment of public policy, but one entailing even more far-reaching actions and responses, will almost certainly be required if transportation is to have a significant role in U.S. efforts to reduce GHG emissions over the next 40 years.
The report considers various opportunities for reducing transportation’s emissions of CO2 and other GHGs through policies seeking to increase the energy efficiency of vehicles and their operations, reduce the amount of energy- and emissions-intensive transportation activity, and lower the carbon impacts of transportation fuels. Cars, trucks, aircraft, ships, and trains consume much less energy today than did their predecessors in 1970 when the basis of measurement is transportation output, such as fuel con-sumed per passenger mile or ton-mile. These gains in energy efficiency have helped temper upward pressure on the sector’s petroleum use caused by many countervailing trends in population, automobile ownership and use, personal travel, freight demand, and traffic congestion.
However, limiting growth in petroleum use will not be enough to yield deep emissions reductions by the middle of the century. To achieve much more from transportation will likely require not only larger gains in the energy efficiency of vehicles and their operations but also the emergence of a more diverse lower-carbon energy supply and changes in how the transportation system evolves and is used. In other words, increases in vehicle efficiency will need to be accompanied by other systemic mea-sures that are economically efficient, acceptable to the public, and capable of producing reductions in fuel use and emissions that grow over time.
Current policies that regulate vehicles and fuels, such as fuel economy standards and renewable fuel mandates, seek to reduce transportation

Informing the Choices Ahead 181
petroleum use and associated emissions through changes in the perfor-mance and mix of the products sold by vehicle and energy suppliers. First adopted in the 1970s, federal regulations requiring automobile manufac-turers to increase vehicle fuel economy have been accepted by consumers, elected officials, and industry, despite long periods in which the standards remained unchanged. Three decades later, supplier-targeted regulations, which now include GHG performance standards for new cars and light trucks, remain the primary approach by which the federal government seeks to curb energy use and emissions from the light-duty fleet. Planned fuel efficiency standards for medium- and heavy-duty trucks and the recent adoption of renewable fuel standards, which mandate that a certain percentage of the fuel supply consist of lower-carbon fuels, represent a continuation of the supplier-focused approach to policy making.
Programs that compel suppliers to make more efficient vehicles and to diversify the fuel supply may yield even larger savings in energy use and emissions from the transportation sector. However, supplier man-dates can exploit only some of the opportunities for achieving energy and emissions savings. For reasons explained in the report, extending vehicle efficiency standards to the other commercial modes such as trucking and aviation may be more challenging to administer and require longer time frames to exert fleetwide influence than experienced in the automotive sector. Even for cars and light trucks, a plan for continual tightening of standards could prove difficult to sustain if consumers do not place a high value on the additional energy and emissions savings that will ensue.
Broader and deeper reductions in transportation petroleum use and emissions over the longer term will probably require actions that motivate households and commercial carriers to demand greater savings in fuel and emissions. They will also necessitate flexibility and innovation on the part of vehicle and fuel suppliers in responding to regulatory mandates and consumer demands. Several policy options examined in this report exemplify approaches that can begin to motivate this combination of consumer and supplier interest. Efficiency-oriented “feebate” programs, which increase the price of lower-performing products while reducing the price of higher-performing products, offer a way to stimulate interest in efficiency by both users and suppliers of transportation vehicles and fuels.

182 Policy Options for Reducing Energy Use and Greenhouse Gas Emissions from U.S. Transportation
Similarly, provisions allowing suppliers to bank and trade performance credits when they comply with efficiency and fuel standards can offer an incentive to firms to innovate in ways that are more economically efficient and responsive to consumer needs.
Table 6-1 summarizes how the main policy options examined in this report compare with respect to their scope of application (across modes) and array of impacts (i.e., on energy and emissions efficiency, activity, and the GHG characteristics of fuel). Fuel taxes have the greatest appli-cability across modes. Indeed, fuel taxes are already in effect in nearly all modes of transportation. In addition to having sectorwide applicabil-ity, fuel taxes prompt a varied energy- and emissions-saving response by both consumers and suppliers of fuels, vehicles, and transportation services. By raising fuel prices, fuel taxes can lead to increased consumer interest in more fuel-efficient vehicles and operations and a reduction in the demand for energy-intensive transportation activity (with the magnitude of the effect depending on the size and duration of the tax). Higher fuel prices encourage energy-conserving behaviors by individu-als and businesses through a variety of means in addition to prompting changes in vehicles and fuels, such as reduced vehicle travel speeds and truck idling, more direct routing, more intense vehicle and fleet utili-zation, and innovations in equipment (e.g., low-rolling-resistance tires and more aerodynamic trailers) and system operations (e.g., intelligent transportation systems).
In comparison, efficiency standards have a more focused impact; they seek to increase the energy and emissions performance of vehi-cles and fuels but do not prompt vehicle operators to engage in more energy-efficient operations or to scale back energy- and emissions-intensive activity. With the exception of fuel taxes, most policy options listed in Table 6-1 have a narrow impact; they are targeted at specific modes and at only one of the factors influencing transportation energy use and emissions.
Aligning Strategic Interests and Policies
To achieve timely, sustained, and increasing reductions in GHG emis-sions, a combination of policies may be needed. Actions that go beyond

tabl
e 6-
1 S
cop
e, S
cale
, an
d T
imin
g of
Im
pac
ts o
f M
ajor
Pol
icy
Ap
pro
ach
es t
o R
edu
cin
g Tr
ansp
orta
tion
’s
Petr
oleu
m U
se a
nd
GH
G E
mis
sion
s
S
cope
ofA
ppli
cati
ona
ndIm
pact
sTi
min
gan
dS
cale
ofI
mpa
cts
A
ppli
cabi
lity
Acr
oss
Pr
ospe
cts
for
Earl
y
Poli
cyA
ppro
ach
Tran
spor
tati
onM
odes
Im
pact
sa Po
licy
Impl
emen
tati
on
Sca
leo
fIm
pact
sb
Fuel
taxe
sTa
xes
can
be a
sses
sed
on a
ll fu
els
used
in a
ll m
odes
of
tran
spor
tatio
n.
T axe
s th
at ra
ise
the
pric
e of
fuel
w
ill p
rom
pt c
onsu
mer
and
car
-ri
er in
tere
st in
ene
rgy-
effic
ient
ve
hicl
es a
nd o
pera
tion
s as
w
ell a
s al
tern
ativ
es to
ene
rgy-
inte
nsiv
e tr
ansp
orta
tion
act
iv-
ity.
A ta
x st
ruct
ure
favo
ring
lo
w-G
HG
fuel
s ca
n al
so fo
ster
in
tere
st in
alt
erna
tive
fuel
s an
d m
ore
emis
sion
s-ef
ficie
nt
vehi
cle
type
s.
Bec
ause
taxe
s ar
e al
read
y im
pose
d on
fuel
s us
ed in
mos
t tr
ansp
orta
tion
mod
es, h
ighe
r fu
el ta
xes
wou
ld b
e st
raig
htfo
r-w
ard
to a
dmin
iste
r. Th
e m
ajor
ch
alle
nge
to e
arly
impl
emen
ta-
tion
is to
find
inno
vati
ve w
ays
to e
ngen
der a
nd s
usta
in p
ublic
su
ppor
t for
hig
her t
axes
, whi
ch
have
bee
n re
sist
ed d
urin
g th
e pa
st tw
o de
cade
s.
If fu
el ta
xes
can
be s
usta
ined
an
d co
ntin
ually
rais
ed, t
hey
can
gene
rate
incr
easi
ng
impa
cts
on tr
ansp
orta
tion
en
ergy
use
and
em
issi
ons
over
ti
me
as c
onsu
mer
s an
d su
p-pl
iers
of v
ehic
les
and
ener
gy
adju
st th
eir p
urch
ases
, beh
av-
ior,
trav
el a
ctiv
ity,
and
pro
d-uc
ts o
ffer
ed. C
ompl
emen
tary
po
licie
s th
at fa
cilit
ate
fuel
- and
em
issi
ons-
savi
ng re
spon
ses,
su
ch a
s co
mpa
tibl
e la
nd u
se
and
tran
spor
tati
on in
fras
truc
-tu
re p
lann
ing,
may
mak
e th
e hi
gher
fuel
taxe
s m
ore
acce
pt-
able
to c
onsu
mer
s.(c
onti
nued
on
next
pag
e)

tabl
e 6-
1 (c
onti
nued
) S
cop
e, S
cale
, an
d T
imin
g of
Im
pac
ts o
f M
ajor
Pol
icy
Ap
pro
ach
es t
o R
edu
cin
g
Tran
spor
tati
on’s
Pet
role
um
Use
an
d G
HG
Em
issi
ons
S
cope
ofA
ppli
cati
ona
ndIm
pact
sTi
min
gan
dS
cale
ofI
mpa
cts
A
ppli
cabi
lity
Acr
oss
Pr
ospe
cts
for
Earl
y
Poli
cyA
ppro
ach
Tran
spor
tati
onM
odes
Im
pact
sa Po
licy
Impl
emen
tati
on
Sca
leo
fIm
pact
sb
Effic
ienc
y st
anda
rds
alre
ady
exis
t for
car
s an
d lig
ht tr
ucks
. Th
ey a
re b
ased
on
ener
gy
cons
umed
or e
mis
sion
s pe
r ve
hicl
e m
ile. E
stab
lishi
ng
stan
dard
s fo
r lar
ger p
as-
seng
er a
nd fr
eigh
t-ca
rryi
ng
mod
es is
mor
e co
mpl
icat
ed
beca
use
of th
e va
riab
ility
in
veh
icle
type
s an
d us
es.
The
stan
dard
mus
t acc
ount
fo
r the
wor
k pe
rfor
med
by
thes
e ve
hicl
es (v
olum
e or
to
nnag
e of
frei
ght,
vol
ume
of
pass
enge
rs).
Vehi
cle
ener
gy a
nd e
mis
sion
s ef
ficie
ncy
stan
dard
s ar
e on
e-di
men
sion
al in
that
they
do
not c
ause
veh
icle
ope
rato
rs to
se
ek o
ut o
pera
ting
effi
cien
cies
(e
.g.,
ener
gy-s
avin
g ro
utin
g)
or to
redu
ce th
e vo
lum
e of
tr
ansp
orta
tion
act
ivit
y. T
he
resu
ltan
t low
erin
g of
the
fuel
co
st o
f tra
nspo
rtat
ion
may
le
ad to
som
e ad
diti
onal
trav
el
acti
vity
, off
sett
ing
a po
rtio
n of
the
ener
gy a
nd e
mis
sion
s sa
ving
s fr
om th
e in
crea
sed
vehi
cle
ener
gy a
nd e
mis
sion
s ef
ficie
ncy.
Vehi
cle
ener
gy a
nd e
mis
sion
s ef
ficie
ncy
stan
dard
s ar
e in
ef
fect
and
bei
ng ti
ghte
ned
for
cars
and
ligh
t tru
cks.
Whi
le
vehi
cles
in o
ther
mod
es a
re
cand
idat
es fo
r sta
ndar
ds,
inst
itut
ing
them
pre
sent
s te
chni
cal a
nd a
dmin
istr
ativ
e ch
alle
nges
.
Cont
inue
d ti
ghte
ning
of
stan
dard
s th
at y
ield
sm
alle
r re
duct
ions
in e
nerg
y us
e an
d em
issi
ons
will
test
con
sum
er
acce
ptan
ce. I
n th
e ab
senc
e of
hi
gher
fuel
pri
ces,
pur
chas
e in
cent
ive
prog
ram
s su
ch a
s fe
ebat
es m
ay b
e ne
eded
to
mot
ivat
e co
nsum
er in
tere
st
in h
ighe
r lev
els
of v
ehic
le
effic
ienc
y.
Vehi
cle
effic
ienc
y
stan
dard
s

Low
-car
bon
fuel
sta
ndar
ds
can
be a
pplie
d to
the
enti
re
tran
spor
tati
on fu
el s
uppl
y.
Thes
e m
easu
res
appl
y m
ainl
y to
trav
el in
met
ropo
li-ta
n ar
eas,
esp
ecia
lly b
y ca
rs
and
light
truc
ks. T
hey
have
lim
ited
app
licab
ility
to o
ther
m
odes
and
to tr
avel
in ru
ral
area
s.
The
mai
n ef
fect
of a
low
-car
bon
fuel
sta
ndar
d is
to re
duce
the
GH
Gs
gene
rate
d by
the
fuel
su
pply
(dur
ing
cons
umpt
ion
and
prod
uctio
n) b
y in
crea
sing
th
e de
man
d fo
r and
sup
ply
of
alte
rnat
ive
fuel
s. If
fuel
pric
es
incr
ease
as
a co
nseq
uenc
e, th
e st
anda
rds
will
als
o ca
use
som
e re
duct
ion
in tr
ansp
orta
tion
activ
ity a
nd g
reat
er in
tere
st in
en
ergy
-effi
cien
t veh
icle
s an
d op
erat
ions
.
The
mai
n ef
fect
of t
hese
pol
i-ci
es is
to re
duce
the
amou
nt
of e
nerg
y- a
nd e
mis
sion
s-in
tens
ive
tran
spor
tati
on
acti
vity
. The
y w
ould
nee
d to
be
acc
ompa
nied
by
othe
r po
licie
s, s
uch
as e
ffici
ency
st
anda
rds
and
fuel
taxe
s, to
af
fect
the
effic
ienc
y of
veh
icle
s an
d th
e G
HG
pro
file
of th
e fu
el
supp
ly.
The
pros
pect
s fo
r ear
ly
impl
emen
tati
on a
re u
ncle
ar
sinc
e th
ere
is li
mit
ed e
xper
i-en
ce w
ith
such
pro
gram
s. If
th
e st
anda
rds
rais
e th
e pr
ice
of
fuel
, as
wou
ld b
e ex
pect
ed, t
he
impl
emen
tati
on c
halle
nge
will
be
sim
ilar t
o th
at o
f rai
sing
fuel
ta
xes.
As
wit
h ot
her p
olic
ies
to c
ontr
ol G
HG
em
issi
ons,
the
abili
ty to
acc
ount
for a
nd v
erify
em
issi
ons
will
aff
ect i
mpl
e-m
enta
tion
pot
enti
al.
Bec
ause
land
use
pla
nnin
g an
d m
any
trav
el d
eman
d m
easu
res
are
trad
itio
nally
th
e re
spon
sibi
lity
of lo
cal
gove
rnm
ents
, sta
tes
will
like
ly
need
to ta
ke a
mor
e ac
tive
role
in
coo
rdin
atin
g an
d al
igni
ng
thes
e de
cisi
ons.
The
ear
ly
impl
emen
tati
on c
halle
nge
will
ent
ail e
stab
lishi
ng th
ese
stat
e an
d re
gion
al p
rogr
ams
to
influ
ence
and
coo
rdin
ate
loca
l de
cisi
ons.
Low
-car
bon
fuel
sta
ndar
ds
may
be
help
ful i
n at
trac
ting
an
d su
stai
ning
inve
stm
ent i
n al
tern
ativ
e fu
els,
pot
enti
ally
lo
wer
ing
the
cost
of s
uppl
ying
th
em o
ver t
ime.
If fu
el p
rice
s re
mai
n hi
gh a
s a
cons
eque
nce,
th
e ch
alle
nge
will
be
in m
ain-
tain
ing
publ
ic s
uppo
rt fo
r the
pr
ogra
m.
Bec
ause
the
built
env
iron
men
t ch
ange
s on
ly g
radu
ally
ove
r ti
me,
man
y de
cade
s w
ill b
e re
quir
ed fo
r lan
d us
e pl
an-
ning
to h
ave
nati
onal
eff
ects
on
tran
spor
tati
on e
nerg
y us
e an
d em
issi
ons.
Onc
e in
pla
ce,
how
ever
, a m
ore
com
pact
bui
lt
envi
ronm
ent m
ay h
ave
last
ing
impa
cts
on e
nerg
y us
e an
d em
issi
ons
and
alig
n w
ell w
ith
othe
r pol
icie
s su
ch a
s hi
gher
fu
el ta
xes.
Low
-car
bon
fuel
st
anda
rds
Land
use
con
trol
s an
d tr
avel
de
man
d
man
agem
ent
mea
sure
s
(con
tinu
ed o
n ne
xt p
age)

tabl
e 6-
1 (c
onti
nued
) S
cop
e, S
cale
, an
d T
imin
g of
Im
pac
ts o
f M
ajor
Pol
icy
Ap
pro
ach
es t
o R
edu
cin
g
Tran
spor
tati
on’s
Pet
role
um
Use
an
d G
HG
Em
issi
ons
S
cope
ofA
ppli
cati
ona
ndIm
pact
sTi
min
gan
dS
cale
ofI
mpa
cts
A
ppli
cabi
lity
Acr
oss
Pr
ospe
cts
for
Earl
y
Poli
cyA
ppro
ach
Tran
spor
tati
onM
odes
Im
pact
sa Po
licy
Impl
emen
tati
on
Sca
leo
fIm
pact
sb
App
licab
le to
all
mod
es in
w
hich
gov
ernm
ents
ow
n an
d op
erat
e th
e tr
ansp
orta
-ti
on in
fras
truc
ture
, suc
h as
th
e hi
ghw
ays,
air
way
s, a
nd
wat
erw
ays.
Inve
stm
ents
in tr
ansp
orta
-ti
on in
fras
truc
ture
can
mak
e op
erat
ions
mor
e ef
ficie
nt
in te
rms
of e
nerg
y us
e an
d em
issi
ons.
How
ever
, cap
acit
y-ex
pand
ing
inve
stm
ents
that
re
duce
the
fuel
and
tim
e co
st o
f tra
vel m
ay le
ad to
an
incr
ease
in to
tal t
rave
l act
ivit
y,
offs
etti
ng s
ome
of th
e en
ergy
an
d em
issi
ons
savi
ngs.
The
pros
pect
s fo
r ear
ly im
ple-
men
tati
on w
ill d
epen
d in
larg
e pa
rt o
n m
otiv
atio
ns o
ther
than
en
ergy
and
em
issi
ons
savi
ngs,
es
peci
ally
con
gest
ion
relie
f an
d sa
fety
enh
ance
men
t.
Bec
ause
add
ing
phys
ical
ca
paci
ty to
tran
spor
tati
on s
ys-
tem
s is
bec
omin
g m
ore
cost
ly
and
tim
e-co
nsum
ing,
the
mor
e lik
ely
inve
stm
ents
will
be
in m
easu
res
that
con
trol
tr
affic
and
allo
cate
use
of t
he
syst
ems
mor
e ef
fect
ivel
y.
Fund
amen
tal c
hang
es in
the
oper
atio
ns a
nd s
truc
ture
of t
he
tran
spor
tati
on s
yste
m, s
uch
as
thro
ugh
the
intr
oduc
tion
of t
he
Nex
t Gen
erat
ion
Air
Tra
nspo
r-ta
tion
Sys
tem
and
inte
llige
nt
tran
spor
tati
on s
yste
m te
ch-
nolo
gies
, cou
ld le
ad to
mor
e fa
r-re
achi
ng e
nerg
y an
d em
is-
sion
s be
nefit
s ov
er ti
me.
Publ
ic in
vest
men
ts
in in
fras
truc
ture
op
erat
ing
ef
ficie
ncie
s a Ab
ility
to a
ffec
t the
am
ount
of e
nerg
y-in
tens
ive
tran
spor
tati
on a
ctiv
ity,
the
effic
ienc
y of
veh
icle
s an
d th
eir o
pera
tion
s, a
nd th
e G
HG
pro
file
of th
e en
ergy
sup
ply.
b Pote
ntia
l to
gene
rate
larg
e en
ergy
and
em
issi
ons
savi
ngs
from
the
tran
spor
tati
on s
ecto
r ove
r the
nex
t 25
to 5
0 ye
ars.

Informing the Choices Ahead 187
the current focus on regulating vehicle and fuel suppliers will probably be required, including energy pricing. Although fuel taxes have long played a key role in financing the nation’s transportation infrastructure, their use for inducing energy conservation has not been tested in the United States. The resistance encountered by proposals to raise fuel taxes even slightly to pay for transportation infrastructure has produced skepticism about the prospects for energy pricing to have a meaningful role in the near to medium term. Because of such resistance, other forms of user pricing, such as areawide tolls and fees per mile driven, are being con-sidered to supplement or replace fuel taxes as methods of infrastructure financing. Although such user pricing may not promote energy diversi-fication and efficiency directly, it may prove more acceptable by helping to reduce traffic congestion. In a similar manner, making energy pricing more agreeable to consumers by providing something tangible in return may be essential in generating the broader acceptance needed to exploit this demand-oriented approach for reducing energy use and emissions. Innovative policy making may be required, such as providing consum-ers and businesses with rebates of the revenues generated by fuel taxes to counter the general resistance to higher energy prices.
In the right-hand columns of Table 6-1, policies are compared with respect to their prospects for early implementation and their potential for generating large energy and emissions savings over a span of 25 to 50 years. Gaining public acceptance is a challenge for all meaningful policies. Although vehicle and fuel standards have demonstrated such potential, at least in recent years, they too may need to be supplemented with pricing strategies, such as the vehicle feebate schemes examined in this report, to create and sustain a demand for more efficient vehicles and fuels.
Few of the policies examined in this report are likely to be adopted quickly or retained for long unless they promise to do more than reduce GHG emissions. For policy approaches to succeed, the public must ulti-mately be committed to reducing transportation energy use and emis-sions. Fundamental changes in the transportation sector are difficult to imagine in the absence of such public resolve. Interest in reducing dependence on petroleum, much of it supplied by politically unstable regions of the world, has been an important reason for the adoption of

188 Policy Options for Reducing Energy Use and Greenhouse Gas Emissions from U.S. Transportation
fuel economy standards, and this interest will continue to be a driving force behind the introduction of other policies aimed at curtailing trans-portation’s energy use. Other public interests must also be aligned with these goals. For example, investments in transportation infrastructure and operating practices that make the system more energy efficient will also be desirable to consumers if they reduce congestion and delays. The coordination of land use planning and transportation investments can similarly yield more effective and efficient energy-saving responses by consumers. Indeed, the introduction of fuel taxes and other pricing policies to stimulate consumer interest in saving energy would require infrastructure-related policies to be made compatible.
To achieve reductions in GHG emissions, a policy pathway that is both tactical and strategic is indicated. Having demonstrated their potential for implementation, vehicle efficiency standards, for example, may be desirable in slowing the rate of growth in energy use and emis-sions. However, such mode- and vehicle-specific policies will need to be succeeded by policies that can generate much larger systemic responses, such as those produced by energy pricing. The strategic challenge ahead will lie in structuring and gaining public acceptance of these more far-reaching policies. A convincing case for their importance will be required, as will the timely introduction of many complementary policies, such as infrastructure investments and land use planning, that will foster acceptance and facilitate a long-term energy- and emissions-saving response.
Research to Inform Strategic Policy Making
Although this study was not charged with developing a research agenda, the challenges discussed in the report clearly point to the long-term importance of making near- and medium-term policy choices on a well-informed, strategic basis. A policy-making approach that is strategic will require research that goes beyond the traditional role of supporting tech-nology advancement. A strong foundation of research will put elected officials in a better position to assess how alternative policies are likely to interact with one another, the lead times that specific measures will

Informing the Choices Ahead 189
require for maximum effectiveness, and the actions that will be needed to introduce and gain support for favored policies.
A recent Transportation Research Board report (TRB 2009) consid-ered the array of policy research that will be needed to inform decisions aimed at reducing emissions-intensive transportation activity, increasing the efficiency of vehicles and their operations, and furthering the demand for and supply of low-carbon energy sources. The report observed that as policy makers consider proposals intended to curb growth in passenger and freight activity, they will need fundamental information on the con-nections between transportation activity and economic productivity, such as the relative advantages of using fuel tax revenues to provide consumer rebates or invest in transportation alternatives. Understanding these con-nections will help ensure that policies are acceptable to the public and will provide insight into complementary actions that can increase policy acceptance. In addition, research can yield a stronger understanding of how policies to promote new energy and transportation technologies can affect petroleum prices, energy consumption, and GHG emissions in other parts of the world and other sectors of the economy such as manufacturing, construction, and agriculture.
Policy research and experimentation can also help in finding and exploiting ways to improve the energy performance of the transporta-tion operating environment. To date, research has been geared toward finding ways to increase vehicle efficiency through improved designs, materials, and technologies. Most of these vehicles, however, operate on transportation networks that are largely owned, operated, and main-tained by government agencies. For the energy-intensive long-distance modes such as freight truck and aviation, even marginal improvements in the efficiency of the nation’s publicly controlled highways and airways can have large impacts on total energy use and associated emissions. Research can reveal to transportation agencies the importance of mak-ing the operation of their networks more energy efficient and responsive to the needs of consumers faced with higher fuel taxes. It can reveal how other public policies, such as truck size and weight regulations, may affect the goal of reducing sector energy use and emissions. It can help in understanding how energy flows on a systemwide basis so that the

190 Policy Options for Reducing Energy Use and Greenhouse Gas Emissions from U.S. Transportation
impacts of mode-specific policies can be assessed. In this respect, state and local governments can provide test beds for energy- and emissions-saving public policies, with the federal government playing an impor-tant role in monitoring and evaluating the results.
Concluding Observations
Although the focus of this study has been on looking forward, much of what is assumed about the future of transportation is rooted in an under-standing of the past. Over the past 40 years, the transportation sector as a whole has made significant progress in reducing its energy use per unit of transportation output. These gains are a result of many factors, includ-ing technological advances, changes in the economics of the transporta-tion industry, and public policies and infrastructure investments. Many of these developments, including the role of new technologies, were not even anticipated a decade before they occurred, much less a half cen-tury in advance. The history of transportation also contains long periods in which the sector made little progress in reducing its energy demand, such as the period of declining fuel prices in the 1990s. A recognition of this history will help inform the development of energy and emissions policies that are realistic and responsive to changing conditions and circumstances.
Transportation’s future will undoubtedly differ from the projections offered in this report as information, communications, and other tech-nologies advance and as individual preferences and household demo-graphics change. A recent National Research Council report (NRC 2010) on strategies for limiting climate change advised that while policy approaches must be sustained for decades, they must also retain the abil-ity to adapt and respond to changing conditions and technologies and to the uncertainties about climate change risks and mitigation needs. For decades, there have been ample reasons for the public to care a great deal about saving energy in transportation—from the need to improve air quality to concern over the world’s oil supplies. Climate change has added to and elevated this public interest. Although calls for a strategic alignment of public policies to meet these interests are not new, they are becoming more urgent.

Informing the Choices Ahead 191
References
abbreviationsNRC National Research Council
TRB Transportation Research Board
NRC. 2010. Limiting the Magnitude of Future Climate Change. National Academies Press, Washington, D.C. http://www.nap.edu/catalog.php?record_id=12785.
TRB. 2009. Special Report 299: A Transportation Research Program for Mitigating and Adapting to Climate Change and Conserving Energy. Transportation Research Board of the National Academies, Washington, D.C. http://onlinepubs.trb.org/onlinepubs/sr/sr299.pdf.


193
appendix
Scientific Concern over Greenhouse Gas Buildup
Scientists have documented increasing concentrations of greenhouse gases (GHGs) in the atmosphere resulting from human activity. Con-centrations in terms of carbon dioxide equivalent values (CO2-eq) have increased from about 280 parts per million by volume (ppmv) in 1750 to be about 390 ppmv today, with most of the growth coming from the burning of fossil fuels and deforestation.1 Scientists have also connected the GHG buildup to rising global temperatures, the melting of terrestrial snow and ice, and rising sea level (Parry et al. 2007).
International policy goals for limiting climate change were established in 1992 under the United Nations Framework Convention on Climate Change, in which the United States and more than 190 other nations set the goal of “stabilization of GHG concentrations in the atmosphere at a level that would prevent dangerous anthropogenic interference with the climate system.” Subsequent scientific research has sought a better understanding and quantification of the links among GHG emissions, atmospheric GHG concentrations, changes in global climate, and the impacts of those changes on human and environmental systems.
The United Nations Intergovernmental Panel on Climate Change (IPCC) has examined a range of reduction pathways leading to GHG concentrations stabilizing at different levels and over different time frames, each associated with different types and magnitudes of climate
1 http://www.esrl.noaa.gov/gmd/ccgg/trends/.

194 Policy Options for Reducing Energy Use and Greenhouse Gas Emissions from U.S. Transportation
impacts. The uncertainties in scientific understanding of the world’s climate system render exact relationships between GHG atmospheric concentrations and temperature changes impossible to define. Linking global temperature change with a target GHG concentration involves a number of physical processes that are not fully understood, and thus there is uncertainty surrounding this linkage. The most recent Synthe-sis Report of IPCC (IPCC 2007) indicates that global GHG concentrations may need to be limited to around 450 ppmv CO2-eq to keep global tem-peratures, within a reasonable likelihood, from rising more than 2°C.2 A higher emissions target of 550 ppmv CO2-eq is associated with a 3°C increase in temperature. The IPCC report recognizes that such concen-trations could be associated with temperature changes that are well above or below these figures.
The stabilization range of 450 to 550 ppmv CO2-eq has been exten-sively analyzed by the scientific and economic communities and is a focus of international climate policy forums. To stabilize atmospheric concentrations of CO2-eq at or below 450 ppmv by 2050 implies that global cumulative worldwide emissions must not exceed about 650 giga-tons (Gt) over the next 40 years (Meinshausen et al. 2009). Determining what U.S. emissions allocations are consistent with achieving this global mitigation goal is complicated by a range of uncertainties, including the degree of international action and the many forces that will influence global emissions over a period of decades such as changes in popula-tion, economic development, and technology. The recent Stanford Uni-versity Energy Modeling Forum Study 22 (EMF-22)3 used many of the nation’s leading integrated assessment models to explore the relationship between global and regional GHG emissions reduction and long-term climate goals. The EMF-22 model runs suggest that the equivalent U.S. share of required global emissions reduction needed to stabilize concen-trations at 450 ppmv CO2-eq corresponds roughly to reducing 2050 U.S. emissions to 80 percent below current levels (if emissions are reduced at a linear rate over 40 years). In comparison, the higher emissions tar-
2 GHGs are not the only anthropogenic influence on global temperatures. Others are surface albedo changes and aerosols.3 See http://emf.stanford.edu/research/emf22/ and Clarke et al. 2009.

Scientific Concern over Greenhouse Gas Buildup 195
get of 550 ppmv CO2-eq, associated with a 3°C increase in temperature, would require roughly a 50 percent reduction in annual emissions by 2050 (Fawcett et al. 2009; Paltsev et al. 2007).
The EMF-22 linear paths to stabilize concentrations at 450 or 550 ppmv correspond to a cumulative U.S. CO2-eq emissions “budget” for the next 40 years of about 167 Gt and 203 Gt, respectively, as shown in Figure A-1.4 To meet the 167-Gt budget would require that emissions be 80 percent lower in 2050 than they are today. They would drop from 7.1 Gt CO2-eq per year to about 1.1 Gt CO2-eq per year. The pursuit of a less stringent 203 Gt budget (with the accompanying greater risk of a higher global temperature) would require that annual U.S. emissions be
4 These estimates are based on a “least cost” model calculation for distributing emissions reduction burdens among countries. The question of what constitutes a fair share of emissions reductions for the United States involves numerous economic, scientific, political, and ethical considerations. The estimates assume full international participation in emissions reductions. Without significant international participation, the United States will have to do more to reach any long-term emissions reduction goal.
287 GtCO2eIf current emissions stabilize,leading to concentrations > 600 ppmv
203 GtCO2eNeeded to achieve atmosphericconcentration of 550 ppmv
167 GtCO2eNeeded to achieve atmosphericconcentration of 450 ppmv 0
1,000
2,000
3,000
4,000
5,000
6,000
7,000
8,000
9,000
10,000
1990 2010 2030 2050
Ann
ual U
.S. e
mis
sion
s (M
tCO
2e)
Recent trend
2012
Cumulative emissions2012 to 2050
figure a-1
U.S. emissions budgets to achieve stability in atmospheric concentrations of CO2-eq.
1 Gt = 1,000 million metric tons.
Source: Fawcett et al. 2009; Clarke et al. 2009.

196 Policy Options for Reducing Energy Use and Greenhouse Gas Emissions from U.S. Transportation
reduced by about 50 percent by 2050. Because of the long-lived nature of most GHGs, even zero growth in CO2-eq emissions would lead to atmo-spheric concentrations in excess of 600 ppmv by 2050, which would risk temperature increases exceeding 3°C.5
Even stabilizing emissions at current levels for the next four decades presents difficult challenges because of expected increases in population and economic development. The rapid growth in energy use in large industrializing countries such as China and India will be critical to the prospects for stabilization. Even today, as one of the largest individual emitters of GHGs, the United States cannot substantially reduce global emissions. The EMF-22 results indicate that atmospheric GHG concen-trations can only be kept below 450 ppmv CO2-eq if the United States and other high-income countries, along with China, India, and many other low- and middle-income countries, take aggressive mitigation measures.
References
abbreviationIPCC Intergovernmental Panel on Climate Change
Clarke, L., J. Edmonds, V. Krey, R. Richels, S. Rose, and M. Tavoni. 2009. International Climate Policy Architectures: Overview of the EMF 22 International Scenarios. Energy Economics, Vol. 31 (Supplement 2), pp. S64–S81.
Fawcett, A. A., K. V. Calvin, F. C. de la Chesnaye, J. M. Reilly, and J. P. Weyant. 2009. Overview of EMF 22 U.S. Transition Scenarios. Energy Economics, Vol. 31, pp. S198–S211. http://emf.stanford.edu/files/res/2369/fawcettOverview22.pdf.
IPCC. 2007. Climate Change 2007: Synthesis Report. Contribution of Working Groups I, II and III to the Fourth Assessment Report of the Intergovernmental Panel on Climate Change. Geneva.
Meinshausen, M., N. Meinshausen, W. Hare, S. C. B. Raper, K. Frieler, R. Knutti, D. J. Frame, and M. R. Allen. 2009. Greenhouse-Gas Emission Targets for Limit-ing Global Warming to 2°C. Nature, Vol. 458, pp. 1158–1162. http://www.nature.com/nature/journal/v458/n7242/full/nature08017.html.
5 As mentioned above, these emission budgets are for gross emissions in the United States and do not include sources and sinks from land use, land use change, and forestry. If these factors contribute to net emissions, attaining the budgets will be more difficult. If they act as net sinks, which is the current trend, attaining the budgets will be somewhat easier.

Scientific Concern over Greenhouse Gas Buildup 197
Paltsev, S., J. M. Reilly, H. D. Jacoby, A. C. Gurgel, G. E. Metcalf, A. P. Sokolov, and J. F. Holak. 2007. Assessment of U.S. Cap-and-Trade Proposals. National Bureau of Economic Research, Cambridge, Mass.
Parry, M. L., O. F. Canziani, J. P. Palutikof, P. J. van der Linden, and C. E. Hanson (eds.). 2007. Contribution of Working Group II to the Fourth Assessment Report of the Intergovernmental Panel on Climate Change. Cambridge University Press, Cambridge, United Kingdom. http://www.cambridge.org/features/earth_ environmental/climatechange/wg2.htm.


199199
Study Committee Biographical Information
Emil H. Frankel, Chair, is the Director of Transportation Policy for the Bipartisan Policy Center in Washington, D.C., and an independent con-sultant on transportation policy and public management issues. He was a Principal Consultant of Parsons Brinckerhoff, the international engi-neering and consulting firm, from 2005 to 2007. From 2002 to 2005, he was Assistant Secretary for Transportation Policy of the U.S. Department of Transportation. In this position, he played a key role in the coordina-tion and development of the Bush administration’s proposal to reautho-rize the federal highway, transit, and highway safety programs. He also provided policy leadership in such areas as intermodal freight transpor-tation, reform of the nation’s intercity passenger rail system, transporta-tion project financing, and the application of information technologies to transportation systems operations. From 1991 to 1995, he was Commis-sioner of the Connecticut Department of Transportation, and from 1995 to 2001 he was Of Counsel to Day, Berry and Howard (now Day Pitney) in the law firm’s office in Stamford, Connecticut. At various times, he held appointments as Visiting Lecturer at both the Yale School of Man-agement and the Yale School of Forestry and Environmental Studies, where he taught on issues of transportation, energy, environmental pol-icy, and public management. In 1995 he was a Joint Fellow of the Center for Business and Government and of the Taubman Center for State and Local Government at Harvard University’s John F. Kennedy School of Government. From 1981 to 1984 and from 1985 to 1997 he was a Trustee

200 Policy Options for Reducing Energy Use and Greenhouse Gas Emissions from U.S. Transportation
of Wesleyan University, where he is now a Trustee Emeritus. Mr. Frankel received his bachelor’s degree from Wesleyan University and his LLB from Harvard Law School, and he was a Fulbright Scholar at Manchester University in the United Kingdom.
Victoria Arroyo is Executive Director of the Georgetown University Cli-mate Center and Visiting Professor of Law. Before joining the Climate Center in 2008, she was Director of Policy Analysis for the Pew Center on Global Climate Change, a position she held since the center’s incep-tion in 1998. In that capacity, she directed the center’s domestic program, developing policy positions and overseeing analytical work on domes-tic policy issues, economics, and environmental impacts. She practiced environmental law in the firm Kilpatrick Stockton from 1994 to 1998 and previously worked for the U.S. Environmental Protection Agency (EPA) overseeing the development of air toxics standards in the Office of Air and Radiation and reviewing development of criteria air pollutant regu-lations in the Office of Research and Development. From 1988 to 1991, she was the Director of Policy Analysis for the Louisiana Department of Environmental Quality and served as the Governor’s Environmen-tal Adviser. She has written extensively on issues of climate policy and serves on the Editorial Board of the Climate Policy Journal. She was Man-aging Editor of the Pew Center’s book Climate Change: Science, Strate-gies, and Solutions. She has previously taught courses in environmental policy and climate change at Catholic University of America and George Mason University’s School of Public Policy. Ms. Arroyo received a BS from Emory University, an MPA from Harvard University, and a JD from Georgetown University Law Center.
George C. Eads is retired Vice President of Charles River Associates (CRA), Inc. Before joining CRA in 1995, he held several positions at General Motors Corporation, including Vice President and Chief Economist, Vice President of Worldwide Economics and Market Analysis, and Vice Presi-dent of Product Planning and Economics. Before joining General Motors, he was Dean of the School of Public Affairs at the University of Maryland, College Park. He served as a Member of President Carter’s Council of Eco-nomic Advisors. He has been involved in numerous projects concerning

Study Committee Biographical Information 201
transportation and energy. He was a member of President Clinton’s pol-icy dialogue on reducing greenhouse gas emissions from personal motor vehicles and coauthored the World Energy Council’s 1998 report Global Transport and Energy Development: The Scope for Change. In recent years, he has devoted much of his time to the World Business Council for Sus-tainable Development’s Sustainable Mobility Project, which is funded and carried out by 12 leading international automotive and energy companies. He was lead consultant during the latter stages of the project and drafted its final report, Mobility 2030: Meeting the Challenges to Sustainability. He is a member of the National Research Council’s (NRC’s) Committee on America’s Climate Choices and served on the project’s panel on mitigat-ing climate change. He is an at-large Director of the National Bureau of Economic Research and a member of the Presidents’ Circle at the National Academies. Dr. Eads received a PhD in economics from Yale University.
John M. German is Senior Fellow at the International Council for Clean Transportation (ICCT), a position he has held since 2008. Before join-ing ICCT, he was Manager of Environmental and Energy Analysis for American Honda Motor Company, which he joined in 1998. He has been active in the field of advanced technology for fuel economy since begin-ning his career with Chrysler in 1977. At Chrysler, he spent 8 years in the Powertrain Engineering division working primarily on technologies for improved fuel economy. After leaving Chrysler, he worked for 13 years conducting research in support of regulations at EPA’s Office of Mobile Sources laboratory in Ann Arbor, Michigan. He has authored numerous technical papers and a Society of Automotive Engineers (SAE) book on hybrid gasoline–electric vehicles. He was the first recipient of the Barry D. McNutt award, presented annually by SAE for excellence in auto-motive policy analysis. Mr. German received a BS in physics from the University of Michigan.
Lance R. Grenzeback is Senior Vice President at Cambridge Systematics, Inc., a transportation management consulting firm specializing in transpor-tation policy, planning, and economics. For the Federal Highway Admin-istration, he played a lead role in the development of the Freight Analysis Framework, the first comprehensive assessment of national truck, rail, and

202 Policy Options for Reducing Energy Use and Greenhouse Gas Emissions from U.S. Transportation
waterborne freight flows and the economic benefits of freight systems. He helped develop the Intelligent Transportation Systems Commercial Vehicle Operations Program and the Commercial Vehicle Information Systems and Networks Program for the U.S. Department of Transportation. Mr. Grenze-back was the lead author of the American Association of State Highway and Transportation Officials’ Freight Transportation Bottom Line Reports, which cover freight demand and logistics, highway freight, rail freight, and water-borne freight. For the Association of American Railroads and the National Surface Transportation Policy Commission, he led the National Rail Freight Infrastructure Capacity and Investment Study, a landmark assessment of the long-term capacity expansion needs of the continental U.S. freight railroads. He directed the U.S. Chamber of Commerce’s report on Future Highway and Public Transportation Finance. Mr. Grenzeback has served on two Trans-portation Research Board (TRB) standing committees (the Urban Freight Transportation Committee and the Regional Transportation Systems Man-agement and Operations Committee) and on special committees (the Com-mittee for a Future Strategy for Transportation Information Management and the Committee on Strategies for Improved Passenger and Freight Travel Data). Mr. Grenzeback holds a bachelor’s degree in government and a mas-ter’s degree in city planning and economics, both from Harvard.
Anthony D. Greszler is Vice President for Advanced Engineering at Volvo Powertrain North America, where he has worked since 2001. He is responsible for powertrain concept development for Mack and Volvo Trucks North America. Previous responsibilities included development of the Mack ETECH, ASET, and E7 natural gas engine and development of new engines to meet U.S. 2007 and 2010 emissions requirements. Before joining Volvo, he worked for Cummins Engine Company for 24 years on the design and development of heavy-duty diesel engines, including 2 years in Europe on N14 and L10 engines and 8 years as M11 and natural gas engine chief engineer. He serves on the Executive Committee of the Engine Manufacturers Association. He has appeared at numerous con-ferences on heavy-duty diesel engine emissions and efficiency improve-ment, commercial truck fuel efficiency, and carbon dioxide reduction in truck transport. Mr. Greszler has a BS and an MS in mechanical engi-neering from Case Western Reserve University.

Study Committee Biographical Information 203
W. Michael Hanemann is Chancellor’s Professor of Environmental and Resource Economics in the Department of Agricultural and Resource Economics, University of California, Berkeley, where he has been on the faculty since 1976. His research has focused on aspects of modeling indi-vidual choice behavior with applications to demand forecasting, envi-ronmental regulation, and economic valuation. He is a leading authority on the methodology of nonmarket valuation using techniques of both revealed and stated preference and has written extensively on measuring and valuing environmental preferences. He has worked extensively on the economics of water resources and the economics of climate change. He has served on the NRC Planning Committee for the Potential Impacts of Climate Change on Human Health and the Committee on Prospective Benefits of U.S. Department of Energy’s (DOE’s) Energy Efficiency and Fossil Energy R&D Programs. Dr. Hanemann received a BS from Oxford University, an MS in economics from the London School of Economics, an MA in public finance and decision theory from Harvard University, and a PhD in economics from Harvard University.
Henry Lee is Lecturer in Public Policy and the Jassim Jaidah Director of the Environment and Natural Resources Program in the Belfer Center for Science and International Affairs, John F. Kennedy School of Govern-ment, Harvard University. He is cochair of the school’s Program on Infra-structure in a Market Economy and coprincipal investigator of the Energy, Technology, and Policy Project. Before joining JFK, he spent 9 years as Director of the Massachusetts Energy Office and Special Assistant to the Governor for Environmental Policy. He has served on numerous state, fed-eral, and private advisory committees and boards focusing on both energy and environmental issues. His recent research interests focus on environ-mental management, energy policy, climate change, the geopolitics of oil and gas, and public infrastructure projects in developing countries. He has recently written several articles on China’s oil strategies and coauthored the discussion paper “Policy Options for Reducing Oil Consumption and Greenhouse-Gas Emissions from the U.S. Transportation Sector.”
Virginia McConnell is Senior Fellow in the Quality of the Environ-ment Division of Resources for the Future, Inc. She is also a Professor

204 Policy Options for Reducing Energy Use and Greenhouse Gas Emissions from U.S. Transportation
of Economics at the University of Maryland, Baltimore County. Her recent work has centered on the evaluation of policies to reduce motor vehicle pollution, including the analysis of inspection and maintenance programs, old-car scrap programs, and emissions taxes. She is a mem-ber of the EPA Advisory Council on Clean Air Compliance Analysis and has served on several other EPA advisory committees. She has analyzed market-based policies for improving land use and the impact of envi-ronmental regulations on industry productivity. She served on the NRC Committee on Vehicle Emission Inspection and Maintenance Programs and the Committee on State Practices in Setting Mobile Source Emis-sions Standards. Dr. McConnell received a BS in economics from Smith College and a PhD in economics from the University of Maryland.
Donald L. Paul is the Executive Director of the University of Southern Cali-fornia (USC) Energy Institute, where he also holds the William M. Keck Chair in Energy Resources. The USC Energy Institute was launched in 2008 to create a university-based framework to support and expand opportu-nities in energy-related research and education, energy system and infra-structure demonstrations, and public policy development. Before joining the faculty of USC, he served as Vice President and Chief Technology Offi-cer at Chevron. During 33 years at Chevron, he held a variety of positions in research and technology, exploration and production operations, and exec-utive management, including service as president of Chevron’s Canadian subsidiary. In 2010, he was appointed to the National Petroleum Council and the Schlumberger Limited Technology Committee. He continues to serve on a number of university and public- and private-sector advisory boards and committees and holds an appointment as Senior Advisor for the Center for Strategic and International Studies. Dr. Paul was recently recog-nized for his career contributions as a recipient of the USC Viterbi School of Engineering’s Distinguished Service Award and an honorary doctorate of engineering from the Colorado School of Mines. He earned a BS in applied mathematics, a master’s degree in geology and geophysics, and a PhD in geophysics, all from the Massachusetts Institute of Technology.
John M. Samuels, Jr. (Member, National Academy of Engineering), is President of Revenue Variable Engineering, LLC, and former Senior Vice

Study Committee Biographical Information 205
President for Operations, Planning, and Support, Norfolk Southern Rail-way. He previously served as Vice President for Operations Planning and Budget at Norfolk Southern and Vice President of Operating Assets for Conrail. He was on the Pennsylvania State University industrial engi-neering faculty from 1968 until 1978, when he joined Conrail as a direc-tor of shop industrial engineering with responsibility for continuous quality improvement, engineering, mechanical operations, and operat-ing assets. He joined Norfolk Southern Railroad in 1998. He served as chair of the North American Railway Technology Working Committee and the North American Joint Positive Train Control Project. He was a member of the TRB Executive Committee from 1998 to 2003, chaired the Executive Committee in 2001, and has been a member of the Council of Industrial Engineering of the Institute of Industrial Engineers since 1982. He was elected to the National Academy of Engineering in 1996, cited for engineering and leadership in system revitalization of rail freight trans-portation. Dr. Samuels received a BS from the GMI Engineering and Management Institute (now Kettering University) and an MS and a PhD from the Pennsylvania State University.
Daniel Sperling is Professor of Civil Engineering and Environmental Science and founding Director of the Institute of Transportation Studies at the University of California, Davis, where he has been a member of the faculty since 1982. He is a member of the California Air Resources Board and an expert on transportation technology assessment, energy and environmental aspects of transportation, and transportation pol-icy. He has authored or coauthored more than 150 technical papers and reports on policy and analytic aspects of alternative automotive propulsion systems. He has served on numerous NRC committees and was founding chair of the TRB Committee on Alternative Transporta-tion Fuels. He authored the book Two Billion Cars and coedited Driving Climate Change: Cutting Carbon from Transportation. He is a contribu-tor to Working Group III of the Intergovernmental Panel on Climate Change and was a lead author of Chapter 5, Transport and Its Infrastruc-ture, in the Fourth Assessment Report: Mitigation of Climate Change. In 2010, Dr. Sperling was awarded the 16th annual Heinz Award from the Theresa Heinz and Heinz Family Foundation in honor of his career

206 Policy Options for Reducing Energy Use and Greenhouse Gas Emissions from U.S. Transportation
achievements in research into alternative transportation fuels and his responsibility for the adoption of cleaner transportation policies in Cal-ifornia and across the United States. Dr. Sperling received a BS from Cornell University and a PhD in transportation engineering from the University of California, Berkeley.
Brian D. Taylor is Professor and Chair of the Department of Urban Planning and Director of the Institute of Transportation Studies at the University of California, Los Angeles (UCLA). His research centers on transportation policy and planning, with a focus on the politics of transportation finance, including the history of freeway planning and finance; equity in highway pricing and finance; and the pricing, finance, and performance of public transit systems. His research also examines travel behavior, including the effects of congestion on travel choices, cog-nitive mapping, the burdens of transferring among modes, and patterns of driving and public transit use by those with limited access to private vehicles. Most recently he has examined the effects of external forces—terrorism threats, popular discontent with congestion, global climate change, and so forth—on transportation policy and planning. He holds a BA in geography from UCLA, an MS in civil engineering and MCP in City and Regional Planning from the University of California, Berkeley, and a PhD in urban planning from UCLA. He is a member of the Ameri-can Institute of Certified Planners.
Kathleen C. Taylor (Member, National Academy of Engineering) is retired Director of the Materials and Processes Laboratory of General Motors Corporation. In that position she oversaw the research conducted by more than 100 engineers and scientists in the fields of polymer composites, paint systems, metallurgy, corrosion, protective and wear-resistant coatings, tri-bology, light metals, magnetics, and optical materials. She was simultane-ously Chief Scientist for General Motors of Canada, Ltd. Earlier, she was Department Head for Physics and Physical Chemistry and Department Head for Environmental Sciences. She serves on the Board of Directors of the National Inventors Hall of Fame, the DOE Hydrogen and Fuel Cell Technical Advisory Committee, and the DOE Basic Energy Sciences Advi-sory Committee. She was awarded the Garvan Medal from the American

Study Committee Biographical Information 207
Chemical Society. She was elected to the National Academy of Engineer-ing in recognition of her contributions to the development of automotive-exhaust catalytic systems and leadership in battery materials and fuel cell research. She is a fellow of SAE International and a foreign member of the Indian National Academy of Engineering. She has been president of the Materials Research Society and chair of the board of directors of the Gor-don Research Conferences. She served on NRC’s Committee for a Review of the FreedomCAR and Fuel Research Program and was a member of the Board on Energy and Environmental Systems. Dr. Taylor received an AB in chemistry from Douglass College and a PhD in physical chemistry from Northwestern University.
Ian A. Waitz is the Jerome C. Hunsaker Professor in the Department of Aeronautics and Astronautics at the Massachusetts Institute of Technol-ogy (MIT) and Director of the Partnership for Air Transportation Noise and Emissions Reduction. His principal area of interest is the modeling and evaluation of climate, local air quality, and noise impacts of aviation, including assessment of technological, operational, and policy options for mitigating these impacts. He has written more than 60 technical pub-lications in his field, including a report to Congress on aviation and its impacts on the environment. He holds three patents and has consulted for many organizations. From 2002 to 2005 he served as Deputy Head of the Department of Aeronautics and Astronautics. He is a Fellow of the American Institute of Aeronautics and Astronautics (AIAA) and has served as an editor for the AIAA’s Journal of Propulsion and Power. He was awarded the Federal Aviation Administration 2007 Excellence in Avia-tion Research Award. He was honored with the 2002 MIT Class of 1960 Innovation in Education Award and an appointment as an MIT MacVicar Faculty Fellow in 2003. He is a member of NRC’s Steering Committee on Technology for a Quieter America. Dr. Waitz received a BS from the Pennsylvania State University, an MS from George Washington Univer-sity, and a PhD from the California Institute of Technology.
James J. Winebrake is Professor and Dean of the College of Liberal Arts at the Rochester Institute of Technology (RIT). His has published exten-sively on alternative fuels and transportation technologies, including

208 Policy Options for Reducing Energy Use and Greenhouse Gas Emissions from U.S. Transportation
emissions characteristics of alternative fuels, life-cycle analysis, technol-ogy forecasting and assessment, and environmental impacts of freight. He is also Director of the University–National Park Energy Partnership Pro-gram and Co-Director of the RIT Laboratory for Environmental Comput-ing and Decision Making. Before joining the faculty of RIT in 2002, he was Associate Professor in the Integrated Science and Technology Depart-ment of James Madison University (JMU). Concurrent with his position at JMU, he held a special term appointment as an energy systems analyst at Argonne National Laboratory in the Energy Systems Division of the Center for Transportation Research. From 1993 to 1995, he was a policy specialist in the U.S. Department of Energy, Office of Energy Efficiency and Renewable Energy. He holds a BS in physics from Lafayette Col-lege, an MS in technology and policy from the Massachusetts Institute of Technology, and a PhD in energy management and policy from the University of Pennsylvania.


TransporTaTion research Board2011 execuTive commiTTee*
chair: neil J. pedersen, Consultant, Silver Spring, Marylandvice chair: sandra rosenbloom, Professor of Planning, University of Arizona, Tucsonexecutive director: robert e. skinner, Jr., Transportation Research Board
J. Barry Barker, Executive Director, Transit Authority of River City, Louisville, Kentuckydeborah h. Butler, Executive Vice President, Planning, and CIO, Norfolk Southern Corporation, Norfolk, VirginiaWilliam a. v. clark, Professor, Department of Geography, University of California, Los Angeleseugene a. conti, Jr., Secretary of Transportation, North Carolina Department of Transportation, RaleighJames m. crites, Executive Vice President of Operations, Dallas–Fort Worth International Airport, Texaspaula J. hammond, Secretary, Washington State Department of Transportation, Olympiamichael W. hancock, Secretary, Kentucky Transportation Cabinet, Frankfortadib K. Kanafani, Cahill Professor of Civil Engineering, University of California, Berkeley (Past Chair, 2009)michael p. Lewis, Director, Rhode Island Department of Transportation, Providencesusan martinovich, Director, Nevada Department of Transportation, Carson CityJoan mcdonald, Commissioner, New York State Department of Transportation, Albanymichael r. morris, Director of Transportation, North Central Texas Council of Governments, Arlington (Past Chair, 2010)Tracy L. rosser, Vice President, Regional General Manager, Wal-Mart Stores, Inc., Mandeville, Louisianasteven T. scalzo, Chief Operating Officer, Marine Resources Group, Seattle, Washingtonhenry G. (Gerry) schwartz, Jr., Chairman (retired), Jacobs/Sverdrup Civil, Inc., St. Louis, MissouriBeverly a. scott, General Manager and Chief Executive Officer, Metropolitan Atlanta Rapid Transit Authority,
Atlanta, Georgiadavid seltzer, Principal, Mercator Advisors LLC, Philadelphia, PennsylvaniaLawrence a. selzer, President and CEO, The Conservation Fund, Arlington, VirginiaKumares c. sinha, Olson Distinguished Professor of Civil Engineering, Purdue University, West Lafayette, IndianaThomas K. sorel, Commissioner, Minnesota Department of Transportation, St. Pauldaniel sperling, Professor of Civil Engineering and Environmental Science and Policy; Director, Institute of Trans-
portation Studies; and Interim Director, Energy Efficiency Center, University of California, DavisKirk T. steudle, Director, Michigan Department of Transportation, Lansingdouglas W. stotlar, President and Chief Executive Officer, Con-Way, Inc., Ann Arbor, Michiganc. michael Walton, Ernest H. Cockrell Centennial Chair in Engineering, University of Texas, Austin (Past Chair, 1991)
peter h. appel, Administrator, Research and Innovative Technology Administration, U.S. Department of Transportation (ex officio)
J. randolph Babbitt, Administrator, Federal Aviation Administration, U.S. Department of Transportation (ex officio)rebecca m. Brewster, President and COO, American Transportation Research Institute, Smyrna, Georgia (ex officio)anne s. Ferro, Administrator, Federal Motor Carrier Safety Administration, U.S. Department of Transportation (ex officio)Leroy Gishi, Chief, Division of Transportation, Bureau of Indian Affairs, U.S. Department of the Interior, Washington,
D.C. (ex officio)John T. Gray, Senior Vice President, Policy and Economics, Association of American Railroads, Washington,
D.C. (ex officio)John c. horsley, Executive Director, American Association of State Highway and Transportation Officials, Washington,
D.C. (ex officio)david T. matsuda, Deputy Administrator, Maritime Administration, U.S. Department of Transportation (ex officio)victor m. mendez, Administrator, Federal Highway Administration, U.S. Department of Transportation (ex officio)William W. millar, President, American Public Transportation Association, Washington, D.C. (ex officio) (Past
Chair, 1992)Tara o’Toole, Under Secretary for Science and Technology, U.S. Department of Homeland Security (ex officio)robert J. papp (Adm., U.S. Coast Guard), Commandant, U.S. Coast Guard, U.S. Department of Homeland Security
(ex officio)cynthia L. Quarterman, Administrator, Pipeline and Hazardous Materials Safety Administration, U.S. Department of
Transportation (ex officio)peter m. rogoff, Administrator, Federal Transit Administration, U.S. Department of Transportation (ex officio)david L. strickland, Administrator, National Highway Traffic Safety Administration, U.S. Department of Transportation
(ex officio)Joseph c. szabo, Administrator, Federal Railroad Administration, U.S. Department of Transportation (ex officio)polly Trottenberg, Assistant Secretary for Transportation Policy, U.S. Department of Transportation (ex officio)robert L. van antwerp (Lt. General, U.S. Army), Chief of Engineers and Commanding General, U.S. Army Corps of
Engineers, Washington, D.C. (ex officio)Barry r. Wallerstein, Executive Officer, South Coast Air Quality Management District, Diamond Bar, California
(ex officio)
*Membership as of September 2011.

America’s Climate Choices: Five-Book SetAmerica’s Climate Choices: Final Report, Advancing the Science of Climate Change, Adapting to the Impacts of Climate Change, Informing an Effective Response to Climate Change, and Limiting the Magnitude of Future Climate Change National Academies Press, ISBN 978-0-309-21532-9, 5-volume set, 7 × 10, paperback, 2010–2011, $183.80
Adapting Transportation to the Impacts of Climate Change: State of the Practice 2011Transportation Research E-Circular E-C152, 64 pages, 8.5 × 11, electronic, 2011, www.trb.org/Environment/Blurbs/165529.aspx
Representing Freight in Air Quality and Greenhouse Gas ModelsNational Cooperative Freight Research Program Report 4, ISBN 978-0-309-15481-9, 162 pages, 8.5 × 11, paperback, 2010, $62.00
Current Practices in Greenhouse Gas Emissions Savings from TransitTransit Cooperative Research Program Synthesis 84, ISBN 978-0-309-14303-5, 77 pages, 8.5 × 11, paperback, 2010, $49.00
Modal Primer on Greenhouse Gas and Energy Issues for the Transportation IndustryTransportation Research E-Circular E-C143, 78 pages, 8.5 × 11, electronic, 2010, www.trb.org/Environment/Blurbs/163289.aspx
A Transportation Research Program for Mitigating and Adapting to Climate Change and Conserving EnergySpecial Report 299, ISBN 978-0-309-14275-5, 120 pages, 6 × 9, paperback, 2009, $35.00
Driving and the Built Environment: Effects of Compact Development on Motorized Travel, Energy Use, and CO2 Emissions Special Report 298, ISBN 978-0-309-14255-7, 239 pages, 6 × 9, paperback, 2009, $37.00
Potential Impacts of Climate Change on U.S. TransportationSpecial Report 290, ISBN 978-0-309-11306-9, 280 pages, 6 × 9, paperback, 2008, $37.00
Also of Interest
policy o
ptions fo
r reducing energy use and greenho
use gas emissio
ns from
u.s. transportatio
ns
pecia
l rep
or
t 30
7
Policy Options for Reducing Energy Use and
Greenhouse Gas Emissions from U.S. Transportation
special report 307Policy Options for Reducing Energy Use and Greenhouse Gas Emissions from U.S. Transportation
Saving energy in transportation can have important implications for the cost of securing the world’s oil supplies, since transportation accounts for most of the petroleum consumed in the United States. It can also help with controlling the buildup of greenhouse gases, which will require major reductions in carbon dioxide emissions from economic sectors that are heavy users of carbon-rich fossil fuels.
This report examines the potential for policies to yield major changes in transportation energy use and emissions trends. Policy measures targeting cars and light trucks, medium and heavy trucks, and commercial airliners are considered. These three modes are by far the largest users of energy within U.S. transportation because they account for the vast majority of passenger trips and freight.
ISBN 978-0-309-16742-0
9 780309 167420
9 0 0 0 0


