Special Education Finance 101...Special Education Finance 101 Nan Records Regional Low Incidence...
91
Special Education Finance 101 Nan Records Regional Low Incidence Facilitator December 2018
Transcript of Special Education Finance 101...Special Education Finance 101 Nan Records Regional Low Incidence...

Special Education Finance 101
Nan Records Regional Low Incidence Facilitator December 2018

Special Education Finance 101

Part B Federal Flow-Through 3-21
Preschool Incentive 3-5
Part C Infants and Toddlers Birth-2

• Part B (3-21 year olds) AKA….419 AKA….Section 611 AKA….Federal Flow Through
• Part C (3-5 year olds) AKA….420 AKA….Section 619 AKA….Preschool Incentive
• Part C (Birth-2 year olds) AKA….422 AKA….Section 619 AKA….Infant and Toddlers

Number of students in special ed (Base)
Total District Enrollment
Total number of students on free and reduced
FEDERAL FLOW-THROUGH 3-21
Total Fin 419 Allocation

Searching for Federal Allocations

Data Center > Data Reports and Analytics > School Finance Spreadsheets > Special Education …

Data Center > Data Reports and Analytics > School Finance Spreadsheets > Special Education … Special Education, Federal Allocations, 2017

Other “optional” sources
Coordinated Early Intervening Services CEIS

Coordinated Early Intervening Services
CEIS LEAs can use up to 15% of their federal $$ (419) to fund programs to prevent students from having to be placed into special education …Providing educational and behavioral interventions services and supports… ….These are NOT additional $$$...it’s an option to use part of your Part B/419 $$$ for this initiative
50% Rule
LEAs can use up to 50% of the increase in their federal $$ from one year to the next to supplant local costs of providing special education services.

Carryover Funds Unspent federal funds will be “carried over”. An LEA has up to 27 months to use federal funds.

Maintenance of Effort (MOE)
Districts must spend same or greater amount of local funds on special education from one year to the next

Maintenance of Effort (MOE)
There are a few exceptions… • Reduction in child count • Retirements • High cost student gone • Elimination of one time expenditure

Maintenance of Effort (MOE)
When directed to make cuts in special ed… Can it be done with MOE? It Depends… • Salary step and lane increase MAY cover the gap of staff being cut • Work closely with Business Manager to ensure MOE is met if making cuts • MOE is currently calculated by Individual Districts and Co-op or Ed District • Educate Superintendents and Board Members on MOE requirements early on so it is not a surprise!


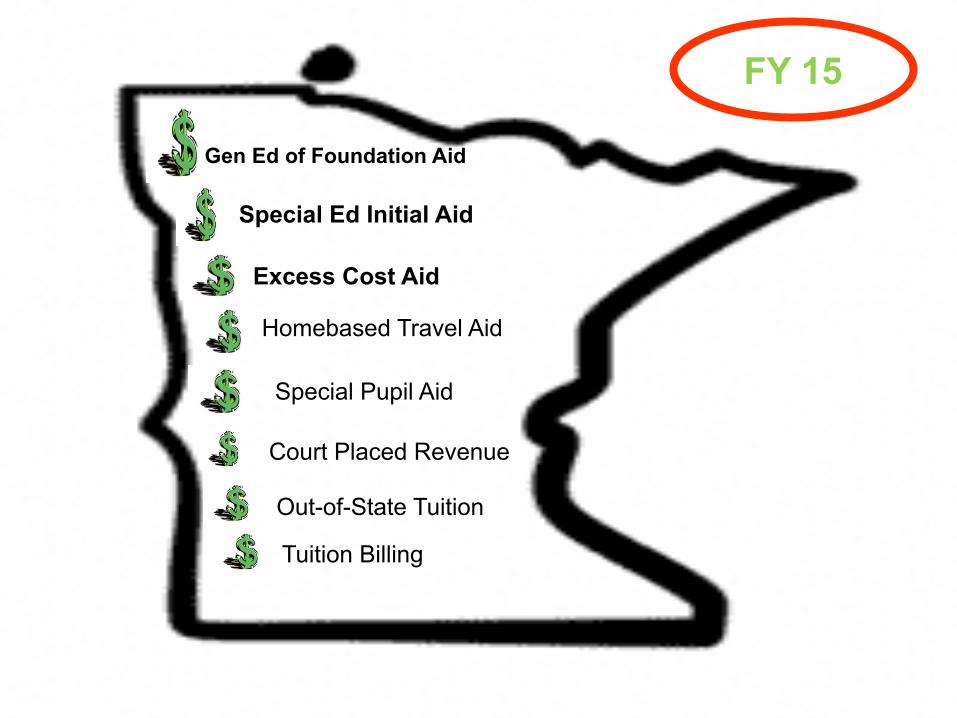
Gen Ed of Foundation Aid
Special Ed Initial Aid
Excess Cost Aid
Homebased Travel Aid
Special Pupil Aid
Court Placed Revenue
Out-of-State Tuition
Tuition Billing
FY 15

Gen Ed of Foundation Aid
Special Ed Initial Aid
Excess Cost Aid
Homebased Travel Aid
Special Pupil Aid
Court Placed Revenue
Out-of-State Tuition
Tuition Billing
FY 15
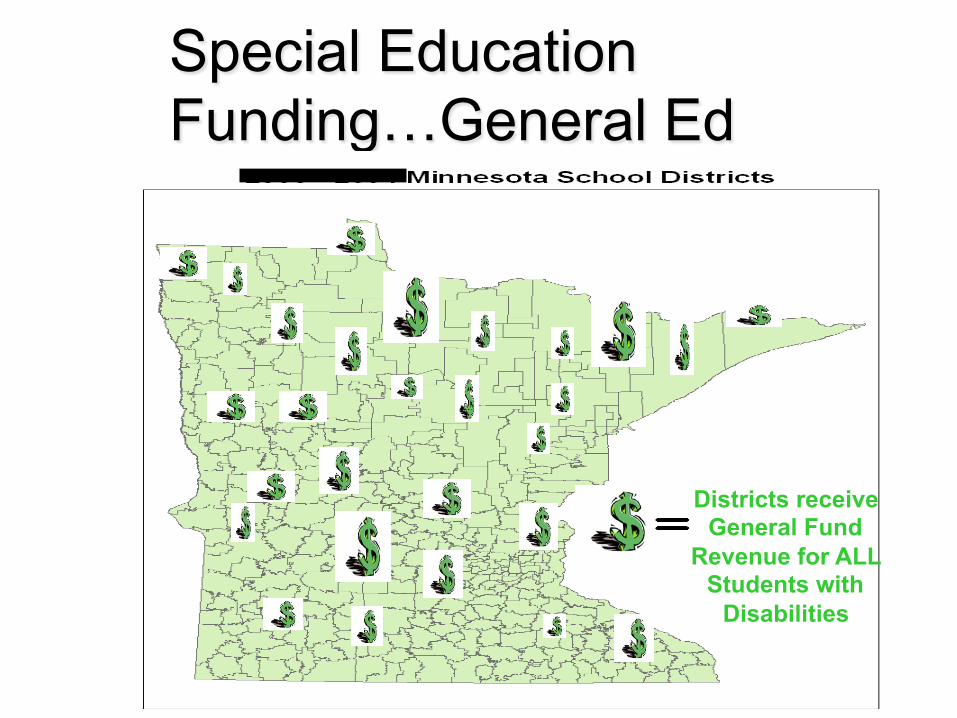
Special Education Funding…General Ed Revenue
Districts receive General Fund
Revenue for ALL Students with
Disabilities

Special Education Funding…General Ed
Amount differs across the
State!!

Gen Ed of Foundation Aid
Special Ed Initial Aid FY 15
Excess Cost Aid
Homebased Travel Aid
Special Pupil Aid
Court Placed Revenue
Out-of-State Tuition
Tuition Adjustments

Base special ed revenue is equal to the sum of the following expenditures regular year and summer special education programs:
Base Special Ed State Aid FY 15
68% Salary for personnel essential to providing services to students with disabilities
52% Contract amount for supplementary special ed services provided
47% of expenditures for special supplies and equipment for educating children with disabilities up to a maximum of $47 per child receiving special education

Special Ed Initial State Aid FY 15
68 % Salary 52% Contracted Services 47% Supplies/Equipment

68% 52% 47%
68% 52% 47%
68% 52% 47%
2003 2002
2001

Program Growth Factor
2004 2005 2006 2007

68% 63% 61% 60%
2004 2005 2006 2007
Program Growth Factor

Special Ed Initial State Aid FY 15
68 % Salary 52% Contracted Services 47% Supplies/Equipment
Statewide Adjustment Factor Total
Total Proration Factor

Special Ed Initial State Aid FY 15
68 % Salary 52% Contracted Services 47% Supplies/Equipment
Statewide Adjustment Factor Total
Total Proration Factor
UNKNOWN

Gen Ed of Foundation Aid
Special Ed Initial Aid FY 16 And Beyond
Excess Cost Aid
Tuition Adjustments
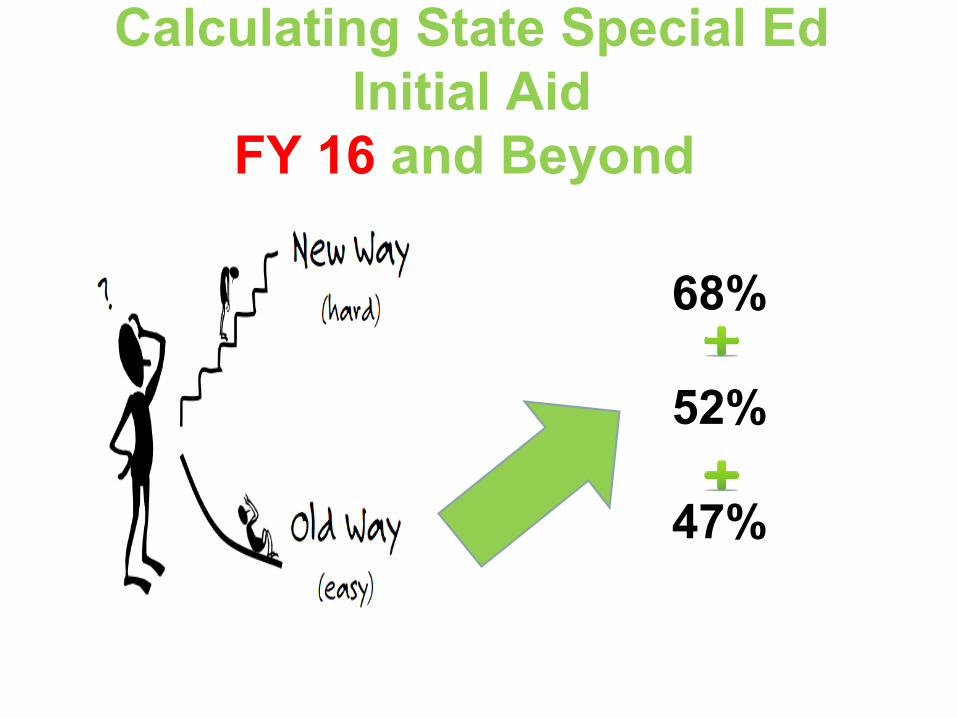
Calculating State Special Ed Initial Aid
FY 16 and Beyond
68% 52% 47%

Calculating State Special Ed Initial Aid FY 16
Ways

FY 16 and Later State Special Education Initial Aid will be the
LEAST of …. Option 1. 62% of the district’s old formula sped expenditures, excluding sped transportation expenditures
OR Option 2. 50% of the district’s nonfederal special education expenditures, excluding sped transportation expenditures
OR Option 3. 56% of the pupil-based formula calculation

FY 16 and Later
Option 1. 62% of the district’s old formula sped expenditures means…. Expenditures eligible for revenue under 68%+52%+47% formula, plus transition disabled expenditures. You don’t apply the %s for reimbursement… You just add the expenditures you would have used in the old formula and then take 62% of that total.
This calculation uses prior fiscal year expenditures

FY 16 and Later
Option 2. 50% of the district’s nonfederal special education expenditures means… All direct expenditures that are necessary and essential to meet the district’s obligation to provide special instruction and services EXCLUDING expenditures:
• reimbursed with federal funds; • reimbursed with other state aids; • for general ed costs of serving student with a disability; • for facilities; • for pupil transportation; • for postemployment benefits.
Then take 50% of the total for this calculation. This calculation uses prior fiscal year expenditures.

FY 16 and Later
Option 2.
Uses all of the expenditures used in Option 1, plus other expenditures not previously covered (i.e. benefits) Then take 50% of the total for this calculation. This calculation also uses prior fiscal year expenditures.

FY 16 and Later
Option 3. 56% of the pupil-based formula calculation.
• Calculations are based on all special education students served in a district. Residency is not considered. • Students’ primary disability area determine what “Cost Level” they are counted in.

Option 3
Cost Level 1 calculation includes various multipliers; ADMs served, Free Lunch Count for (K-12), Half of the Reduced Lunch Count for (K-12) • Various calculations are done with these numbers to get
Cost Level 1 revenue
• Within the ADMs served are ALL students with disabilities SERVED K-12
• This is the ONLY Cost Level in Option 3 that students
served with the primary disability of LD, OHD, TBI, or Speech are counted
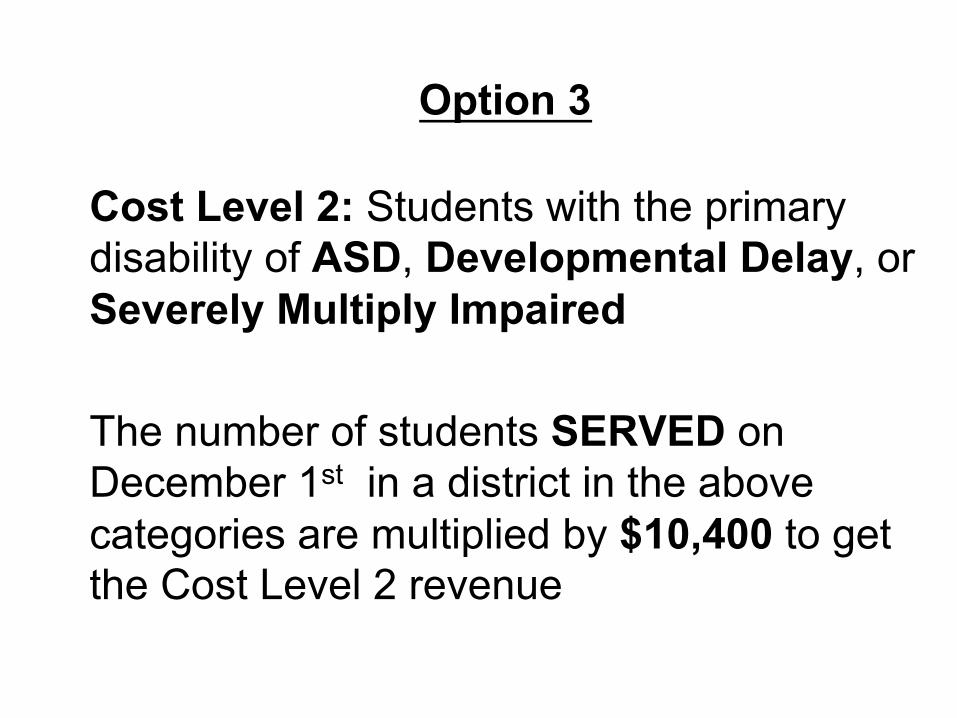
Option 3
Cost Level 2: Students with the primary disability of ASD, Developmental Delay, or Severely Multiply Impaired
The number of students SERVED on December 1st in a district in the above categories are multiplied by $10,400 to get the Cost Level 2 revenue

Option 3
Cost Level 3: Students with the primary disability of DHH or EBD
The number of students SERVED on December 1st in a district in the above categories are multiplied by $18,000 to get the Cost Level 3 revenue

Option 3 Cost Level 4: Students with the primary disability of DCD-Mild, DCD-Severe, Physically Impaired, Visually Impaired, or Deaf/Blind
The number of students SERVED on December 1st in a district in the above categories are multiplied by $27,000 to get the Level 4 revenue

FY 16 and Later State Special Education Aid will be the LEAST of
Option 1. 62% of the district’s old formula sped expenditures
OR Option 2. 50% of the district’s nonfederal sped expenditures
OR Option 3. 56% of the census based formula calculation
Excess Cost Aid
Special Education Transportation Aid
State Special Education Initial Aid

Searching for State Special Ed Aid Reports

Data Center > Data Reports and Analytics > School Finance Reports > Minnesota Funding Reports (MFR)

Data Center > Data Reports and Analytics > School Finance Reports > Minnesota Funding Reports (MFR)

Data Center > Data Reports and Analytics > School Finance Reports > Minnesota Funding Reports (MFR)


ALWAYS Make Copies of Reports… they are NOT archived on MDE’s website


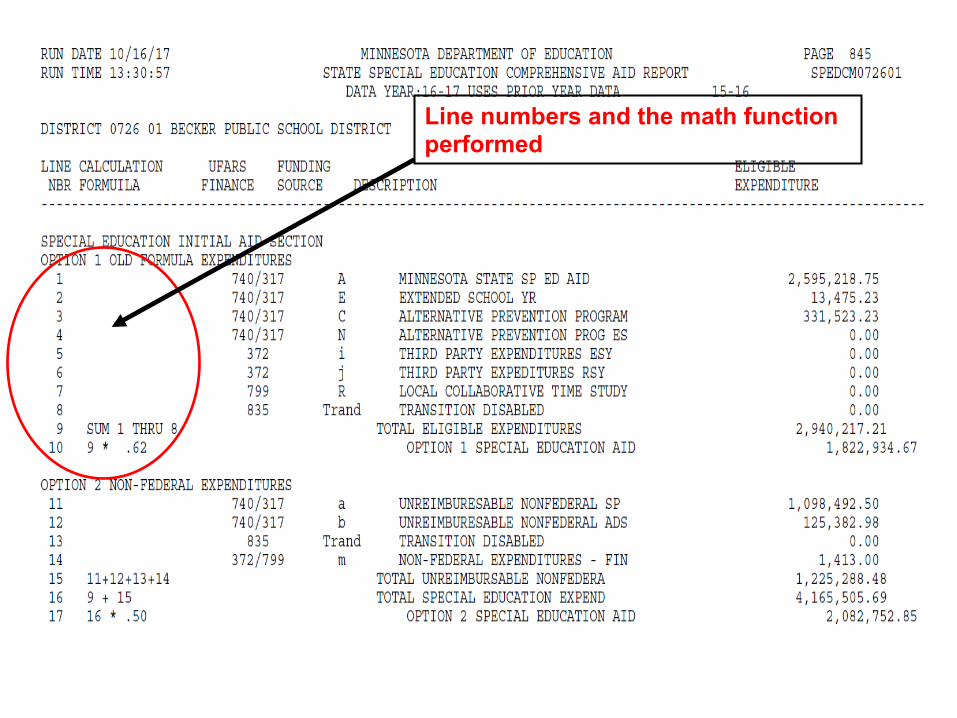
Line numbers and the math function performed

62% of the old formula expenditures

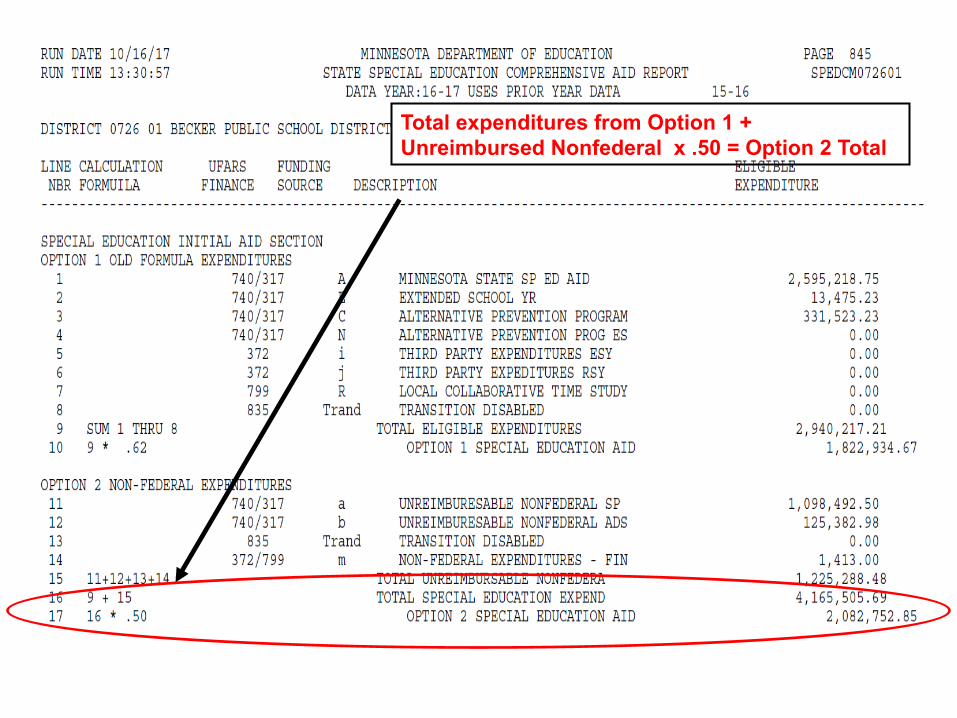
Total expenditures from Option 1 + Unreimbursed Nonfederal x .50 = Option 2 Total

Option 3 Cost Level 1 Calculations

Option 3 Cost Level 2, 3, and 4 Calculations
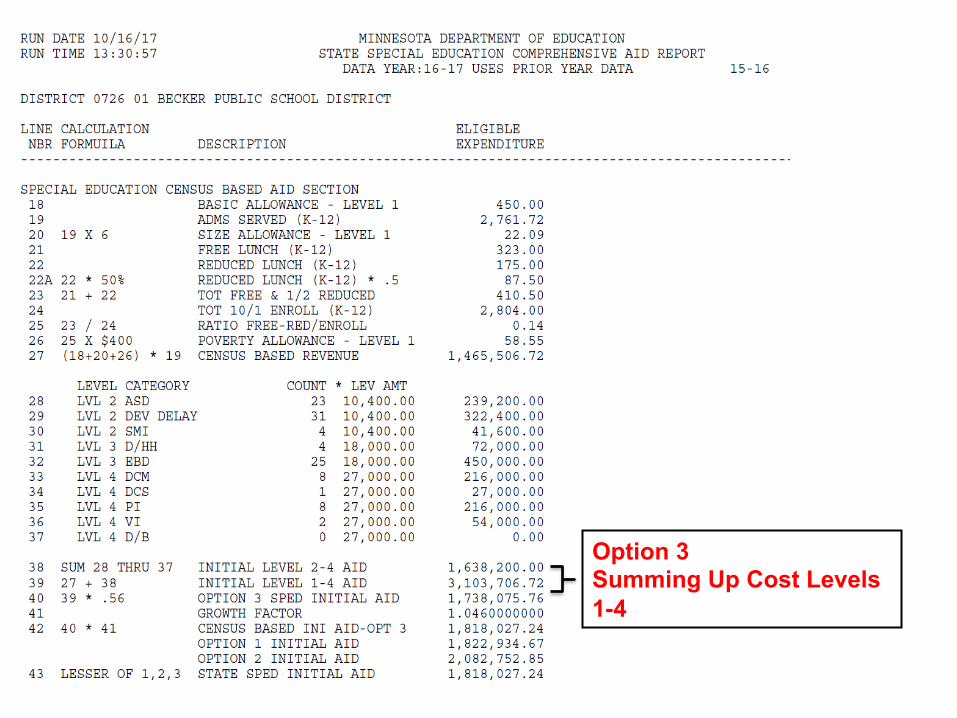
Option 3 Summing Up Cost Levels 1-4

Growth Factor applied to Cost Level 3

Total Option 3

Lesser of the three options = State Sped Initial Aid

Gen Ed of Foundation Aid
Special Ed Initial Aid FY 16 And Beyond
Excess Cost Aid
Tuition Adjustments

Excess Cost Aid
“A district’s excess cost aid is its initial excess cost aid prorated to the state total excess cost aid by multiplying the district’s initial excess cost aid by the ratio of the state total excess cost aid to initial (uncapped) state total excess cost aid.”
~MN School Finance A Guide for Legislators November 2016
Excess Cost Aid
Provides additional special education funding for districts that have extremely high levels of unreimbursed special education expenses

Excess Cost Aid Changes for FY 16 and Later
The GREATER of: • CALCULATION A: 62% of the difference between the
district’s unreimbursed old formula special education expenditures and 2.5% of the district’s general revenue
OR • CALCULATION B: 56% of the difference between the
district’s unreimbursed nonfederal special ed expenditures and 7.0% of the district’s general revenue
OR
• Zero

Excess Cost Aid Changes for FY 16 and Later
After perfoming the two Calculations, you get the GREATER of the two totals for excess cost aid.
• It is still possible for a district to “not qualify” for excess
cost aid. • The general ed revenue attributed to students in federal
settings greater than 2 will be used in the calculations. Meaning…more revenue is being used to offset the unreimbursed costs!

Searching for Excess Cost Aid Reports
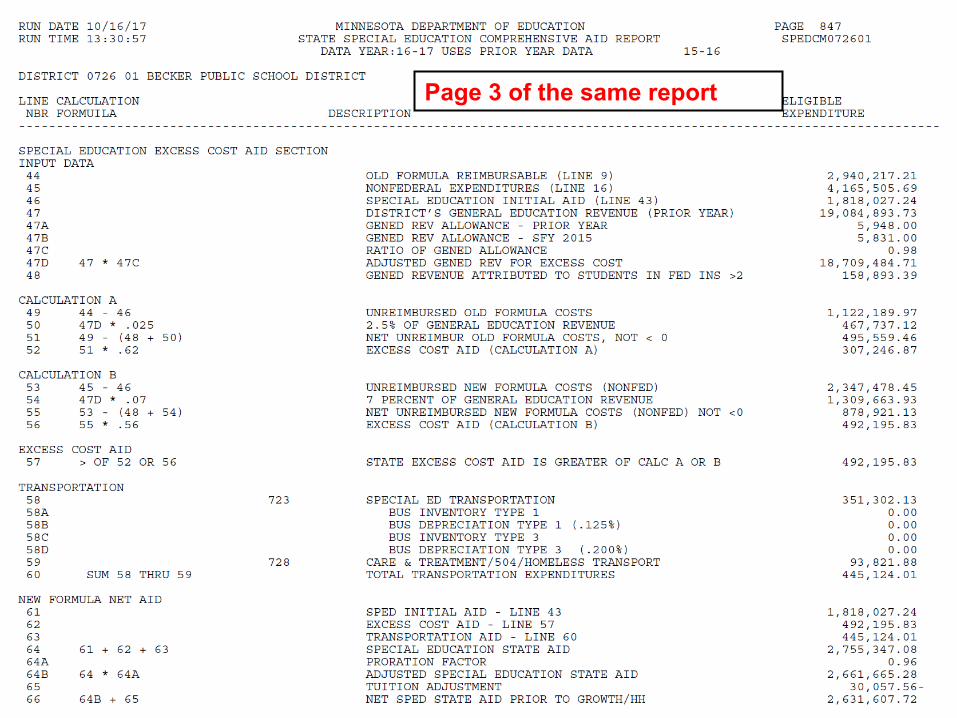
Page 3 of the same report

Data to be used in the two calculations

Calculation A

Calculation B

GREATER of A and B = Excess Cost Aid

Page 3

Page 3

Page 3

Page 3

Page 3

Page 3

Page 3


HOLD HARMLESS
GROWTH LIMIT

Page 4

FY 16 (but NOT beyond) MAXIMUM Special Ed Aid must not exceed…
Special ed aid based on old formula
Excess cost aid based on old formula
Tuition Adjustments ADM served $80 (This is referred to as the special ed aid increase limit)
MAXIMUM Special Ed Aid for FY 16
GROWTH LIMIT
GROWTH LIMIT

FY 16 and Later MINIMUM Special Ed Aid must not be less than the lesser…
Special ed aid based on old formula
District’s nonfederal sped OR
expenditures for current FY Excess cost aid based on old formula
Tuition Adjustments
ADM Current Yr ADM FY16
Program Growth Factor *
*1.0 for FY16, 1.046 for FY 17, and the product of 1.046 and the program growth factor for the previous year for FY 18 and later
MINIMUM Special Ed Aid for FY 16 and Later
HOLD HARMLESS
HOLD HARMLESS

FY 17 and Later MAXIMUM Special Ed Aid must not exceed…
ADM served special ed aid increase ($100); add $40 each yr after FY17
Old formula calculation for FY16 (FY stays FY16 for subsequent years)
Excess Cost Aid for FY16 (FY stays FY16 for subsequent years) Tuition Adjustments
Current Year ADM served ADM served FY 16
Program Growth Factor 1.046 (FY 18 1.046 x 1.046) (FY19 is FY18 x 1.046…)
MAXIMUM Special Ed Aid for FY 17 and Later
GROWTH LIMIT
GROWTH LIMIT

• Haven’t had a Minimum and Maximum before • Adjustments are made in February of the
following fiscal year (because it uses current year CY figures)
• Make sure you consider Growth Factor and Hold
Harmless and aren’t surprised with big adjustments!