Spatial Social Science Mapping and Analysis...
72
© 2002 Luc Anselin, All Rights Reserved Mapping and Analysis for Spatial Social Science Luc Anselin Spatial Analysis Laboratory Dept. Agricultural and Consumer Economics University of Illinois, Urbana-Champaign http://sal.agecon.uiuc.edu
Transcript of Spatial Social Science Mapping and Analysis...
© 2002 Luc Anselin, All Rights Reserved
Mapping and Analysis for Spatial Social Science
Luc AnselinSpatial Analysis Laboratory
Dept. Agricultural and Consumer EconomicsUniversity of Illinois, Urbana-Champaign
http://sal.agecon.uiuc.edu

© 2002 Luc Anselin, All Rights Reserved
Outline
�Introduction�Geovisualization�Statistical Maps�Map Smoothing�Linking and Brushing�Visualizing Spatial Autocorrelation�Space-Time Correlation

© 2002 Luc Anselin, All Rights Reserved
Introduction

© 2002 Luc Anselin, All Rights Reserved
Spatial Models
�Growing Interest in Space, Spatiality and Spatial Interaction among Theoretical Social Sciences
�Overarching Concepts� social interaction� context, neighborhood effects� interacting agents, strategic interaction� spatial externalities, agglomeration� geography as a proxy

© 2002 Luc Anselin, All Rights Reserved
Spatial Data
�Growing Interest in the use of Spatial Data in Empirical Social Science� georeferenced data
• addresses, lat-lon (GPS survey)� distance and accessibility measures
• access to infrastructure, spatial mismatch
�Role of GIS� affordable and transparent spatial
data manipulation
© 2002 Luc Anselin, All Rights Reserved
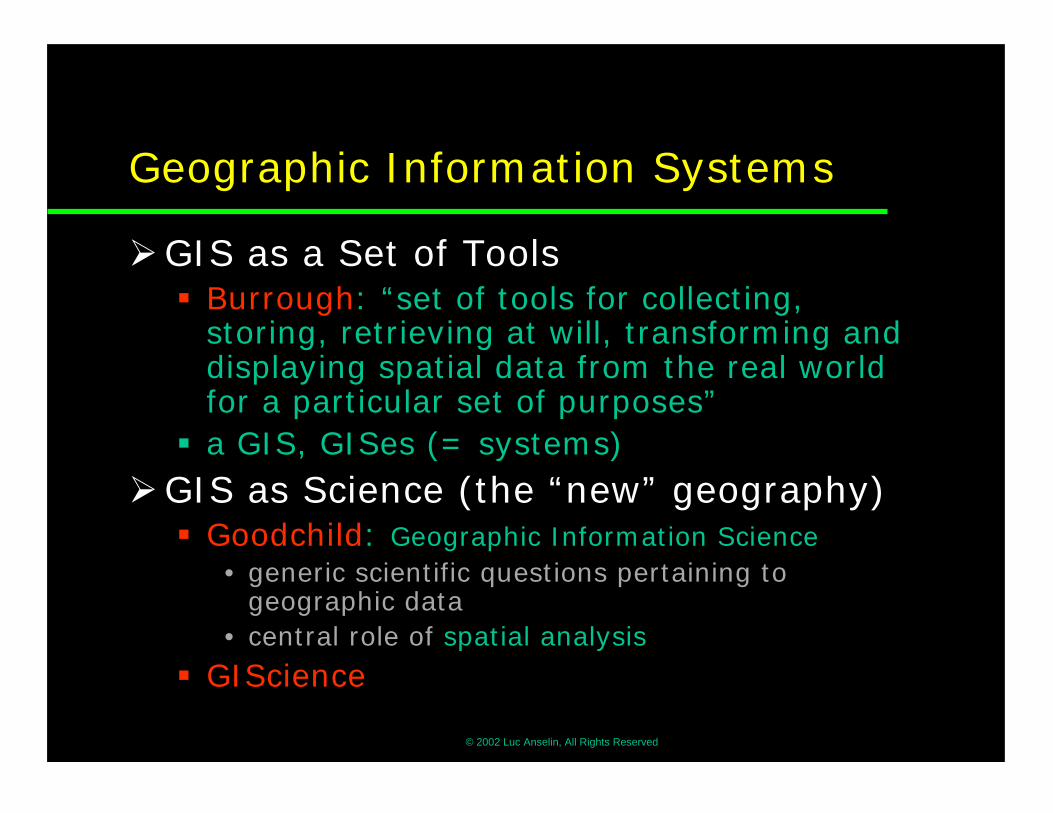
Geographic Information Systems
�GIS as a Set of Tools� Burrough: “set of tools for collecting,
storing, retrieving at will, transforming and displaying spatial data from the real world for a particular set of purposes”
� a GIS, GISes (= systems)
�GIS as Science (the “new” geography)� Goodchild: Geographic Information Science
• generic scientific questions pertaining to geographic data
• central role of spatial analysis
� GIScience

© 2002 Luc Anselin, All Rights Reserved
What is Spatial Analysis
�From Data to Information� beyond mapping: added value� transformations, manipulations and
application of analytical methods to spatial (geographic) data
� Lack of Locational Invariance� analyses where the outcome changes when
the location of the objects under study changes• median center, clusters, spatial autocorrelation
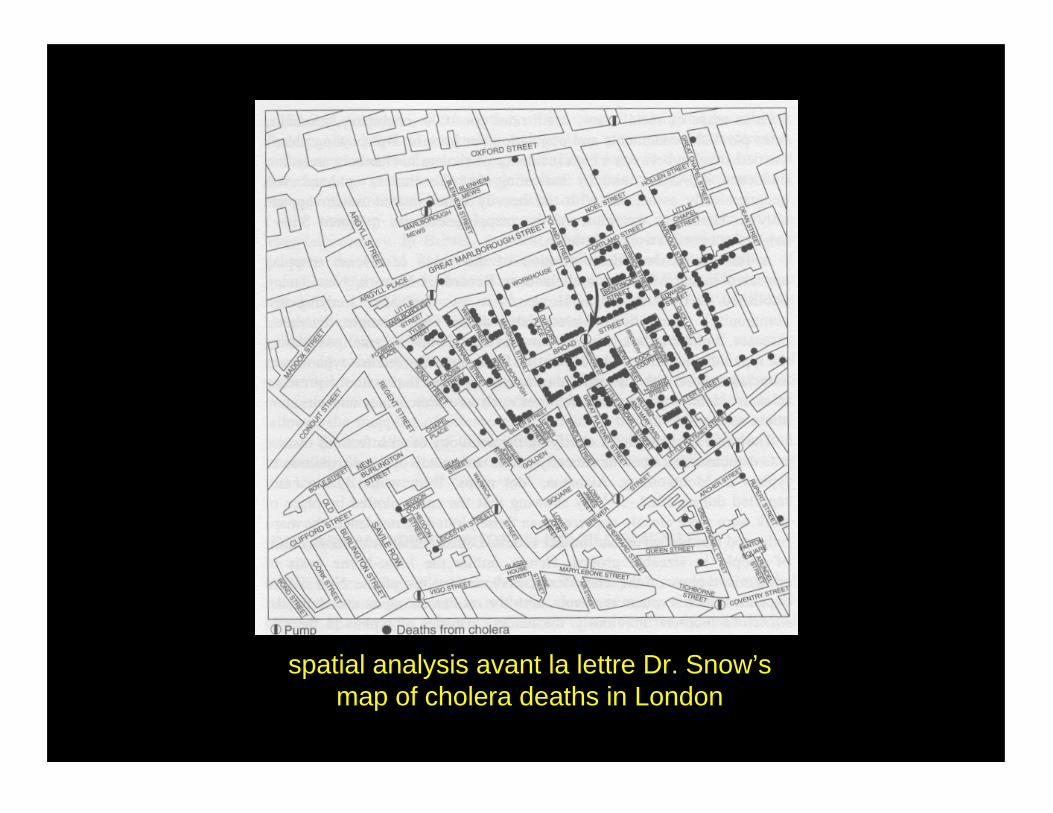
spatial analysis avant la lettre Dr. Snow’s map of cholera deaths in London
© 2002 Luc Anselin, All Rights Reserved
Components of Spatial Analysis
�Visualization� Showing interesting patterns
�Exploratory Spatial Data Analysis� Finding interesting patterns
�Spatial Modeling, Regression� Explaining interesting patterns
© 2002 Luc Anselin, All Rights Reserved
Implementation of Spatial Analysis
�Beyond GIS� Analytical functionality not part of typical
commercial GIS• Analytical extensions, DynESDA2
� Exploration requires interactive approach� Spatial modeling requires specialized
statistical methods• Explicit treatment of spatial autocorrelation• Space-time is not space + time
�Methods of Geovisualization, ESDA and Spatial Regression Analysis

© 2002 Luc Anselin, All Rights Reserved
(Limited) Illustration of Techniques
�Geovisualization� specialized maps
�ESDA� dynamically linked windows
�Spatial Correlation Analysis� global and local spatial
autocorrelation� space-time correlation
© 2002 Luc Anselin, All Rights Reserved
Geovisualization

© 2002 Luc Anselin, All Rights Reserved
Beyond Mapping
�Map� “a collection of spatially defined objects”
(Monmonier)
�Geovisualization� combination of map and scientific
visualization methods (computer science)� exploit human’s pattern recognition abilities
�How to lie with maps� many design issues� human perception can be tricked
© 2002 Luc Anselin, All Rights Reserved
Choropleth Maps
�Map Counterpart of Histogram� values/attributes for discrete spatial units� choro from choros (colors) NOT chloro
�Practical Issues� choice of intervals
• equal interval, equal share (quantiles), standard deviational, …
� choice of colors• important for perception of patterns
� misleading role of area• larger areas “seem” more important

Color Brewer www.colorbrewer.org

© 2002 Luc Anselin, All Rights Reserved
Cartograms
�Misleading Effect of Area� large areal units draw attention
�Symbol Maps� symbols (bars, circles) superimposed on
actual areas
�Cartogram� change the layout to reflect size other than
area• population size, variable magnitude
� respect topology (spatial arrangement)
© 2002 Luc Anselin, All Rights Reserved
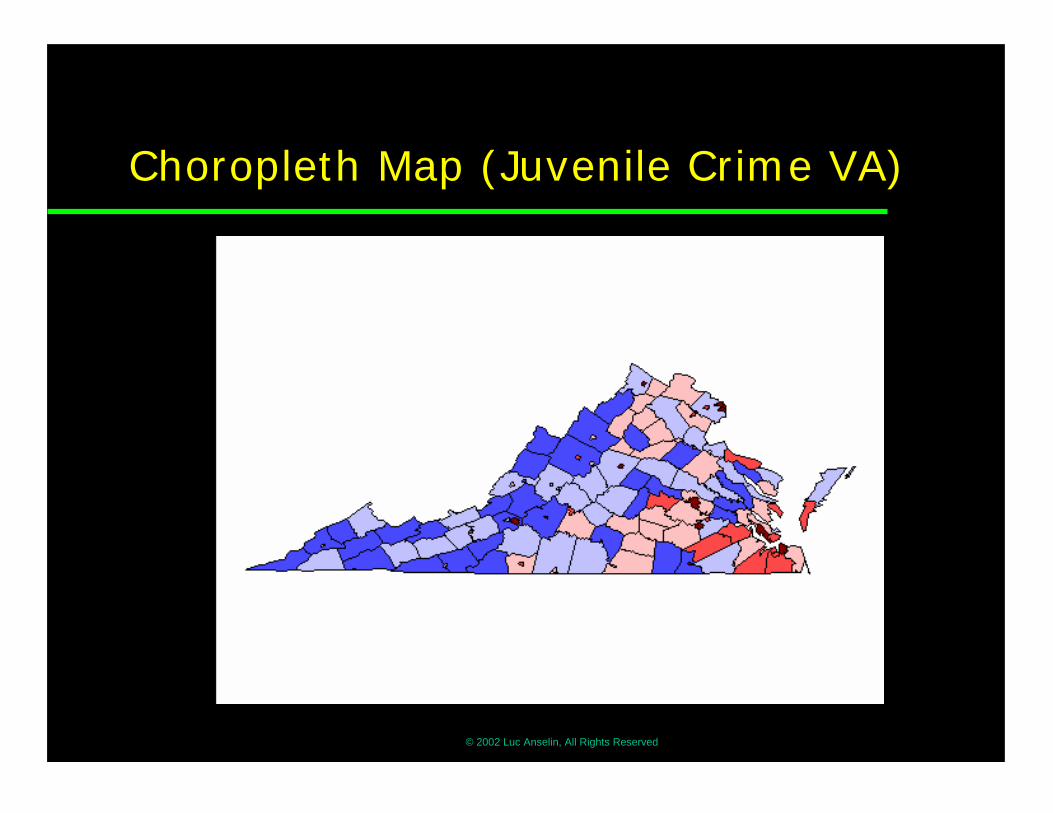
Choropleth Map (Juvenile Crime VA)
© 2002 Luc Anselin, All Rights Reserved
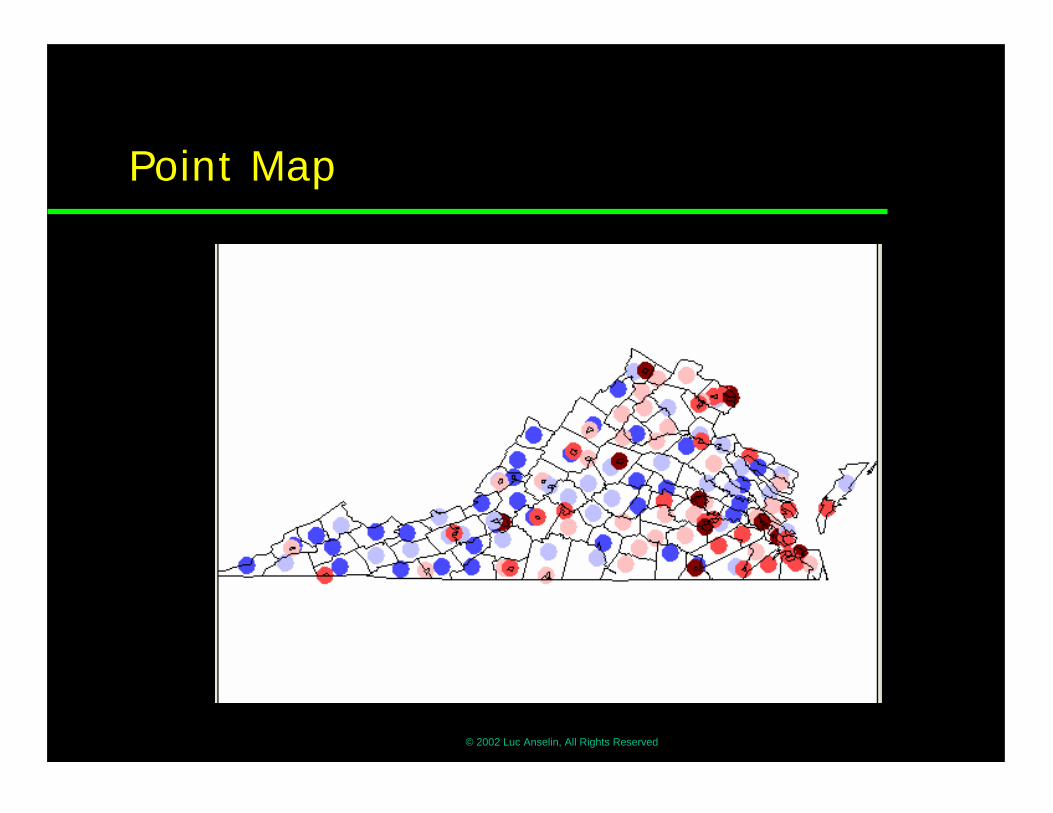
Point Map

© 2002 Luc Anselin, All Rights Reserved
Thiessen Polygons

© 2002 Luc Anselin, All Rights Reserved
Contiguous Cartogram
Nebraska county population - http://www.bbr.unl.edu/cartograms/pop.html

© 2002 Luc Anselin, All Rights Reserved
Cartogram (GeoTools)
Infant Mortality England and Wales, 1851

© 2002 Luc Anselin, All Rights Reserved
Isopleth Maps
�Map Counterpart of Density Plot� values/attributes for continuous fields� lines of equal value, contour lines� 3-d surface plots
�Practical Issues� choice of intervals� spatial interpolation
• construct “observations” for locations that are not observed
• statistical problem = spatial prediction

Residential Sales Price, Baltimore MD (1980)sample points (darker is higher) and contours
© 2002 Luc Anselin, All Rights Reserved
Statistical Maps
© 2002 Luc Anselin, All Rights Reserved
Visualizing Spatial Distributions
�Spatialized EDA� icons and glyphs matching locations� special case of symbol maps
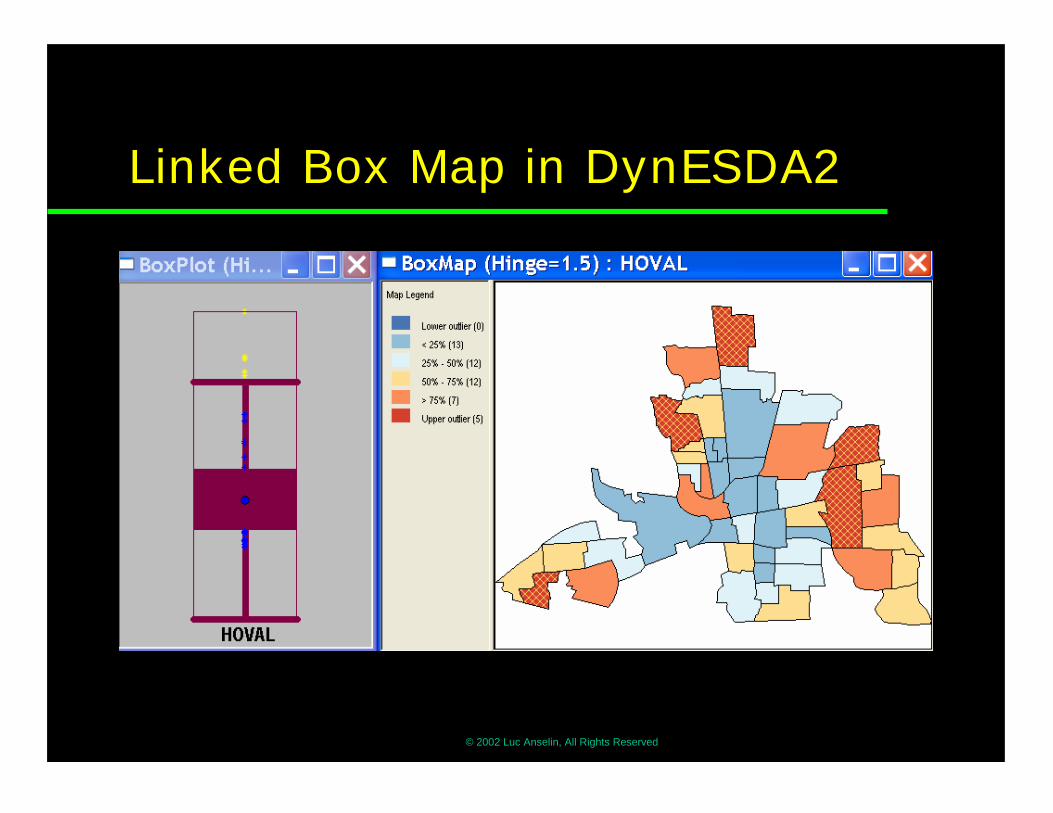
�Box Map� outlier map� visual popout, both magnitude and location
�Regional Box Plots� spatial heterogeneity � different distributions in spatial subsets

spatial lag bar chartblue = crime at i, red = spatial lag, average crime for neighbors
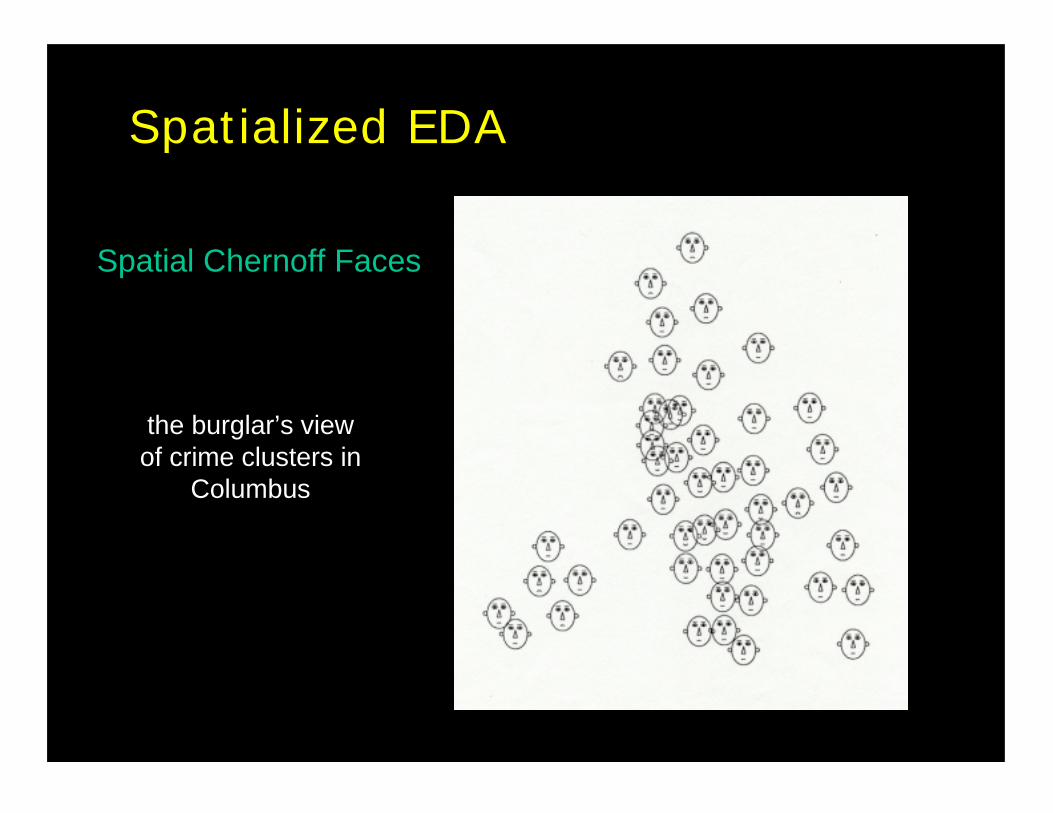
Spatialized EDA
the burglar’s view of crime clusters in
Columbus
Spatial Chernoff Faces
© 2002 Luc Anselin, All Rights Reserved
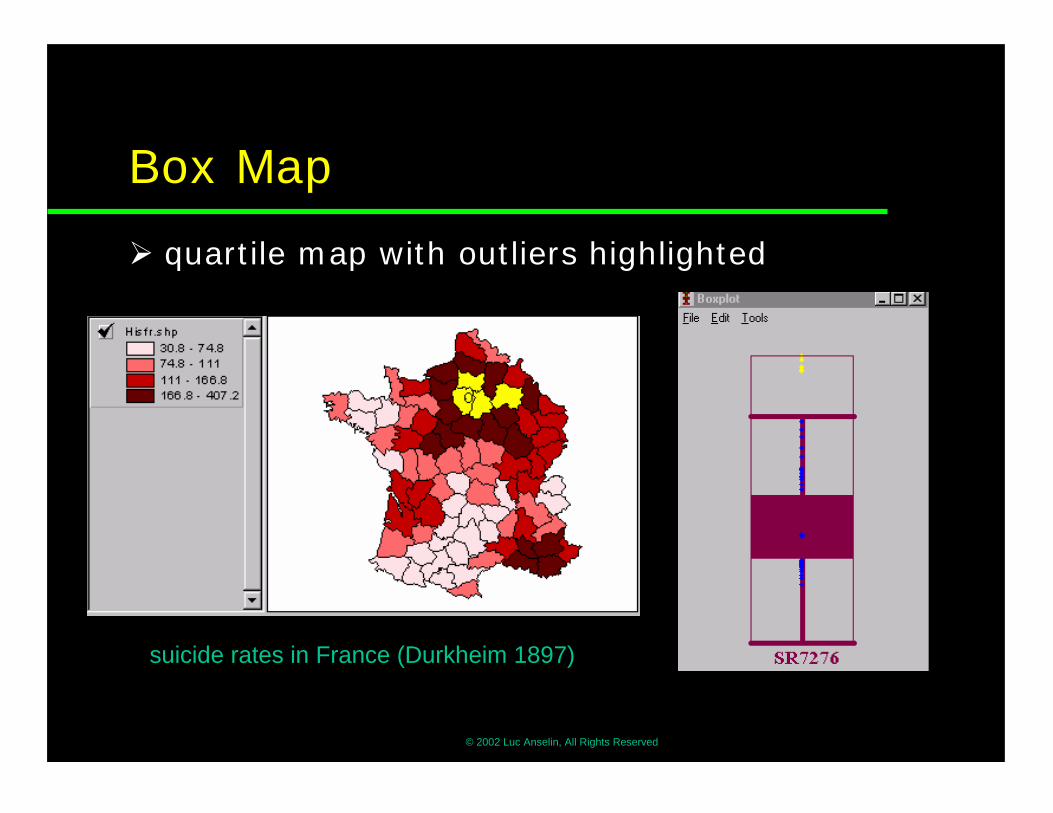
Box Map
� quartile map with outliers highlighted
suicide rates in France (Durkheim 1897)
© 2002 Luc Anselin, All Rights Reserved
Linked Box Map in DynESDA2

© 2002 Luc Anselin, All Rights Reserved
Regional Histogram

© 2002 Luc Anselin, All Rights Reserved
Regional Box Plot
Columbus crime: core vs periphery

© 2002 Luc Anselin, All Rights Reserved
Map Plots and Plot Maps
�Linked Micromap Plots - LM plots� a micromap for each quantile� micromaps linked to other statistical
graphs�Conditioned Choropleth Maps
- cc maps� choropleth maps on dependent
variable� micromap matrix� conditioning along two dimensions

Linked Micromap Plots (Carr)

Conditioned Choropleth Map (Carr)
© 2002 Luc Anselin, All Rights Reserved
Map Smoothing

© 2002 Luc Anselin, All Rights Reserved
Mapping Events
�Events as Locations� individual points
• point pattern analysis
�Events as Rates� areal aggregates
• counts of events• rate = # events / # population at risk• raw rate is ML estimate of “risk”

© 2002 Luc Anselin, All Rights Reserved
Problems with Rate Maps
�Intrinsic Heterogeneity� variance depends on mean� variance depends on base
�Variance Instability� spurious outliers
�Excess Risk is Non-Spatial� does not account for spatial
autocorrelation

© 2002 Luc Anselin, All Rights Reserved
Map Smoothing
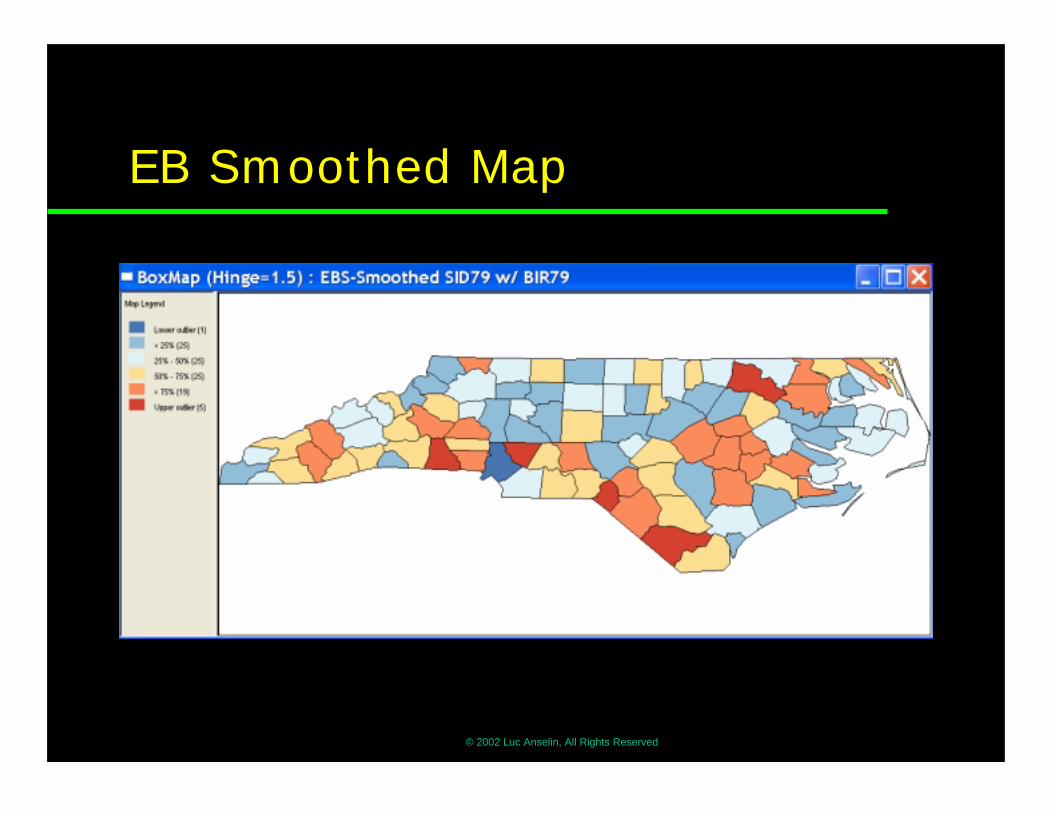
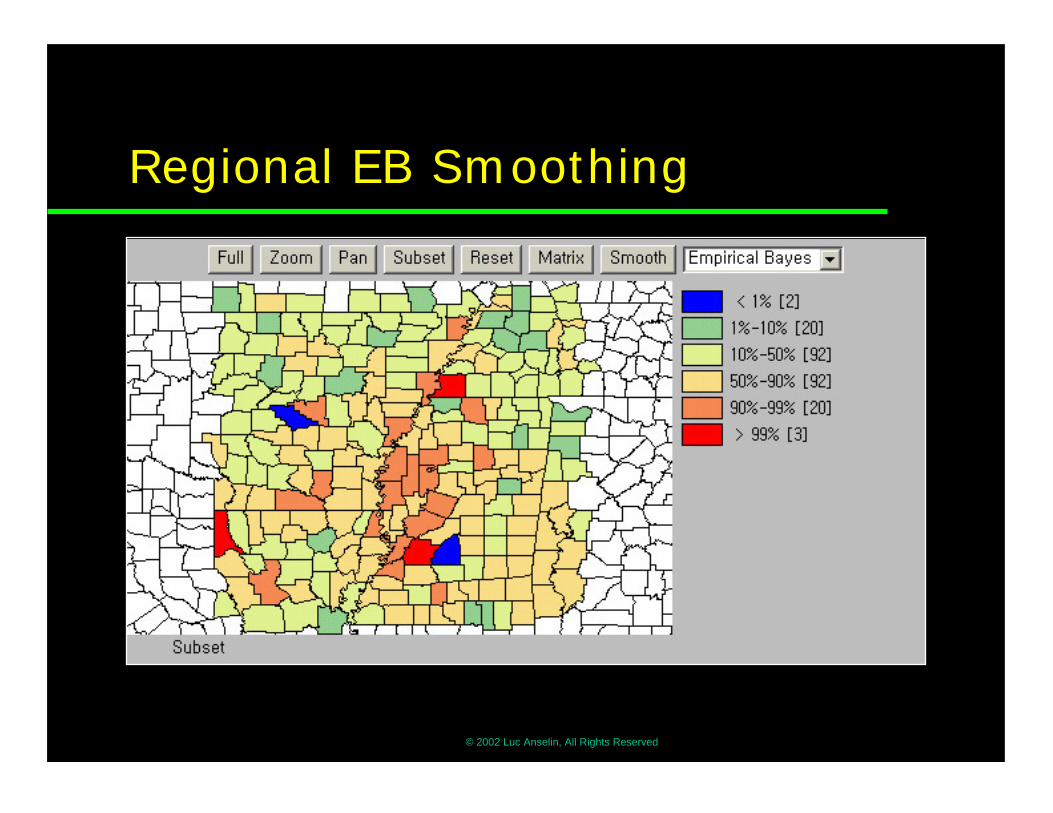
�Empirical Bayes� shrink rates to reference� national average� regional average = subset average
�Spatial Rate Smoother� spatial moving average� spatial range defined by spatial
weights

© 2002 Luc Anselin, All Rights Reserved
Event and Base

© 2002 Luc Anselin, All Rights Reserved
Raw Rate Map
© 2002 Luc Anselin, All Rights Reserved
EB Smoothed Map

© 2002 Luc Anselin, All Rights Reserved
Spatial Rate Smoother
© 2002 Luc Anselin, All Rights Reserved
Regional EB Smoothing

© 2002 Luc Anselin, All Rights Reserved
Linking and Brushing
© 2002 Luc Anselin, All Rights Reserved
Linking
�Views� different “views” of data
• statistical graphs: histogram, box plot, scatterplot• map• Table (list)
�Dynamic Linking� views dynamically linked
• click on one view and corresponding observations (points, areas) on other views are highlighted

Linking Point and Polygon Maps
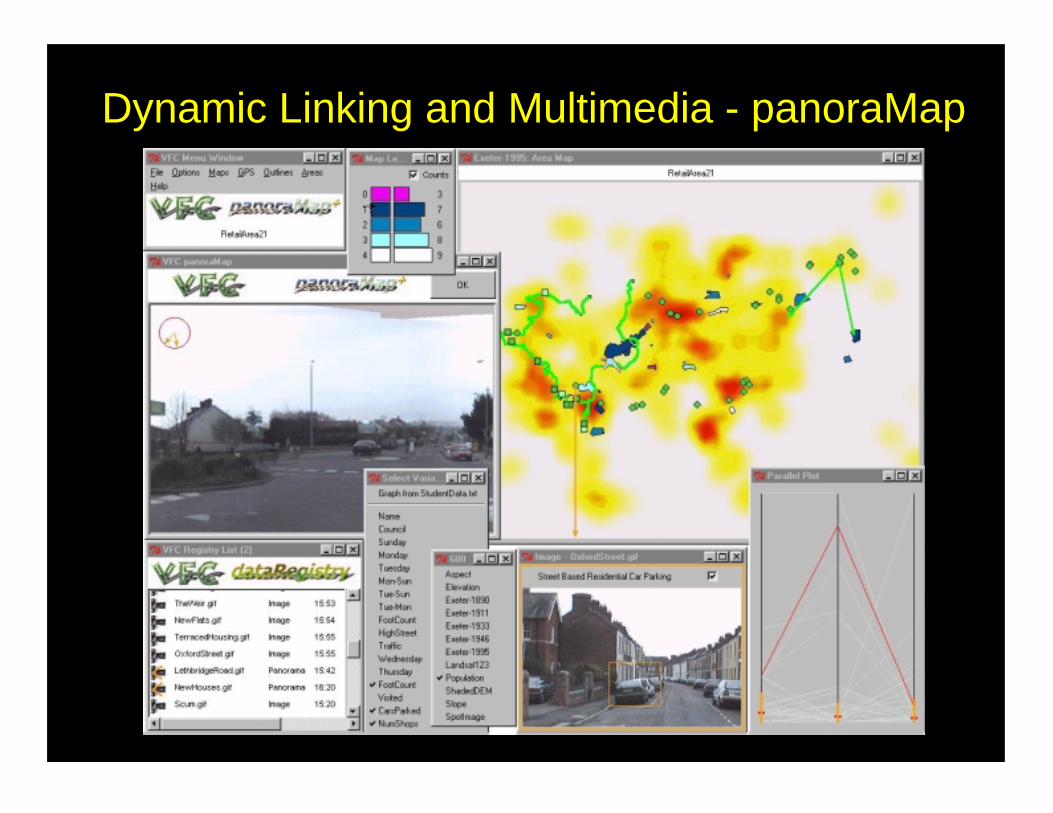
Dynamic Linking and Multimedia - panoraMap

© 2002 Luc Anselin, All Rights Reserved
Brushing
�Brushing� moving “brush” over map or graph
highlights matching observations in other statistical graphs and vice versa
�Brushing Scatterplots� recalculates slope of regression line
�Geographic Brushing� simultaneous selecting on multiple
maps

© 2002 Luc Anselin, All Rights Reserved
Selection in Scatterplot

© 2002 Luc Anselin, All Rights Reserved
Map Brushing in DynESDA2

© 2002 Luc Anselin, All Rights Reserved
Visualizing Spatial Autocorrelation

© 2002 Luc Anselin, All Rights Reserved
Random or Clustered?

© 2002 Luc Anselin, All Rights Reserved
Random or Clustered?

© 2002 Luc Anselin, All Rights Reserved
Moran’s I
�Moran’s I Spatial Autocorrelation Statistic� cross-product statistic
I = (N/S0) Σi Σj wij. zi.zj / Σi zi2
with zi = xi - µ and S0 = Σi Σj wij
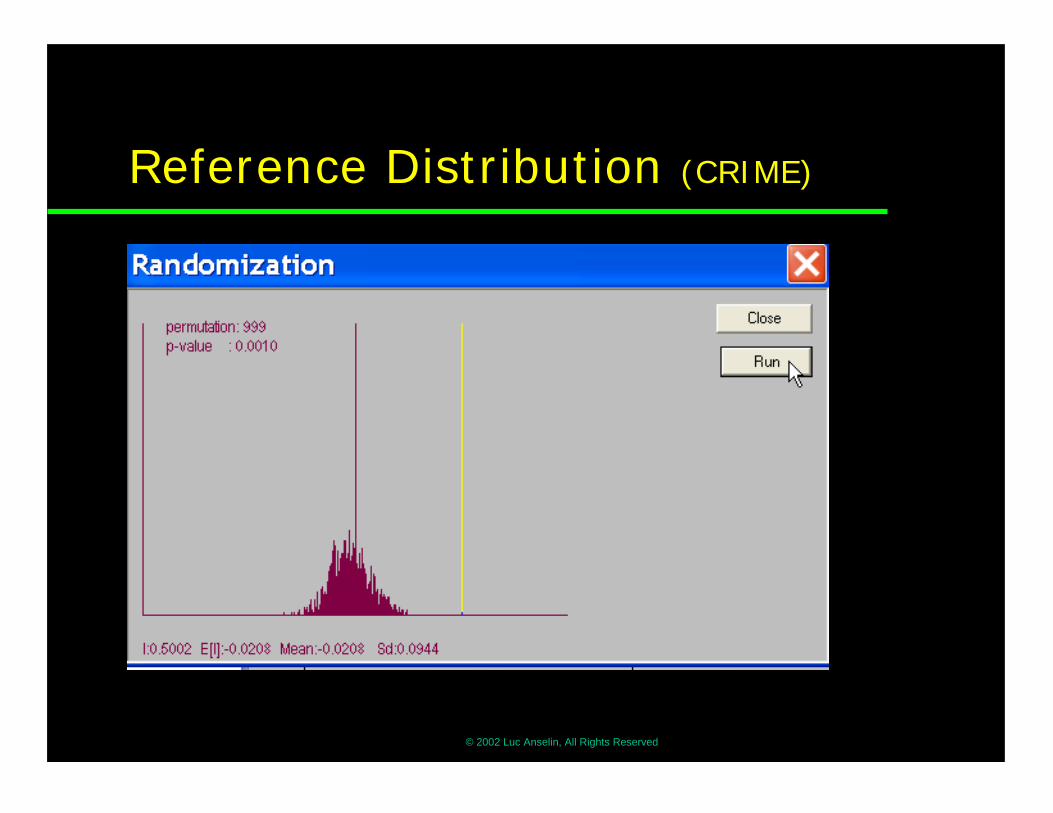
�Inference� normal distribution� randomization� permutation
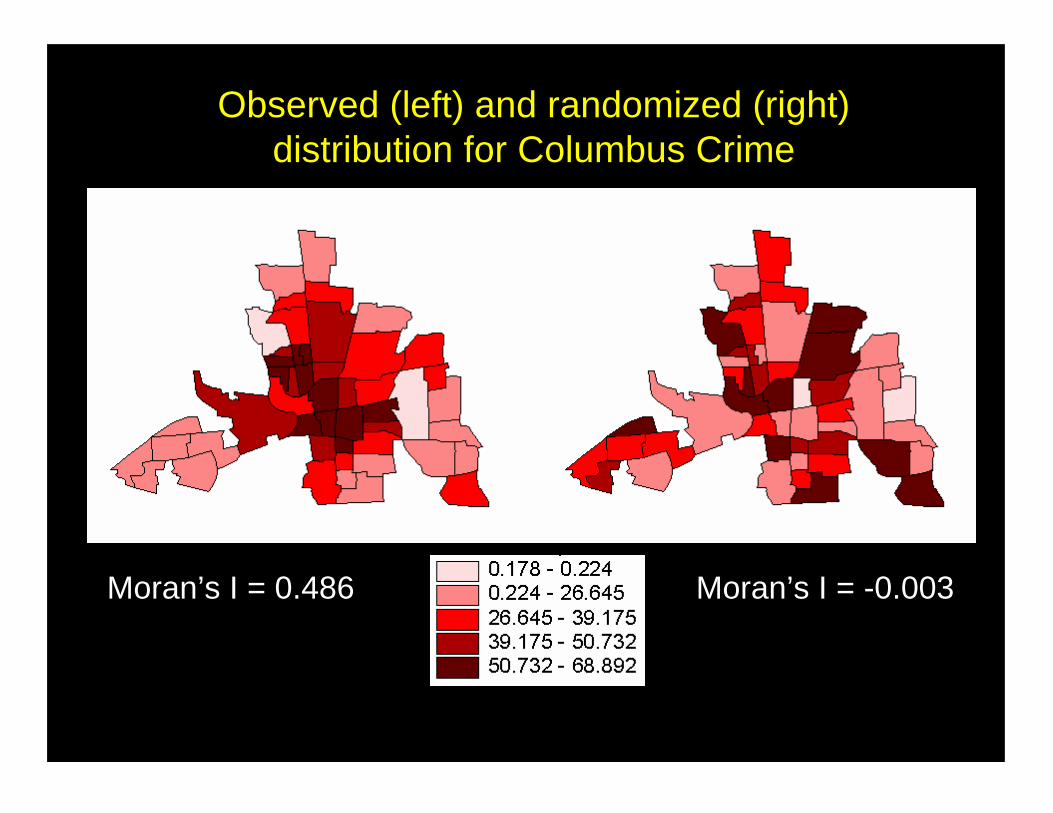
Observed (left) and randomized (right) distribution for Columbus Crime
Moran’s I = 0.486 Moran’s I = -0.003

© 2002 Luc Anselin, All Rights Reserved
Moran Scatterplot
� Linear Spatial Autocorrelation� linear association between value at i and
weighted average of neighbors:Σj wij yj vs. yi , or Wy vs y
� four quadrants• high-high, low-low = spatial clusters• high-low, low-high = spatial outliers
�Moran’s I� slope of linear scatterplot smoother� I = z’Wz / z’z
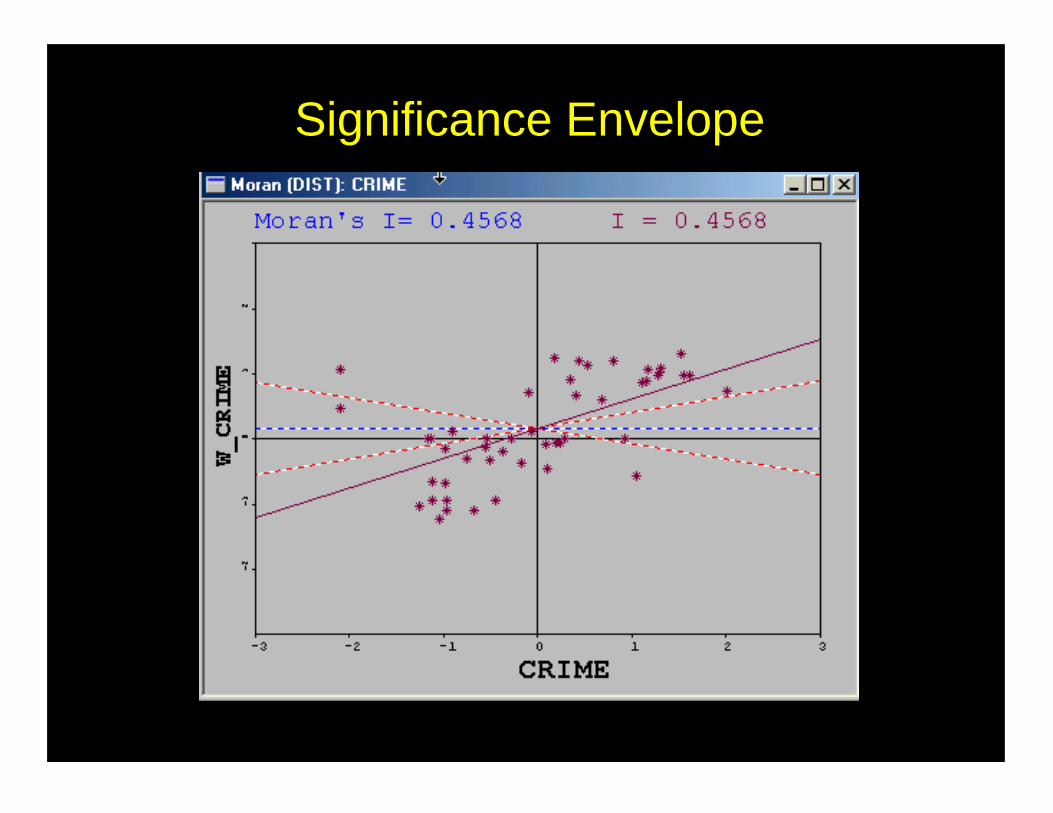
Significance Envelope
© 2002 Luc Anselin, All Rights Reserved
Reference Distribution (CRIME)
© 2002 Luc Anselin, All Rights Reserved
Use of Moran Scatterplot
�Classification of Spatial Autocorrelation
�Local Nonstationarity� outliers� high leverage points� sensitivity to boundary values
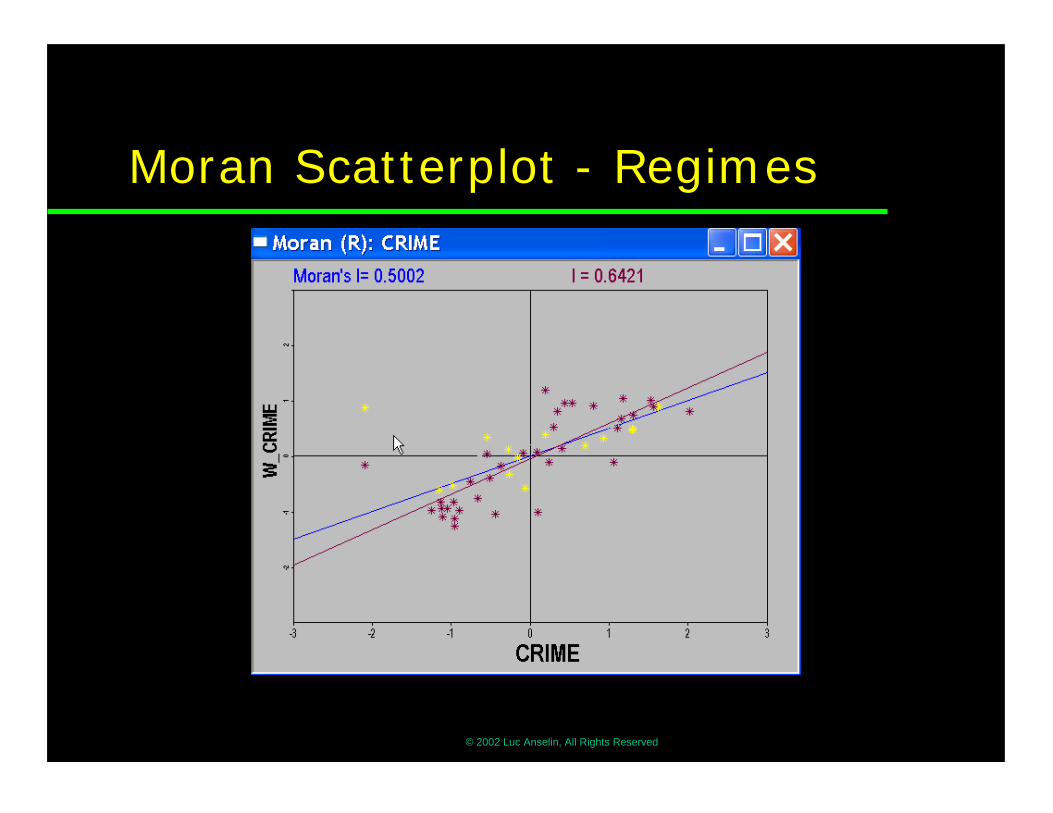
�Regimes� different slopes in subsets of the data

Moran Scatterplot Map for Columbus crimefour quadrants of the scatterplot (not “significant”)
© 2002 Luc Anselin, All Rights Reserved
Moran Scatterplot - Regimes

© 2002 Luc Anselin, All Rights Reserved
Local Moran
� Local Moran Statistic� Ii = (zi/ m2)Σj wij.zj
� Σi Ii = N.I
� Inference� randomization assumption� conditional permutation� local dependence or heterogeneity?
�Visualization� LISA map and Moran Significance Map

LISA MAPS

© 2002 Luc Anselin, All Rights Reserved
Space-Time Correlation

© 2002 Luc Anselin, All Rights Reserved
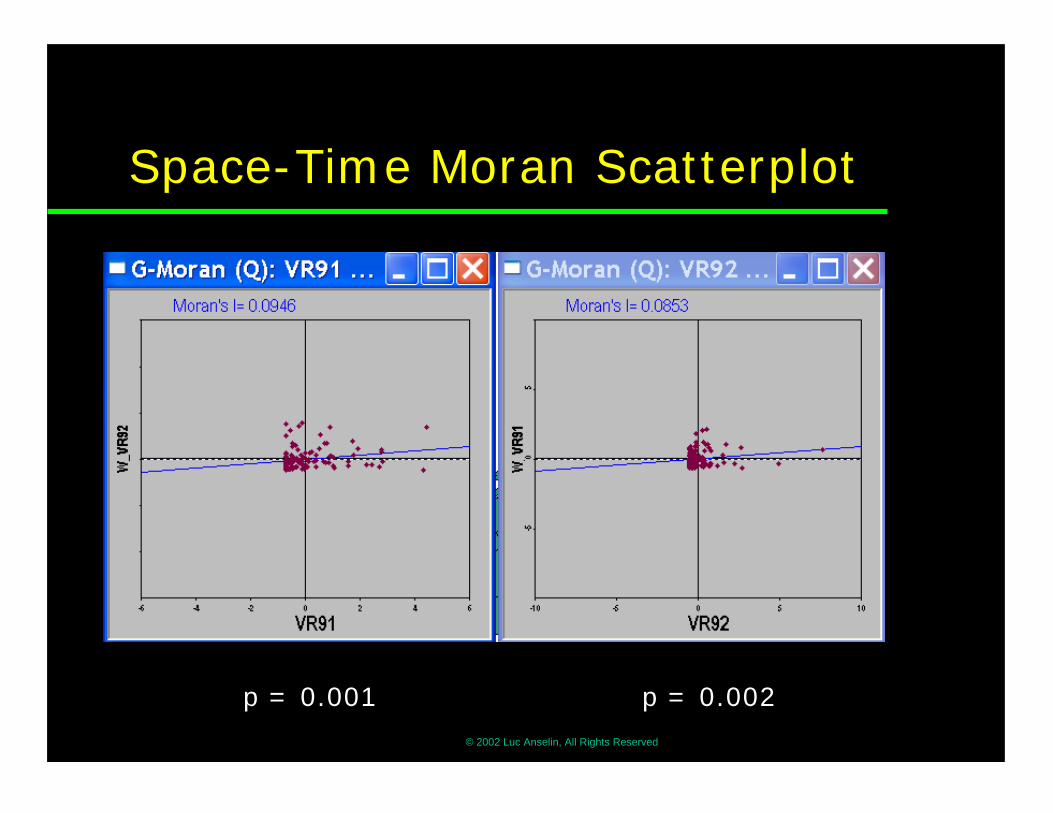
Space-Time Moran Scatterplot
�Generalized Moran Scatterplot� Regression slope of Wzt on zt-1
• both variables standardized• = visualization of Wartenberg multivariate Moran
statistic
� Significance testing• permutation• permutation envelope (2.5% and 97.5% from
permutation reference distribution)
�Four Types of Association� High-high, Low-low; High-low, Low-high
© 2002 Luc Anselin, All Rights Reserved
Space-Time Moran Scatterplot
p = 0.002p = 0.001

Moran Scatterplot Matrix
© 2002 Luc Anselin, All Rights Reserved
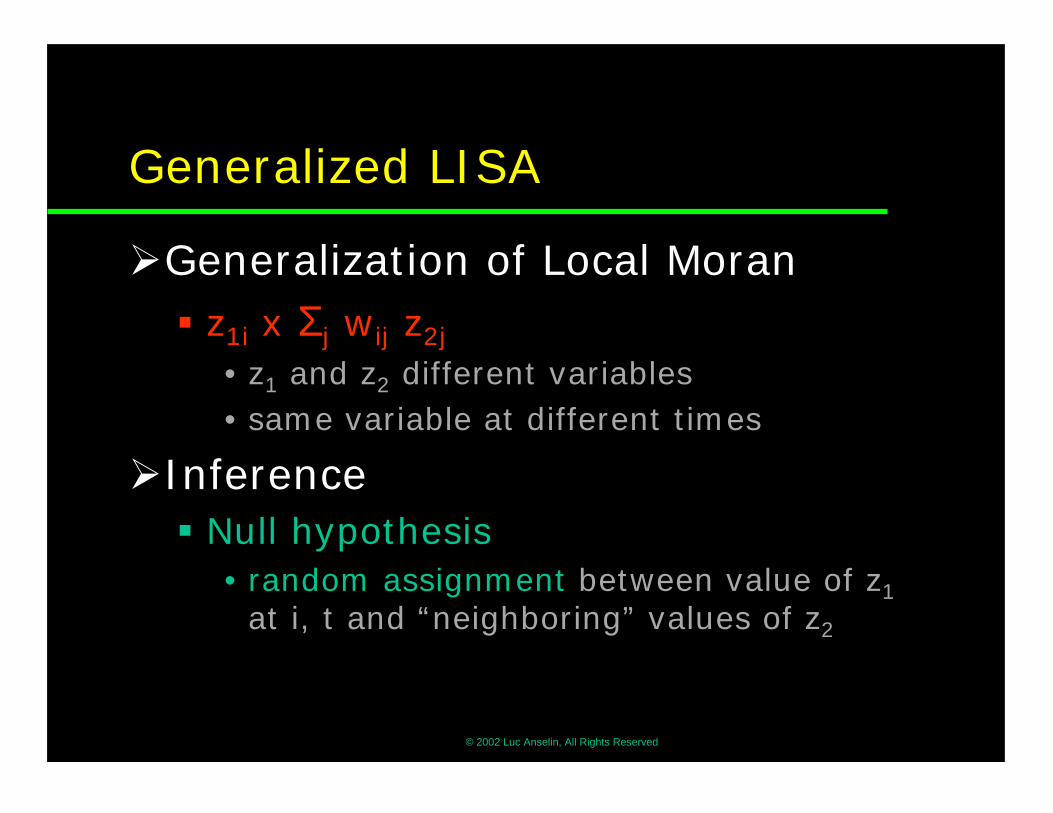
Generalized LISA
�Generalization of Local Moran� z1i x Σj wij z2j
• z1 and z2 different variables• same variable at different times
�Inference� Null hypothesis
• random assignment between value of z1at i, t and “neighboring” values of z2
© 2002 Luc Anselin, All Rights Reserved
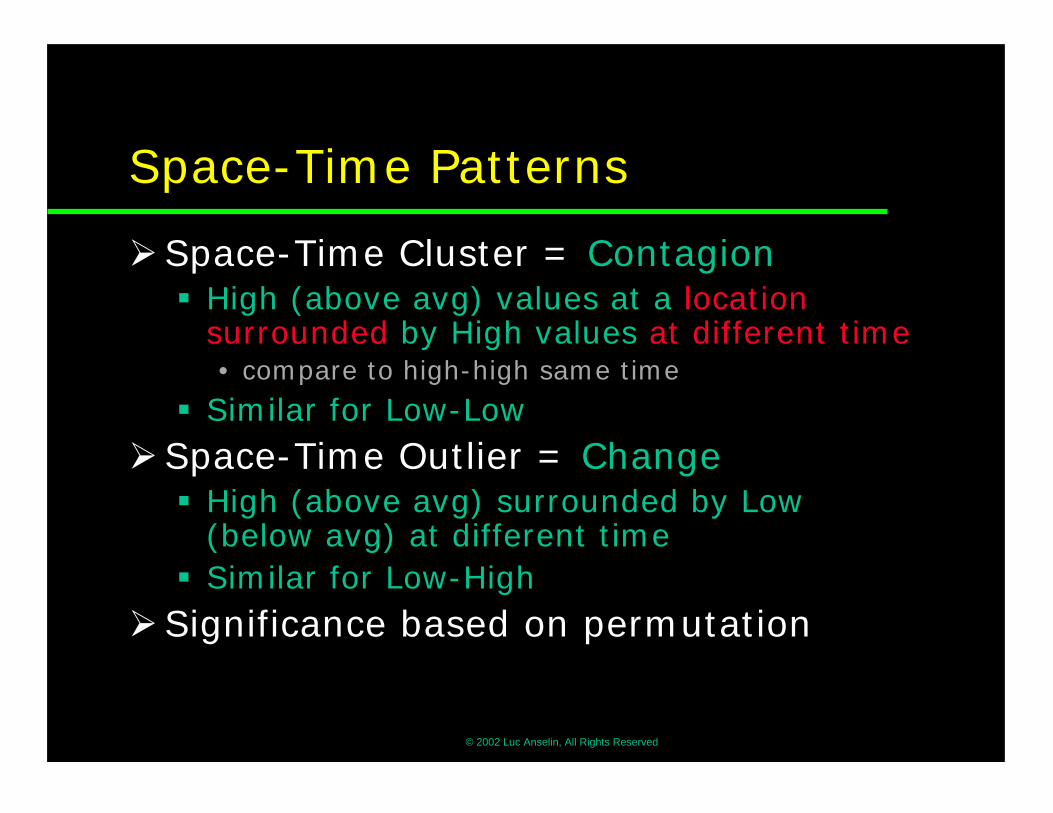
Space-Time Patterns
�Space-Time Cluster = Contagion� High (above avg) values at a location
surrounded by High values at different time• compare to high-high same time
� Similar for Low-Low�Space-Time Outlier = Change
� High (above avg) surrounded by Low (below avg) at different time
� Similar for Low-High�Significance based on permutation
© 2002 Luc Anselin, All Rights Reserved
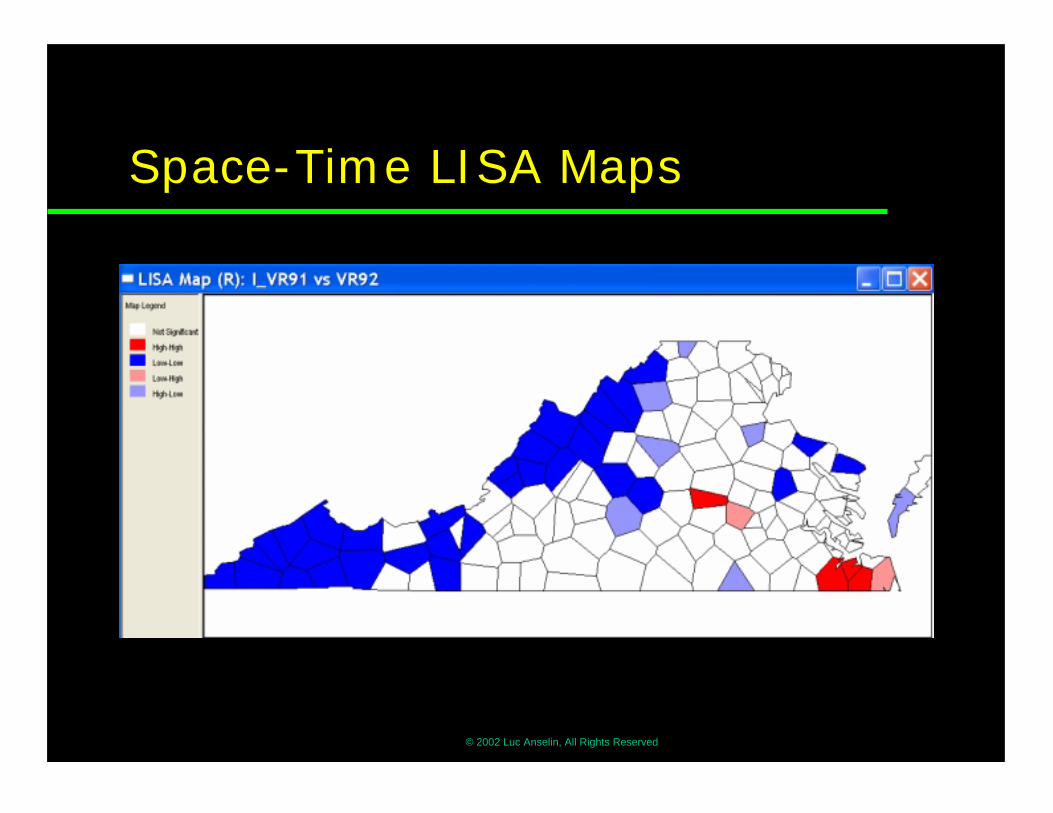
Space-Time LISA Maps

© 2002 Luc Anselin, All Rights Reserved
Interpretation and Limitations
� Most Important� assessing lack of spatial randomness� suggests “significant” spatial structure
� Multivariate Association� univariate spatial autocorrelation may result from
• multivariate association• scale mismatch
� need to control for other variables = spatial regression
� LISA Clusters and Hot Spots� suggest interesting locations� do not explain