SPATIAL DISTRIBUTION OF DAMAGES TO BURIED PIPES FOLLOWING...
8
SPATIAL DISTRIBUTION OF DAMAGES TO BURIED PIPES FOLLOWING THE 2007 NIIGATA-KEN CHUETSU-OKI, JAPAN, EARTHQUAKE K. Kimishima 1 , Y. Maruyama 2 and F. Yamazaki 3 ABSTRACT This study investigates damage distribution characteristics after the 2007 Niigata- ken Chuetsu-oki, Japan, earthquake. First, various damage datasets, e.g. water pipes, low-pressure gas pipes, mid-pressure gas pipes, sewage lines, collapsed houses, liquefaction occurrences, are integrated on Geographic Information System (GIS). Using the datasets, spatial distribution of damages is investigated with respect to geomorphological land classification and altitude. Then, the damage ratios of lifeline systems are compared under various conditions. Finally, the minimum distances among the damaged locations are measured and the spatial correlations of damages to the lifeline systems are evaluated. The results of this study suggest that the damage incidents to low-pressure gas pipes are often found near those to water distribution pipes. Hence, the interactions among functional losses of lifeline systems are expected to be taken into consideration in the restoration process after urban earthquakes. Introduction According to the Headquarters for Earthquake Research Promotion in Japan (2009), the probability that an earthquake of M7.0 occurs is about 70% in Tokyo Metropolitan area within 30 years. The Central Disaster Prevention Council in Japan (2005) has estimated huge economical losses (approximately 112 trillion yen) if the scenario Tokyo Metropolitan earthquake occurs. Damage to lifeline systems alone is estimated to be approximately 11.4 trillion yen. The number of households affected by disruptions of electricity, telecommunication, and gas supply is expected to be approximately 1.6, 1.1, and 1.2 millions, respectively. Similarly, about 11 million people will not be able to use water supply lines. Tokyo Metropolis is the most important social, political, economical, and financial center of Japan. It is anticipated that its role will be disrupted for a long time after the scenario Tokyo Metropolitan earthquake. As a precaution, restoration plans against the earthquake have been put forwarded by various organizations. Local governments have made predictions regarding seismic-induced damages due to scenario earthquakes to establish proper restoration plans. 1 Graduate Student, Dept. of Urban Environment Systems, Chiba University, Chiba, Japan 263-8522 2 Associate Professor, Dept. of Urban Environment Systems, Chiba University, Chiba, Japan 263-8522 3 Professor, Dept. of Urban Environment Systems, Chiba University, Chiba, Japan 263-8522 Proceedings of the 9th U.S. National and 10th Canadian Conference on Earthquake Engineering Compte Rendu de la 9ième Conférence Nationale Américaine et 10ième Conférence Canadienne de Génie Parasismique July 25-29, 2010, Toronto, Ontario, Canada • Paper No 857 1
Transcript of SPATIAL DISTRIBUTION OF DAMAGES TO BURIED PIPES FOLLOWING...

SPATIAL DISTRIBUTION OF DAMAGES TO BURIED PIPES FOLLOWING THE 2007 NIIGATA-KEN CHUETSU-OKI, JAPAN, EARTHQUAKE
K. Kimishima1 , Y. Maruyama2 and F. Yamazaki3
ABSTRACT This study investigates damage distribution characteristics after the 2007 Niigata-
ken Chuetsu-oki, Japan, earthquake. First, various damage datasets, e.g. water pipes, low-pressure gas pipes, mid-pressure gas pipes, sewage lines, collapsed houses, liquefaction occurrences, are integrated on Geographic Information System (GIS). Using the datasets, spatial distribution of damages is investigated with respect to geomorphological land classification and altitude. Then, the damage ratios of lifeline systems are compared under various conditions. Finally, the minimum distances among the damaged locations are measured and the spatial correlations of damages to the lifeline systems are evaluated. The results of this study suggest that the damage incidents to low-pressure gas pipes are often found near those to water distribution pipes. Hence, the interactions among functional losses of lifeline systems are expected to be taken into consideration in the restoration process after urban earthquakes.
Introduction According to the Headquarters for Earthquake Research Promotion in Japan (2009), the probability that an earthquake of M7.0 occurs is about 70% in Tokyo Metropolitan area within 30 years. The Central Disaster Prevention Council in Japan (2005) has estimated huge economical losses (approximately 112 trillion yen) if the scenario Tokyo Metropolitan earthquake occurs. Damage to lifeline systems alone is estimated to be approximately 11.4 trillion yen. The number of households affected by disruptions of electricity, telecommunication, and gas supply is expected to be approximately 1.6, 1.1, and 1.2 millions, respectively. Similarly, about 11 million people will not be able to use water supply lines. Tokyo Metropolis is the most important social, political, economical, and financial center of Japan. It is anticipated that its role will be disrupted for a long time after the scenario Tokyo Metropolitan earthquake. As a precaution, restoration plans against the earthquake have been put forwarded by various organizations. Local governments have made predictions regarding seismic-induced damages due to scenario earthquakes to establish proper restoration plans. 1Graduate Student, Dept. of Urban Environment Systems, Chiba University, Chiba, Japan 263-8522 2Associate Professor, Dept. of Urban Environment Systems, Chiba University, Chiba, Japan 263-8522 3Professor, Dept. of Urban Environment Systems, Chiba University, Chiba, Japan 263-8522
Proceedings of the 9th U.S. National and 10th Canadian Conference on Earthquake Engineering Compte Rendu de la 9ième Conférence Nationale Américaine et 10ième Conférence Canadienne de Génie Parasismique July 25-29, 2010, Toronto, Ontario, Canada • Paper No 857
1
To estimate damage ratios of water and gas distribution pipes, fragility curves were empirically obtained based on damage datasets after the 1995 Kobe earthquake (Isoyama et al., 2000; Mitsuya et al., 2006). It was not so easy to evaluate the relationship between the ground motion intensity and the damage rate because the number of seismometers was few at that time. Since the 1995 Kobe earthquake, the number of seismometers has increased a lot and various kinds of nationwide spatial data have become available. With these new circumstances, the methodology to estimate seismically-induced damages can be revised by analyzing the damage data from recent earthquakes. This study investigates the damage distribution characteristics after the 2007 Niigata-ken Chuetsu-oki, Japan, earthquake, combining with various nationwide spatial data. The distribution of damages to buried pipes is discussed from the viewpoint of simultaneous occurrence in space.
Integration of Various Datasets on GIS Geographic Information System (GIS) is often used to analyze the damages to lifeline systems during earthquakes (Jeon and O’Rourke, 2005; Kuwata et al., 2008). This study also
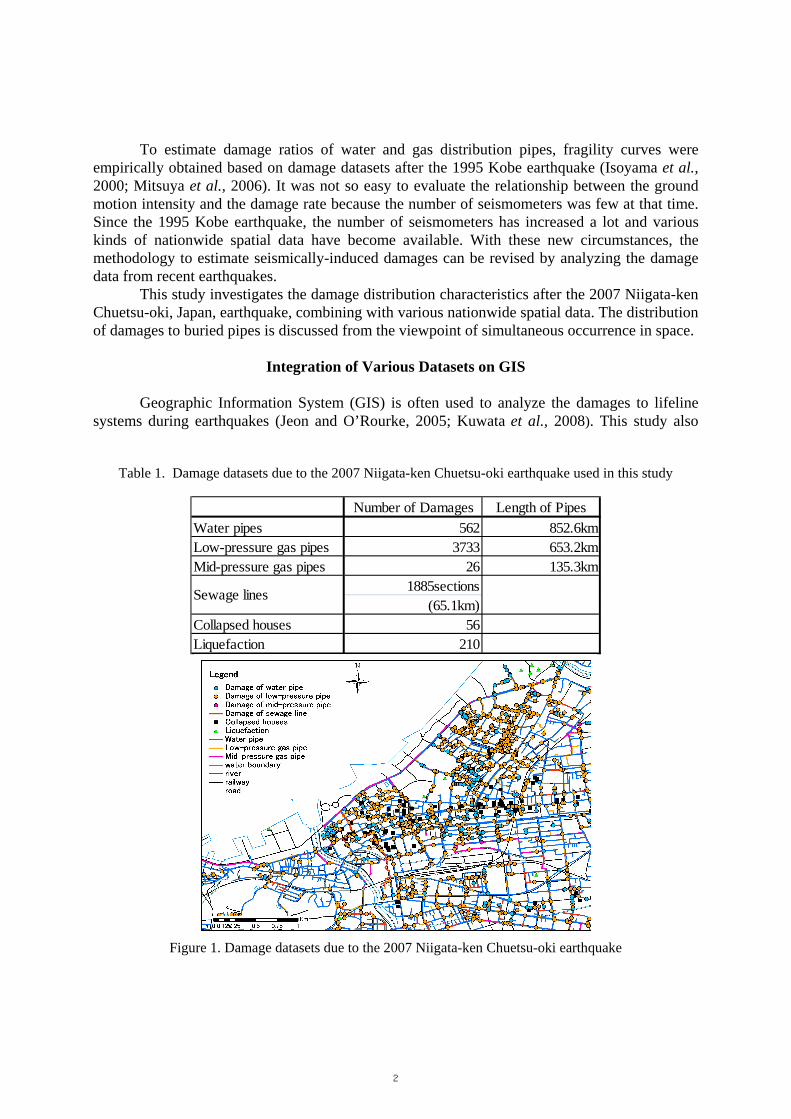
Table 1. Damage datasets due to the 2007 Niigata-ken Chuetsu-oki earthquake used in this study
Number of Damages Length of Pipes
Water pipes 562 852.6kmLow-pressure gas pipes 3733 653.2kmMid-pressure gas pipes 26 135.3km
1885sections(65.1km)
Collapsed houses 56Liquefaction 210
Sewage lines
Figure 1. Damage datasets due to the 2007 Niigata-ken Chuetsu-oki earthquake
2

uses GIS to investigate the damage datasets after the 2007 Niigata-ken Chuetsu-oki earthquake. Various kinds of damage datasets, e.g. water pipes, low-pressure gas pipes, mid-pressure gas pipes, sewage lines, collapsed houses, liquefaction occurrences, were collected and they were integrated on ArcGIS 9.2 software. The datasets include the information of buried pipes: location, material, diameter etc., in Kashiwazaki City and Kariwa Town in Niigata Prefecture, which were subjected to severe seismic motion during the earthquake and they were mapped with GIS. Damage datasets used in this study are shown in Table 1. The datasets include the locations of breaks/leaks of water, gas, and sewage lines, and those of collapsed houses. Liquefaction occurrences were also detected by visual inspection using aerial images from Pasco Co., Ltd. The Digital Map 2500 (Spatial Data Framework), developed by the Geographical Survey Institute of Japan (2002), was used as a base map. The various datasets integrated on GIS are shown in Fig. 1.
Spatial Distribution of Pipe Damages Relationship between the ground condition and pipe damage distribution The geographical feature datasets were overlapped with the damage datasets on GIS and the damage ratios of pipeline systems were calculated with respect to geographical conditions. The damage ratios of water, low-pressure gas, and mid-pressure gas pipes were calculated by Eq. (1). The damage ratio of sewage lines was calculated by Eq. (2).
(km) pipe oflength Total
damagesofNumber(1/km) ratio Damage = (1)
( ) ( ) 100(km) line oflength Total
km sectionsdamagedofLength% ratio Damage ×= (2)
The lengths of sewage line with respect to geographical conditions were estimated from the total length (710 km) of the sewage line and the GIS data of the water distribution pipes, as the GIS location data of the sewage system was not available. The length of sewage line was assumed to be proportional to that of the water distribution pipe for each geographical class. Relationship between geomorphological land classification and lifeline damages Fig. 2 shows the distribution of damages to lifeline systems plotted on the geomorphological land classification. The geomorphological land classification dataset used in this study is a nationwide digital map constructed by Wakamatsu et al. (2006). According to this classification map, the central part of Kashiwazaki City is mainly classified as sand dune, delta and coastal lowland, and back marsh. The damage ratios of water, low-pressure gas, and mid-pressure gas pipes with respect to the geographical land classification are shown in Fig. 3(a). The damage ratio of the sewage system is plotted in Fig. 3(b). The damage ratio of water distribution pipes is the highest in delta and coastal lowland areas (1.48), followed by sand dune (1.35). Similarly, the damage ratio of low-pressure gas pipes
3

is the highest in delta and coastal lowland (11.93), followed by natural levee (11.92). As for the water and low-pressure gas pipes, the damage ratios are high for the geographical classes, which mainly consist of soft soil. The damage ratio of mid-pressure gas pipes is the highest in natural levee (0.65) and the second highest in delta and coastal lowland (0.47). The damage ratio of sewage lines is the highest in natural levee (32%) while it is 19% in delta and coastal lowland. As for the mid-pressure gas pipes and sewage lines, the damage ratios are high in natural levee and delta and coastal lowland. Relationship between the altitude and pipe damages Fig. 4 shows the location of damage incidents (breaks/leaks) of lifeline systems and the altitude model, which was developed by the Geographical Survey Institute of Japan (2001). The altitude is shown in 50 x 50 m2 grid cells. The damage ratios of water, low-pressure gas and mid-
Figure 2. Damages to lifeline systems in Kashiwazaki and geographical land classifications.
0.0
2.0
4.0
6.0
8.0
10.0
12.0
othe
r
Mou
ntai
n
Mou
ntai
n fo
otsl
ope
Hill
Gra
velly
terr
ace
Valle
y bo
ttom
low
land
Allu
vial
fan
Nat
ural
leve
e
Bac
k m
arsh
Del
ta an
d co
asta
l lo
wla
ndM
arin
e san
d an
d gra
vel
bars Sa
nd d
une
Fille
d la
nd
Gra
vel a
nd re
ef
Dam
age r
atio
(1/k
m)
Geomorphological land
Water pipe
Low-pressure gas pipe
Mid-pressure gas pipe
0%
5%
10%
15%
20%
25%
30%
35%
othe
r
Mou
ntai
n
Mou
ntai
n fo
otsl
ope
Hill
Gra
velly
terr
ace
Valle
y bo
ttom
low
land
Allu
vial
fan
Nat
ural
leve
e
Bac
k m
arsh
Del
ta an
d co
asta
l lo
wla
ndM
arin
e san
d an
d gra
vel
bars Sa
nd d
une
Fille
d la
nd
Gra
vel a
nd re
ef
Dam
age r
atio
Geomorphological land
Sewage line
(a) Water, low-pressure gas, and mid-pressure gas pipes (b) Sewage lines
Figure 3. Damage ratios of lifelines with respect to geographical land classifications.
4

pressure gas pipes with respect to the altitude are shown in Fig. 5(a) and that of sewage lines is shown in Fig. 5(b). The damage ratios of water, low-pressure gas and mid-pressure gas pipes are the highest for altitude class 0-5 m. The damage ratio of sewage lines is the highest when the altitude is 10-15 m. The damage ratio is still in high values for the altitude 0-10 m. As for water, low-pressure gas, and mid-pressure gas pipes, no notable difference is seen in the trend of the damage ratios of the three buried pipes. Evaluation on the Co-occurrence of Buried Pipe Damages To evaluate the probability that earthquake damages are caused simultaneously, the shortest distances among the locations of the various damages were analyzed. The distances to neighboring damages were obtained for all the damage incidents (Fig. 6), and then the shortest
Figure 4. Relationship between the altitude class and lifeline damage
0.0
2.0
4.0
6.0
8.0
10.0
12.0
14.0
16.0
0m-5
m5m
-10m
10m
-15m
15m
-20m
20m
-25m
25m
-30m
30m
-35m
35m
-40m
40m
-45m
45m
-50m
50m
-55m
55m
-60m
60m
-65m
65m
-70m
70m
-75m
75m
-80m
80m
-85m
85m
-90m
90m
-95m
95m
-100
m10
0m-
Dam
age r
atio
(1/k
m)
Altitude
Water pipe
Low-pressure gas pipe
Mid-pressure gas pipe
0%
2%
4%
6%
8%
10%
12%
14%
0m-5
m5m
-10m
10m
-15m
15m
-20m
20m
-25m
25m
-30m
30m
-35m
35m
-40m
40m
-45m
45m
-50m
50m
-55m
55m
-60m
60m
-65m
65m
-70m
70m
-75m
75m
-80m
80m
-85m
85m
-90m
90m
-95m
95m
-100
m10
0m-
Dam
age r
atio
Altitude
Sewage line
(a) Water, low-pressure gas, and mid-pressure gas pipes (b) Sewage lines
Figure 5. Damage ratios of lifelines with respect to the altitude class
5

distances were found for all the damage locations of water, low-pressure gas, and mid-pressure gas pipes, sewage lines, houses, and liquefaction occurrence. Because of the data structure in GIS, the polylines, which indicate the damage locations of sewage lines, were divided into the points with 1m intervals, and then the shortest distances were calculated. Table 2 shows the ratio of the damage incidents with the shortest distance less than 250 m. According to the results in Table 2, another damage of low-pressure gas pipe is located within a 250 m radius of a damage with 99.2% probability. High probability values are also found for water distribution pipes and sewage lines. The obtained results indicate that the probability that damage incidents are caused simultaneously to these buried pipes is thought to be high. In other words, if a break occurs in a pipe, another break of the pipe can be found in its neighbor with a high probability. Within a 250 m radius of a collapsed house, various pipe breaks can be found in a high probability. This is due to the fact that the location of collapsed houses corresponds to the area of strong seismic motion. The location of mid-pressure gas pipe breaks, however, seems to have no relation with collapsed houses. It is known that the causes of mid-pressure gas pipe breaks are
Figure 6. Definition of the shortest distances between the damage incidents.
Table 2. Percentage of the damage incidents with the shortest distance less than 250 m.
Water pipes 86.3 86.5 10.9 76.2 14.2 30.6Low-pressure gas pipes 71.8 99.2 11.1 69.1 7.7 33.2Mid-pressure gas pipes 65.4 100.0 28.0 61.5 19.2 3.8
Sewage lines 63.0 87.8 4.8 97.7 8.6 14.9Liquefaction 48.2 64.3 12.5 62.5 57.1 3.6
Collapsed houses 94.3 100.0 2.4 92.4 5.2 99.0
Legend 100-90% 90-80% 80-70% 70-60% 60-50% 50%-
Water pipes Collapsedhouses
Low-pressuregas pipes
Mid-pressuregas pipes Sewage lines LiquefactionReferenc
Target
6
mostly welding defects and long-column buckling, that are quite different with other causes of pipe breaks. The mid-pressure gas pipe breaks can be found mostly within a 250 m distance of low-pressure gas pipe breaks, but this is due to the fact that the amount of low-pressure gas pipe is abundant. Generally, the damage ratios of buried pipes are assumed to be larger in the liquefied areas. Table 2 shows that the correlation between the locations of liquefaction and those of the buried pipe damages is not so high. Most of the liquefaction sites were visually detected from the aerial images taken after the earthquake event in spite of the fact that it is difficult to detect all the locations of liquefied areas. Hence, the spatial correlation between liquefaction and buried pipe damages should be investigated later using a detailed dataset of liquefaction occurrence.
Conclusions In this study, the spatial distribution of pipe damages caused by the 2007 Niigata-ken Chuetsu-oki earthquake was analyzed with the aid of GIS. The damage ratios of buried pipes were obtained with regard to the geographical condition and the spatial correlations of the locations of seismically-induced damages were discussed. In the current datasets, within a 250 m radius of a collapsed house, water and gas pipe breaks were found with high probability. But it may be dependent of the accuracy of damage surveys and the characteristics lifeline systems affected. A further study is necessary till more solid conclusions on spatial correlation of various earthquake damages are obtained.
Acknowledgments The authors appreciate Gas and Water Bureau of Kashiwazaki City, Japan Gas Association, Geographical Survey Institute of Japan and Pasco Co., Ltd. for providing the valuable datasets used in this study.
References
Central Disaster Prevention Council in Japan, 2005, http://www.bousai.go.jp/jishin/chubou/shutochokka/ houkoku.pdf (in Japanese).
Geographical Survey Institute, 2002, Digital Map 2500 (Spatial Data Framework), CD-ROM,
Geographical Survey Institute, Tsukuba city, Japan Geographical Survey Institute in Japan, 2001, Digital Map 50m Grid (Elevation), CD-ROM,
Geographical Survey Institute, Tsukuba city, Japan Headquarters for Earthquake Research Promotion in Japan, 2009, http://www.jishin.go.jp/main/
p_hyoka02.htm (in Japanese). Isoyama, R., Ishida, E., Yune, K. and Shirozu, T., 2000. Seismic damage estimation procedure for water
supply pipelines, Water Supply 18 (3), 63-68. Jeon, S., and O’Rourke,T. D., 2005, Northridge Earthquake Effects on Pipelines and Residential
Buildings, Bulletin of Seismological Society of America, Vol. 95, No.1, pp. 294-318.
7

Kuwata, Y., Blard, J. and Takada, S. ,2008, Damage Analysis of the Water Supply System of in Case of
the 2007 Niigataken Chuetsu-Oki Earthquake, Memoirs of Construction Engineering Research Institute Vol.50(paper), pp.155-164.
Mitsuya, M., Sakanoue, T. and Hosokawa, N., 2006, Damage prediction of low pressure gas pipes based
on the damage records of Hyogoken-Nanbu earthquake, The 12th Earthquake Engineering Symposium Proceedings, pp. 1250-1253(in Japanese with English abstract).
Wakamatsu, K., Matsuoka, M. and Hasegawa, K., 2006, GIS-Based Nationwide Hazard Zonings Using
Japan Engineering Geomorphologic Classification Map, Proc. 8th U.S. National Conference on Earthquake Engineering, CD-ROM Vol.1, Paper No.849.
8