FINITE ELEMENT MODELING OF BURIED GLASS … · FINITE ELEMENT MODELING OF BURIED GLASS-REINFORCED...
14
10th International Conference on Composite Science and Technology ICCST/10 © IDMEC 2015 FINITE ELEMENT MODELING OF BURIED GLASS-REINFORCED COMPOSITE PIPE Long Bin Tan, Kwong Ming Tse, Vincent Beng Chye Tan*, Heow Pueh Lee Department of Mechanical Engineering, National University of Singapore *e-mail: [email protected] Key words: Glass-reinforced, Composite, Fibers, FE modeling, Underground pipe, Pipe-Soil Interaction, Regional modeling 1. ABSTRACT Two regional finite element (FE) models of a buried glass-fiber reinforced composite pipe have been developed at the National University of Singapore (NUS). The model replicates an arbitrary site whereby fuel is being transported through the 400 mm diameter line, and comprises of multiple components such as the valve pit, 45 degrees and 90 degrees pipe bends, and a service road consisting of the surface course and subbase course layers that cuts across the buried pipeline at the ground surface. The regional models are developed to investigate several loading scenarios that may be experienced by the composite pipe throughout its lifetime. Properties of the soil strata are provided by soil investigation (SI) reports while the anisotropic properties of the glass-fiber composite pipe are obtained from both in-house testing of coupons machined from the actual composite pipes and from the pipe manufacturer. In this paper, two cases are presented to study the buried pipe response, in terms of the induced hoop and axial stresses and the resulting pipe displacement, due to overburden load and pit settlement. The effect of internal pressurization of the pipe is also investigated. Other parameters such as the resulting soil stresses and ground settlement are also analysed. In addition, the locations of potential leakage and burst have also been identified by analysing the contact pressures at the joints and comparing stresses with the thresholds of pipe hoop and axial failure strength provided by the manufacturer. The simulation results provided insights to the response of buried composite pipes and in particular the pipe-soil interaction that occurs for mutual transfer of loads between the soil and the pipe. Results revealed that internal pressurization reduces pipe ovalization due to overburden loads but tended to increase pipe axial stresses at pipe bends. With the bell and spigot connections, the location of lowest contact pressure is at the inner springline of interfaces, and has been identified as the possible location of fuel leakage. 2. INTRODUCTION The use of fibre-glass pipes has increased significantly in recent years, especially since the cost difference between fiberglass pipes and traditional steel pipes has decreased [1]. The density of fiber-reinforced plastic (FRP) pipes is about a quarter of steel. Their low weight makes them suitable in applications where handling is a problem due to a lack of heavy handling equipment or in confined spaces such as in underground mines. FRP/GRE pipes
Transcript of FINITE ELEMENT MODELING OF BURIED GLASS … · FINITE ELEMENT MODELING OF BURIED GLASS-REINFORCED...
10th International Conference on Composite Science and Technology
ICCST/10 © IDMEC 2015
FINITE ELEMENT MODELING OF BURIED GLASS-REINFORCED
COMPOSITE PIPE
Long Bin Tan, Kwong Ming Tse, Vincent Beng Chye Tan*, Heow Pueh Lee
Department of Mechanical Engineering, National University of Singapore *e-mail: [email protected]
Key words: Glass-reinforced, Composite, Fibers, FE modeling, Underground pipe, Pipe-Soil Interaction, Regional modeling
1. ABSTRACT
Two regional finite element (FE) models of a buried glass-fiber reinforced composite pipe have been developed at the National University of Singapore (NUS). The model replicates an arbitrary site whereby fuel is being transported through the 400 mm diameter line, and comprises of multiple components such as the valve pit, 45 degrees and 90 degrees pipe bends, and a service road consisting of the surface course and subbase course layers that cuts across the buried pipeline at the ground surface.
The regional models are developed to investigate several loading scenarios that may be experienced by the composite pipe throughout its lifetime. Properties of the soil strata are provided by soil investigation (SI) reports while the anisotropic properties of the glass-fiber composite pipe are obtained from both in-house testing of coupons machined from the actual composite pipes and from the pipe manufacturer.
In this paper, two cases are presented to study the buried pipe response, in terms of the
induced hoop and axial stresses and the resulting pipe displacement, due to overburden load and pit settlement. The effect of internal pressurization of the pipe is also investigated. Other parameters such as the resulting soil stresses and ground settlement are also analysed. In addition, the locations of potential leakage and burst have also been identified by analysing the contact pressures at the joints and comparing stresses with the thresholds of pipe hoop and axial failure strength provided by the manufacturer.
The simulation results provided insights to the response of buried composite pipes and in
particular the pipe-soil interaction that occurs for mutual transfer of loads between the soil and the pipe. Results revealed that internal pressurization reduces pipe ovalization due to overburden loads but tended to increase pipe axial stresses at pipe bends. With the bell and spigot connections, the location of lowest contact pressure is at the inner springline of interfaces, and has been identified as the possible location of fuel leakage.
2. INTRODUCTION
The use of fibre-glass pipes has increased significantly in recent years, especially since the cost difference between fiberglass pipes and traditional steel pipes has decreased [1]. The density of fiber-reinforced plastic (FRP) pipes is about a quarter of steel. Their low weight makes them suitable in applications where handling is a problem due to a lack of heavy handling equipment or in confined spaces such as in underground mines. FRP/GRE pipes
Long Bin Tan, Kwong Ming Tse, Vincent Beng Chye Tan, Heow Pueh Lee
offer a number of advantages over conventional steel pipes, primarily due to better corrosion resistance of polymer composites, lower thermal expansion factor, high strength-to-weight ratio, low friction factors and also a practical jointing system. They have been used in the oil and gas pipeline industry for many years [2]. In Alberta, there are over 8000 km of FRP energy pipelines [3].
With the increasing construction of energy pipeline projects around the world, where some pipeline routes may need to cross environmentally sensitive areas, there is a growing need to improve the understanding of 3D effects in deformable pipes composed of steel or FRP materials. Unlike most metallic systems, it may be necessary to calculate the potential pressure expansion in FRP piping systems. This is mainly due to the low modulus of FRP products. Modulus values of typical FRP products may be over 10 times less than their traditional metallic counterparts. This is typical for FRP products manufactured with E-glass fibers and the lower modulus value can affect many of the design properties. FRP products can have a pressure expansion that is 25 times greater than carbon steels and stainless steels.
Parametric studies on buried composite pipelines under various loading scenarios have been presented in recent years [4-8]. Olarewaju el al. [6] found that for both surface and underground loads, the pipe displacements may change when the Young modulus of soil is varied. For soil modulus from 10 kPa to 1000 kPa, his simulation results predicted increasing pipe pressure, stress and strain. The crown has the highest absolute stress and strain while the invert has the maximum pressure. This is in agreement with Liu [9] who showed that as the modulus of soil increases, greater stresses are transmitted more efficiently over a further distance to reach the buried pipe.
In terms of varying stiffness of the embedded pipes, simulation results from Olarewaju et
al. [6] show that for low stiffness pipes (PVC or clay pipes), the pipe displacement is high at the crown but low at the invert and spring-line locations during surface blast. At higher Young’s modulus (such as steel or reinforced concrete pipes), the displacement at the crown, invert and spring-line became more equal. Pipe pressures and stresses are also lower for pipes with lower Young’s modulus, but these parameters increase as the modulus increases. It is evident that as the pipe modulus increases, the resulting pipe strains reduced due to the pipe’s increased stiffness, but the pressures and stresses increased. However, higher pipe deformations may occur when using low stiffness pipes and may lead to disconnected joints or excessive localized bending to cause leakage. The preceding observation also showed that rigid pipes transfer load while flexible pipes deform such that the load is transferred more via the soil. When the bed soil is firm, hardly any subsidence takes place hence the stiffness of the pipe has no effect either. However, when the bed is loose or soft, subsidence becomes a real issue and the effect of pipe stiffness is significant. Increasing the burial depth of underground pipe also enhances the confinement on the pipe which reduces the maximum displacement, pressure, stress and strain under all forms of loading scenarios [6, 9].
3. MECHANICAL CHARACTERIZATION & MODEL VALIDATION
In-house mechanical characterization (pipe axial and hoop directions) are conducted on
coupons obtained from machining of the actual 400 mm diameter composite pipe, so as to obtain the material constants and also verify them against those provided in the manufacturer’s specification sheet. The experiments are performed at 3 different rates and at
Long Bin Tan, Kwong Ming Tse, Vincent Beng Chye Tan, Heow Pueh Lee
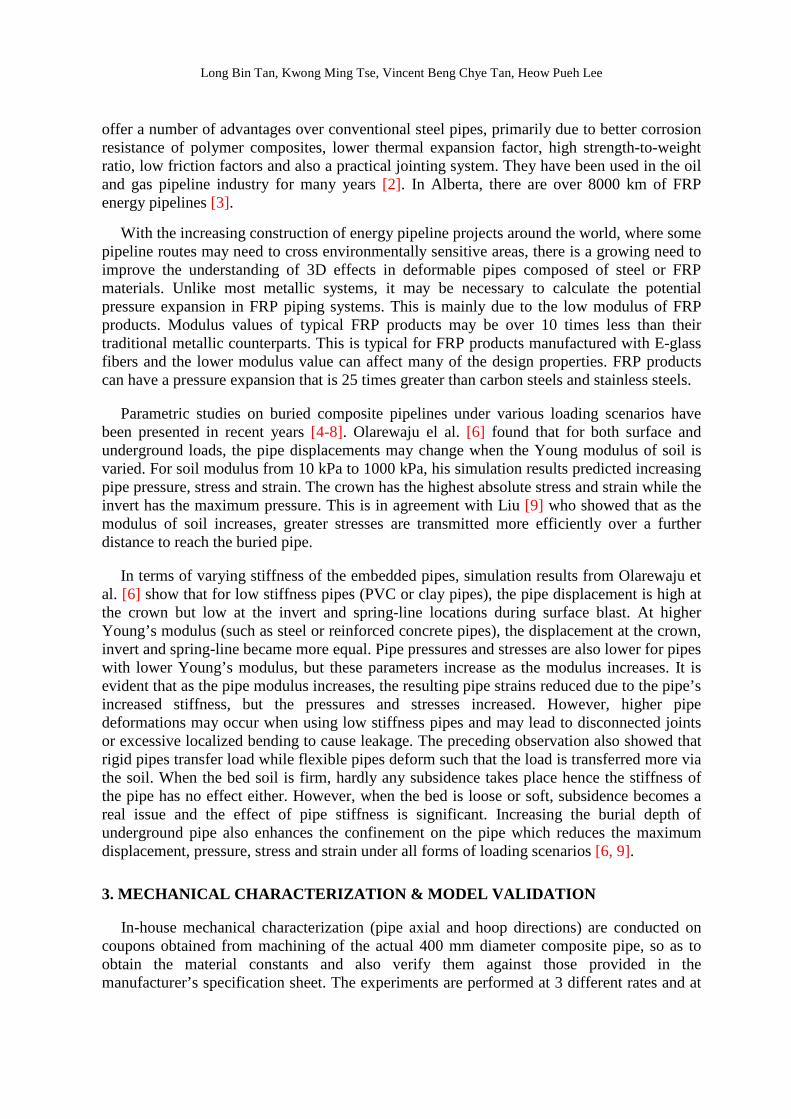
3 different temperatures. FE models of the test pieces are then created and assigned with the obtained mechanical and damage properties to validate the models before extending them for use in the regional model (see Figure 1). The details of this characterization and model validation work are presented in another paper of the ICCST/10 conference [10] while a developed global model of a buried pipeline system (using Winkler formulations for subgrade reaction and 1D elements for pipeline [11]) was presented in DAPS2015 conference.
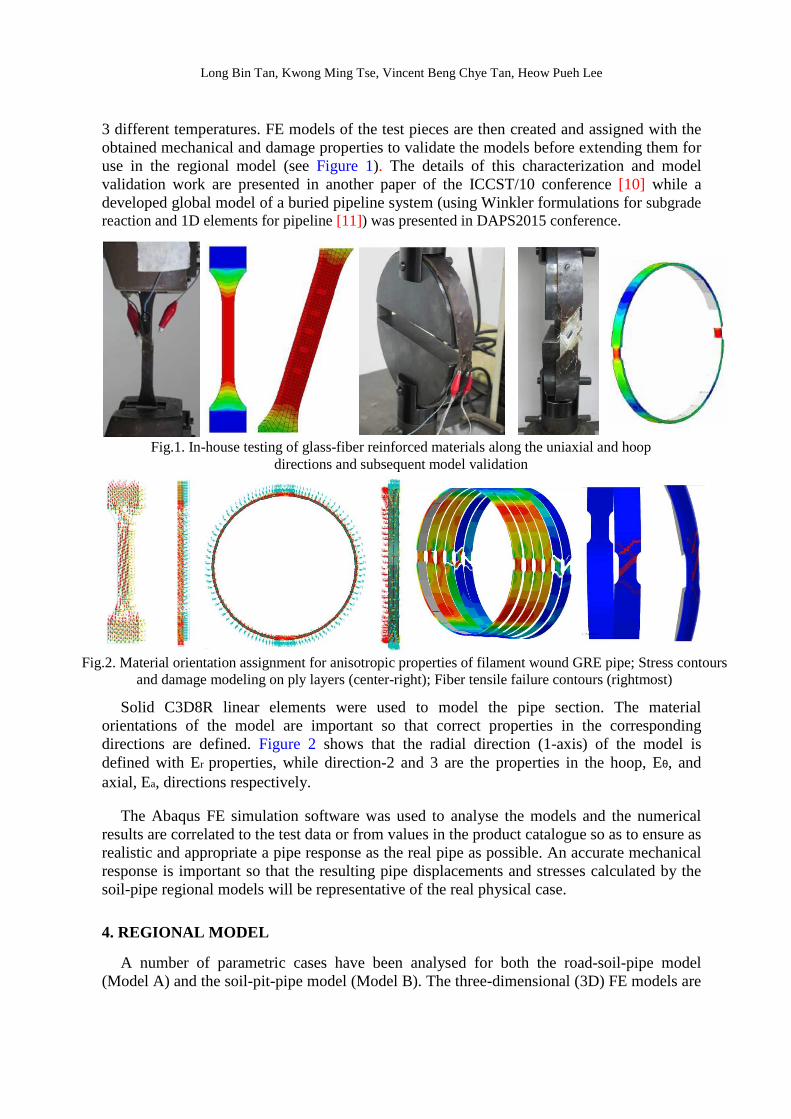
Solid C3D8R linear elements were used to model the pipe section. The material orientations of the model are important so that correct properties in the corresponding directions are defined. Figure 2 shows that the radial direction (1-axis) of the model is defined with Er properties, while direction-2 and 3 are the properties in the hoop, Eθ, and axial, Ea, directions respectively.
The Abaqus FE simulation software was used to analyse the models and the numerical results are correlated to the test data or from values in the product catalogue so as to ensure as realistic and appropriate a pipe response as the real pipe as possible. An accurate mechanical response is important so that the resulting pipe displacements and stresses calculated by the soil-pipe regional models will be representative of the real physical case.
4. REGIONAL MODEL
A number of parametric cases have been analysed for both the road-soil-pipe model (Model A) and the soil-pit-pipe model (Model B). The three-dimensional (3D) FE models are
Fig.1. In-house testing of glass-fiber reinforced materials along the uniaxial and hoop directions and subsequent model validation
Fig.2. Material orientation assignment for anisotropic properties of filament wound GRE pipe; Stress contours and damage modeling on ply layers (center-right); Fiber tensile failure contours (rightmost)
Long Bin Tan, Kwong Ming Tse, Vincent Beng Chye Tan, Heow Pueh Lee
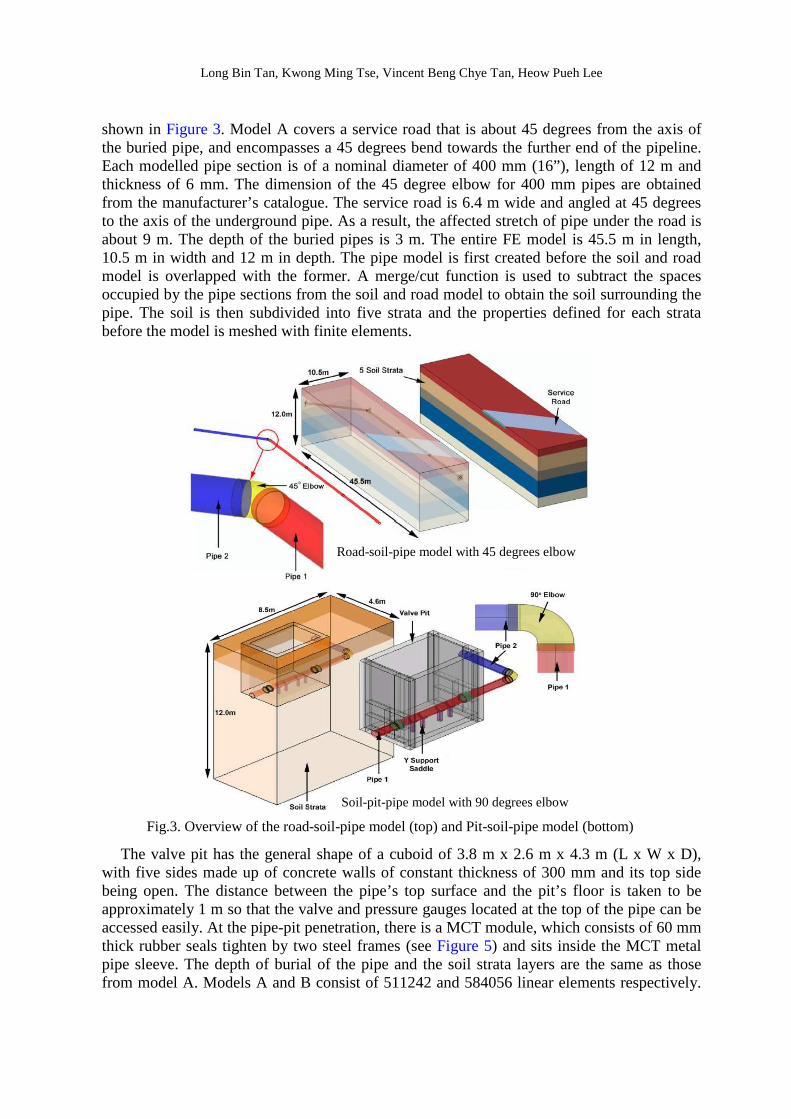
shown in Figure 3. Model A covers a service road that is about 45 degrees from the axis of the buried pipe, and encompasses a 45 degrees bend towards the further end of the pipeline. Each modelled pipe section is of a nominal diameter of 400 mm (16”), length of 12 m and thickness of 6 mm. The dimension of the 45 degree elbow for 400 mm pipes are obtained from the manufacturer’s catalogue. The service road is 6.4 m wide and angled at 45 degrees to the axis of the underground pipe. As a result, the affected stretch of pipe under the road is about 9 m. The depth of the buried pipes is 3 m. The entire FE model is 45.5 m in length, 10.5 m in width and 12 m in depth. The pipe model is first created before the soil and road model is overlapped with the former. A merge/cut function is used to subtract the spaces occupied by the pipe sections from the soil and road model to obtain the soil surrounding the pipe. The soil is then subdivided into five strata and the properties defined for each strata before the model is meshed with finite elements.
The valve pit has the general shape of a cuboid of 3.8 m x 2.6 m x 4.3 m (L x W x D),
with five sides made up of concrete walls of constant thickness of 300 mm and its top side being open. The distance between the pipe’s top surface and the pit’s floor is taken to be approximately 1 m so that the valve and pressure gauges located at the top of the pipe can be accessed easily. At the pipe-pit penetration, there is a MCT module, which consists of 60 mm thick rubber seals tighten by two steel frames (see Figure 5) and sits inside the MCT metal pipe sleeve. The depth of burial of the pipe and the soil strata layers are the same as those from model A. Models A and B consist of 511242 and 584056 linear elements respectively.
Fig.3. Overview of the road-soil-pipe model (top) and Pit-soil-pipe model (bottom)
Road-soil-pipe model with 45 degrees elbow
Soil-pit-pipe model with 90 degrees elbow
Long Bin Tan, Kwong Ming Tse, Vincent Beng Chye Tan, Heow Pueh Lee
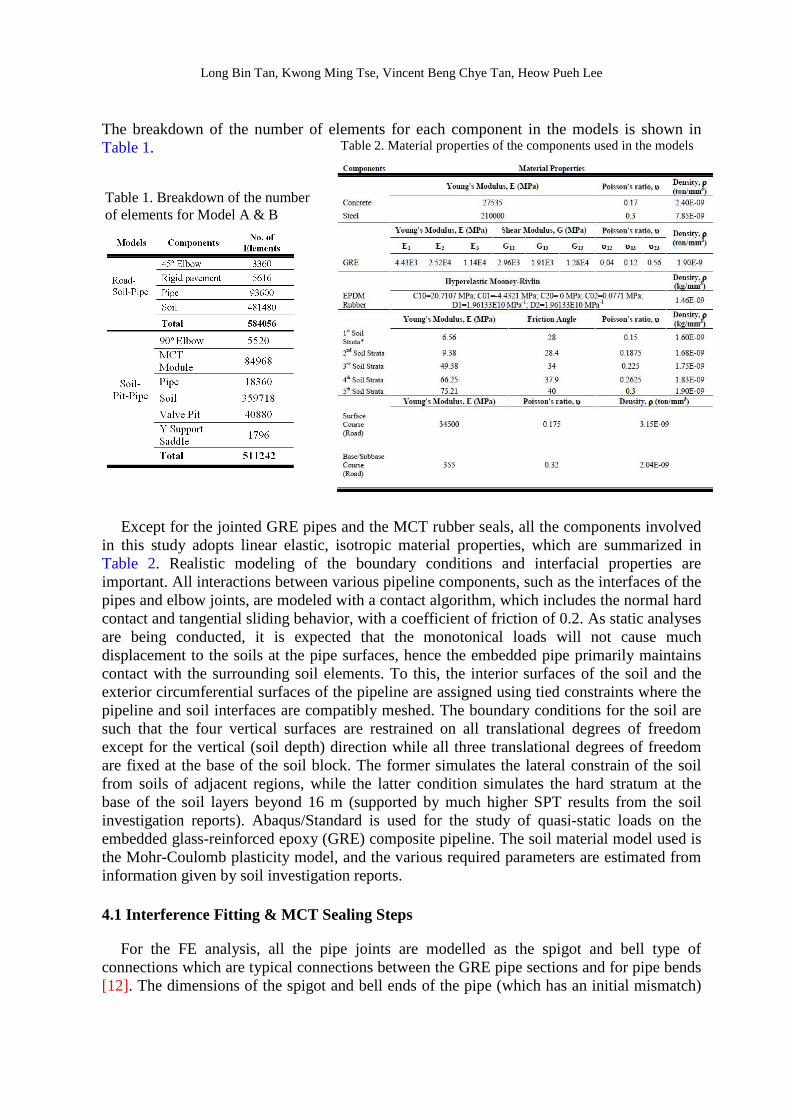
The breakdown of the number of elements for each component in the models is shown in Table 1.
Except for the jointed GRE pipes and the MCT rubber seals, all the components involved
in this study adopts linear elastic, isotropic material properties, which are summarized in Table 2. Realistic modeling of the boundary conditions and interfacial properties are important. All interactions between various pipeline components, such as the interfaces of the pipes and elbow joints, are modeled with a contact algorithm, which includes the normal hard contact and tangential sliding behavior, with a coefficient of friction of 0.2. As static analyses are being conducted, it is expected that the monotonical loads will not cause much displacement to the soils at the pipe surfaces, hence the embedded pipe primarily maintains contact with the surrounding soil elements. To this, the interior surfaces of the soil and the exterior circumferential surfaces of the pipeline are assigned using tied constraints where the pipeline and soil interfaces are compatibly meshed. The boundary conditions for the soil are such that the four vertical surfaces are restrained on all translational degrees of freedom except for the vertical (soil depth) direction while all three translational degrees of freedom are fixed at the base of the soil block. The former simulates the lateral constrain of the soil from soils of adjacent regions, while the latter condition simulates the hard stratum at the base of the soil layers beyond 16 m (supported by much higher SPT results from the soil investigation reports). Abaqus/Standard is used for the study of quasi-static loads on the embedded glass-reinforced epoxy (GRE) composite pipeline. The soil material model used is the Mohr-Coulomb plasticity model, and the various required parameters are estimated from information given by soil investigation reports.
4.1 Interference Fitting & MCT Sealing Steps
For the FE analysis, all the pipe joints are modelled as the spigot and bell type of connections which are typical connections between the GRE pipe sections and for pipe bends [12]. The dimensions of the spigot and bell ends of the pipe (which has an initial mismatch)
Table 2. Material properties of the components used in the models
Table 1. Breakdown of the number of elements for Model A & B
Long Bin Tan, Kwong Ming Tse, Vincent Beng Chye Tan, Heow Pueh Lee
are obtained from the manufacturer’s catalogue. The simulation analysis first involves running the interference fitting step which tries to match the internal and external diameters of the two sections, until equilibrium has been achieved. The derived stresses at the connections are fitting stresses. For all load scenarios, this step is first run and will be the starting point for subsequent analysis such as that of overburden load, truck load or internal pressure loading.
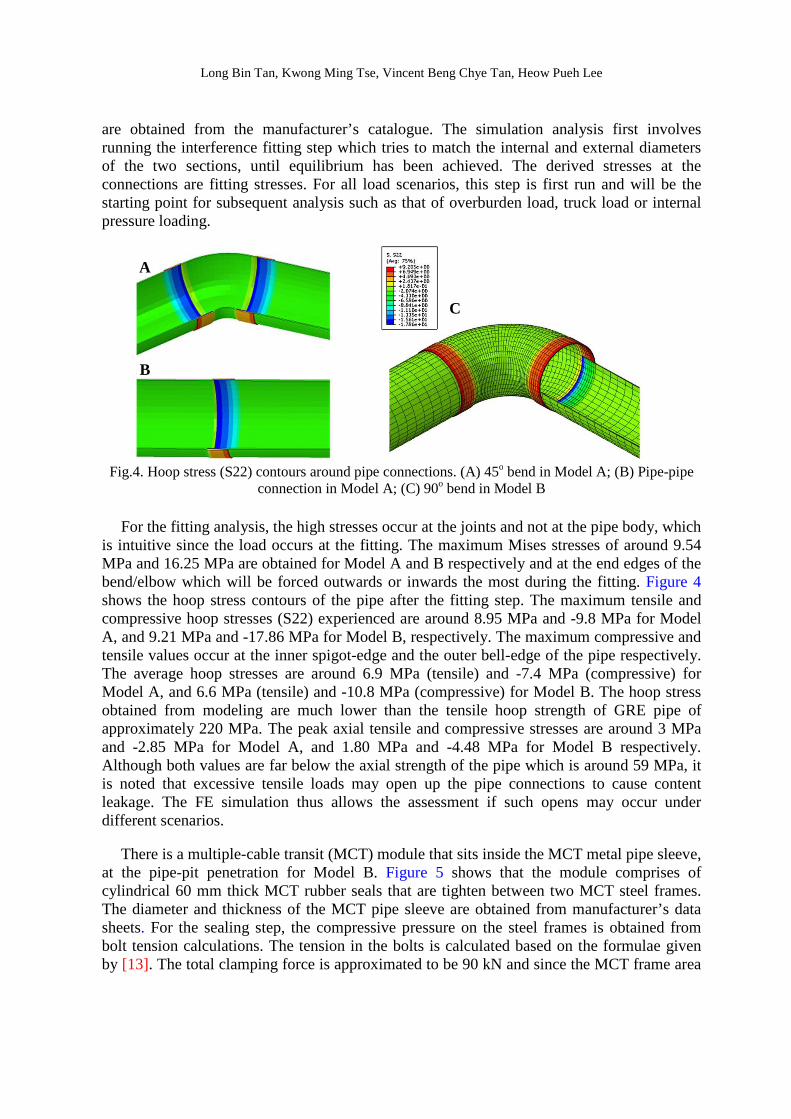
For the fitting analysis, the high stresses occur at the joints and not at the pipe body, which is intuitive since the load occurs at the fitting. The maximum Mises stresses of around 9.54 MPa and 16.25 MPa are obtained for Model A and B respectively and at the end edges of the bend/elbow which will be forced outwards or inwards the most during the fitting. Figure 4 shows the hoop stress contours of the pipe after the fitting step. The maximum tensile and compressive hoop stresses (S22) experienced are around 8.95 MPa and -9.8 MPa for Model A, and 9.21 MPa and -17.86 MPa for Model B, respectively. The maximum compressive and tensile values occur at the inner spigot-edge and the outer bell-edge of the pipe respectively. The average hoop stresses are around 6.9 MPa (tensile) and -7.4 MPa (compressive) for Model A, and 6.6 MPa (tensile) and -10.8 MPa (compressive) for Model B. The hoop stress obtained from modeling are much lower than the tensile hoop strength of GRE pipe of approximately 220 MPa. The peak axial tensile and compressive stresses are around 3 MPa and -2.85 MPa for Model A, and 1.80 MPa and -4.48 MPa for Model B respectively. Although both values are far below the axial strength of the pipe which is around 59 MPa, it is noted that excessive tensile loads may open up the pipe connections to cause content leakage. The FE simulation thus allows the assessment if such opens may occur under different scenarios.
There is a multiple-cable transit (MCT) module that sits inside the MCT metal pipe sleeve, at the pipe-pit penetration for Model B. Figure 5 shows that the module comprises of cylindrical 60 mm thick MCT rubber seals that are tighten between two MCT steel frames. The diameter and thickness of the MCT pipe sleeve are obtained from manufacturer’s data sheets. For the sealing step, the compressive pressure on the steel frames is obtained from bolt tension calculations. The tension in the bolts is calculated based on the formulae given by [13]. The total clamping force is approximated to be 90 kN and since the MCT frame area
A
B
C
Fig.4. Hoop stress (S22) contours around pipe connections. (A) 45o bend in Model A; (B) Pipe-pipe connection in Model A; (C) 90o bend in Model B

Long Bin Tan, Kwong Ming Tse, Vincent Beng Chye Tan, Heow Pueh Lee
is known, the average pressure load on the frame is calculated to be 1.49 MPa, which is applied on the surfaces of the MCT steel frames in the sealing simulation step.
Figure 6 shows the hoop stress contours of the GRE pipe at the pipe-pit penetrations of the
soil-pit-pipe model. The monitoring of these compressive forces on the GRE pipe helps investigate whether appropriate or excess sealing pressure may cause pipe failure. The pipe section at the MCT experiences lower hoop stresses (1.25 MPa (tensile); -10.59 MPa (compressive)) than the peak values at the interference fits. These values are much lower than the tensile hoop strength of GRE pipe which is 220 MPa, indicating that the pipes are still intact after the interference fitting and MCT sealing steps.
4.2 Scenario - Effect of Top Soil (Overburden) on Buried GRE Pipe
After the interference fitting and the MCT sealing steps, the effect of the surrounding soil and overburden load on the buried pipeline integrity and response is studied. A geostatic step is conducted whereby gravity load is applied to the entire model to allow the soil to interact with the pipe and have the weight of the overburden top soil acting on the pipes. The pipes are also resisted laterally due to the surrounding soil. In this regard, the pipes will experience both vertical and horizontal bearing loads due to the surrounding soil.
4.2.1 Road-soil-pipe Model - At Operating Condition
The next step of the analysis corresponds to the application of pressure to the internal walls of the entire pipeline. The chosen pressure is 10 bars (1 MPa) as this is the designated operating pressure of the GRE pipeline. The effect of the surrounding soil due to the pipe expansion is shown in Figure 7. The chronology of the analysis steps that is performed allowed the authors to obtain pipe stresses and displacements due to overburden load for the case with and without internal pressure. Due to length constraints of the article, only pipe responses at the operating condition are presented.
With the applied internal pressure, the pipe expands which causes the surrounding soil
adjacent to the pipe to be pushed. This affected the soil stresses immediately around it as shown by the soil-pipe interaction (i.e. changes in soil stress contours). The highest Mises
Fig.5. Schematic diagram of MCT module Fig.6. Hoop stress contours of GRE pipe at the pipe-pit penetration
Long Bin Tan, Kwong Ming Tse, Vincent Beng Chye Tan, Heow Pueh Lee
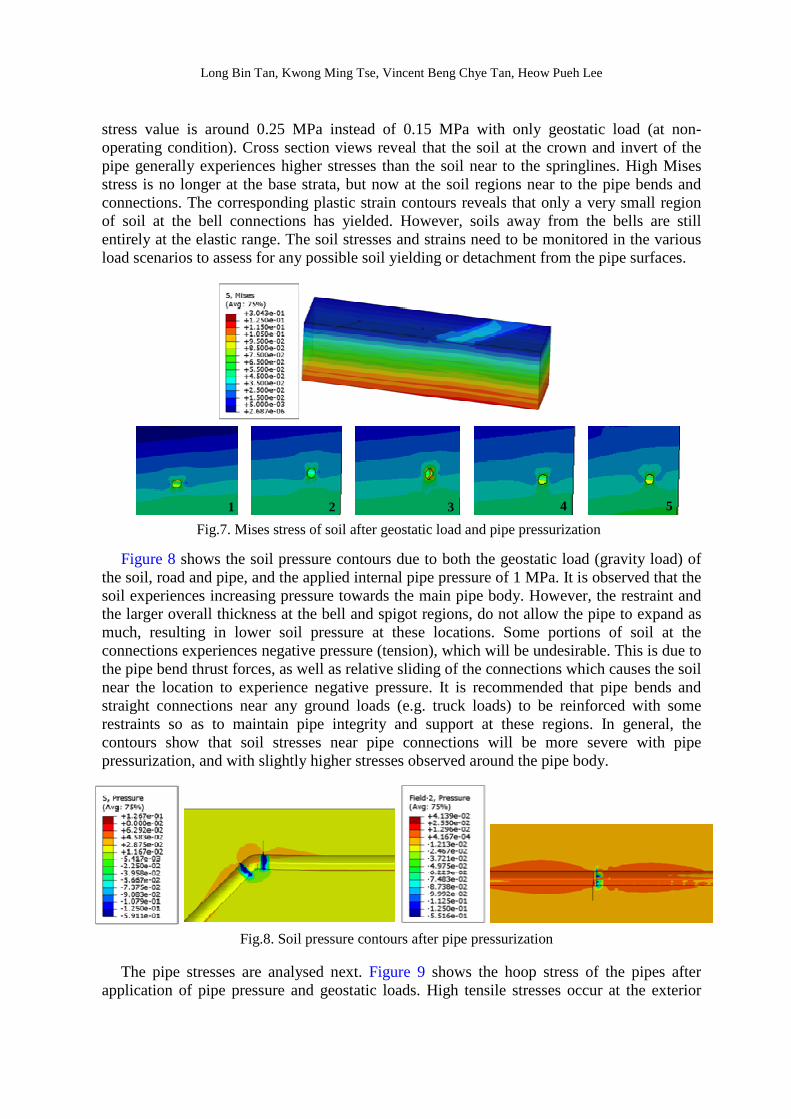
stress value is around 0.25 MPa instead of 0.15 MPa with only geostatic load (at non-operating condition). Cross section views reveal that the soil at the crown and invert of the pipe generally experiences higher stresses than the soil near to the springlines. High Mises stress is no longer at the base strata, but now at the soil regions near to the pipe bends and connections. The corresponding plastic strain contours reveals that only a very small region of soil at the bell connections has yielded. However, soils away from the bells are still entirely at the elastic range. The soil stresses and strains need to be monitored in the various load scenarios to assess for any possible soil yielding or detachment from the pipe surfaces.
Figure 8 shows the soil pressure contours due to both the geostatic load (gravity load) of
the soil, road and pipe, and the applied internal pipe pressure of 1 MPa. It is observed that the soil experiences increasing pressure towards the main pipe body. However, the restraint and the larger overall thickness at the bell and spigot regions, do not allow the pipe to expand as much, resulting in lower soil pressure at these locations. Some portions of soil at the connections experiences negative pressure (tension), which will be undesirable. This is due to the pipe bend thrust forces, as well as relative sliding of the connections which causes the soil near the location to experience negative pressure. It is recommended that pipe bends and straight connections near any ground loads (e.g. truck loads) to be reinforced with some restraints so as to maintain pipe integrity and support at these regions. In general, the contours show that soil stresses near pipe connections will be more severe with pipe pressurization, and with slightly higher stresses observed around the pipe body.
The pipe stresses are analysed next. Figure 9 shows the hoop stress of the pipes after application of pipe pressure and geostatic loads. High tensile stresses occur at the exterior
Fig.8. Soil pressure contours after pipe pressurization
Fig.7. Mises stress of soil after geostatic load and pipe pressurization
1 2 3 4 5
Long Bin Tan, Kwong Ming Tse, Vincent Beng Chye Tan, Heow Pueh Lee
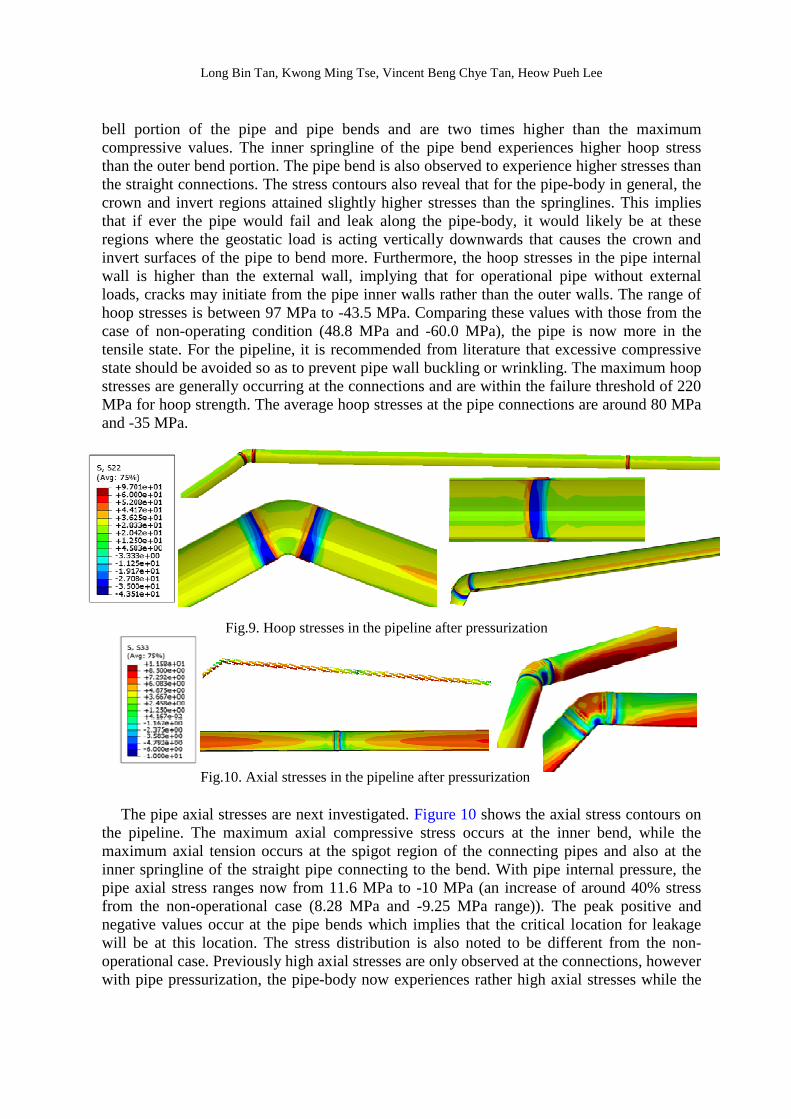
bell portion of the pipe and pipe bends and are two times higher than the maximum compressive values. The inner springline of the pipe bend experiences higher hoop stress than the outer bend portion. The pipe bend is also observed to experience higher stresses than the straight connections. The stress contours also reveal that for the pipe-body in general, the crown and invert regions attained slightly higher stresses than the springlines. This implies that if ever the pipe would fail and leak along the pipe-body, it would likely be at these regions where the geostatic load is acting vertically downwards that causes the crown and invert surfaces of the pipe to bend more. Furthermore, the hoop stresses in the pipe internal wall is higher than the external wall, implying that for operational pipe without external loads, cracks may initiate from the pipe inner walls rather than the outer walls. The range of hoop stresses is between 97 MPa to -43.5 MPa. Comparing these values with those from the case of non-operating condition (48.8 MPa and -60.0 MPa), the pipe is now more in the tensile state. For the pipeline, it is recommended from literature that excessive compressive state should be avoided so as to prevent pipe wall buckling or wrinkling. The maximum hoop stresses are generally occurring at the connections and are within the failure threshold of 220 MPa for hoop strength. The average hoop stresses at the pipe connections are around 80 MPa and -35 MPa.
The pipe axial stresses are next investigated. Figure 10 shows the axial stress contours on
the pipeline. The maximum axial compressive stress occurs at the inner bend, while the maximum axial tension occurs at the spigot region of the connecting pipes and also at the inner springline of the straight pipe connecting to the bend. With pipe internal pressure, the pipe axial stress ranges now from 11.6 MPa to -10 MPa (an increase of around 40% stress from the non-operational case (8.28 MPa and -9.25 MPa range)). The peak positive and negative values occur at the pipe bends which implies that the critical location for leakage will be at this location. The stress distribution is also noted to be different from the non-operational case. Previously high axial stresses are only observed at the connections, however with pipe pressurization, the pipe-body now experiences rather high axial stresses while the
Fig.10. Axial stresses in the pipeline after pressurization
Fig.9. Hoop stresses in the pipeline after pressurization
Long Bin Tan, Kwong Ming Tse, Vincent Beng Chye Tan, Heow Pueh Lee
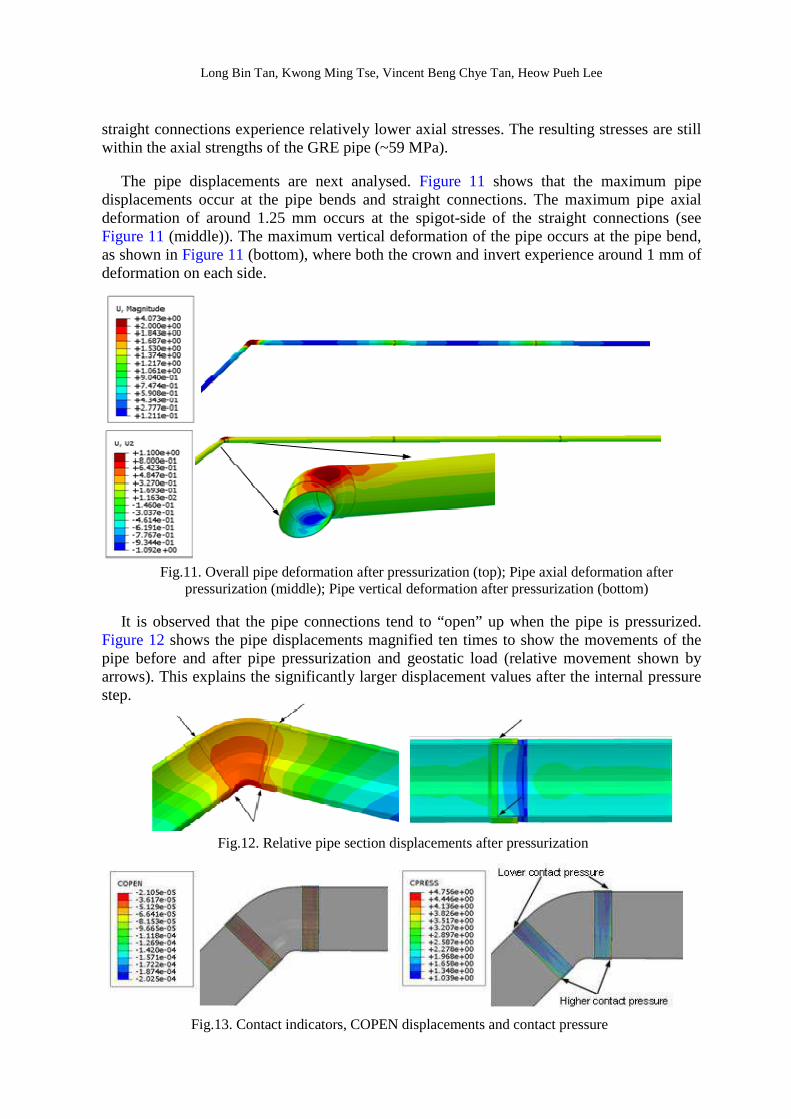
straight connections experience relatively lower axial stresses. The resulting stresses are still within the axial strengths of the GRE pipe (~59 MPa).
The pipe displacements are next analysed. Figure 11 shows that the maximum pipe
displacements occur at the pipe bends and straight connections. The maximum pipe axial deformation of around 1.25 mm occurs at the spigot-side of the straight connections (see Figure 11 (middle)). The maximum vertical deformation of the pipe occurs at the pipe bend, as shown in Figure 11 (bottom), where both the crown and invert experience around 1 mm of deformation on each side.
It is observed that the pipe connections tend to “open” up when the pipe is pressurized. Figure 12 shows the pipe displacements magnified ten times to show the movements of the pipe before and after pipe pressurization and geostatic load (relative movement shown by arrows). This explains the significantly larger displacement values after the internal pressure step.
Fig.13. Contact indicators, COPEN displacements and contact pressure
Fig.11. Overall pipe deformation after pressurization (top); Pipe axial deformation after pressurization (middle); Pipe vertical deformation after pressurization (bottom)
Fig.12. Relative pipe section displacements after pressurization

Long Bin Tan, Kwong Ming Tse, Vincent Beng Chye Tan, Heow Pueh Lee
The contact outputs are next analysed to determine the quality and integrity of the pipe connections. The contact pressures have increased to between 1.04 MPa and 4.75 MPa as compared to the non-operational case. Figure 13 shows the contact surfaces where the lowest contact pressure is located at the outer springline of the pipe interfaces while the highest pressure is located at the inner springline of the interfaces. The lowest attained contact pressure is around 1.04 MPa which is slightly low but the overall pipeline’s connectivity is still intact.
4.2.2 Pit-soil-pipe Model - At Operating Condition
Figure 14 shows the von Mises stress of the soil around the Pit-soil-pipe model, subjected to geostatic load and pipe expansion caused by the operating pressure. The soil stresses around the soil-pipe interfaces are higher as compared to the non-operational case, due to pipe expansion which causes the surrounding soil adjacent to the pipe to be pushed. The peak Mises stress is higher than that of non-operational condition, from 0.16 MPa to 1.25 MPa. Cross section views also reveal that the soil at the crown and invert of the pipe generally experiences higher stresses than the soil near to the springlines (see Figure 14). The plastic strain contours reveals that only a very small region of soil at the bell connections has yielded. However, soils away from the bells are still entirely at the elastic range. It is observed that the soils near the soil-pipe interface experience relatively higher stresses (around an order of magnitude higher) as the pipeline expands. The soil stresses and strains need to be monitored in the various load scenarios to assess for any possible soil yielding or detachment from the pipeline structures.
Fig.15. Soil Mises stress contours after geostatic load and pipe presurrization
A B A
B
Fig.15. Pipe hoop stress contours under operational condition showing maximum stress at the inner springline of the bell joint

Long Bin Tan, Kwong Ming Tse, Vincent Beng Chye Tan, Heow Pueh Lee
Next, the pipe hoop (S22) and axial (S33) stresses are extracted and shown in Figures 15
and 16, respectively. Similar to the non-operating condition, higher hoop stresses are found at the bell of the inner bend of the 90o elbow joint, with the maximum tensile stress around 52.48 MPa (19.81 MPa for non-operational case) and maximum compressive stress around -34.89 MPa (from -45.54 MPa). The maximum pipe axial stress of around 18 MPa is located at the outer bend of the elbow joint while the minimum of about -11 MPa (compressive) occurs at the inner elbow. This observation pertains only to the operating condition. Hence, under operating condition, the pipe is unlikely to fail by tension in hoop direction since stresses do not exceed the 220 MPa threshold limit. Similarly, the pipe material is unlikely to fail by axial tension since the threshold of 59 MPa has not been reached. For hoop and axial compression, the values are also far from the thresholds for pipe wall buckling and wrinkling.
Fig.16. Pipe axial stress contours under operational condition showing maximum stresses near the springlines of the bell joint
Fig.18. Axial stresses along the crown and inner springline for non-operating & operating conditions
Fig.17. Hoop stresses along the crown and inner springline for non-operating & operating conditions
Long Bin Tan, Kwong Ming Tse, Vincent Beng Chye Tan, Heow Pueh Lee
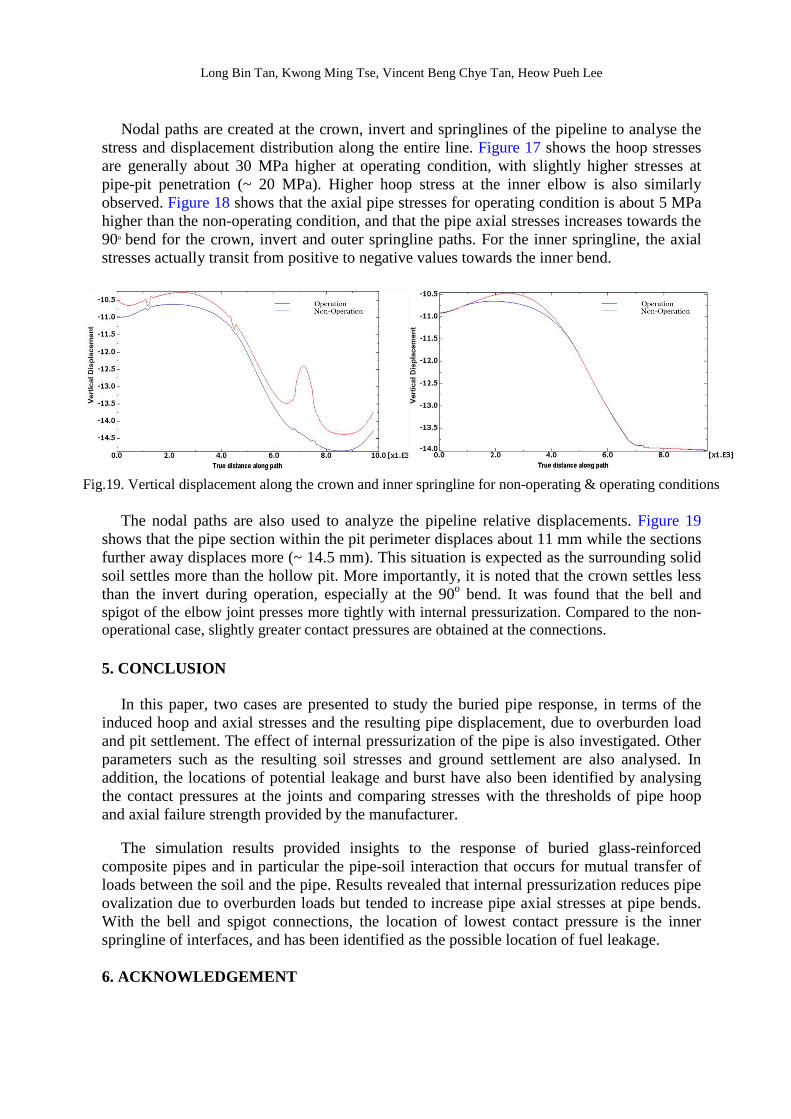
Nodal paths are created at the crown, invert and springlines of the pipeline to analyse the stress and displacement distribution along the entire line. Figure 17 shows the hoop stresses are generally about 30 MPa higher at operating condition, with slightly higher stresses at pipe-pit penetration (~ 20 MPa). Higher hoop stress at the inner elbow is also similarly observed. Figure 18 shows that the axial pipe stresses for operating condition is about 5 MPa higher than the non-operating condition, and that the pipe axial stresses increases towards the 90o bend for the crown, invert and outer springline paths. For the inner springline, the axial stresses actually transit from positive to negative values towards the inner bend.
The nodal paths are also used to analyze the pipeline relative displacements. Figure 19 shows that the pipe section within the pit perimeter displaces about 11 mm while the sections further away displaces more (~ 14.5 mm). This situation is expected as the surrounding solid soil settles more than the hollow pit. More importantly, it is noted that the crown settles less than the invert during operation, especially at the 90o bend. It was found that the bell and spigot of the elbow joint presses more tightly with internal pressurization. Compared to the non-operational case, slightly greater contact pressures are obtained at the connections.
5. CONCLUSION
In this paper, two cases are presented to study the buried pipe response, in terms of the induced hoop and axial stresses and the resulting pipe displacement, due to overburden load and pit settlement. The effect of internal pressurization of the pipe is also investigated. Other parameters such as the resulting soil stresses and ground settlement are also analysed. In addition, the locations of potential leakage and burst have also been identified by analysing the contact pressures at the joints and comparing stresses with the thresholds of pipe hoop and axial failure strength provided by the manufacturer.
The simulation results provided insights to the response of buried glass-reinforced
composite pipes and in particular the pipe-soil interaction that occurs for mutual transfer of loads between the soil and the pipe. Results revealed that internal pressurization reduces pipe ovalization due to overburden loads but tended to increase pipe axial stresses at pipe bends. With the bell and spigot connections, the location of lowest contact pressure is the inner springline of interfaces, and has been identified as the possible location of fuel leakage.
6. ACKNOWLEDGEMENT
Fig.19. Vertical displacement along the crown and inner springline for non-operating & operating conditions
Long Bin Tan, Kwong Ming Tse, Vincent Beng Chye Tan, Heow Pueh Lee
This work was supported by the Defence Science Technology Agency (DSTA) of Singapore. Special thanks to their engineers for providing some of the pipe samples for characterization.
REFERENCES 1. Design Plastic Systems, Inc (2011). Fiberglass pipe comparison. Available from:
http://www.designplasticsystems.com/fiberglass-pipe-comparison. [Accessed 20th Jan 2014] 2. A.J. Olarewaju, N.S.V.K. Rao, and M.A. Mannan (2010). Simulation and verification of blast
load duration for studying the response of underground horizontal and vertical pipes using finite element method. Electronic Journal of Geotechnical Engineering Vol.16, pp. 785-796
3. J.W. Boh, L.A. Louca, Y.S. Choo (2007). Finite element analysis of blast resistance structures in the oil and gas industry. Proceedings of ABAQUS User’s Conference, Singapore, pp. 1-15
4. A.J. Olarewaju, N.S.V.K. Rao, M.A. Mannan (2010). Design hints for buried pipes to resist effects of blast. Proceedings of The Indian Geotechnical Conference(GEOtrendz), Bombay, India, pp. 881-884
5. M. Almahakeri, I.D. Moore, A. Fam (2012). The flexural behavior of buried steel and composite pipes pulled relative to dense sand: Experimental and numerical investigation. Proceedings of The 9th International Conference on Pipelines (IPC), Alberta, Canada, pp. 97-105: ASME
6. A.J. Olarewaju, N.S.V.K. Rao, M.A. Mannan (2010). Response of underground pipes due to blast load. Proceedings of The 3rd International Earthquake Symposium, Dhaka, Bangladesh, pp. 165-172
7. A.J. Olarewaju, N.S.V.K. Rao, M.A. Mannan (2010). Blast effects on underground pipes. Electronic Journal of Geotechnical Engineering 15, pp. 645-658
8. A.J. Olarewaju, N.S.V.K. Rao, M.A. Mannan (2010). Response of underground pipes due to blast loads by simulation - an overview. Electronic Journal of Geotechnical Engineering 15H, pp. 1-22
9. H. Liu (2009). Dynamic analysis of subway structures under blast loading. Geotechnical and Geological Engineering Vol.27(6), pp. 699-711
10. K. Raju, L.B. Tan, K.M. Tse, H.P. Lee and V.B.C. Tan (2015), Experimental characterization of glass fibre reinforced epoxy composite for failure envelope validation, 10th International Conference on Composite Science and Technology, ICCST/10, Lisboa, Portugal, Sept 2015
11. K.M. Tse, L.B. Tan, H.P. Lee, V.B.C. Tan, J.K.W. Ong, C.B. Ng, K.O.Y. Chong, An Efficient Analytical Failure Approach In The Global Analysis Of A Buried Pipeline System, 5th International Conference on Design and Analysis of Protective Structures (DAPS 2015), Singapore, May 2015
12. ASME B31.3, Process Piping Guide, Rev 2, LANL Engineering Standards Manual PD342, 2009 13. 2011, "Norbar Catalogue 07426: Total Torque Control,"
http://www.gedore.nl/Prijsbestand/Norbar/Norbar%20Catalogue%2007426%20Jul11.pdf