Spatial and temporal patterns in the diet of New Zealand ...
36
Spatial and temporal patterns in the diet of New Zealand king shag New Zealand King Shag, (Leucocarbo carunculatus) on Blumine Island, Marlborough Sounds, New Zealand in 2016 (Wikipedia commons). Aimee van der Reis & Andrew Jeffs Report Prepared For: Department of Conservation, Conservation Services Programme, Project BCBC2020-05b. DOC Marine Science Advisors Graeme Taylor and Dr Karen Middlemiss. June 2021 Reports from Auckland UniServices Limited should only be used for the purposes for which they were commissioned. If it is proposed to use a report prepared by Auckland UniServices Limited for a different purpose or in a different context from that intended at the time of commissioning the work, then UniServices should be consulted to verify whether the report is being correctly interpreted. In particular it is requested that, where quoted, conclusions given in Auckland UniServices reports should be stated in full.
Transcript of Spatial and temporal patterns in the diet of New Zealand ...

Spatial and temporal patterns in the diet of New Zealand king shag
New Zealand King Shag, (Leucocarbo carunculatus) on Blumine Island, Marlborough Sounds, New Zealand in 2016 (Wikipedia commons).
Aimee van der Reis & Andrew Jeffs
Report Prepared For: Department of Conservation, Conservation Services Programme, Project BCBC2020-05b. DOC Marine Science Advisors Graeme Taylor and Dr Karen Middlemiss.
June 2021
Reports from Auckland UniServices Limited should only be used for the purposes for which they were commissioned. If it is proposed to use a report prepared by Auckland UniServices Limited for a different purpose or in a different context from that intended at the time of commissioning the work, then UniServices should be consulted to verify whether the report is being correctly interpreted. In particular it is requested that, where quoted, conclusions given in Auckland UniServices reports should be stated in full.

EXECUTIVE SUMMARY
The New Zealand king shag (Leucocarbo carunculatus) is an endemic seabird that only inhabits coastal areas around the outer parts of the Marlborough Sounds and is classed as nationally endangered. The diet of this rare seabird is of interest because it has been suggested that human activities, such as marine farming operations and forestry activities, may displace or compromise foraging habitat that could affect the population of New Zealand king shag.
A previous study undertaken in 2020 developed advanced DNA methods for identifying dietary items in the faeces and regurgitated pellets from king shag. A comparison of these methods with traditional microscopic identification of hard parts from the diet indicated a relatively high degree of commonality between the two methods.
This current study applied the DNA methods to a further sample of 342 regurgitated pellets, extending the sampling to seven colonies of king shag, as well as the seasonal coverage of the sampling. As for the previous study, fish were the dominant item found in 333 of the 336 pellets that could be analysed, identifying a total of 53 fish species. Witch, crested flounder and opalfish were the three most commonly found species being found in 67, 49 and 46% of pellets, respectively. All three species are not harvested recreationally or commercially, however, other species that were important contributors to the diet, such as southern lemon sole, are harvested by human fishing.
A number of variables were found to influence the composition of the regurgitated pellets including, colony, sex of the bird, and season. These differences in diet may be useful indicators for variation in the patterns of feeding or food availability that may warrant further investigation.
Overall, the results suggest king shags are opportunistic generalist predators that include a wide diversity of fish species in their diet, but preferentially target benthic fish species.

INTRODUCTION The New Zealand king shag (Leucocarbo carunculatus) is an endemic seabird that is classed as nationally endangered (Miskelly et al., 2008). The population is confined to a small number of colonies located around the coastal margins of the outer Marlborough Sounds (South Island, New Zealand), with surveys suggesting the population is currently stable (~800 individuals surveyed in 2020; Aquaculture New Zealand, 2020; Schuckard et al., 2015). Monitoring the colonies has become a priority and research is being conducted to better understand their population dynamics and basic ecology to improve the management of the population, particularly in relation to human activities such as fishing, aquaculture and land use (Fisher & Boren, 2012). The diet of the New Zealand king shag is strongly linked to the waters surrounding their colonies and it has been suggested that anthropogenic activities, such as marine farm structures and forestry activities, may displace or compromise foraging habitat that could affect the population of New Zealand king shag (Fisher & Boren, 2012). However, GPS tracking of king shag movements has shown that these birds roost and forage around mussel farms (Aquaculture New Zealand, 2020). Thus, the diet of New Zealand king shags is of interest to monitor as their foraging behaviour and/or prey may shift in the future. Traditionally, microscopy has been used to analyse tissue matter from the gut to determine the diet of animals. However, this method of determining diet is highly labour intensive, suffers from difficulties in reliably identifying degraded remnants of food items and is highly reliant on taxonomic expertise. However, microscopic analyses of gut content does provide counts of individual food items where persistent diagnostic elements remain in the gut contents, such as squid beaks and fish otoliths (ear bones). DNA metabarcoding is a molecular method that has the ability to address some of the limitations encountered when using traditional methods for diet determination. This method uses DNA barcoding in conjunction with next-generation sequencing method to reliably identify a variety of species from a single sample that typically would contain a mixture of different species. The DNA is extracted from the sample and the species barcode region is amplified by universal primers that are gene specific and have the ability to amplify short sequences from a broad taxonomic range (Deagle et al., 2014; Kress et al., 2015). The genes that are targeted by such primers are usually housekeeping genes (e.g., mitochondrial cytochrome c oxidase one - COI) that have been conserved in most species over time, but contain enough DNA sequence variation to allow discrimination between closely related species, thus providing each species with a unique barcode. This unique barcode makes it possible to identify organisms to species level when sequences are matched to a DNA repository, after having undergone quality control and filtering using bioinformatics software such as Qiime 2 (Bolyen et al., 2019). This molecular method is an ideal tool to identify prey species regardless of the state of the gut content, thus enabling the identification of species in regurgitated pellets and faecal matter (i.e., is non-invasive). This removes the need for food items to be largely intact or include recognisable hard parts that survive digestive processes, which is needed for traditional methods. Furthermore, this method does not require taxonomic expertise to obtain species level identification of food

items and is relatively rapid, cost-effective and accurate. DNA metabarcoding can currently only reliably provide presence/absence data for those species that are identified. Fish are known to be the main dietary target of New Zealand king shags (Lalas & Brown 1998; Schuckard & Lalas, 2021; van der Reis & Jeffs, 2021). A previous New Zealand king shag DNA metabarcoding study found that these birds primarily rely on Bothidae (Family of lefteye flounders), witch (Arnoglossus scapha) and crested flounder (Lophonectes gallus1), as their main dietary items (van der Reis & Jeffs, 2021). Crested flounder, among other dietary taxa, had not been previously mentioned as a prey item from microscopic studies and proved the usefulness on incorporating DNA metabarcoding in dietary analyses. A range of other fish species were also identified in the pellets and a number of mobile non-fish species were determined to most likely be minor prey items or secondary dietary items (i.e., the gut contents of consumed fish), such as crabs. The majority of dietary taxa matched previous records from regurgitated pellets and published reports based on incidental observations (e.g., Munida gregaria - lobster krill and Scorpaena papillosa - red scorpionfish) (Lalas & Brown, 1998). In addition, DNA metabarcoding is not diet specific and thus a plethora of other species were detected, such as feather mites and parasitic worms. This previous king shag DNA metabarcoding study also determined that frequency of occurrence of fish species detected was comparable to the microscopic study, using otoliths and exoskeletal remains, that was run in parallel on the same samples (Schuckard & Lalas, 2021; van der Reis & Jeffs, 2021). Furthermore, this comparison gave further proof that host DNA does not impede the diversity of species detected and thus is a very effective method to determine diet with relative ease (Devloo-Delva et al., 2018; Piñol et al., 2014). This current DNA metabarcoding study is an expansion of the DNA metabarcoding study conducted in 2020 (van der Reis & Jeffs, 2021) and incorporates additional king shag pellets which almost doubles the overall sample size. This study focuses on the fish species detected in the diet and investigates the difference in these prey items among colonies, season of collection, and between the sex of the individual birds as also determined by genetic methods.
1 The crested flounder sequence matched the Australian species, L. gallus, but it is likely that the sequence will also match the New Zealand crested flounder, L. mongonuiensis, when added to the DNA reference databases (McMillan et al., 2019).

MATERIALS AND METHODS
King shag collection and DNA amplification Regurgitated pellets (n=342) from New Zealand king shag were collected between March 2019 and January 2021 from seven colonies by Wildlife Management International Limited in the Marlborough Sounds (South Island, New Zealand). A total of 28, 83, 77, 67, 28, 36 and 23 pellets were collected from Blumine, Duffers Reef, North Trio, Tawhitinui, The Haystack, The Twins and White Rocks, respectively (Figure 1; Table 1). The samples were placed in 90% ethanol or a DMSO–EDTA–salt (DESS) solution (Seutin et al., 1991) immediately upon collection. Ethanol was used as the most well-known preservative to use for the DNA for identifying taxa in gut contents, whereas the DESS solution was used to assess its suitability as a possible alternative preservative solution to ethanol for better preserving fish otoliths and for overcoming safety concerns with transporting concentrated ethanol solutions.
Figure 1. Regurgitated pellets were collected from seven New Zealand king shag colonies in the Marlborough Sounds. The location of the Marlborough Sounds, is identified by the red polygon on the inset map, and are located at the top of the South Island, New Zealand.

Table 1. The number of regurgitated pellets collected from seven New Zealand king shag colonies in the Marlborough Sounds and in brackets the number that passed quality filtering for DNA metabarcoding.
2019 2020 2021 Colony Mar Nov Mar June July Aug Sept Dec Jan Blumine - - 28 - - - - - - Duffers Reef 3 40 - - 5 (4) - - 14 (13) 21 North Trio 6 41 - - - 6 9 - 15 (14) Tawhitinui 14 28 - 6 - - - - 19 (17) The Twins - - 24 - 12 - - - - The Haystack 10 (9) - - - - - - - 18 White Rocks 8 - 15 - - - - - -
The pellets were dissected at the University of Auckland and the tissue material was separated from the hard items (e.g., bones and shells) allowing for a homogenized subset of gut digesta tissue to be used for DNA extractions. E.Z.N.A.® Mollusc DNA Kit (Omega Bio-Tek Inc, Georgia, USA) and Nucleospin Tissue DNA kit (Macherey-Nagel, Düren, Germany) were used for the extractions, following the manufacturer’s instructions2. Initially the E.Z.N.A. kit was used as a preventative measure to mitigate possible PCR inhibition caused by mucopolysaccharides associated with marine invertebrates (Palmer, 2008; van der Reis & Jeffs 2020), but PCR inhibition was no more prevalent when the Nucleospin kit was used indicating that any extraction kit bias was likely to be negligible. Polymerase chain reactions (PCR) were done using MyTaq Red Mix (Bioline, London, UK) master mix; 7 μl MyTaq Red Mix, 0.5 μl of each primer, 5 μl UltraPure™ DNase/RNase-Free Distilled Water (Invitrogen - Thermo Fisher Scientific, Massachusetts, USA), 1 μl DNA and 2 μl BSA (1%) when necessary for optimal DNA amplification per reaction. Negative controls were included in every set of DNA extractions (extraction blank - no tissue added) and every PCR run (PCR blank - no DNA added) to check for possible contamination. The sex of the king shag that had regurgitated the pellet was identified using a non-ratite universal primer pair (2550 and 2718; Fridolfsson & Ellegren, 1999) which produces a single band for males (600 bp) and a double band for females (450 bp and 600 bp). PCR protocol: 94 ºC - 4 min, 8×[touchdown: 94 ºC - 30 s, 57 ºC - 45 s, 72 ºC – 45 s], 30×[standard: 94 ºC - 30 s, 51 ºC – 45 s, 72 ºC - 45 s], 74 ºC - 5 min. The PCR products were run on a 3% agarose gel, and visualised using Gel Red (Biotium, Fremont, California, USA), in a Gel DocTM XR+ (Bio-Rad Laboratories Inc., California, USA). For DNA metabarcoding of recovered dietary DNA, a mitochondrial DNA universal primer pair was used, Illumina Nextera™ library adapters (NexAd) were added (Illumina, San Diego, CA, USA), which targeted a portion of the COI region (313 bp; mlCOIintF - Leray et al., 2013 and jgHCO2198
2 Two different extraction kits were used due to lengthy shipping delays for reagents caused by the COVID-19 pandemic.
- Geller et al., 2013). PCR protocol: 94 ºC – 4 min, 30×[standard: 94 ºC - 30s, 45 ºC - 30s, 72 ºC - 1 min], 72 ºC - 5 min. The PCR products were run on a 1.6% agarose gel and visualised as above.
DNA metabarcoding
DNA clean-up and pooling PCRs were performed in triplicate for all samples and for DNA extraction negative controls. The PCR triplicates were pooled together before DNA clean-up proceeded. Agencourt AMPure XP (Beckman Coulter, Brea, CA, USA) was used following the Illumina (Illumina, San Diego, CA, USA) protocol for PCR clean-up (Illumina, 2013). The concentration of the purified PCR products was determined using Qubit™ dsDNA HS Assay Kit (Invitrogen™, Thermo Fisher Scientific Inc., Waltham, MA, USA) following the manufacturer’s instructions. The PCR products were brought to equal molarity, 2 ng μl-1 where possible. Sequencing was done through Auckland Genomics (Auckland, New Zealand) where indexing, using the Nextera™ DNA library Prep Kit and the second round of PCR clean-up occurred before sequencing on an Illumina MiSeq™ System (2×300 pair-end; single lane was used). The sequencing was done in two rounds, one for the initial analysis in 2020 (n=185) and one for the additional samples added in 2021 (n=157).
Metabarcoding protocol The bioinformatics was rerun for the 2020 samples in conjunction with the 2021 samples. Raw demultiplexed sequencing data was received from Auckland Genomics and Cutadapt v3.3 (Martin, 2011) was used to trim the forward and reverse primers from the sequences. Primers were removed if an exact sequence match could be found, and no indels or errors were allowed in the primer sequence and all untrimmed sequences were discarded. Qiime 2 (version 2021.2; Bolyen et al., 2019) was used to visualize the initial sequence quality. DADA2 (within Qiime 2; Callahan et al., 2016) was used for sequence filtering based on quality scores, denoising, merging and chimera formation to ensure only high quality paired-end sequences were retained (Table 2). The Naïve Bayes Classifier was used for assigning taxonomy at minimum confidence threshold of 90% confidence from the curated database, Midori (COI database - GenBankRelease239 as of August 2020; Machida et al., 2017). The Genbank database (BLASTDB/2021-05; Benson et al., 2013) was also used for assignment, using the megablast option BLASTn (Morgulis et al., 2008) with an e-value threshold of 0.001 and a percentage identity of 90%. The resulting sequences were further filtered and analysed with R Studio® (version 4.1.0; R Core Team, 2021). Sequences were retained if they were ≥250 bp and ≤350 bp. The results from the databases were consolidated to create one amplicon sequence variant (ASV; Callahan et al., 2017) taxonomic assignment list. ASVs assigned to class “Aves” (classified as host DNA) were filtered out from the dataset and ASVs identified to be contamination, from assessing the DNA negative controls, were removed (Table 2).

Gut content analyses Six samples (DR66, DR80, HS1, NT61, TAW46 and TAW51) did not pass quality control measures, resulting in a total of 336 king shag pellets for gut content analyses. As fish were the main dietary components of interest in this study, the dataset was filtered to retain only sequences assigned to fish (n=333) and further transformed into a more reliable and conserved binary dataset (i.e., presence-absence). All results (i.e., figures) were produced using ggplot2 version 3.3.3 (R package; Wickham, 2017). Alpha diversity was measured, using the Shannon diversity index, (Vegan version 2.5-6; Oksanen et al., 2019) within samples at species level. An analysis of variance (ANOVA) was used to test if the diversity means for fish in gut contents among colonies were significantly different and Tukey’s HSD was used for post-hoc pairwise comparisons among colonies to determine where the differences lay. A permutational multivariate analysis of variance (PERMANOVA; Jaccard dissimilarity index) and non-metric multidimensional scaling (NMDS) were performed using Vegan to test if differences occurred among colonies, seasons and between sexes, and to visualize the possible differences, respectively. The dataset was filtered to include species that were present in ≥ 5% of pellets. If significant differences were detected, a generalized linear model (GLM; family = binomial) was run and the resulting data was then explored (post-hoc) to identify the differences, using estimated marginal means (emmeans) comparisons (version 1.4.3; Lenth, 2019), which are the GLM equivalent of least squares means that are generated when using an ANOVA. Generalised linear models are a very robust statistical technique that has the capacity to generate reliable comparisons of unbalanced data sets, such as in the current study where there were uneven sample sizes for all of the factors of interest, i.e., colony, season and sex. Lastly, a PERMANOVA was run to assess if preserving the pellets in the two different preservation solutions (i.e., DESS versus ethanol) had a significant effect on recovery of DNA signal. No significant difference was found and thus the data was not further explored.

RESULTS
Sex assignment and taxonomic assignment The host DNA was sufficient in the majority of extracted pellet content DNA samples to determine the sex of the king shag that had regurgitated the pellet. Only 14 pellets could not be sexed. Of the remaining pellets, a total 130 pellets were regurgitated by females and 192 from males. Fish were found to be the main prey of king shags. A total of 1,648,990 reads (88%; Table 2) were assigned to Actinopterygii (fish) in 333 of the 336 pellets. Pellets HS24, TAW29 and WR2 did not contain fish. There were 53 fish species identified from the pellets (Table 3) and the species broadly varied among pellets (Figure 2). Only nine species were found to occur in more than 10% of pellets, with the most frequent being witch (67%) and the second most frequent being the crested flounder (49%) (Table 3). A further 24 fish species were found to be present in 1 to 10% of all analysed pellets. The overall diversity means of fish species found in king shag pellet samples were significantly different (p-value <0.05). The colony pairwise comparisons of the mean diversity (Figure 3) identified North Trio versus Blumine, and Duffers Reef versus Blumine as being significantly different (p-value <0.05). The PERMANOVA revealed significant differences (p-value < 0.05) among colonies, seasons and between sexes, however, visualisation revealed only weak clustering (i.e., overlap is seen) (Appendix 1). Interactions were also assessed and found to be significant between sex for colonies, and among seasons for colonies. Further data exploration revealed specific within group comparisons that were significant (Table 4 and 5; Figure 4). For colony the most notable comparison was for crested flounder that had a greater frequency of occurrence in North Trio when compared to all other colonies (Figure 4). Witch had a lower frequency of occurrence for The Haystacks when compared to Blumine and White Rocks. North Trio also had a lower frequency of speckled sole (Peltorhamphus latus) when compared to Duffers Reef, Tawhitinui and White Rocks, and for opalfish (Hemerocoetes morelandi) when compared to Duffers Reef. Scaly gurnard (Lepidotrigla brachyoptera) had a higher frequency of occurrence in North Trio than in Tawhitinui. Blumine had a lower frequency of occurrence for smooth leatherjacket (Meuschenia scaber) when compared to Duffers Reef and The Haystacks, and for southern lemon sole (Pelotretis flavilatus) when compared to Duffers Reef and The Twins. Duffers Reef had a greater frequency of occurrence for smooth leatherjacket compared to Tawhitinui and lower frequency for blue cod (Parapercis colias) when compared to North Trio and The Haystacks. Of the significant differences found for season, the majority of species identified occurred more frequently in spring (67%; including witch, opalfish, crested flounder, smooth leatherjacket and greenback flounder - Rhombosolea tapirina). Speckled sole and red scorpionfish were more frequently found in the pellets collected in winter. Southern lemon sole was the only species identified that was more likely to be identified in pellets collected during spring and winter compared to autumn. Witch and opalfish were identified more commonly in the pellets from females, while bigeye sea perch (Helicolenus barathri) and smooth leatherjacket where identified more readily in male pellets.

Only three colonies were identified to have significant differences between sex for certain diet species namely, North Trio (witch – female), Tawhitinui (opalfish and speckled sole – female; bigeye sea perch – male) and Duffers Reef (opalfish – female) (Table 5). There was insufficient data coverage to compare diet among the four seasons within all seven sampled colonies. Table 2. Stepwise filtering of reads using Qiime 2 and R.
Filtering Steps Reads after filtering
Initial (no filtering) 25,205,579
Cutadapt 23,056,940
Truncating 16,551,218
Denoised 16,503,903
Merged 15,875,753
Non-chimeric 15,824,018
Post Qiime2 filtering (length, host DNA, DNA negative assessment) 1,865,844

Table 3. Species of fish detected in the king shag regurgitated pellets. Species in bold are likely not the exact match. Where possible the more likely New Zealand species (within the same genus) has been given. If no alternative species was found, but other genera within the same family are found in New Zealand, the species has been demarcated with an asterisk (*). Identified from the list includes finfish species that contribute 10 t or more to commercial catch within the area of king shag breeding colonies (†) (Taylor, 2020). Family Genus Species Common name Frequency (%; n = 336)
Bothidae Arnoglossus Arnoglossus scapha Witch 224 (66.67)
Bothidae Lophonectes Lophonectes gallus Crested flounder (L. mongonuiensis) 164 (48.81) Percophidae Hemerocoetes Hemerocoetes morelandi Duckbill fish or Opalfish 155 (46.13)
Rhombosoleidae Pelotretis Pelotretis flavilatus Southern lemon sole† 141 (41.96)
Monacanthidae Meuschenia Meuschenia scaber Smooth leatherjacket 102 (30.36) Pleuronectidae Peltorhamphus Peltorhamphus latus Speckled sole 91 (27.08)
Sebastidae Helicolenus Helicolenus barathri Bigeye sea perch 70 (20.83)
Triglidae Lepidotrigla Lepidotrigla brachyoptera Scaly gurnard 70 (20.83) Labridae Notolabrus Notolabrus fucicola Saddled wrasse 48 (14.29)
Pinguipedidae Parapercis Parapercis colias Blue cod† 32 (9.52)
Pleuronectidae Rhombosolea Rhombosolea tapirina Greenback flounder† 31 (9.23) Tripterygiidae Matanui Matanui profundum Deepwater triplefin 29 (8.63)
Scorpaenidae Scorpaena Scorpaena papillosa Red scorpianfish 18 (5.36)
Percophidae Hemerocoetes Hemerocoetes artus Duckbill fish 17 (5.06) Pleuronectidae Peltorhamphus Peltorhamphus novaezeelandiae New Zealand sole† 16 (4.76)
Moridae Pseudophycis Pseudophycis breviuscula Northern bastard codling 12 (3.57)
Syngnathidae Hippocampus Hippocampus abdominalis Big-belly seahorse 10 (2.98) Sebastidae Helicolenus Helicolenus percoides Red gurnard perch 9 (2.68)
Moridae Pseudophycis Pseudophycis barbata Southern bastard codling 8 (2.38)
Percidae Etheostoma Etheostoma radiosum Freshwater* 7 (2.08) Tripterygiidae Forsterygion Forsterygion flavonigrum Yellow-and-black triplefin 6 (1.79)
Zeidae Zeus Zeus faber John Dory† 5 (1.49)
Labridae Pseudolabrus Pseudolabrus miles Scarlet wrasse 4 (1.19) Ophidiidae Genypterus Genypterus capensis Ling (G. blacodes)† 4 (1.19)
Serranidae Caesioperca Caesioperca lepidoptera Butterfly perch 4 (1.19)
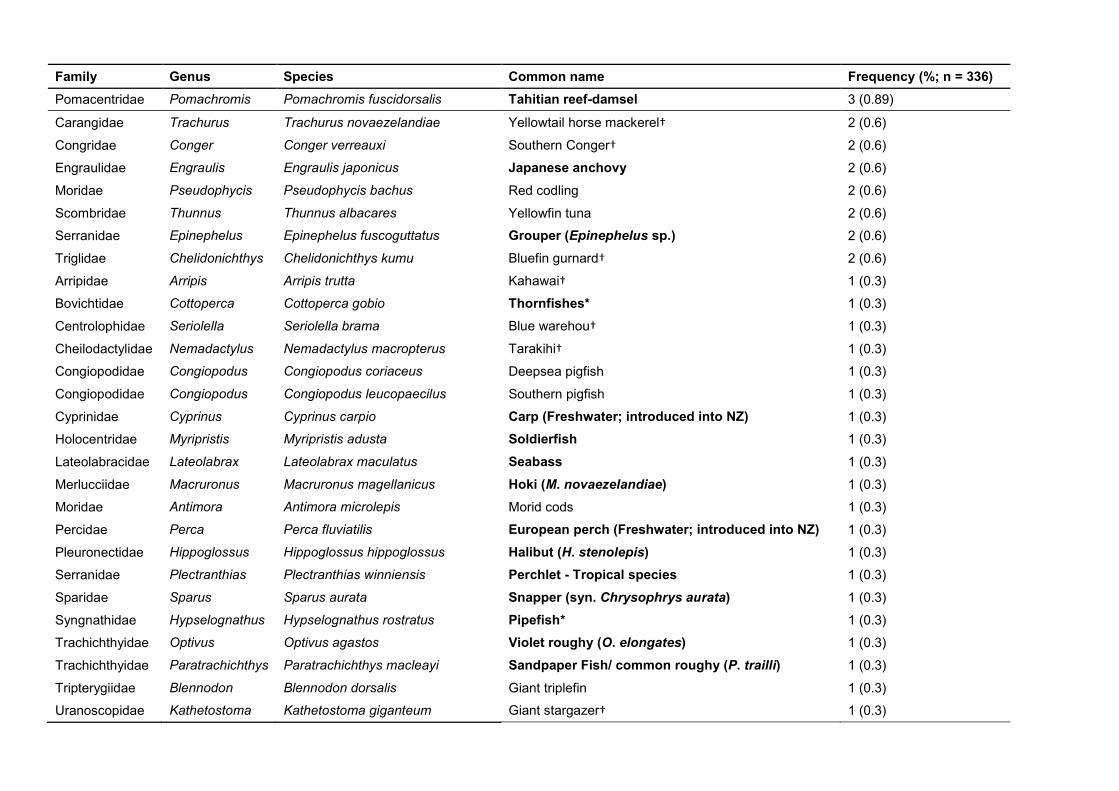
Family Genus Species Common name Frequency (%; n = 336) Pomacentridae Pomachromis Pomachromis fuscidorsalis Tahitian reef-damsel 3 (0.89)
Carangidae Trachurus Trachurus novaezelandiae Yellowtail horse mackerel† 2 (0.6)
Congridae Conger Conger verreauxi Southern Conger† 2 (0.6) Engraulidae Engraulis Engraulis japonicus Japanese anchovy 2 (0.6)
Moridae Pseudophycis Pseudophycis bachus Red codling 2 (0.6)
Scombridae Thunnus Thunnus albacares Yellowfin tuna 2 (0.6) Serranidae Epinephelus Epinephelus fuscoguttatus Grouper (Epinephelus sp.) 2 (0.6)
Triglidae Chelidonichthys Chelidonichthys kumu Bluefin gurnard† 2 (0.6)
Arripidae Arripis Arripis trutta Kahawai† 1 (0.3) Bovichtidae Cottoperca Cottoperca gobio Thornfishes* 1 (0.3)
Centrolophidae Seriolella Seriolella brama Blue warehou† 1 (0.3)
Cheilodactylidae Nemadactylus Nemadactylus macropterus Tarakihi† 1 (0.3) Congiopodidae Congiopodus Congiopodus coriaceus Deepsea pigfish 1 (0.3)
Congiopodidae Congiopodus Congiopodus leucopaecilus Southern pigfish 1 (0.3)
Cyprinidae Cyprinus Cyprinus carpio Carp (Freshwater; introduced into NZ) 1 (0.3) Holocentridae Myripristis Myripristis adusta Soldierfish 1 (0.3)
Lateolabracidae Lateolabrax Lateolabrax maculatus Seabass 1 (0.3)
Merlucciidae Macruronus Macruronus magellanicus Hoki (M. novaezelandiae) 1 (0.3) Moridae Antimora Antimora microlepis Morid cods 1 (0.3)
Percidae Perca Perca fluviatilis European perch (Freshwater; introduced into NZ) 1 (0.3)
Pleuronectidae Hippoglossus Hippoglossus hippoglossus Halibut (H. stenolepis) 1 (0.3) Serranidae Plectranthias Plectranthias winniensis Perchlet - Tropical species 1 (0.3)
Sparidae Sparus Sparus aurata Snapper (syn. Chrysophrys aurata) 1 (0.3)
Syngnathidae Hypselognathus Hypselognathus rostratus Pipefish* 1 (0.3) Trachichthyidae Optivus Optivus agastos Violet roughy (O. elongates) 1 (0.3)
Trachichthyidae Paratrachichthys Paratrachichthys macleayi Sandpaper Fish/ common roughy (P. trailli) 1 (0.3)
Tripterygiidae Blennodon Blennodon dorsalis Giant triplefin 1 (0.3) Uranoscopidae Kathetostoma Kathetostoma giganteum Giant stargazer† 1 (0.3)

Figure 2. Taxonomic composition at genus level for each New Zealand king shag regurgitated pellet, grouped by colony of collection. ‘Other’ represents phyla that made up less than 10% of the gut content of a pellet. Percentage occurrence is the proportion of total reads per pellet.
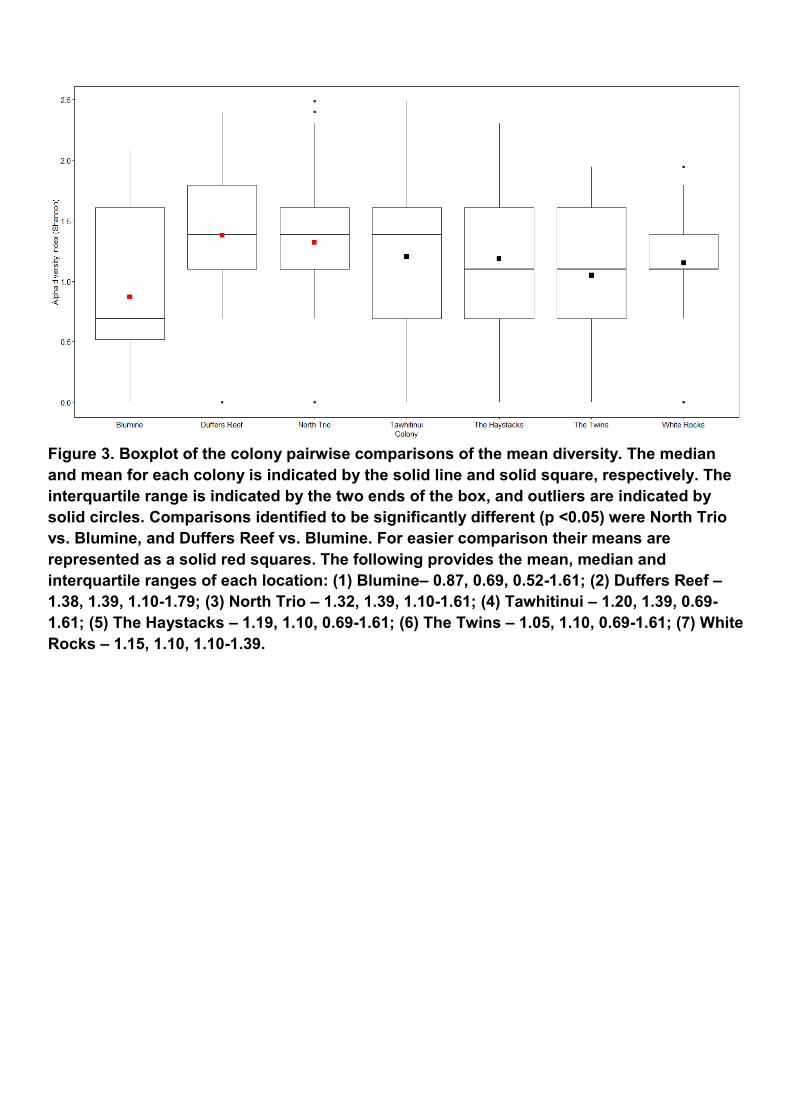
Figure 3. Boxplot of the colony pairwise comparisons of the mean diversity. The median and mean for each colony is indicated by the solid line and solid square, respectively. The interquartile range is indicated by the two ends of the box, and outliers are indicated by solid circles. Comparisons identified to be significantly different (p <0.05) were North Trio vs. Blumine, and Duffers Reef vs. Blumine. For easier comparison their means are represented as a solid red squares. The following provides the mean, median and interquartile ranges of each location: (1) Blumine– 0.87, 0.69, 0.52-1.61; (2) Duffers Reef – 1.38, 1.39, 1.10-1.79; (3) North Trio – 1.32, 1.39, 1.10-1.61; (4) Tawhitinui – 1.20, 1.39, 0.69-1.61; (5) The Haystacks – 1.19, 1.10, 0.69-1.61; (6) The Twins – 1.05, 1.10, 0.69-1.61; (7) White Rocks – 1.15, 1.10, 1.10-1.39.

Table 4. Fish species identified from king shag pellets to be significantly different (p-value <0.05) among colonies, seasons and between sex. The item within each pairwise comparison that has the greater frequency of occurrence (%) is indicated with an asterisk.
Within group comparison Species Contrast
Colony|Species Arnoglossus scapha Blumine* / The Haystacks
The Haystacks / White Rocks*
Hemerocoetes morelandi Duffers Reef* / North Trio
Lepidotrigla brachyoptera North Trio* / Tawhitinui
Lophonectes gallus Blumine / North Trio*
Duffers Reef / North Trio*
North Trio* / Tawhitinui
North Trio* / The Haystacks
North Trio* / The Twins
North Trio* / White Rocks
Meuschenia scaber Blumine / Duffers Reef*
Blumine / The Haystacks*
Duffers Reef* / Tawhitinui
Parapercis colias Duffers Reef / North Trio*
Duffers Reef / The Haystacks*
Pelotretis flavilatus Blumine / Duffers Reef*
Blumine / The Twins*
Peltorhamphus latus Duffers Reef* / North Trio
North Trio / Tawhitinui*
North Trio / White Rocks*
Season|Species Arnoglossus scapha Spring* / Summer
Hemerocoetes morelandi Autumn / Spring*
Lophonectes gallus Autumn / Spring*
Spring* / Summer
Spring* / Winter
Meuschenia scaber Autumn / Spring*
Pelotretis flavilatus Autumn / Spring*
Autumn / Winter*
Peltorhamphus latus Autumn / Winter*
Summer / Winter*
Rhombosolea tapirina Autumn / Spring*
Scorpaena papillosa Spring / Winter*
Sex|Species Arnoglossus scapha F* / M
Helicolenus barathri F / M*
Hemerocoetes morelandi F* / M

Meuschenia scaber F / M*

Table 5. Fish species identified from king shag pellets to be significantly different (p-value <0.05) within colonies and between sex. The item within each pairwise comparison that has the greater frequency of occurrence (%) is indicated with an asterisk.
Within group comparison Species Colony Contrast Sex|Colony|Species Arnoglossus scapha North Trio F* / M
Helicolenus barathri Tawhitinui F / M*
Hemerocoetes morelandi Duffers Reef F* / M
Tawhitinui F* / M
Peltorhamphus latus Tawhitinui F* / M

Figure 4. The proportion (presence-absence) of dietary items detected in each king shag colony. If a species occurred in less than 5% of pellets it was classed as ‘other’.

Discussion The results of this study demonstrate that DESS can be used as an effective alternative to ethanol for the preservation of regurgitate from seabirds, without suffering degradation of DNA. DESS is a safer preservative for transporting and handling because it is not highly flammable, unlike ethanol. This study follows on from the king shag diet DNA metabarcoding study done in 2020 (van der Reis & Jeffs, 2020) and utilizes both the 2020 sequencing data and the new (2021) sequencing data. This study is the largest to date investigating the diet of the New Zealand king shag, having determined prominent prey items from 336 regurgitated pellets. Overall, the results suggest king shags are opportunistic generalists including a wide diversity of fish species in their diet, but preferentially targeting benthic fish species. The majority of dietary taxa matched previous records from regurgitated pellets and published reports based on incidental observations (Lalas & Brown, 1998). Although 53 fish species were detected, the New Zealand king shag primarily rely on two species of Bothidae, witch and crested flounder, as their two main dietary items. Witch was identified in 67% of pellets and crested flounder was identified in 49% of pellets. Only two other species were detected as present in more than 40% of the analysed pellets; opalfish (46%) and southern lemon sole (42%). Neither witch, crested flounder or opalfish are targeted by commercial or recreational fishers (Manikiam, 1969; Taylor, 2020). In contrast, the southern lemon sole (flatfish) is of commercial and recreational interest and occurred less frequently in the pellets (i.e., 42% of pellets) (Taylor, 2020; Table 3). A wide range of fish species were identified, but most species occurred less frequently in the pellets (<10%), but collectively this made them important contributors to the overall diet of king shags, i.e., in total making up almost a fifth of all fish detected fish for all pellets. It is possible that the detection of the presence of some fish species in pellets represent secondary dietary items, i.e., the gut contents of the prey species consumed by king shag. For example, piscivorous species consumed by king shags, such as John dory, may contain other fish species within their gut at the time of being consumed by king shag. It is not possible to distinguish between primary and secondary prey items using genetic methods. A number of mobile non-fish species were detected in pellets and may also be minor prey items or secondary prey items. These possible dietary items included Decapoda (crabs, lobsters, shrimps) identified in 125 pellets (60,245 reads; the majority were crab species) and Cephalopoda (squid and octopus) present in 17 pellets (3,902 reads; all the octopus Robsonella huttoni). Many non-dietary items were also detected in the pellets which included parasitic worms. In total 12 fish species were detected in the king shag pellets which are known to have 10 t or more per year of commercial catch in the region (Table 3) (Taylor, 2020). Of these the most commonly found in the king shag pellets were southern lemon sole, which was found in 42% of pellets. This suggests that most of the current main dietary items of king shag are fish species that are not targeted by commercial fishers. However, this should not be used to conclude that fishing activity is unlikely to affect king shag diet, because the results of this study reflect the feeding of king shag on fish populations that have already been affected by past fishing activities. For example, around 10% of all king shag pellets contained blue cod, however, blue cod has

historically been subjected to intensive recreational and commercial harvesting in the Marlborough Sounds resulting in a significant depletion of their population in the region (Beentjes et al., 2018). Where blue cod populations have been allowed to recover by removing fishing pressure, such as in the Long Island Marine Reserve, their numbers have recovered substantially. A blue cod potting study in this reserve in 2017 revealed a 4-fold greater catch rate than nearby areas in Queen Charlotte Sound, and only 7% of pots were retrieved empty in the marine reserve compared to 86% and 72% of pots for two adjacent Queen Charlotte Sound study sites. While a blue cod pot does not catch fish in the same manner as king shag, the marked difference in fishing success in pots relates to differences in localised abundance of fish, which is likely to apply equally to king shag feeding. Tagging and subsequent monitoring of king shag at two colonies over two years indicates high levels of chick mortality, especially immediately post fledging in July and August, followed by a second period of higher mortality in December, then a gradual decline thereafter (Bell 2020). The results of the current study indicate marked seasonal changes in the composition of the diet of king shag. What causes these seasonal dietary changes and how they contribute to maintaining the nutritional provisioning of chicks and fledglings is unclear and would require more targeted sampling and analyses of diet, especially for these young birds. While there are some genetic methods that enable the age of birds to be estimated, this application has not been established for regurgitated pellets, however, in the future using genetic methods may provide an avenue for addressing this question (De Paoli-Iseppi et al., 2018). A number of species found in the diet of king shags were identified to be significantly different among colonies, seasons, between sexes, and between sexes for colonies. Witch was found less frequently in the pellets collected from The Haystacks than Blumine and White Rocks. It is possible that the king shags from The Haystacks forage in an area that has a lower abundance of these fish. However, seasonal differences in the sampling of the pellets may have contributed to the apparent difference in prey composition. The results also indicated that the pellets regurgitated by females had a significantly higher frequency of occurrence of witch and more specifically for North Trio. This may be due to numerous reasons, such as age and difference in the feeding behaviour of male and female king shag (Bell, 2020). For example, the greater abundance of Helicolenus barathri taken by male king shag at Tawhitinui may be due to the generally deeper diving behaviour of male shags for this fish species which is generally found in deeper water (over 20 m depth) (Ayling & Cox, 1987; Bell, 2020). While there are genetic methods for aging birds these are yet to be applied to regurgitated material from seabirds (De Paoli-Iseppi et al., 2019). North Trio is the most geographically isolated colony that was sampled in this study and this may be the reason for the higher number of pellets containing crested flounder, when compared to all other colonies. The presence of crested flounder was also significantly different among all seasons sampled (i.e., crested flounder was more frequently identified from pellets collected during the spring months regardless of colony). Opalfish occurred less in pellets collected from North Trio than Duffers Reef. Geographically Duffers Reef is in a more sheltered area than North Trio and thus may provide a more suitable habitat. Interestingly, it was identified that both the pellets regurgitated by females from Duffers Reef and Tawhitinui (Duffers Reef nearest inshore neighbour) both had a higher frequency of

occurrence of opalfish than for the pellets recovered from male birds. Opalfish was more prevalent in pellets in spring versus autumn regardless of colony. Overall, the data indicates many variables are likely to have an influence over the prey species that are targeted or are available to king shag, i.e., the geographic location of the colonies and consequently the associated forage grounds in the vicinity, the change in season (e.g., shag breeding season or the spawning season of certain fish species) and/or sex-stereotyped behaviour, but also the age of the shag. The age of the bird may influence the diet when, for example, the chick requires parental feeding and the parents may need to forage accordingly or when juveniles are learning to forage. Although GPS tracking of king shags indicates that individuals will forage over extensive areas of coast, it is clear that proximity of feeding areas is likely to play a role in foraging behaviour and diet (i.e., crested flounder and North Trio) (Bell, 2020).

Appendix 1:

Figure A1: Nonmetric multidimensional scaling (NMDS) was used to visualize the differences in king shag regurgitated pellets at species level (fish only) among colonies compared against Blumine. A PERMANOVA revealed that the clustering was significant (p <0.05).
Figure A2: Nonmetric multidimensional scaling (NMDS) was used to visualize the differences in king shag regurgitated pellets at species level (fish only) among colonies compared against Duffers Reef. A PERMANOVA revealed that the clustering was significant (p <0.05).

Figure A3: Nonmetric multidimensional scaling (NMDS) was used to visualize the differences in king shag regurgitated pellets at species level (fish only) among colonies compared against North Trio. A PERMANOVA revealed that the clustering was significant (p <0.05).

Figure A4: Nonmetric multidimensional scaling (NMDS) was used to visualize the differences in king shag regurgitated pellets at species level (fish only) among colonies compared against Tawhitinui. A PERMANOVA revealed that the clustering was significant (p <0.05).

Figure A5: Nonmetric multidimensional scaling (NMDS) was used to visualize the differences in king shag regurgitated pellets at species level (fish only) among colonies compared against The Haystacks. A PERMANOVA revealed that the clustering was significant (p <0.05).

Figure A6: Nonmetric multidimensional scaling (NMDS) was used to visualize the differences in king shag regurgitated pellets at species level (fish only) among colonies compared against The Twins. A PERMANOVA revealed that the clustering was significant (p <0.05).

Figure A7: Nonmetric multidimensional scaling (NMDS) was used to visualize the differences in king shag regurgitated pellets at species level (fish only) among colonies compared against White Rocks. A PERMANOVA revealed that the clustering was significant (p <0.05).

Figure A8: Nonmetric multidimensional scaling (NMDS) was used to visualize the differences in king shag regurgitated pellets at species level (fish only) among seasons compared against Autumn. A PERMANOVA revealed that the clustering was significant (p <0.05).

Figure A9: Nonmetric multidimensional scaling (NMDS) was used to visualize the differences in king shag regurgitated pellets at species level (fish only) among seasons compared against Spring. A PERMANOVA revealed that the clustering was significant (p <0.05).
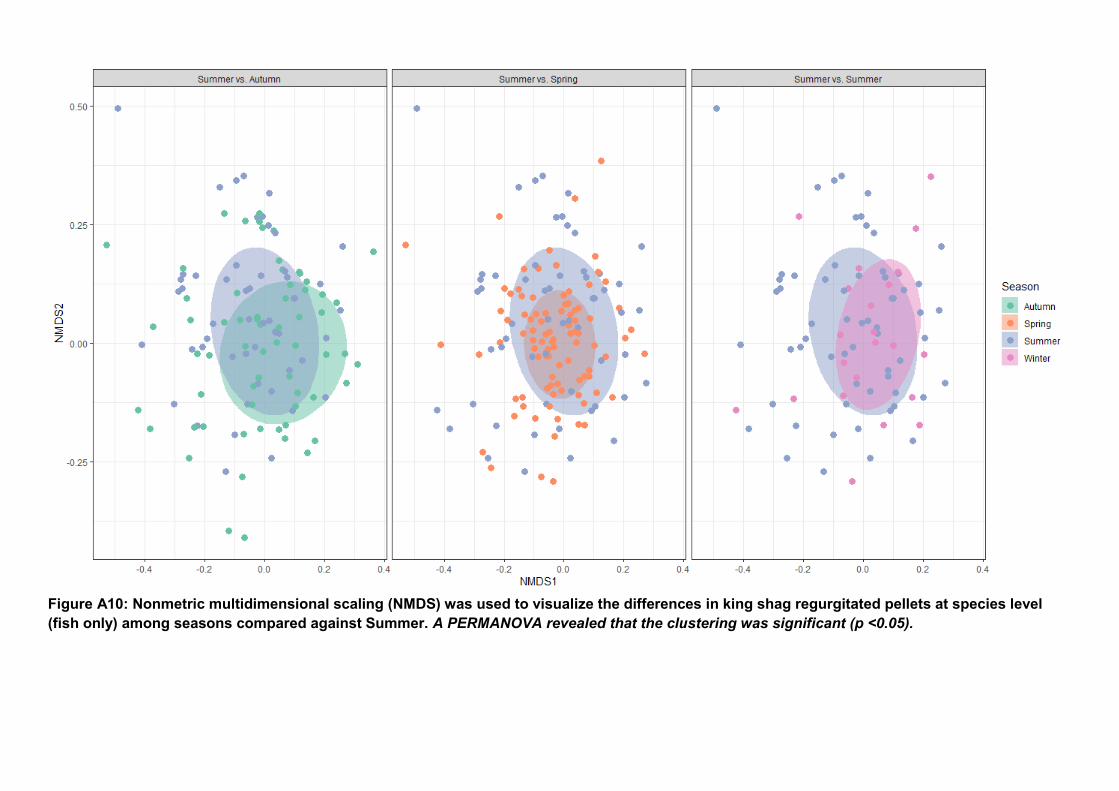
Figure A10: Nonmetric multidimensional scaling (NMDS) was used to visualize the differences in king shag regurgitated pellets at species level (fish only) among seasons compared against Summer. A PERMANOVA revealed that the clustering was significant (p <0.05).

Figure A11: Nonmetric multidimensional scaling (NMDS) was used to visualize the differences in king shag regurgitated pellets at species level (fish only) among seasons compared against Winter. A PERMANOVA revealed that the clustering was significant (p <0.05).

Figure A12: Nonmetric multidimensional scaling (NMDS) was used to visualize the differences in king shag regurgitated pellets at species level (fish only) between males and females. A PERMANOVA revealed that the clustering was significant (p <0.05).

References Aquaculture New Zealand. (2020). King shag numbers steady.
https://www.aquaculture.org.nz/2020/06/09/king-shags-steady/ Ayling, T., Cox, G .J. (1987) Collins guide to the sea fishes of New Zealand. Collins, Auckland. 343 pp. Bell, M. (2020). New Zealand King Shag research project: Year Two update report. Toroa Consulting
Technical Report to the Marine Farming Association and Seafood Innovations Limited. https://www.marinefarming.co.nz/site_files/24792/upload_files/SILMFA-KingShagResearchProject-YearTwoReport.pdf?dl=1
Beentjes, M. P., Page, M., Sutton, C., Olsen, L. (2018) Relative abundance, size and age structure, and
sotck status of blue cod from the 2017 survey in the Marlborough Sounds, and review of historical surveys. New Zealand Fisheries Assessment Report 2018/83. Ministry for Primary Industries, Wellington.
Benson, D. A., Cavanaugh, M., Clark, K., Karsch-Mizrachi, I., Lipman, D. J., Ostell, J., & Sayers, E. W.
(2013). GenBank. Nucleic Acids Research, 41(D1), D36-D42. https://doi.org/10.1093/nar/gks1195 Bolyen, E., Rideout, J. R., Dillon, M. R., Bokulich, N. A., Abnet, C. C., Al-Ghalith, G. A., Alexander, H., Alm,
E. J., Arumugam, M., Asnicar, F., Bai, Y., Bisanz, J. E., Bittinger, K., Brejnrod, A., Brislawn, C. J., Brown, C. T., Callahan, B. J., Caraballo-Rodríguez, A. M., Chase, J., ... (2019). Reproducible, interactive, scalable and extensible microbiome data science using QIIME 2. Nature Biotechnology, 37, 852–857. https://doi.org/10.1038/s41587-019-0209-9
Callahan, B. J., McMurdie, P. J., & Holmes, S. P. (2017). Exact sequence variants should replace
operational taxonomic units in marker-gene data analysis. The Isme Journal, 11, 2639. https://doi.org/10.1038/ismej.2017.119
Callahan, B. J., McMurdie, P. J., Rosen, M. J., Han, A. W., Johnson, A. J. A., & Holmes, S. P. (2016).
DADA2: High-resolution sample inference from Illumina amplicon data. Nature Methods, 13(7), 581-583. https://doi.org/10.1038/nmeth.3869
De Paoli-Iseppi, R., Deagle, B. E., Polanowski, A. M., McMahon, C. R., Dickinson, J. L., Hindell, M. A., &
Jarman, S. N. (2019). Age estimation in a long‐lived seabird (Ardenna tenuirostris) using DNA methylation‐based biomarkers. Molecular Ecology Resources, 19(2), 411-425. https://doi.org/10.1111/1755-0998.12981
Deagle, B. E., Jarman, S. N., Coissac, E., Pompanon, F., & Taberlet, P. (2014). DNA metabarcoding and
the cytochrome c oxidase subunit I marker: Not a perfect match. Biology Letters, 10(9), 20140562. https://doi.org/10.1098/rsbl.2014.0562
Devloo-Delva, F., Huerlimann, R., Chua, G., Matley, J., Heupel, M., Simpfendorfer, C., & Maes, G. (2018).
How does marker choice affect your diet analysis: Comparing genetic markers and digestion levels for diet metabarcoding of tropical-reef piscivores. Marine and Freshwater Research, 70, 8-18. https://doi.org/10.1071/MF17209
Fisher, P., & Boren, L. (2012). New Zealand king shag (Leucocarbo carunculatus) foraging distribution and
use of mussel farms in Admiralty Bay, Marlborough Sounds. Notornis, 59(3&4), 105-115. http://notornis.osnz.org.nz/new-zealand-king-shag-leucocarbo-carunculatus-foraging-distribution-and-use-mussel-farms-admiralty-b
Fridolfsson, A.-K., & Ellegren, H. (1999). A simple and universal method for molecular sexing of non-ratite
birds. Journal of Avian Biology, 30(1), 116-121. https://doi.org/10.2307/3677252

Geller, J., Meyer, C., Parker, M., & Hawk, H. (2013). Redesign of PCR primers for mitochondrial cytochrome c oxidase subunit I for marine invertebrates and application in all-taxa biotic surveys. Molecular Ecology Resources, 13(5), 851-861. https://doi.org/10.1111/1755-0998.12138
Illumina. (2013). 16S metagenomic sequencing library preparation: Preparing 16S ribosomal RNA gene
amplicons for the Illumina MiSeq system (Report no. 15044223 Rev. B). Retrieved from https://support.illumina.com/documents/documentation/chemistry_documentation/16s/16s-metagenomic-library-prep-guide-15044223-b.pdf
Kress, W. J., García-Robledo, C., Uriarte, M., & Erickson, D. L. (2015). DNA barcodes for ecology,
evolution, and conservation. Trends in Ecology and Evolution, 30(1), 25-35. https://doi.org/10.1016/j.tree.2014.10.008
Lalas, C., & Brown, D. (1998). The diet of New Zealand king shags (Leucocarbo carunculatus) in Pelorus
Sound. Notornis, 45(2), 129-139. https://www.scopus.com/inward/record.uri?eid=2-s2.0-0032414708&partnerID=40&md5=6ae822f54284de305b450cb414faae3b
Lalas, C., & Schuckard, R. (2021). Occurrence of prey species identified from remains in regurgitated
pellets collected from king shags, 2019 - 2020. BCBC2019-05 final report prepared for the Conservation Services Programme, Department of Conservation. Report No. BCBC2019-05. https://www.doc.govt.nz/globalassets/documents/conservation/marine-and-coastal/marine-conservation-services/reports/final-reports/bcbc2019-05-king-shag-pellet-diet-final-report.pdf
Lenth, R. (2019). emmeans: Estimated Marginal Means, aka Least-Squares Means. R package version
1.3.4. https://doi.org/https://CRAN.R-project.org/package=emmeans Leray, M., Yang, J. Y., Meyer, C. P., Mills, S. C., Agudelo, N., Ranwez, V., Boehm, J. T., & Machida, R. J.
(2013). A new versatile primer set targeting a short fragment of the mitochondrial COI region for metabarcoding metazoan diversity: Application for characterizing coral reef fish gut contents. Frontiers in Zoology, 10, 34. https://doi.org/10.1186/1742-9994-10-34
Machida, R. J., Leray, M., Ho, S.-L., & Knowlton, N. (2017). Metazoan mitochondrial gene sequence
reference datasets for taxonomic assignment of environmental samples. Scientific Data, 4, 170027. https://doi.org/10.1038/sdata.2017.27
Manikiam, J. (1969). A guide to the flatfishes (Order Heterosomata) of New Zealand. Tuatara, 17(3).
http://nzetc.victoria.ac.nz/tm/scholarly/tei-Bio17Tuat03-t1-body-d3.html Martin, M. (2011). Cutadapt removes adapter sequences from high-throughput sequencing reads. Embnet
Journal, 17(1), 3. https://doi.org/10.14806/ej.17.1.200 McMillan, P.J., Francis, M.P., James, G.D., Paul, L.J., Marriott, P., Mackay, E., Wood, B.A., Stevens, D.W.,
Griggs, L.H., Baird, S.J., Roberts, C.D., Stewart, A.L., Struthers, C.D., Robbins, J.E. (2019). New Zealand fishes. A field guide to common species caught by bottom, midwater, and surface fishing. New Zealand Aquatic Environment and Biodiversity Report No. 208. https://docs.niwa.co.nz/library/public/NZAEBR-208.pdf
Miskelly, C., Dowding, J., Elliott, G., Hitchmough, R., Powlesland, R., Robertson, H., Sagar, P., Scofield, P.,
& Taylor, G. (2008). Conservation status of New Zealand birds. Notornis, 55(3), 117-135. Morgulis, A., Coulouris, G., Raytselis, Y., Madden, T. L., Agarwala, R., & Schaffer, A. A. (2008). Database
indexing for production MegaBLAST searches. Bioinformatics, 24(16), 1757-1764. https://doi.org/10.1093/bioinformatics/btn322
Oksanen, J., Blanchet, F. G., Friendly, M., Kindt, R., Legendre, P., McGlinn, D., Minchin, P. R., O'Hara, R.
B., Simpson, G. L., Solymos, P., Stevens, M. H. H., Szoecs, E., & Wagner, H. (2019). vegan: Community Ecology Package (Version 2.5-6). Comprehensive R Archive Network (CRAN). Retrieved from https://CRAN.R-project.org/package=vegan

Palmer, A. D. N. (2008). DNA isolation and amplification from formaldehyde-fixed animal tissues rich in
mucopolysaccharides, pigments, and chitin. Preparative Biochemistry & Biotechnology, 39(1), 72-80. https://doi.org/10.1080/10826060802589635
Piñol, J., Andrés, V. S., Clare, E. L., Mir, G., & Symondson, W. O. C. (2014). A pragmatic approach to the
analysis of diets of generalist predators: The use of next‐generation sequencing with no blocking probes. Molecular Ecology Resources, 14(1), 18-26. https://doi.org/10.1111/1755-0998.12156
R Core Team. (2021). R: A language and environment for statistical computing. R Foundation for Statistical
Computing. Retrieved from https://www.R-project.org/ Schuckard, R., Melville, D., & Taylor, G. (2015). Population and breeding census of New Zealand king shag
(Leucocarbo carunculatus) in 2015. Notornis, 62(4), 209-218. Seutin, G., White, B. N.., & Boag, P. T. (1991). Preservation of avian blood and tissue samples for DNA
analyses. Canadian Journal of Zoology, 69, 82-90. Taylor, T. (2020). Indirect effects of commercial fishing in the Marlborough Sounds on the foraging of king
shag, Leucocarbo carunculatus. BCBC2019-05 final report prepared by the University of Auckland for the Conservation Services Programme, Department of Conservation. Report No. BCBC2019-05. https://www.doc.govt.nz/globalassets/documents/conservation/marine-and-coastal/marine-conservation-services/reports/final-reports/bcbc2019-05-king-shag-indirect-effects-part-a-final-report.pdf
van der Reis, A., & Jeffs, A. (2020). Determining the diet of New Zealand king shag using DNA
metabarcoding. BCBC2019-05 final report prepared by the University of Auckland for the Conservation Services Programme, Department of Conservation. Report No. BCBC2019-05. https://www.doc.govt.nz/globalassets/documents/conservation/marine-and-coastal/marine-conservation-services/reports/final-reports/bcbc2019-05-king-shag-dna-final-report.pdf
Wickham, H. (2017). Tidyverse: Easily install and load 'Tidyverse' packages (Version 1.1.1).
Comprehensive R Archive Network (CRAN). Retrieved from https://CRAN.R-project.org/package=tidyverse


![This week’s headlines · 2020-06-18 · Diets & Health The Keto Diet - Trend or Treatment? [08 December, Teresa Cowie, Radio New Zealand] The keto diet, which consists of a low-carb,](https://static.fdocuments.in/doc/165x107/5f4429ed3888c6153236aabe/this-weekas-headlines-2020-06-18-diets-health-the-keto-diet-trend-or.jpg)