Spatial Accessibility of Primary Health Care
42
Background The two step floating catchment area (2SFCA) method has emerged in the last decade as a key measure of spatial accessibility, particularly in its application to primary health care access. Many recent ‘improvements’ to the original 2SFCA method have been developed, which generally eitheraccount for distance-decay within a catchment or enable the usage of variable catchment sizes. This paper evaluates the effectiveness of various proposed methods within these two improvement groups. Moreover, its assessment focuses on how well these improvements operate within and between rural and metropolitan populations over large geographical regions. Results Demonstrating these improvements to the whole state of Victoria, Australia, this paper presents the first comparison between continuous and zonal (step) decay functions and specifically their effect within both rural and metropolitan populations. Especially in metropolitan populations, the application of either type of distance-decay function is shown to be
-
Upload
joanna-angelopoulou -
Category
Documents
-
view
8 -
download
0
description
Spatial Accessibility of Primary Health Care
Transcript of Spatial Accessibility of Primary Health Care
BackgroundThe two step floating catchment area (2SFCA) method has
emerged in the last decade as a key measure of spatial
accessibility, particularly in its application to primary
health care access. Many recent ‘improvements’ to the
original 2SFCA method have been developed, which
generally eitheraccount for distance-decay within a
catchment or enable the usage of variable catchment
sizes. This paper evaluates the effectiveness of various
proposed methods within these two improvement groups.
Moreover, its assessment focuses on how well these
improvements operate within and between rural and
metropolitan populations over large geographical regions.ResultsDemonstrating these improvements to the whole state of
Victoria, Australia, this paper presents the first
comparison between continuous and zonal (step) decay
functions and specifically their effect within both rural and
metropolitan populations. Especially in metropolitan
populations, the application of either type of distance-
decay function is shown to be problematic by itself. Its
inclusion necessitates the addition of a variable
catchment size function which can enable the 2SFCA
method to dynamically define more appropriate
catchments which align with actual health service supply
and utilisation.
ConclusionThis study assesses recent ‘improvements’ to the 2SFCA
when applied over large geographic regions of both large
and small populations. Its findings demonstrate the
necessary combination of both a distance-decay function
and variable catchment size function in order for the
2SFCA to appropriately measure healthcare access across
all geographical regions.
Keywords: Spatial accessibility; Primary health care; Rural health; Access to health care; Service catchments; Medical geographyIntroduction
Access to health care is widely accepted internationally as
a key goal in meeting the health needs of individuals [1-
4]. However, assessing the extent to which adequate
access to health care services is achieved is difficult
because there is no single agreed definition of access [5-
8]. Healthcare access is such a complex concept that
Norris and Aiken [9] went as far as to state that“It is as if
everyone is writing about ‘it’ [access] but no one is saying
what ‘it’ is”.
A fundamental problem of defining access is its status as
both a noun and a verb [10], thus healthcare access can
refer both to the potential for use as well as the act of
using healthcare. Furthermore, access is multidimensional
with specific access barriers covering a range of spatial
and aspatial dimensions [11-13], making it difficult to
operationalise. Health service planners have tended to
adopt Penchansky and Thomas’ [13] five main dimensions
of access – specifically availability, accessibility,
affordability, accommodation and acceptability. As a
result, healthcare access indicators vary immensely, and
may be capturing but not limited to the availability of
care, the ability to get to and pay for available care, or the
act of seeking and utilising available care. One common
approach to evaluating access to health care is through
measuring spatial accessibility [10,14-16]. Spatial
accessibility provides a summary measure of two
important and related components of access - firstly the
volume of services provided relative to the population’s
size and secondly the proximity of services provided
relative to the location of the population. This paper
focuses on one such measure of spatial accessibility, the
two-step floating catchment area (2SFCA) method and
evaluates its many recent ‘improvements’.
Background
Spatial accessibility and the two-step floating catchment area (2SFCA) methodThe accurate measurement of spatial accessibility to
health care is problematic chiefly because there is seldom
any predetermined assignment or single pathway
between individuals and specific health care services.
That is, in most western societies individuals are free to
access health care wherever and from whomever they
choose. Thus an assessment of available services relative
to the needs of the population specific to a local area is
challenging. This is especially true for primary health care
services, the key facilitator of access within most
international health care systems [17,18], which co-exist
in a network of overlapping catchments ‘competing’ for
the population’s utilisation of their services.
The two-step floating catchment area (2SFCA) method,
pioneered by Luo and Wang [11,15,19], emerged from a
background in which the shortcomings of existing
measures of spatial accessibility were readily apparent. In
particular, fundamental weaknesses of provider- or
physician-population ratios (PPRs) are well-
recognised [10,14,15], which fail to include both cross-
border movement between boundaries and distance
decay within boundaries, but most significant is their
restriction to using fixed geographical or administrative
boundaries such as counties or postcodes. The 2SFCA
method builds upon the framework of PPRs, but instead
uses floating catchment areas which overlap, thereby
enabling the modelling and measurement of ‘real-life’
healthcare access behaviour with unrestricted utilisation.
The size of the catchment is determined by a choice of
maximum travel time (or distance), where all services (or
populations) within that catchment are considered
accessible and equally proximate to that particular
population (or service), whilst all locations outside of the
catchment are not accessible.
The process for calculating the 2SFCA method is relatively
straightforward. Step 1 of the 2SFCA method determines
what populations (k) of size Pk are located within the
catchment of each service provider (j) of volume Sj, thus
defining the provider-to-population ratio Rj within a
service catchment (that is, the potential service demand).
Step 2 then ‘allocates’ these service ratios to the
population by determining which services (j) are located
within the catchment of each population (i), and
aggregating the Step 1 (Rj) scores to calculate a location’s
access (Ai). The only decision required in applying the
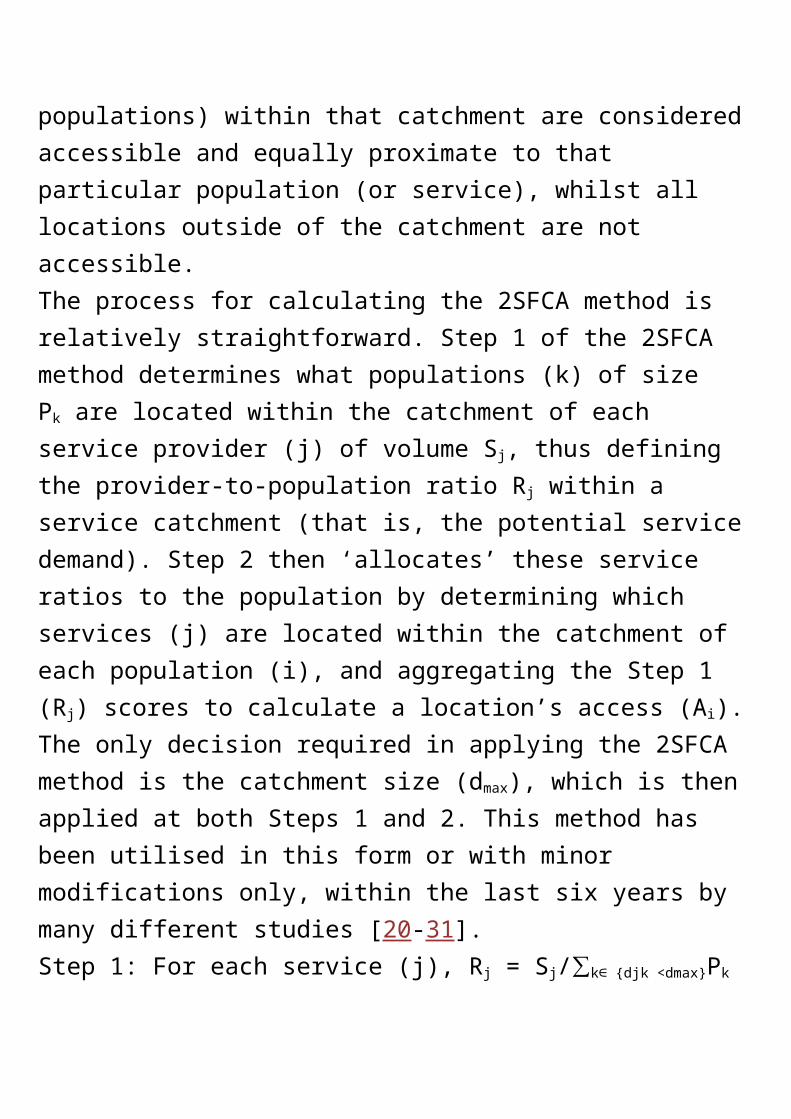
2SFCA method is the catchment size (dmax), which is then
applied at both Steps 1 and 2. This method has been
utilised in this form or with minor modifications only,
within the last six years by many different studies [20-31].
Step 1: For each service (j), Rj = Sj/∑k∈ {djk <dmax}Pk
Step 2: For each population (i), Ai = ∑ j∈ {dij <dmax}Rj
The following assumptions are made regarding application
of the 2SFCA method:
Service providers are represented by their geocoded
organisational address (latitude, longitude). Aggregating
service counts to some administrative boundary (e.g.
town, county, postcode) will simplify its computation, but
can greatly reduce its sensitivity to small-area
discrimination.
Population (aggregated) groups are represented through a
single location (centroid, usually geometric or population-
weighted), based on some larger administrative boundary.
Usage of smaller areal units enables more accurate small-
area measurement of ‘local’ access, but also greatly
increases computation complexity.
Population-provider proximity (d) is measured as time or
distance separation (point-to-point) through some
transport network (roads, public transport). Euclidean
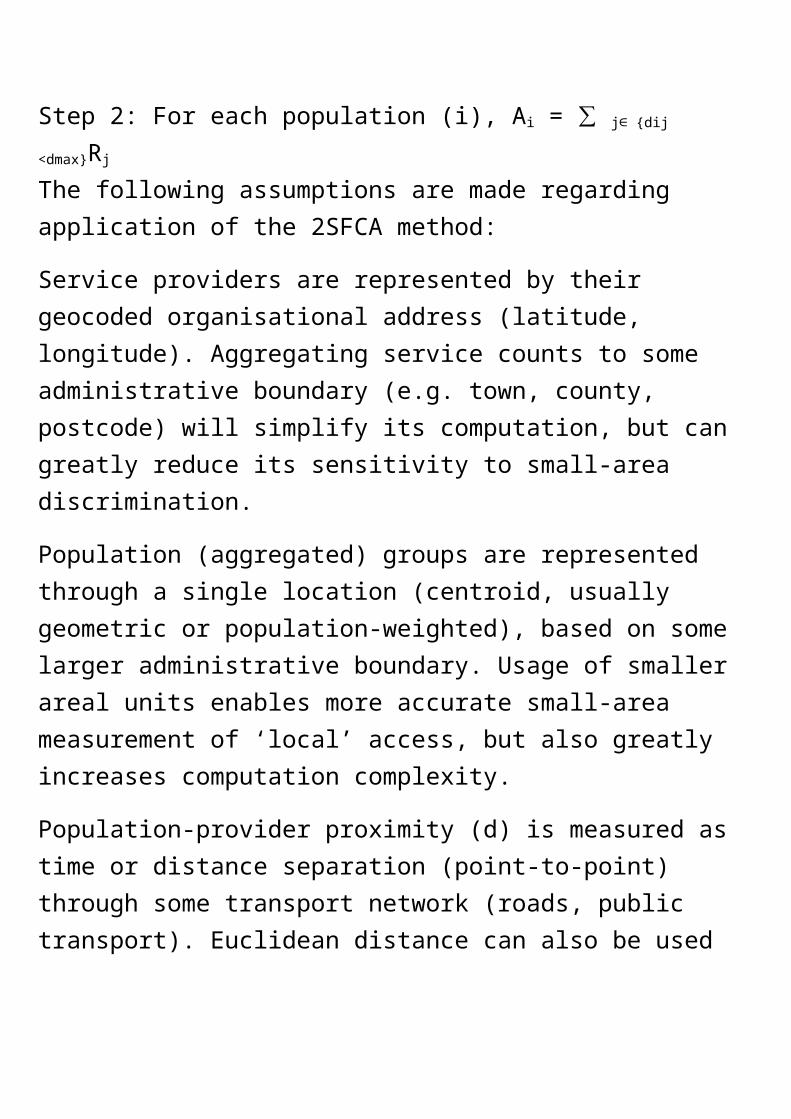
distance can also be used to approximate proximity;
however, this results in a moderate loss of accuracy.
Whilst the greatest strength of the 2SFCA method is it
overcomes the restriction of using only pre-defined
regional boundaries, this improvement alone does not
address two major weaknesses still apparent in its
framework. Firstly, distance-decay is assumed to be
negligible within a catchment, something which is clearly
not the case in large geographical regions where
populations are widely dispersed, and catchments
therefore are quite extensive. Secondly, catchments are
assumed to be the same size for all populations and for all
services.
Over the past five years, several authors have developed
methodological ‘improvements’ to address these
weaknesses characterising the 2SFCA method. This paper
assesses these improvements to the 2SFCA method by
evaluating their effectiveness when applied to primary
health care access. Moreover, this assessment will focus
on how well these improvements operate within and
between rural, regional and metropolitan populations over
large geographical regions. Health policies are mostly
applied at national or state levels which require
methodologies to work across diverse and large
geographies. However, to date most 2SFCA method
improvements have been demonstrated only within small
or localised areas.
Improvement 1 – addition of distance decay functionWithout the addition of a distance decay function, there is
widespread agreement that the 2SFCA method is
deficient [32-35]. Its omission is equivalent to accepting
that distance (or time) is a negligible barrier within a
catchment, an unlikely scenario for geographically large
countries and given our use of a maximum catchment of
60 minutes in this paper. Within a service catchment
(Step 1), distance-decay omission means that any service
is equally likely to be delivering services to both
populations very close by and those up to the catchment
boundary (60 minutes). Within a population catchment
(Step 2), distance-decay omission means that individuals
are equally likely to be accessing services from both
nearby and up to the catchment boundary (60 minutes).
Whilst omission of both of these may be acceptable for a
small scale model in a densely populated area (such as
within major cities), it is clear that a distance-decay
function is crucial in sparsely populated (rural) areas
where problems associated with poor access to health

care services are known to be a major factor contributing
to the poorer health status of population in these
areas [36,37].
Currently there is little empirical evidence to guide the
choice of one decay function over another. Wang [38]
defined six different distance-decay functions, where the
crude 2SFCA method is defined by its use of a binary
discrete function with no decay within a catchment and
complete decay outside of a catchment. Luo & Qi [34]
developed what they called the ‘enhanced’ 2-step floating
catchment area (E2SFCA) method, where catchments are
broken into 3 discrete zones (0–10 minutes; 11–20
minutes; 21–30 minutes) with constant weightings
(w<=1) applied to the accessibility within each zone.
Subsequently, some authors have accepted the E2SFCA
method as the new ‘standard’ 2SFCA method [21,32,39],
whilst Wan et. al. [40] extended this approach by adding a
30–60 minutes zone. Drawing on Wan and the Gaussian
distribution [40,41], two sets of weightings are tested in
this paper for these four time barrier zones, relating to
either fast or slow decay:
Fast step-decay: weightings (w) = 1, 0.60, 0.25, 0.05
Slow step-decay: weightings (w) = 1, 0.80, 0.55, 0.15.

In applying this zonal or step approach to large
geographical areas, the key criticism remains - specifically
that accessibility weightings are equal within each zone
and there is a sudden step (drop) at the edge of each
zone [32,33], something which does not match real
utilisation behaviour. Resultantly, many authors have
developed distance-decay functions which are smoother
and continuous in their decay [32,35,42,43]; however
without any empirical evidence, it is unclear which
function is the most appropriate to use [38]. This paper
tests one such continuous weighting function:
Continuous decay: weightings (w) = 1 for the first 10
minutes, w = 0 for more than 60 minutes, and w = ((60-
d)/(60–10))^1.5 for distance/time (d) between 10 and 60
minutes.
Previous testing suggested 1.5 was an appropriate
weighting factor [35], though higher values such as 2
would achieve a quicker decay rate. Figure 1 shows the
relative weightings of the three decay functions to be
tested.
Figure 1. Decay function (weighting) versus distance (minutes).
Improvement 2 – addition of variable catchment size function / variable inclusion of distance decayOne feature of applications of the 2SFCA method by
different authors is their choice of different catchment
sizes, with those in metropolitan settings generally using
significantly smaller catchment sizes than for rural
settings. Metropolitan and rural regions have very
different settlement patterns, meaning that the
appropriate catchment size for different regions is likely to
vary greatly. Despite this, to date only two research
groups have investigated the use of a variable catchment
size function or the related variable inclusion of a distance
decay function [35,44], with each using very different
methods for defining their population and service
catchment sizes.
Variable population catchment size (Step 2) is
conceptually simple – individuals can travel further (or
have a higher likelihood of travelling further) to access
healthcare if nearby services do not meet their
needs [45]. In metropolitan areas, services and
populations are densely located so that, typically, most
individuals will access services in close proximity because
their requirements are met. In contrast, rural services are
more dispersed, so that rural populations commonly

access services beyond their immediate community.
McGrail and Humphreys [46] modelled this
rural/metropolitan distinction by limiting population
catchment sizes to those containing the nearest 100
services (up to a maximum of 60 minutes, with a
minimum catchment of 10 minutes). Similarly, Luo and
Whippo [44] defined a minimum population catchment
size of 10 minutes; however their approach was very
different as a result of incrementally increasing the
population catchment size (up to a maximum of 60
minutes) until a minimum provider-to-population ratio
(1:3500) is reached.
In metropolitan settings, both of these approaches ensure
that the population catchment size is close to the
minimum level of 10 minutes. In rural settings, McGrail’s
approach will have negligible effect because most rural
populations will not have 100 services within a catchment
of up to 60 minutes; however in metropolitan-fringe
settings the effect of this approach will be most noticeable
because the capping of 100 nearest services will vary
greatly. Luo’s approach does not distinguish between
geographical settings; rather its effect is dependent on
the local access level with populations modelled as only
travelling further if their local access is below a minimum
level.
Variable service catchment size (Step 1) is conceptually
more difficult, with three broad scenarios defining
different catchment areas requirements: (1) Metropolitan
services provide access mostly to only their local
neighbourhood; (2) Services in metropolitan-fringe areas
or larger rural communities will frequently serve
populations located well beyond the local community; (3)
In contrast, services in small rural communities are
generally not providing access for populations in larger
nearby communities, who have adequate access within
their immediate community.
McGrail and Humphreys proposed a method for variably
applying distance decay at Step 1 across all regions,
based on differentiating local population distributions [35].
Their four sequential rules (Table 1) are broadly designed
to follow the three scenarios described in the previous
paragraph and enable the 2SFCA method to dynamically
determine where distance-decay should be applied (and
thus reduce the size of the population being served).Table 1. McGrail and Humphrey’s rules to define the variable application of distance-decay to service catchments (Step 1)
Luo and Whippo [44] took a much simpler approach to
defining service catchments by increasing its size
incrementally (starting at 10 minutes) until the catchment

population reaches 500,000 (note: for this paper, 250,000
or 250K was considered a more appropriate size, and
tested henceforth). It is clear that Luo’s approach will
have minimal or no effect on service catchments in
sparsely populated (rural) areas, where the catchment
population will be significantly less than 250K.Methods
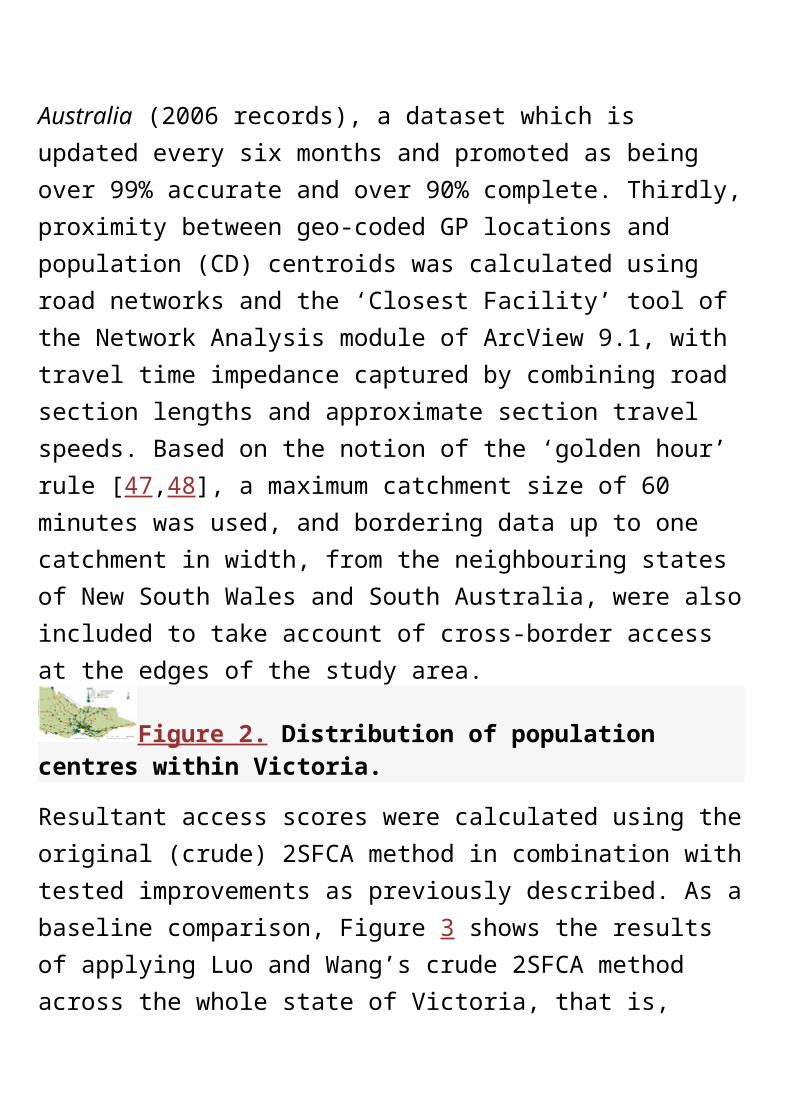
Study area and data requirementsTo evaluate the 2SFCA method improvements, access
scores are calculated using general practitioner (GP)
service data in the state of Victoria, Australia (see
Figure 2). Victoria has a total area of 227,000 square
kilometres and 2011 population in excess of 5½ million (of
which some 35% reside outside of its major city of
Melbourne). Firstly, population size and location data were
obtained from the 2006 national census, using the
smallest geographical unit of ‘collection districts’ (CDs)
which contain an average population of approximately
500 residents. Secondly, lists of GP locations (street
address) and full-time equivalence counts were obtained
from the Medical Directory of Australia (2006 records), a
dataset which is updated every six months and promoted
as being over 99% accurate and over 90% complete.
Thirdly, proximity between geo-coded GP locations and
population (CD) centroids was calculated using road
networks and the ‘Closest Facility’ tool of the Network
Analysis module of ArcView 9.1, with travel time
impedance captured by combining road section lengths
and approximate section travel speeds. Based on the
notion of the ‘golden hour’ rule [47,48], a maximum
catchment size of 60 minutes was used, and bordering
data up to one catchment in width, from the neighbouring
states of New South Wales and South Australia, were also
included to take account of cross-border access at the
edges of the study area.
Figure 2. Distribution of population centres within Victoria.
Resultant access scores were calculated using the original
(crude) 2SFCA method in combination with tested
improvements as previously described. As a baseline
comparison, Figure 3 shows the results of applying Luo
and Wang’s crude 2SFCA method across the whole state
of Victoria, that is, before the inclusion of any
‘improvements’. All access scores are assessed against a
five-level community population size scale, which align
closely with natural break points of primary care service
provision in Australia [49,50]. Specifically, these are: (1)
very small rural: <1,500 residents (none or limited GP
services within community); (2) small rural: 1,500–4,999
residents (narrow choice of GP services within
community); (3) medium rural: 5,000–24,999 residents
(moderate choice of GP services within community); (4)
large rural: 25,000–99,999 residents (wide choice of GP
services within community); (5) metropolitan: >100,000
residents.
Figure 3. Results from applying the crude 2SFCA method across all of Victoria.
Results
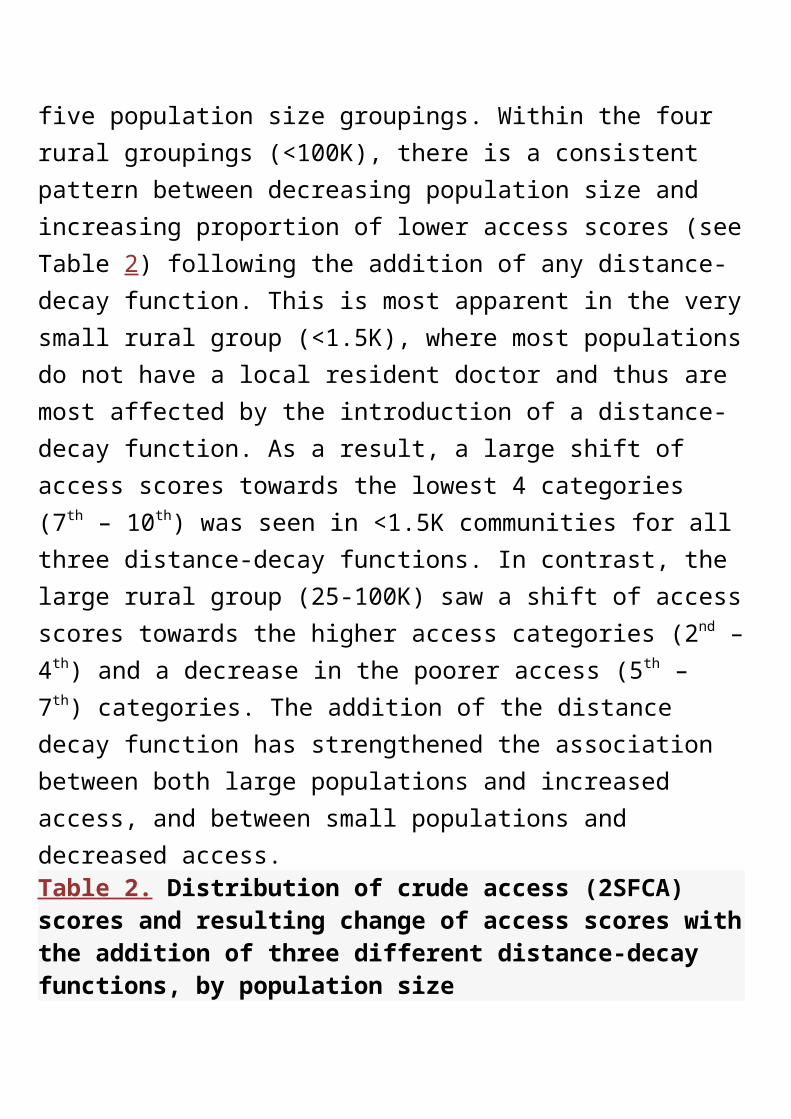
Outcomes: improvement 1 – addition of distance decay functionTable 2 and Figure 4 show the result of integrating each of
three different distance-decay functions within the 2SFCA
method at both Step 1 and Step 2, which are summarised
across five population size groupings. Within the four rural
groupings (<100K), there is a consistent pattern between
decreasing population size and increasing proportion of
lower access scores (see Table 2) following the addition of
any distance-decay function. This is most apparent in the
very small rural group (<1.5K), where most populations
do not have a local resident doctor and thus are most
affected by the introduction of a distance-decay function.
As a result, a large shift of access scores towards the
lowest 4 categories (7th – 10th) was seen in <1.5K
communities for all three distance-decay functions. In
contrast, the large rural group (25-100K) saw a shift of
access scores towards the higher access categories (2nd –
4th) and a decrease in the poorer access (5th – 7th)
categories. The addition of the distance decay function
has strengthened the association between both large
populations and increased access, and between small
populations and decreased access.Table 2. Distribution of crude access (2SFCA) scores and resulting change of access scores with the addition of three different distance-decay functions, by population size
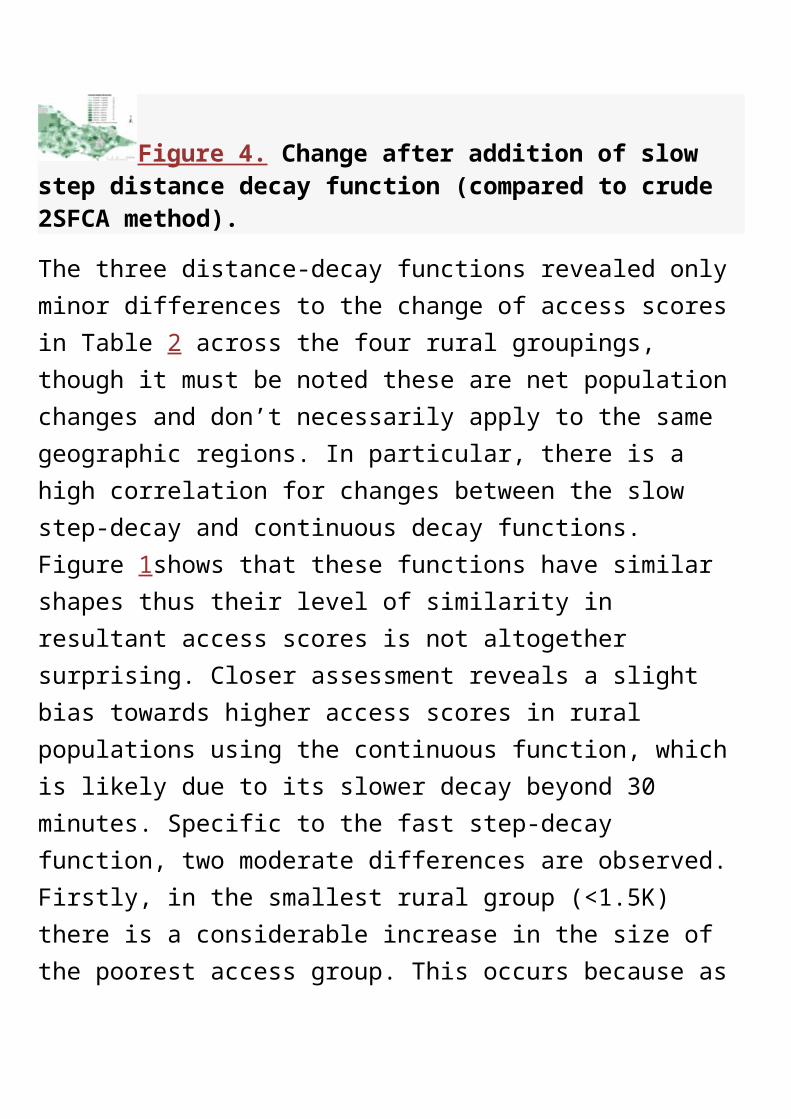
Figure 4. Change after addition of slow step distance decay function (compared to crude 2SFCA method).
The three distance-decay functions revealed only minor
differences to the change of access scores in
Table 2 across the four rural groupings, though it must be
noted these are net population changes and don’t
necessarily apply to the same geographic regions. In
particular, there is a high correlation for changes between
the slow step-decay and continuous decay functions.
Figure 1shows that these functions have similar shapes

thus their level of similarity in resultant access scores is
not altogether surprising. Closer assessment reveals a
slight bias towards higher access scores in rural
populations using the continuous function, which is likely
due to its slower decay beyond 30 minutes. Specific to the
fast step-decay function, two moderate differences are
observed. Firstly, in the smallest rural group (<1.5K) there
is a considerable increase in the size of the poorest access
group. This occurs because as distance-decay is applied
more quickly (at Step 2), populations who are required to
travel further to access distant services are affected most
and thus their access scores decrease most. The second
noticeable difference in rural populations is a small
increase in the two highest access categories (1st and 2nd).
This occurs because a faster distance-decay (applied at
Step 1) causes decreased demand from distant
populations (that is, it decreases the denominator in
Equation 1), the result of which is inflated access scores.
The introduction of a distance decay function has had the
greatest effect (population size) within metropolitan
centres (>100K). This is largely explained by the crude
2SFCA method allocating most metropolitan populations
to only the 2nd and 3rd access categories. After applying
any one of the distance-decay functions, the highest
access category has increased greatly (694K – 1039K),
mostly at the expense of the 2nd access category whilst
the 4th and 5th categories have increased significantly
(142K – 306K) at the expense of the 3rd access category.
Meanwhile, the lowest 5 access categories for
metropolitan populations have all increased slightly, with
the fast step-decay function seeing the largest increase in
poorer access scores. Notably, Figure 4 demonstrates a
very strong geographical pattern within metropolitan
Melbourne, with the largest access gains located in the
geographical centre whilst the largest losses are all
located in the outer-urban / rural-fringe areas with a clear
concentric pattern of decreasing ‘access’ from the
centroid to the metropolitan-fringe. This suggests that
with the addition of distance-decay function, the 2SFCA
method is now largely measuring ‘choice’ in metropolitan
areas. In the next section, which assesses the addition of
a variable catchment size function, the slow step-decay
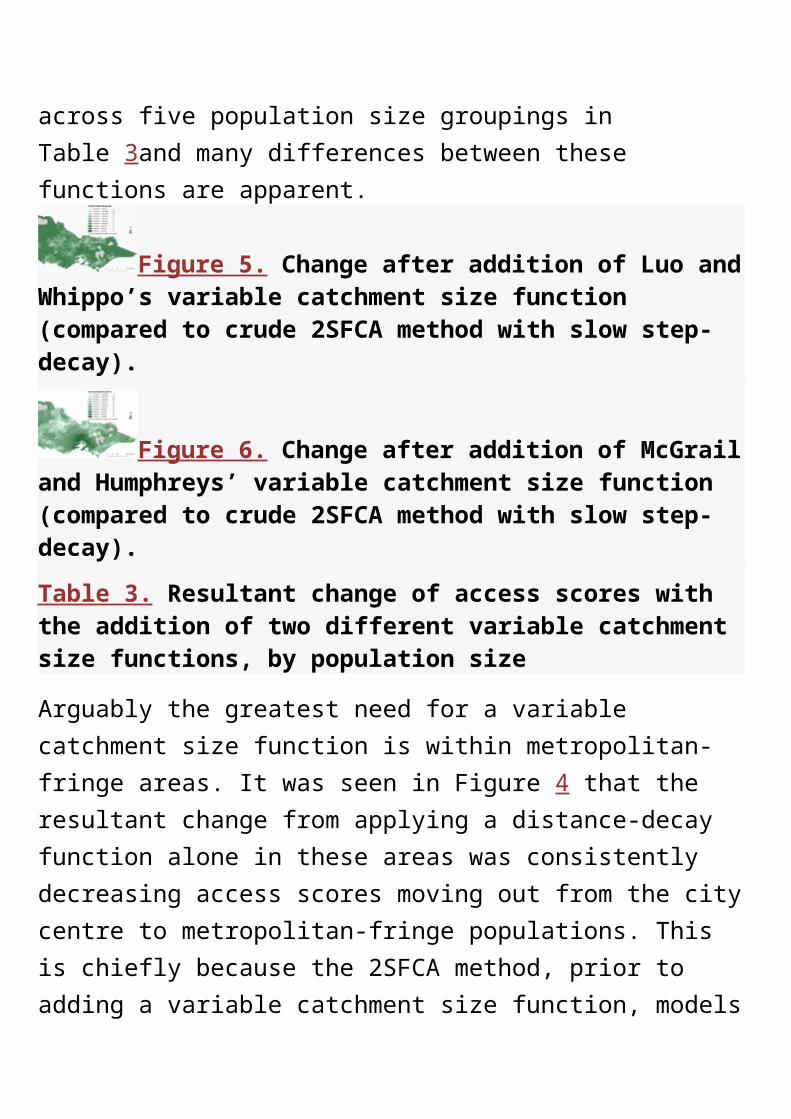
function has been included.Outcomes: improvement 2 – addition of variable catchment size function / variable inclusion of distance decayFigures 5 and 6 respectively show the change to access
scores across different geographic regions with the
addition of either Luo’s or McGrail’s variable catchment
size function. Outcomes from applying these functions are
further summarised across five population size groupings
in Table 3and many differences between these functions
are apparent.
Figure 5. Change after addition of Luo and Whippo’s variable catchment size function (compared to crude 2SFCA method with slow step-decay).
Figure 6. Change after addition of McGrail and Humphreys’ variable catchment size function (compared to crude 2SFCA method with slow step-decay).
Table 3. Resultant change of access scores with the addition of two different variable catchment size functions, by population size
Arguably the greatest need for a variable catchment size
function is within metropolitan-fringe areas. It was seen in
Figure 4 that the resultant change from applying a
distance-decay function alone in these areas was
consistently decreasing access scores moving out from
the city centre to metropolitan-fringe populations. This is
chiefly because the 2SFCA method, prior to adding a
variable catchment size function, models metropolitan-
fringe locations as being ‘swamped’ by inner-metropolitan
populations travelling out to these fringe (and nearby
rural) locations, guaranteeing their lower access scores.
Both functions (Luo’s and McGrail’s) rectify this problem
to varying degrees. McGrail’s Step 1 distance-decay
function rules (Table 1) have reversed much of the drop in
access scores in metropolitan-fringe areas, though its
validity is difficult to assess. Luo’s simpler approach too
increases access in many metropolitan-fringe areas, but is
less effective for two reasons. Firstly, their constant use of
a 250K service catchment ensures metropolitan-fringe
populations continue to ‘swamp’ nearby rural services.
Secondly, their function which expands the population
catchment only until a minimum access level (<1:3500) is
reached is problematic because in nearby rural areas it is
highly likely that local populations can and will choose to
travel a little further into metropolitan-fringe areas to
access services. Thus the ‘real’ access score should be
larger in these areas than their function allows.
In all rural population groups, Table 3 shows that Luo’s
approach has reduced access levels for more of the
population compared to McGrail’s approach. For example,
in 5-25K rural towns Luo’s model has increased a net total
of 126K into the lowest 6 access categories (<0.0008)
whilst the comparative net movement in McGrail’s model
to the same 6 access categories is 59K. This pattern is
consistent in all five population size groupings, to various
degrees and is predominantly due to Luo’s use of the
population catchment size minimum PPR rule (>1:3500 as
applied to Step 2), whilst their Step 1 rule has virtually no
effect in rural areas. Interestingly, the opposite application
occurs in McGrail’s model with their rule of limiting the
population catchment to the nearest 100 services (as
applied to Step 2) having virtually no effect in rural areas,
whilst their Step 1 rules (Table 1) greatly affect rural
access scores.
Visually, changes in rural access scores are quite different
using either Luo’s (Figure 5) or McGrail’s (Figure 6)
approach. Closer investigation of Figure 6 (McGrail’s
approach) reveals that many areas showing the largest
decrease in access accord directly with areas of largest
increase in access in Figure 4. That is, for many areas
there is a direct ‘correction’ from first applying the
distance-decay function, then adding the variable
catchment size function. This is explained by the Step 1
rules (Table 1) which purposefully aim to improve the
determination of when, or if, the distance-decay function
should be applied. Resultant access changes from Luo’s
approach (Figure5) have no apparent relationship to the
distance-decay function (Figure 4).Discussion
This paper has critically evaluated current and recent
work by a number of different researchers who have
developed new methodologies aimed at improving the
2SFCA method. Generally, these improvements aim to
address one of two deficiencies of Wang and Luo’s original
(crude) 2SFCA method: (1) accounting for distance decay
within a catchment; and (2) enabling variable catchment
sizes or variable application of distance-decay.
To date, most 2SFCA method improvements relate to the
addition of a distance-decay function, with a general
acceptance that its omission is highly problematic. This
paper provides the first evidence of the effect of applying
one of three related distance-decay functions, and most
significantly their application across large geographic
regions of both rural and metropolitan populations.
Despite some criticisms of the step-decay function having
a sudden drop in access at the edge of each zone, these
results showed relatively minor differences when
comparing the continuous and slow-zone functions,
particularly in more sensitive rural areas. A continuous-
decay function may intuitively be preferable to a step-
decay function, but it is difficult to define an appropriately
shaped function that matches ‘real’ behaviour of the
population (chiefly because of poor empirical evidence for
health care seeking behaviour). Figure 1 suggests that the
decay weighting of the tested continuous function may be
too slow, particularly for a distance barrier of 30–60
minutes. In contrast, the consequence of choosing a faster
step-decay function in rural areas has (perhaps wrongly)
increased the proportion of low-access scores within small
rural areas (<25K) and somewhat increased the
proportion of high access scores in larger rural areas (25-
100K).
Importantly, the application of any distance-decay
function without the simultaneous use of a variable
catchment size function creates a strong concentric
pattern of high to low access scores out through
metropolitan-fringe and into nearby rural areas. This
‘overcorrection’ in metropolitan-fringe areas can be
rectified by adding a variable catchment size function, so
that more realistic movements of these populations are
captured in the modelling. Furthermore, it is not clear that
distance / time barriers are viewed consistently by all
populations within different geographical settings, thus it
is questionable whether the same distance-decay function
would apply to all. For example, residents in isolated and
vastly settled areas are likely to have a higher ‘tolerance’
of travelling further to access services versus residents in
closely settled or largely populated areas.
The respective variable catchment size functions used by
either McGrail and Humphreys or Luo and Whippo
approach the problem from contrasting sides of access
calculation. McGrail’s method limits population
catchments (applied at Step 2) to the nearest 100
services (or minimum 10 minutes), whilst Luo’s method
limits service catchments (applied at Step 1) to the
nearest 250K residents (or minimum 10 minutes). Both of
these approaches have full effect in metropolitan areas,
no effect in rural areas and varying effect in metropolitan-
fringe and nearby rural areas. Luo’s use of a minimum
accessibility rule to define population catchment sizes
(applied at Step 2) is problematic in how effectively it
adjusts access scores. This was most apparent in
metropolitan-fringe areas, where access scores were
significantly lower using Luo’s method, but it is arguable
whether these populations would readily travel a small
distance further to access metropolitan-based services
areas, and so their access scores have been capped
inappropriately. McGrail’s approach to service catchments
(applied at Step 1) does not use a single size for all
populations, unlike Luo’s constant use of 250K, but
instead defines a set of four rules which account for
neighbouring populations and service competition. Whilst
these rules attempt to better match ‘real’ supply
behaviour, further independent assessment is required.
The key limitation to this study is the lack of available
empirical data on ‘real’ health service access behaviour
and its relationship to geography. The 2SFCA method
requires assumptions of catchment size, distance-decay
and the variable application of these across metropolitan
and rural populations; however, to date most applications
of the 2SFCA method have not been verified against
empirical access behaviour data. An additional related
limitation is that it’s not known whether this paper’s
findings (based on the state of Victoria, Australia) readily
translate to other geographical settings and countries.
Most academic papers describing methodological
developments or improvements such as those for the
2SFCA method underestimate the importance of the
specifics of the geography under consideration. One of the
difficulties of calculating spatial accessibility is modelling
across vastly different population densities and
dispersions. A key strength of the 2SFCA method is that it
can be readily applied to both metropolitan and rural
populations. However, this ‘flexibility’ can also be one of
its weaknesses when applied simultaneously across all
geographies. Catchment size or distance-decay rules that
readily apply in densely populated areas generally don’t
apply in sparsely populated areas, and vice-versa. For this
reason, the inclusion of a variable catchment size
methodology, which is missing from the new standard
E2SFCA method, is vital to the wider application of the
2SFCA method to health policies relating to healthcare
access and primary health care service provision. This
paper has provided further evidence relating to the
inclusion and choice of both a distance-decay function as
well as a variable catchment size function, highlighting in
particular that large scale applications of the 2SFCA
method require closer attention to their defining of
population and service catchments.
Competing interests
There are no competing interests.
Acknowledgements
The research reported in this paper is a project of the
Centre of Research Excellence (CRE) in accessible and
equitable primary health service provision in rural and
remote Australia funded by the Australian Primary Health
Care Research institute, which is supported by a grant
from the Commonwealth of Australia as represented by
the Department of Health and Ageing. The information
and opinions contained in it do not necessarily reflect the
views or policy of the Australian Primary Health Care
Research Institute or the Commonwealth of Australia (or
the Department of Health and Ageing). I would also like to
acknowledge the invaluable support from Emeritus
Professor John Humphreys, Monash University School of
Rural Health.
References
1.United Nations General Assembly:The universal declaration of human rights.[ http://www.un.org/en/documents/udhr/index/html webcite].
2.Grad FP: The preamble of the constitution of the World Health Organization.B World Health Organ 2002, 80:981-984.
3.Department of Health and Aged Care: Reforming the Australian health care system: the role of government. Canberra: DHAC; 1999.
4.President’s Commission for the study of ethical problems in medicine and biomedical and behavioral research: Securing access to health care: The ethical implications of differences in the availability of health services. Washington DC: President's Commission; 1983.
5.Aday LA, Andersen RM: Equity of access to medical care: a conceptual and empirical overview.
Med Care 1981, 19:4-27. PubMed Abstract | Publisher Full Text
6.Rogers A, Flowers J, Pencheon D: Improving access needs a whole systems approach.Br Med J 1999, 319:866-867. Publisher Full Text
7.Ansari Z: A review of literature on access to primary health care.Aust J Prim Health 2007, 13:80-95. Publisher Full Text
8.Gulzar L: Access to health care.J Nurs Scholarship 1999, 31:13-19. Publisher Full Text
9.Norris TL, Aiken M: Personal access to health care: a concept analysis.Public Health Nurs 2006, 23:59-66. PubMed Abstract | Publisher Full Text
10. Guagliardo MF: Spatial accessibility of primary care: concepts, methods and challenges.Int J Health Geogr 2004, 3:3. PubMed Abstract | BioMed Central F ull Text |PubMed Central Full Text
11. Wang F, Luo W: Assessing spatial and nonspatial factors for healthcare access: towards an integrated approach to defining health professional shortage areas.Health Place 2005, 11:131-146. PubMed Abstract | Publisher Full Text
12. Khan AA, Bhardwaj SM: Access to health care: a conceptual framework and its relevance to health care planning.Eval Health Prof 1994, 17:60-76. PubMed Abstract | Publisher Full Text
13. Penchansky R, Thomas JW: The concept of access: definition and relationship to consumer satisfaction.Med Care 1981, 19:127-140. PubMed Abstract | Publisher Full Text
14. McGrail MR, Humphreys JS: Measuring spatial accessibility to primary care in rural areas: improving the effectiveness of the two-step floating catchment area method.Appl Geogr 2009, 29:533-541. Publisher Full Text
15. Luo W, Wang F: Measures of spatial accessibility to health care in a GIS environment: synthesis and a case study in the Chicago region.Environ Plann B 2003, 30:865-884. Publisher Full Text
16. Langford M, Higgs G: Measuring potential access to primary healthcare services: the influence of alternative spatial representations of population.Prof Geogr 2006, 58:294-306. Publisher Full Text
17. World Health Organisation: Declaration of Alma-Ata. Geneva: WHO; 1978. [International conference on primary health care; Alma-Ata, USSR]
18. Starfield B, Shi L, Macinko J: Contribution of primary care to health systems and health.Milbank Q 2005, 83:457-502. PubMed Abstract | Publisher Full Text |PubMed C entral Full Text
19. Luo W: Using a GIS-based floating catchment method to assess areas with shortage of physicians.
Health Place 2004, 10:1-11. PubMed Abstract | Publisher Full Text
20. Bagheri N, Benwell GL, Holt A: Primary health care accessibility for rural Otago: “a spatial analysis”. Online: Health Care Inform Rev; 2006. PubMed Abstract | Publisher Full Text |PubMed Central Full Text
21. Brown SR: Are Oklahoma city residents ok? A socio-spatial analysis of physicians and supermarkets via accessibility and affordabilityPhD. Department of Geography: Oklahoma State University; 2011.
22. Langford M, Higgs G, Radcliffe J, White S: Urban population distribution models and service accessibility estimation.Comput Environ Urban 2008, 32:66-80. Publisher Full Text
23. McLafferty S, Wang F: Rural reversal? Rural–urban disparities in late-stage cancer risk in Illinois.Cancer 2009, 115:2755-2764. PubMed Abstract | Publisher Full Text |PubMed Central Full Text
24. Ngui AN, Apparicio P: Optimizing the two-step floating catchment area method for measuring spatial accessibility to medical clinics in Montreal.BMC Health Serv Res 2011, 11:166. PubMed Abstract | BioMed Central Full Text |PubMed Central Full Text
25. Mao K, Li M, Huang Q, Chen C, Hu W, Chen D: Evaluation of spatial accessibility to town and rural in a GIS environment: a case study of Dachang county. Shanghai, China: Institute of Electrical and

Electronics Engineers (IEEE); 2011. [19th International Conference on Geoinformatics]
26. Roeger LS, Reed RL, Smith BP: Equity of access in the spatial distribution of GPs within an Australian metropolitan city.Aust J Prim Health 2010, 16:284-290. PubMed Abstract | Publisher Full Text
27. Yang D-H, Goerge R, Mullner R: Comparing GIS-based methods of measuring spatial accessibility to health services.J Med Syst 2006, 30:23-32. PubMed Abstract | Publisher Full Text
28. Cervigni F, Suzuki Y, Ishii T, Hata A: Spatial accessibility to pediatric services.J Commun Health 2008, 33:444-448. Publisher Full Text
29. Liu Y, Wong SY, Jin T: Equality of spatial access to primary health services for Singapore’s baby boomers.Asian Popul Stud 2009, 5:171-188. Publisher Full Text
30. Bell S, Wilson K, Bissonnette L, Shah TI: Access to primary health care: Does neighborhood of residence matter?Ann Assoc Am Geog 2012.In Press
31. Bissonnette L, Wilson K, Bell S, Shah TI: Neighbourhoods and potential access to health care: The role of spatial and aspatial factors.Health Place 2012, 18:841-853. PubMed Abstract | Publisher Full Text

32. Dai D, Wang F: Geographic disparities in accessibility to food stores in southwest Mississippi.Environ Plann B 2011, 38:659-677. Publisher Full Text
33. Langford M, Fry R, Higgs G: Measuring transit system accessibility using a modified two-step floating catchment technique.Int J Geogr Inf Sci 2012, 26:193-214. Publisher Full Text
34. Luo W, Qi Y: An enhanced two-step floating catchment area (E2SFCA) method for measuring spatial accessibility to primary care physicians.Health Place 2009, 15:1100-1107. PubMed Abstract | Publisher Full Text
35. McGrail MR, Humphreys JS: The index of rural access: an innovative integrated approach for measuring primary care access.BMC Health Serv Res 2009, 9:124. PubMed Abstract | BioMed Central F ull Text |PubMed Central Full Text
36. Macinko J, Starfield B, Shi L: Quantifying the health benefits of primary care physician supply in the United States.Int J Health Serv 2007, 37:111-126. PubMed Abstract | Publisher Full Text
37. Gorey KM, Luginaah IN, Holowaty EJ, Fung KY, Hamm C: Associations of physician supplies with breast cancer stage at diagnosis and survival in Ontario, 1988 to 2006.Cancer 2009, 115:3563-3570. PubMed Abstract | Publisher Full Text |PubMed Central Full Text

38. Wang F: Measurement, optimization and impact of health care accessibility: a methodological review.Ann Assoc Am Geog 2012, 102:1104-1112. Publisher Full Text
39. Zhan Q, Wang X, Sliuzas R: A GIS-based method to assess the shortage areas of community health service — Case study in Wuhan, China. Nanjing, China: Institute of Electrical and Electronics Engineers (IEEE); 2011. [2011 International Conference on Remote Sensing, Environment and Transportation Engineering (RSETE)]
40. Wan N, Zhan FB, Zou B, Chow E: A relative spatial access assessment approach for analyzing potential spatial access to colorectal cancer services in Texas.Appl Geogr 2012, 32:291-299. Publisher Full Text
41. Wan N, Zou B, Sternberg T: A 3-step floating catchment area method for analyzing spatial access to health services.Int J Geogr Inf Sci 2012, 26:1073-1089. Publisher Full Text
42. Schuurman N, Berube M, Crooks VA: Measuring potential spatial access to primary health care physicians using a modified gravity model.Can Geogr 2010, 54:29-45. Publisher Full Text
43. Dai D: Black residential segregation, disparities in spatial access to health care facilities, and late-stage breast cancer diagnosis in metropolitan Detroit.Health Place 2010, 16:1038-1052. PubMed Abstract | Publisher Full Text
44. Luo W, Whippo TL: Variable catchment sizes for the two-step floating catchment area (2SFCA) method.Health Place 2012, 18:789-795. PubMed Abstract | Publisher Full Text
45. Humphreys J, Mathews-Cowey S, Weinand HC: Factors in accessibility of general practitioners in rural Australia.Med J Aust 1997, 166:577-580. PubMed Abstract
46. McGrail MR, Humphreys JS: A new index of access to primary care services in rural areas.Aust NZ J Pub Health 2009, 33:418-423. Publisher Full Text
47. Billi JE, Pai C-W, Spahlinger DA: The effect of distance to primary care physician on health care utilization and disease burden.Health Care Manage R 2007, 32:22-29. Publisher Full Text
48. Lerner EB, Moscati RM: The golden hour: scientific fact or medical “urban legend”?Acad Emerg Med 2001, 8:758-760. PubMed Abstract | Publisher Full Text
49. Humphreys JS, McGrail MR, Joyce CM, Scott A, Kalb G: Who should receive recruitment and retention incentives? Improved targeting of rural doctors using medical workforce data.Aust J Rural Health 2012, 20:3-10. PubMed Abstract | Publisher Full Text
50. McGrail MR, Humphreys JS: Geographical classifications to guide rural health policy in Australia.Aust NZ Health Policy 2009, 6:28. BioMed Central Full Text