Space Policies, Issues and Trends in 2016-2017 · Global Space Economy 13 ... appeared inevitable...
88
Report 63 September 2017 Cenan Al-Ekabi Space Policies, Issues and Trends in 2016–2017
Transcript of Space Policies, Issues and Trends in 2016-2017 · Global Space Economy 13 ... appeared inevitable...

Report 63 September 2017
Cenan Al-Ekabi
Space Policies, Issues and Trends in 2016–2017

ESPI Report 63 2 September 2017
Short title: ESPI Report 63 ISSN: 2218-0931 (print), 2076-6688 (online) Published in September 2017
Editor and publisher: European Space Policy Institute, ESPI Schwarzenbergplatz 6 • 1030 Vienna • Austria http://www.espi.or.at Tel. +43 1 7181118-0; Fax -99
Rights reserved – No part of this report may be reproduced or transmitted in any form or for any purpose without permission from ESPI. Citations and extracts to be published by other means are subject to mentioning “Source: ESPI Report 63; September 2017. All rights reserved” and sample transmission to ESPI before publishing.
ESPI is not responsible for any losses, injury or damage caused to any person or property (including under contract, by negligence, product liability or otherwise) whether they may be direct or indirect, special, incidental or consequential, resulting from the information contained in this publication.
Design: Panthera.cc

Space Policies, Issues and Trends in 2016–2017
ESPI Report 63 3 September 2017
Table of Contents
Introduction 5
1. Global Political and Economic Trends 6 1.2 Global Economic Outlook 6 1.2 Political Developments 6
1.2.1 Geopolitics 6 1.2.2 Environment 8 1.2.3 Energy 8 1.2.4 Resources 9 1.2.5 Knowledge 10 1.2.6 Mobility 11
2. Global Space Economy 13
2.1 Global Space Budgets and Revenue 13 2.2 Overview of Institutional Space Budgets 13 2.3 Overview of Commercial Space Markets 17
2.3.1 Satellite Services 17 2.3.2 Satellite Manufacturing 18 2.3.3 Launch Sector 19 2.3.4 Ground Equipment 21 2.3.5 Insurance Sector 22
2.4 Sectoral Overview 22 2.4.1 Launch Sector 22 2.4.2 Manufacturing Sector 26
2.5 International Sectoral Comparison 30 2.5.1 Launch Sector 30
2.6 State of the European Industry 41 3. Space Industry Evolutions 45
3.1 Europe 46 3.2 United States 49 3.3 Russia 52 3.4 Japan 52 3.5 China 53 3.6 India 53 3.7 Rest of the World 54
4. European Institutional Market 56
4.1 Civilian Space Expenditure 56 4.2 European Space Agency 57 4.3 EUMETSAT 60 4.4 National Agencies 62
4.4.1 France 62 4.4.2 Germany 63 4.4.3 Italy 63
4.5 European Union 63

ESPI Report 63 4 September 2017
5. The Defence Perspective 65 5.1 Trends in Military Expenditure 65 5.2 Europe 65 5.3 United States 66 5.4 Russia 67 5.5 China 67 5.6 Japan 68 5.7 India 68 5.8 North Korea 69
6. Space Policies and Strategies around the World 70
6.1 European Union 70 6.2 European Space Agency 71 6.3 EUMETSAT 72 6.4 National Governments 73
6.4.1 France 73 6.4.2 Germany 74 6.4.3 Italy 74 6.4.4 United Kingdom 75
6.5 United States 76 6.5.1 National Aeronautics and Space Administration (NASA) 76 6.5.2 National Oceanic and Atmospheric Administration (NOAA) 77
6.6 Canada 77 6.7 Russia 78 6.8 Japan 79 6.9 China 79 6.10 India 80
List of Acronyms 81
Acknowledgements 86
About the Author 86

Space Policies, Issues and Trends in 2016–2017
ESPI Report 63 5 September 2017
Introduction
When reading this issue of Space Policy, Issues and Trends it should be kept in mind that there are remarkable variations and lack of consistency in the publicly available figures on space activity. This is attributable to differing methodologies used by data providers, currency conversion issues, and time period variances. The lack of consistency starts at the very top, where there can be differences of tens of billions of Euros between estimates of the overall size of the global space economy; and it continues down to company-to-company comparisons, where different accounting practices produce different sums. But it is, of course, commonplace that differences in purchasing power in different economies, and differences in wage and infrastructure cost make one-to-one comparisons very difficult. Also, some countries are very restrictive in providing
institutional data, for instance on defence spending.
Notwithstanding the many data uncertainties, this issue of Space Policy, Issues and Trends identifies important trends and developments. As Winston Churchill noted, statistics must be taken with a grain of salt, yet purely by looking at relativities much can be learned.
This is not a reason to be complacent about the precision of figures. Space has great societal importance and the space community owes it to political decision makers to be able to provide standardised, accurate figures. In this aspect, the United States is clearly ahead of the game, and Europe must perhaps consider whether institutions such as Eurostat should not become more involved in data collection and processing for the space field.

ESPI Report 63 6 September 2017
1. Global Political and Economic Trends
1.2 Global Economic Outlook
The “World Economic Situation and Prospects” report is the United Nation’s lead publication in the annual discussion of current economic trends and prospects. In 2016, the global economy appeared stuck in a prolonged period of slow economic growth and dwindling international trade growth, with both rates at their lowest since the 2009 recession that followed the financial crisis. World Gross Product (WGP) had dropped to 2.2% in 2016, below the average rate of 2.5% since 2012, and well-below the 3.4% growth rate observed in the decade before the crisis, with the sluggishness characterized by diminished productivity growth, increased levels of debt, low commodity prices and continued conflict and geopolitical tensions.1
WGP growth in developed economies dropped to 1.5% in 2016 from 2.1% growth in 2015; moreover, growth in output was expected to remain below 2% for 2017 and 2018. In the Eurozone, new EU Members showed the most growth at 3.0%, while Western European economies continued with 1.7% for 2016; overall, growth in the European Union had decreased to 1.8% in 2016 from 2.2% in 2015, and it was expected to remain steady for the upcoming years. U.S. growth in global output dropped to 1.5% in 2016 from 2.6% in 2015, but was expected to increase to 1.9% in 2017 and 2.0% in 2018. Japan’s global output also increased by 0.5% in 2016, lowering by 0.1 from the 0.6% growth in output in 2015; its output growth was expected to increase to 0.9% for 2017 and 2018.2
Growth in transition economies declined for the second consecutive year, contracting by 0.2% in 2016 after a previous contraction of 2.8% in 2015, but was expected to increase by 1.4% in 2017 and 2.0% in 2018, driven mainly by increased performance in South-Eastern Europe. Developing economies
1 “World Economic Situation and Prospects 2017.” 17 Jan. 2017. United Nations 16 Mar. 2017 <https://www.un.org/development/desa/dpad/wp-con-tent/uploads/sites/45/publication/2017wesp_full_en.pdf>. 2 Ibid. at 3. 3 Ibid.
showed the most growth, increasing by 3.6% in 2016 and 3.8% in 2015; growth in output was expected to increase by 4.4% in 2017 and 4.7% in 2018. Developing economies have remained the fastest growing, driven mainly by India, China and other East and South Asian economies; African economies also continued to show positive growth, while South American economies continued to show weak performance for 2016.3
WGP was expected to increase by 2.7% in 2017 and 2.9% in 2018, due mainly to the stabilization from some short-term shocks that had restrained growth in 2016, such as the non-farm inventory destocking cycle and contractions in oil-related sector investment in the U.S. and sharp terms-of-trade shock experienced by commodities exporters. Rather than signalling a revival of the economy, as the factors underpinning sluggish economic growth tend to be self-reinforcing and will likely prolong the slowdown, this relatively low rate of growth risks hampering progress toward achieving the Sustainable Development Goals (SDGs) of the United Nations 2030 Agenda for Sustainable Development which aims to eradicate extreme poverty and create decent work for all.4
1 .2 Political Developments
1.2.1 Geopolitics
Several significant world events in 2016 are likely to continue into 2017.
On 23 June 2016, UK citizens voted to end the UK’s membership of the European Union (EU). Despite a narrow split where 51.9% of voters (mainly in rural parts of England and Wales) chose to leave, and 48.1% of voters (mainly Scotland and North Ireland) chose to remain5, and a November 2016 High Court ruling that the British Government must get Parliament’s approval before the ‘Brexit’ process could begin6, the UK’s separation from the EU seems
4 Ibid. at 1-38. 5 “EU Referendum – Results.” BBC News 17 Aug. 2017 <http://www.bbc.com/news/politics/eu_referendum/re-sults>. 6 Castle, Stephen, and Steven Erlanger. “‘Brexit’ Will Re-quire a Vote in Parliament, U.K. Court Rules.” 3 Nov. 2016.

Space Policies, Issues and Trends in 2016–2017
ESPI Report 63 7 September 2017
imminent. In order for the UK to withdraw from the EU, it must trigger Article 50 of the Treaty on European Union (TEU). Article 50 is triggered when an EU Member State has notified the European Council of its intent to leave, opening a two-year period in which a leaving agreement is negotiated setting out the arrangements for the withdrawal and outlining the UK’s future relationship with the EU.7 On 2 October 2016, Theresa May - who replaced David Cameron as Prime Minister when he stepped down the day following the Brexit vote – announced that she would trigger Article 50 by the end of March 2017.8 Britain's EU ambassador formally triggered the two year exit process on 29 March 2017.9
Donald Trump won the U.S. Presidential Election to become the 45th President of the United States. In an election race where it appeared inevitable that Hillary Rodham Clinton would easily sweep both the popular and electoral vote from the vitriolic Trump campaign, the turmoil that followed the hacking of the Democratic National Committee’s email systems by Russian intelligence groups in late-2015, and their release in mid-2016 via WikiLeaks mortally wounded the front-running candidate’s campaign. The FBI’s announcement that it was reopening and once again closing its investigation into Hillary Clinton’s poor handling of emails just days before the ballot served to reignite mistrust in the candidate. On 8 November 2016, Donald Trump won the electoral vote with 306 of the 538 votes available (270 votes are needed to win); Hillary Clinton had won the popular vote with a 48.5% share of the votes cast to Donald Trump’s 46.4% share of votes.10 In his campaign, Donald Trump promised to build a
The New York Times 17 Aug. 2017 <https://www.ny-times.com/2016/11/04/world/europe/uk-brexit-vote-parlia-ment.html>. 7 Article 50. Consolidated version of the Treaty on Euro-pean Union. OJ C 326, 26.10.2012, p. 13–390 <http://eur-lex.europa.eu/legal-content/EN/TXT/HTML/?uri=CELEX:12012M/TXT&from=EN>. 8 “Brexit: Theresa May to trigger Article 50 by end of March.” 2 Oct. 2016. BBC News 17 Aug. 2017 <http://www.bbc.com/news/uk-politics-37532364>. 9 “'No turning back' on Brexit as Article 50 triggered.” 30 Mar. 2017. BBCnews 5 Sept. 2017 <http://www.bbc.com/news/uk-politics-39431428>. 10 “Presidential Results.” CNN 17 Aug. 2017 <http://edi-tion.cnn.com/election/results/president>. 11 Lindsay, James M. “Ten Most Significant World Events in 2016.” 16 Dec. 2016. Council on Foreign Relations 17 Aug. 2017 <https://www.cfr.org/blog/ten-most-significant-world-events-2016>. 12 Darke, Diana. “Aleppo: Is besieged Syrian city facing last gasp?” 22 July 2016. BBC News 17 Aug. 2017 <http://www.bbc.com/news/world-middle-east-36853689>. 13 DeYoung, Karen. “United Nations: Aleppo faces wide-spread starvation without humanitarian aid.” 10 Nov. 2016.
wall on the U.S.-Mexican border, to pull out of major U.S. trade agreements, to review the benefit of the NATO alliance, and to take a tougher line with China and a softer line with Russia. Incidentally, the U.S. CIA and the FBI have concluded with ‘high confidence’ that Russian President Vladimir Putin had personally authorised the Kremlin operation to help elect Trump.11
In Syria, Bashar al-Assad’s regime, backed by Russian air support, Lebanese Hezbollah, and Iranian militia began launching an offensive operation against the rebel-held parts of the city Aleppo in June 2016.12 The rebels are supported by the U.S., Turkey, Saudi Arabia and other Gulf states. Despite a short-lived ceasefire attempt in September 2016, brokered by Russia and the U.S., the assault by Syrian and Russian forces continued, developing into a humanitarian crisis as humanitarian convoys could not deliver aid because of the danger and the inability to obtain simultaneous security guarantees from all sides.13 An evacuation deal was reached between Russia and Turkey by mid-December 2016, to remove the last remaining residents of the rebel-held parts of the city.14 Just days later, in what appeared to be a backlash against Russian military involvement in the Syrian civil war, and to disrupt the normalisation of Russian-Turkish relations, Russia’s ambassador to Turkey was assassinated by an off-duty Turkish police officer.15
North Korea conducted its fourth underground nuclear test on 5 January 2016, claiming to have detonated its first hydrogen bomb16; its fifth underground nuclear test took place on 8 September 2016.17 In April 2016, it test-fired
The Washington Post 17 Aug. 2017 <https://www.washing-tonpost.com/world/national-security/united-nations-aleppo-faces-widespread-starvation-without-humanitarian-aid/2016/11/10/883b2d28-a77a-11e6-ba59-a7d93165c6d4_story.html>. 14 Hubbard, Ben and Hwaida Saad. “Aleppo Evacuation Ef-fort Restarts, and Assad Calls It History in the Making.” The New York Times 17 Aug. 2017 <https://www.ny-times.com/2016/12/15/world/middleeast/aleppo-syria-evac-uation-deal.html>. 15 Walker, Shaun, Kareem Shaheen, Martin Chulov, and Patrick Wintour. “Russian ambassador to Turkey shot dead by police officer in Ankara gallery.” 20 Dec. 2016. The Guardian 17 Aug. 2017 <https://www.theguard-ian.com/world/2016/dec/19/russian-ambassador-to-turkey-wounded-in-ankara-shooting-attack>. 16 Sanger, David E. and Choe Sang-Hun. “North Korea Says It Has Detonated Its First Hydrogen Bomb.” 5 Jan. 2016. The New York Times 17 Aug. 2017 <https://www.ny-times.com/2016/01/06/world/asia/north-korea-hydrogen-bomb-test.html>. 17 Forsythe, Michael. “North Korea’s Nuclear Blasts Keep Getting Stronger.” 9 Sept. 2016. The New York Times 17 Aug. 2017 <https://www.ny-times.com/2016/09/10/world/asia/north-korea-nuclear-weapons-tests.html>.

ESPI Report 63 8 September 2017
a ballistic missile from a Sinpo-class subma-rine, and conducted three failed launches of its Musudan which could be capable of reaching U.S. military bases as far as Guam. The uptick in activities led U.S. and South Korean intelli-gence officials to conclude that North Korea was now able to mount nuclear warheads on short- and medium-range missiles that would be capable of hitting Japan and South Korea.18 In June 2016, North Korea successfully test launched an intermediate-range ballistic mis-sile into high altitude; it was followed by the successful test of a submarine launched ballis-tic missile on 23 August 2016; just two days after the United States and South Korea began their annual joint military exercises. The threat posed to the region by North Korea’s nuclear program combined with its gradually increasing missile technology motivated the U.S. and South Korea to deploy the American-built Terminal High Altitude Area Defense (THAAD) system in South Korea by the end of 2017; while the move will likely to be wel-comed by Japan’s strategic interests, it will be vigorously protested by China.19
1.2.2 Environment
The Paris Agreement aims to keep global average temperature increases to below 2°C above pre-industrial levels, and to make more ambitious efforts to limit temperature increases even further to 1.5°C and eliminate the increase of greenhouse gas emissions in the second half of the century.20 Following its creation in the 21st UN Framework Convention on Climate Change Conference of Parties (UN FCCC/COP), it rapidly entered into force amid uncertainties brought on by the United States presidential election which threatened to undo the global initiative on combating climate change. The Paris Agreement entered into force on 4 November 2016, triggered by the ratification of the European Union on 5 October 2016, which met the threshold that at least 55 Parties, accounting for at least an estimated 55% of total global greenhouse emissions, ratify the instrument. China and the United States, representing nearly 40% of global greenhouse gas emissions, ratified the
18 Sanger, David E. and Choe Sang-Hun. “As North Ko-rea’s Nuclear Program Advances, U.S. Strategy Is Tested.” 6 May 2016. The New York Times 17 Aug. 2017 <https://www.nytimes.com/2016/05/07/world/asia/north-ko-rea-nuclear-us-strategy.html>. 19 Sang-Hun, Choe. “North Korea Test-Fires Missile From Submarine.” 23 Aug. 2016. The New York Times 17 Aug. 2017 <https://www.ny-times.com/2016/08/24/world/asia/north-korea-submarine-missile.html>. 20 “The Paris agreement marks an unprecedented political recognition of the risks of climate change.” 12 Dec. 2015. The Economist 24 June 2016 <http://www.econo-mist.com/node/21683990/>.
Paris Agreement in September of 2016, fol-lowed by India at the beginning of October 2016.21 And while Russia has yet to ratify the Paris Agreement, 121 Parties to the UN FCCC/COP representing more than 79% of global emissions had ratified the Paris Agreement by the end of 2016.22
The 22nd UN FCCC/COP, took place in Marrakech, Morocco from 7 to 18 November 2016.23 The event also served as the first meeting of the governing body of the Paris Agreement (CMA), and marked the beginning of the Paris Agreement’s implementation phase, following years of negotiation. Despite its rapid entry into force, in order for the Paris Agreement to be fully operational, its Parties’ first need to elaborate and adopt decisions on a wide range of topics including mitigation (e.g. nationally determined contributions (NDCs)), adaptation communications, finance, transparency, “global stocktake”, and market and non-market mechanisms; they aim to do so by 2018, ahead of the 2020 timeline from which the agreement was intended to begin. Developed countries also released a roadmap for obtaining $100 billion per year in climate funding by 2020; with estimates by the UN FCCC reaching $741 billion for 2014. The 23rd UN FCCC/COP will be held from 6 to 17 November 2017 in Bonn, Germany.24
1.2.3 Energy
With the Paris Agreement on climate change having entered into force in November 2016, renewable energy is expected to lead the transformation of the power sector to the promise of low-carbon energy production. The energy sector currently accounts for at least two-thirds of greenhouse gas emissions; however by 2015, growth in energy-related carbon-dioxide emissions had stalled completely, thanks to gains in energy efficiency and the expanded use of renewables and other clean energy sources worldwide. Energy demand is expected to grow by 30% to 2040, with demand declining in OECD countries, and shifting toward increased growth in India, Southeast Asia, China, and other non-OECD countries in Africa, Latin
21 “Paris Agreement - Status of Ratification.” United Na-tions Framework Convention on Climate Change 28 Apr. 2017 <http://unfccc.int/paris_agreement/items/9444.php>. 22 “COP 22 Summary Report.” 20 Nov. 2016. IETA 28 Apr. 2017 <http://www.ieta.org/re-sources/UNFCCC/COP22/COP22WRAP_FINAL.pdf>. 23 “OUTCOMES OF THE U.N. CLIMATE CHANGE CONFERENCE IN MARRAKECH | 22nd Session of the Conference of the Parties to the United Nations Frame-work Convention on Climate Change (COP 22) November 7-18, 2016.” 18 Nov. 2016. Centre for Climate and Energy Solutions 28 Apr. 2017 <https://www.c2es.org/interna-tional/negotiations/cop22-marrakech/summary>. 24 Ibid.
Space Policies, Issues and Trends in 2016–2017
ESPI Report 63 9 September 2017
America, and the Middle East. To meet the growing demand, an estimated $67 trillion will need to be invested in the energy sector by 2040, with $44 trillion needed for the global energy supply and $23 trillion for improvements in energy efficiency. It should be noted that 60% of the $44 trillion would go toward oil, gas and coal extraction (down from 70% of total supply investment between 2000 and 2015), while nearly 20% will go toward renewable energies, and the rest likely toward nuclear energy. Yet even with intensive efforts to meet growing energy demand, more than 500 million people, mainly in rural areas of Sub-Saharan Africa, are expected to remain without basic energy services in 2040.25
Whereas the consumption of all modern fuels is expected to increase into 2040, oil and natural gas will remain the bedrock of the global energy system for many decades to come. While oil markets are currently in a downturn due to greater global production, the recent drop in upstream spending on new crude oil resources could affect the rhythm of the oil market in the early 2020s, as the lead times from investment to first oil are typically between 3 and 6 years. Over the long term, global oil demand will be concentrated in freight, aviation, and petrochemical products which have few alternatives, with supply increasingly concentrated in the Middle East, while the largest source of future demand growth will likely come from India, followed by China. The demand for natural gas is expected to increase by 1.5% annually from 2015 to 2040, with consumption increasing almost everywhere, except for Japan where it is expected to decrease with the reintroduction of nuclear power. The largest sources of growth in demand for natural gas are China and the Middle East, but there remains a question of how the global market for gas will rebalance in light of the current surplus and as new capacity is developed in the U.S, East Africa, and Australia which could bring tighter markets in the 2020s.26
Growth in coal demand essentially plateaued amid environmental concerns in 2015, and its use is expected to decline to 2040. In this light, to return to market equilibrium, cuts to the supply capacity will be needed for coal, particularly in China and the United States. While nearly 75% of China’s power generation comes from coal, almost all growth in its power demand has come from other sources; its use of coal will drop to less than 45% by
25 “International Energy Agency. World Energy Outlook 2016 – Executive Summary” 16 Nov. 2016. IAE 30 Mar. 2017 <http://www.iea.org/Text-base/npsum/WEO2016SUM.pdf>. 26 Ibid. 27 Ibid.
2040. India is the second-largest coal pro-ducer in the world, after China; currently 75% of its power generation comes from coal – which is expected to drop to 55% by 2040. And while the European Union and the United States together account for around one-sixth of current global coal use, coal demand is expected to fall by over 60% and 40%, respectively, between 2015 and 2040; with mostly flat or declining overall energy needs as large strides are made in displacing coal with low-carbon alternatives.27
1.2.4 Resources
International trade continued to decelerate in 2015, lowering to a rate of around 1.5%, from about 2.3% in 2014. The situation worsened to 1.2% in 2016, as a result of a further slowdown in the first quarter of the year.28 The slowed growth in 2015 was primarily due to lacklustre performance in merchandise trade, which dropped by 12.7% due to continuing commodity price declines in addition to currency fluctuations that favoured the U.S. dollar. Moreover, global output growth in 2016 was also expected to decrease to about 2.3%, from 2.5% in 2015 and 2014; still well below the 4.0% growth posted in the years prior to the financial crisis.29 The decelerated growth reflected a continued contraction in import volume demand, especially in transition economies and several developing economies in Asia and Latin America. Meanwhile, the appreciated U.S. dollar muted positive values in export volume demand in Europe and Asia which trade in their own currencies.
Developed economies showed an uptick in both the volume of imports and exports, measuring 3.3% and 2.2% respectively in 2015. The EU showed growth in imports at 3.6%, owing to rising household consumption; moreover, its exports also increased to 3.2%, resulting from an acceleration of trade within the continent and other developed regions, while exports to transition economies and developing countries, including China, seemed subdued. The volume of imports to the U.S. increased by 4.8%, while its exports contracted by 0.2%, due to slow external growth and the increasing value of the dollar. However, Japan’s imports and exports de-creased by 2.8% and 1.0% respectively, due mainly to domestic factors and to weak de-mand from its developing country neighbours. By contrast, import volumes in transition
28 World Economic Situation and Prospects. “Fact Sheet.” 17 Jan. 2017. United Nations 16 Mar. 2017 <https://www.un.org/development/desa/dpad/wp-con-tent/uploads/sites/45/publication/2017wesp_fact-sheet.pdf>. 29 According to the latest data available from UNCTAD.

ESPI Report 63 10 September 2017
economies dropped once again by 19.4% in 2015, from the 7.6% decrease in 2014, due to steep currency depreciations, inflation and re-cession, while export volumes again showed stunted growth at 0.9%, due to the drop in the global prices of oil, gas, and minerals. Devel-oping economies also continued to slow down in aggregated growth of both imports and ex-ports, except South Asia whose volume of im-ports departed from the downward trend; here, China’s contraction in both the volume of imports and exports weighed heavily on trade flows within the region, as it is the larg-est export market for key manufacturing econ-omies in Asia. For 2015, developing countries’ growth in the volume of imports fell to 0.4% from 2.5% in 2014, while the volume of ex-ports fell to 0.4% in 2015, from 3.1% in 2014.30
According to the United Nations Conference on Trade and Development (UNCTAD), while commodity prices experienced declines in all group categories, decreasing by 36.7% in 2015, its largest contraction was in crude oil which decreased by 47.2%; yet by the first half of 2016 there were signs that the down-ward trend had abated somewhat, decreasing by 14.5% and 23.6% respectively. Crude oil prices had bottomed at $30.8 per barrel at the start of 2016, but recovered in the following months reaching $50 per barrel by mid-year. The plunge in prices was attributed to greater global production stoked by several OPEC countries (including Iran which recently re-turned to the world oil markets eager to reach its pre-sanction production levels) in response to increased production by the U.S.. The price of oil began to increase in the first quarter of 2016, following financial difficulties and in-creased bankruptcies for many producers the U.S. which reduced production levels, in addi-tion to unplanned supply disruptions in Can-ada, Ghana, and Nigeria. While the Brent price of oil per barrel increased to $54 per barrel by the end of 2016, the average price for 2016 was $44.0 per barrel, or $8 lower than the 2015 average.31
Low oil prices also had an effect on the prices of non-oil commodities, such as in reducing transportation and fertilizer prices, in addition to becoming more competitive with biofuels. Agriculture markets were still mainly deter-mined by their own supply situation and
30 United Nations Conference on Trade and Development. Trade and Development Report, 2016. Geneva: UNCTAD, 2016. 1-26. 31 “Crude oil prices increased in 2016, still below 2015 av-erages.” 4 Jan. 2017. U.S. Energy Information Administra-tion (EIA) 9 Jan. 2017 <http://www.eia.gov/to-dayinenergy/detail.php?id=29412>. 32 United Nations Conference on Trade and Development. Trade and Development Report, 2016. Geneva: UNCTAD, 2016. 1-26.
weather conditions. The El-Niño phenomenon affected some food commodities in Africa and Asia which heightened concerns over food prices and food security in those regions; how-ever, a plentiful supply of agricultural products resulted in production exceeding consumption prevented a significant impact on most agri-cultural prices in 2015. The price of metals, ores, and minerals also continued to fall, de-creasing by 22.0% in 2015, after an 8.5% re-duction in 2014; the trend looked set to con-tinue into 2016, showing an 11.4% reduction by mid-year. Phosphate rock, a key compo-nent in the production of phosphate fertilizers for agriculture, was the only outlier to increase in price, rising by 6.5% in 2015; its price has decreased by 1.7% as at mid-2016.32 Lastly, the price for gold and silver was on the up-swing for 2016, increasing by 7.6% and 8.9% respectively, while the price of platinum con-tinued its decrease by 6.3% for the year; yet the price for each of these precious metals ap-peared to be contracting in the final quarter of 2016.33
1.2.5 Knowledge
By now the advantages of higher education should be seen as worth the effort as employ-ment rates and earnings tend to increase as an adult’s level of education and skills in-creases; moreover, the labour market still re-gards a diploma or degree as the primary in-dication of a worker’s skills. For Europe, the expansion of its pool of highly skilled and spe-cialised scientists and professionals should be a constant priority if it is to remain a leading actor in the field of space-related scientific and technological R&D. By 2016, the percentage of the European34 working age population be-tween 25-to-64 years of age with a higher ed-ucation degree remained at 32%, nestled be-tween the OECD average of 35% and the 30% average of G20 members; in contrast, 45% of the working age population in the U.S., and 55% in Canada, have a higher education de-gree.35 In Europe, Finland, Ireland, Norway, and the UK share the top spot, each with 43%, well above the OECD average, followed by Switzerland, Luxembourg, Sweden, Estonia, Belgium, and Denmark; the Netherlands and Spain meet the OECD average, while the re-maining European countries under considera-tion were below that average. It should be
33 World Bank Commodity Price Data (The Pink Sheet). 4 Jan. 2017. World Bank Group 9 Jan. 2017 <http://pub-docs.worldbank.org/en/151321483568157298/CMO-Pink-Sheet-January-2017.pdf>. 34 i.e. not including Bulgaria, Cyprus, Malta, Lithuania, Ro-mania, and Croatia. 35 OECD. Education at a Glance 2016: OECD Indicators, OECD Publishing, 2016: 42 <http://download.ei-ie.org/Docs/WebDepot/EaG2016_EN.pdf>.

Space Policies, Issues and Trends in 2016–2017
ESPI Report 63 11 September 2017
noted that the percentage of Europeans be-tween 25-to-34 years of age with a higher ed-ucation degree in the Czech Republic, Ger-many, Hungary, Italy, Portugal, and Slovakia continues to fall behind the OECD average.36
According to the OECD, the enrolment rate of 20-to-24 year-olds in tertiary education has increased on average from 29% to 33% in the past decade across OECD countries. But while tertiary attainment is likely to continue rising, on average most students (69%) are taking longer than envisaged to graduate at least one tertiary degree before the age of 30.37 This can be partly attributed to the fact that labour market demand for skills is changing much faster than education patterns, requiring youth to stay in school longer to acquire higher skills for complex jobs. According to the Euro-pean Centre for the Development of Vocational Training, growth in employment in Europe will only reach pre-financial crisis levels by 2019; however, growth in employment from 2020-2030 is expected to be weaker than in the pre-crisis period, offset by the need to replace the ageing workforce. The strongest growth in employment near the end of this period is ex-pected to be in Belgium, Cyprus, Iceland, and Ireland, while Germany, Estonia, Latvia, Po-land, and Romania are expected to show a slight decrease in job growth.38
About 85% of all the job openings over 2015-2025 will come from the need to replace work-ers leaving an occupation. Yet overall in-creases in both process complexity and the number of highly qualified students entering the labour force will lead to a decline in de-mand for low qualifications and the increased risk of skill mismatch. The employment of highly-skilled workers in all occupations in Eu-rope is expected to increase to 38% in 2025 from 32% in 2015. However, some highly skilled labour will have no alternative than to take up jobs that have typically not required such high formal qualifications in the past. For instance, taking elementary occupations as an example, by 2025 the share of employees with low qualifications will fall to 33% from 44% in 2015, whereas the share of high skilled em-ployees working in occupations that typically demand lower levels of skills will grow to 14% from 8% in 2015.39
1.2.6 Mobility
Maritime transport is the most commonly used form of transport for international trade, ac-counting for about 80% of global merchandise 36 Ibid. at 43. 37 Ibid. at 30. 38 “Future skill needs in Europe: critical labour force trends.” 16 Dec. 2016. CEDEFOP 8 May 2017 <http://www.cedefop.europa.eu/files/5559_en.pdf>.
trade by volume; and in terms of value, ob-servers estimate the share of maritime trade to be somewhere between 55% and just over 66% of total merchandise trade.40 Maritime trade volumes expanded by 2.1%, exceeding 10 billion tons in 2015; however, while the recorded volume was unprecedented, the pace of growth was notably lower than the historical average of 3.0% since 2007. Growth in mari-time trade is expected to increase marginally in 2016. Between 2015 and 2016, the world order book continued to decline for most ves-sel types except for container ships, remaining far below the order peak of 2008–2009. Dur-ing the 12 months to 1 January 2016, the global fleet of vessels increased by 3.48%, marking the lowest rate of growth since 2003; but with the supply of vessels increasing faster than demand, there is a continued state of overcapacity. As at 1 January 2016, the global commercial fleet consisted of 90,917 vessels, an increase of 1.6% from the 89,464 vessels at the beginning of 2015. Dry-bulk carriers ac-counted for 43.1% share of the world fleet ca-pacity measured in terms of dead-weight tons, a decrease from its 43.6% share in 2015. The relative share of oil tankers decreased to 27.9% of the world fleet from 28.0% in 2015. Container vessels increased to 13.5% from 13.1% in 2015, while general cargo vessels re-mained at 4.2% in 2016, on par with the pre-vious year’s share. Moreover, the number of ships sold for demolition increased by 2.9% to 23,037 in 2015 from 22,394 in 2014. Once again, dry-bulk carriers accounted for the most tonnage sold for demolition, accounting for 73.0% in 2015 from 40.6% in 2014; mean-while, the share of container ships and oil tankers halved and quartered respectively, reaching 9.9% and 5.1% in 2015. Lastly, al-most all of the known ship demolitions in 2015 took place in Asia, with over 93% occurring in India, Pakistan, and China.41
Supply chain security is another challenge for the maritime industry, as there is heightened exposure and vulnerability to piracy, armed robbery, and other crimes. Between 1984 and the end of 2015, the number of incidents of piracy and armed robbery against ships to-talled 7,346 worldwide. While in the past, con-cern over supply chain security was localized to piracy incidents near East Africa, including Somalia’s coastal line, the Gulf of Aden and further in the Indian Ocean, the growth of pi-racy incidents in Asian waters has transformed the issue into a cross-sectoral global challenge capable of impacting regional economies and
39 Ibid. 40 United Nations Conference on Trade and Development. Review of Maritime Transport 2016. Geneva: UNCTD, 2016. 6. 41 Ibid. at 29-50.

ESPI Report 63 12 September 2017
global trade. In 2015, there were 303 reports of piracy and armed robbery against ships, a modest increase of 4.1% from the 291 inci-dents reported in 2014. The narrow Straits of Malacca and Singapore were the most affected with 134 incidents (44.2%), followed by the South China Sea with 81 (26.7%), the West-ern Indian Ocean with 38 (12.5%), West Africa with 35 (11.6%), and the remainder occurring near the Americas or in more temperate wa-
ters. And while the number of incidents by So-mali-based pirates in the Arabian Sea in-creased to 15 from 12 in 2014, they were not successful in hijacking a ship in 2015. In total, 5 ships were hijacked in 2015, a notable de-crease from the 21 ships hijacked in 2014. However, as ships increasingly rely on soft-ware, the internet and other technologies, they might become more vulnerable to current and emerging cyberattacks in the future.42
42 Ibid. at 93-94.

Space Policies, Issues and Trends in 2016–2017
ESPI Report 63 13 September 2017
2. Global Space Economy
Chapter 2 covers the 2016 public budgets and commercial revenue related to space activity. There will be a brief discussion of space related public budgets and commercial revenue with a quantitative assessment of the overall market value and financial performance of space ac-tivities in the last 12 months.
In the absence of internationally uniform standards, developing an accurate estimate of financial and market figures of global space activities is a complicated task, especially when considering that most countries and space research institutions adopt their own distinct methods of categorising and distrib-uting funding for space activity. Likewise, the lack of transparency in certain government space programmes, e.g. military space pro-jects, further complicates calculations. And an additional degree of distortion is introduced by floating currency exchange rates, as all num-bers are reflected in terms of U.S. dollars. Moreover, commercial companies publish their financial figures regularly, but not in a uniform and synchronised way that would allow direct horizontal industry comparisons.
2.1 Global Space Budgets and Revenue
From the Space Report 2017, total govern-ment space expenditure was $76.42 billion in 2016, slightly below the $76.52 billion spent in 2015 – the reduction can be partly explained by a slight decrease in total U.S. spending in civil and military space programmes, and by weak currency exchange rates which mask the fact that most other government space budg-ets increased from 2015.43 Total government expenditure for civil space programs grew by 2.5% to $43.42 billion from $42.37 billion in 2015.44 On the other hand, Euroconsult esti-mates that government spending in space pro-grams reached $62.2 billion in 2016, i.e.
43 The Space Report 2017. Colorado Springs: The Space Foundation, 2017: 4. 44 Ibid. 45 “Government Spending in Space Programs Reaches $62 Billion in 2016.” 30 May 2017. Euroconsult 22 Aug. 2017 <http://www.euroconsult-ec.com/30_May_2017>.
slightly less than the spending recorded in 2015.45 Around 65% of that government spending went toward civil programs, about $39.34 billion, while 35% went to defence pro-grammes; the share of spending on civil pro-grammes has continued to grow as a propor-tion of global expenditures in recent years.46
The Space Report 2017 noted that the total revenue of commercial satellite services, in-cluding telecommunications, Earth observa-tion and positioning services, marginally in-creased by 0.23%, to $126.62 billion in 2016 from $126.33 billion in 2015. However, reve-nue from space-related commercial infrastruc-ture, including manufacturing of spacecraft and in-space platforms, launch services as well as ground equipment increased by 5.14% to $126.26 billion in 2016 from $120.09 billion in 2015; the growth was mainly driven by the sale of GNSS receivers. Here, total commercial space revenue decreased by 2.6% to $252.88 billion in 2016 from 246.42 billion in 2015.47 The following section provides a more detailed analysis of institutional budgets.
2.2 Overview of Institutional Space Budgets
From the Space Report 2017, total institu-tional spending on space programs in 2016, including that of intergovernmental organisa-tions, stayed level with $76.42 billion from $76.52 billion in 2015. While the U.S. institu-tional space budget decreased slightly to $44.44 billion from $44.57 billion in 2016, non-U.S. institutional spending increased by 0.1% to $31.98 billion from $31.95 billion in 2015; this increase was masked by negative dollar exchange rates for a second year.48 Around 56.8% of the total institutional space expenditure went toward civil expenditure ($43.43 billion), while 43.2% of the spending went to defence expenditure ($33.00 billion),
46 Smith, Andrew. “Euroconsult: Government Spending in Space Programs Reaches $62 Billion in 2016.” 30 May 2017. PRWeb 21 Aug. 2017 <http://www.prweb.com/re-leases/2017/05/prweb14377281.htm>. 47 Ibid. 48 Ibid. at 15.
ESPI Report 63 14 September 2017
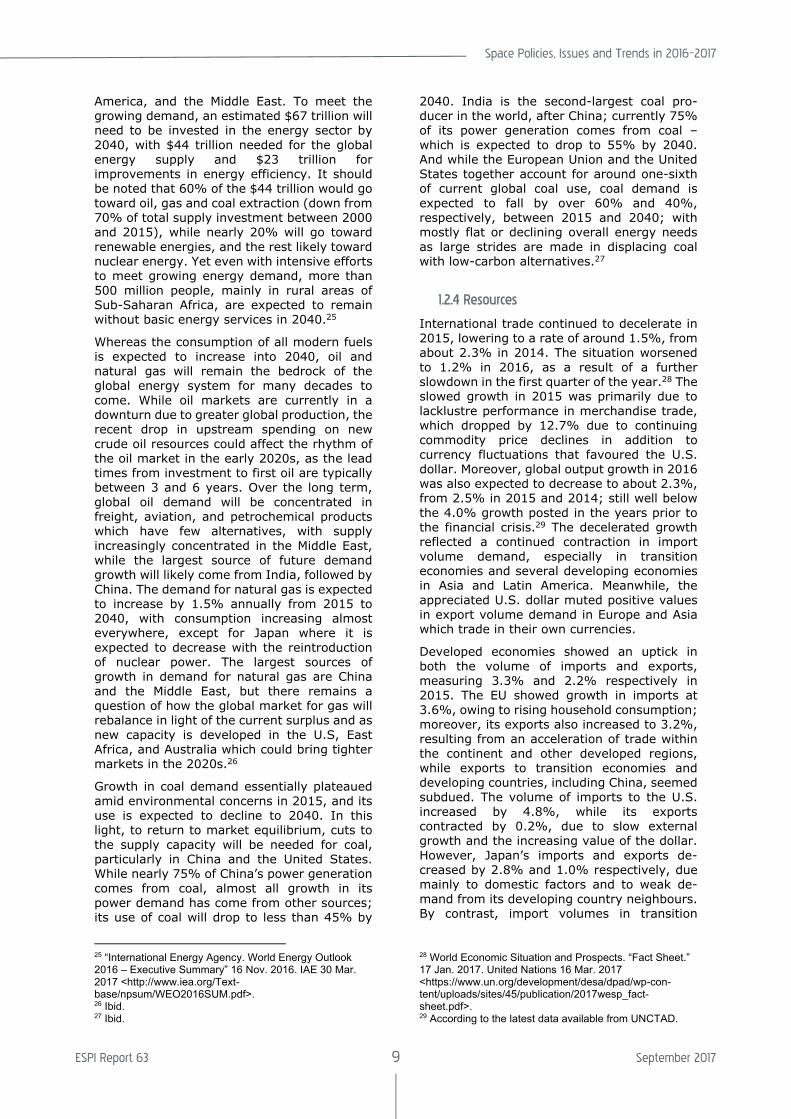
Figure 2.1: Public space budgets of major space powers in 2016 (Based on Space Report 2016 and Euroconsult data).
a slight increase in the amount of civil space spending compared to defence in 2015.49
The Space Report 2017 also estimates that worldwide defence related expenditure dropped to $33.00 billion in 2016. Here, the United States accounts for 66.7% (or an esti-mated $22.00 billion) of space security pro-grammes under its Department of Defence (DoD). The U.S. DoD’s space budget funds its military space programmes, in addition to or-ganisations such as the National Reconnais-sance Office (NRO) and the National Geospa-tial-Intelligence Agency (NGA). Defence spending by non-U.S. government space ac-tors accounted for the remaining 33.3% (or $11.00 billion), a slight increase from 2015; this increase was also masked by negative dol-lar exchange rates.50 Moreover, there is a de-gree of uncertainty regarding expenditures on defence space activities as not all relevant funding is made public.
The following diagrams present a relative pic-ture of the space sector. They should be viewed holistically, and compared to each other as a single diagram may not reflect the real output of spacefaring countries.
While spending among space actors saw sig-nificant changes in 2016, they should not be
49 Ibid. 50 Ibid. 51 N.B.: Figures in this section are based on the Space Re-port 2017 data (USA, China, Russia, Japan, India and South Korea), while all other values in Figure 2.1 come from the Euroconsult Government Space Programs. More-
ranked against each other given the fluctua-tions in currency exchange rates as these budgets are converted to U.S. dollars (Figure 2.1).51 The United States continued to have the largest space budget, increasing its civilian space spending to $22.444 billion, while de-creasing its defence spending to an estimated $22.000 billion. China’s space budget is the second largest, and is likely larger than the modest estimate of 28.7 billion Yuan ($4.22 billion), if China’s spending matched the aver-age expenditure of 0.039% of GDP on space activities, not including the U.S. or Russia, ac-cording to the Space Report 2017.52 Japan’s space budget was ¥332.4 billion ($3.236 bil-lion), followed by France and Germany. Next, as Russia’s economic crisis continued into 2016, its space budget contracted 104.500 bil-lion roubles ($1.630 billion); India followed with a revised budget of $1.192 billion (80.45 billion rupees).53
ESA’s budget was not included within these figures, as the contributions of individual ESA Members was included in their own budgets. Nevertheless, ESA’s 2016 budget increased by 18.4% to €5.250 billion ($5.820 billion) from €4.433 billion ($4.944 billion) in 2015, follow-ing an additional 28.6% increase in EU
over, the different currencies in other sections of this chap-ter were not converted to a baseline currency (except for comparison purposes) as recent currency fluctuations skewed the changes in the spending by other countries. 52 The Space Report 2017. Colorado Springs: The Space Foundation, 2017: 10. 53 Ibid.

Space Policies, Issues and Trends in 2016–2017
ESPI Report 63 15 September 2017
Figure 2.2: Public space budgets (selection) as a share of nom. GDP in 2016 (source: The Space Report/Euroconsult/IMF)
spending. ESA member state spending in-creased by 15.4% in 2016, reaching €3.740 billion ($4.15 billion) from €3.241 billion ($3.61 billion) in 2015.54 Among ESA member states, the five biggest contributors to the to-tal ESA budget remained in the same positions as in 2015, with Germany 16.6%, France 16.1%, Italy 9.8%, the UK 6.2%, and Belgium 3.6%. Spain was the next highest contributor at 2.9%, followed closely by Switzerland at 2.8% for seventh position in the 2016 budget.55
Additional perspective can be gained by meas-uring the investment of countries in the space sector with regard to GDP generated in 2016 (Figure 2.2).
The U.S. remained in the front position in space spending as a share of GDP in 2016, alt-hough its spending decreased to 0.2393% from 0.2483% in 2015. Luxembourg entered into second position in terms of spending as a share of its GDP, reaching 0.1312% from 0.0488% in 2015; this follows Luxembourg’s strategy to invest several hundred million euro in space mining ventures. Russia followed close behind in third position, dropping to 0.1273% from 0.2259% in 2015. France moved to the fourth position, while increasing its spending as a share of its GDP to 0.1133%
54 “ESA Budget 2016.” 20 Jan. 2016. ESA 9 Aug. 2017 <http://www.esa.int/spaceinimages/Im-ages/2016/01/ESA_budget_2016>.
in 2016. Japan came next with 0.0655%, fol-lowed by Germany with 0.0572%, India with 0.0528%, and Italy with 0.0511% in space spending as a share of GDP in 2016. Other leading space countries in Europe and the rest of the globe invested less than 0.0500% of their GDP in space activity, while the European Union overall spent an estimated 0.0118% of its GDP on space.
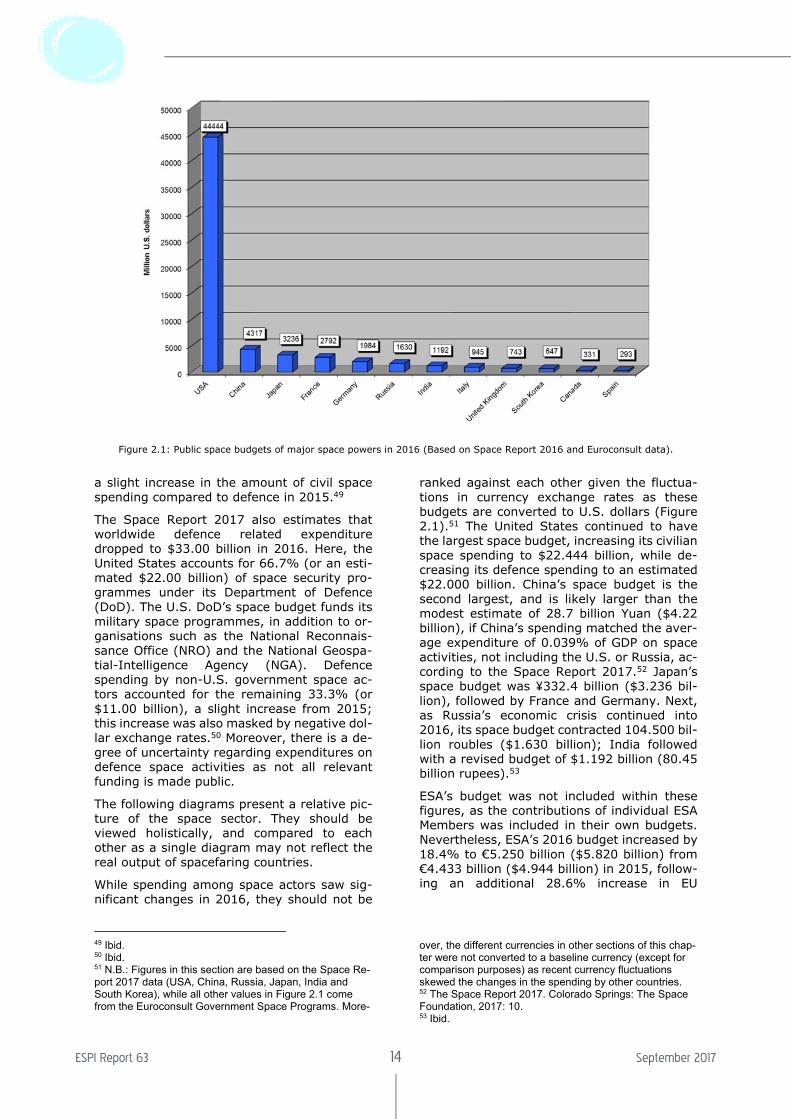
Looking at space spending in terms of per cap-ita investment provides a different picture. Here, the U.S. is again in first position, how-ever its spending decreased by 1.1% to $137.22 in 2016 down from $138.75 in 2015. Luxembourg, with its increased space start-up investment in 2016 entered into second posi-tion, more than doubling its per capita space spending to $130.00 in 2016 from $46.67 in 2015. France came in third place in per capita expenditure, which increased to $43.22 in 2016; it was followed by Japan with $25.83, Germany with $24.02, Switzerland with $22.26, Norway with $20.58, and Belgium with $20.44. While per capita space spending increased among most space actors in 2016, it decreased in Russia, Canada, Finland, the UK, Sweden, and the United States.
55 Ibid.
ESPI Report 63 16 September 2017
Figure 2.3: Public space budgets per capita (selection) in 2016 (source: The Space Report/Euroconsult/PRB)
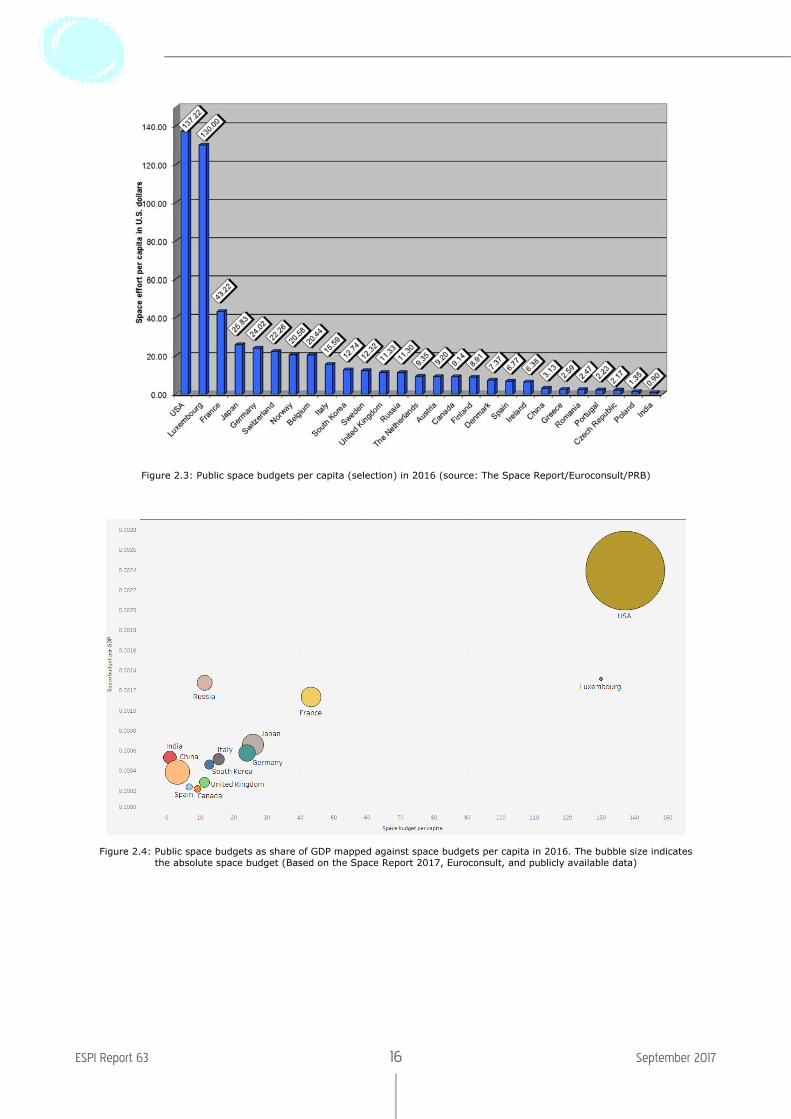
Figure 2.4: Public space budgets as share of GDP mapped against space budgets per capita in 2016. The bubble size indicates the absolute space budget (Based on the Space Report 2017, Euroconsult, and publicly available data)

Space Policies, Issues and Trends in 2016–2017
ESPI Report 63 17 September 2017
Figure 2.5: Magnification of public space budgets as a share of GDP mapped against space budgets per capita in 2016, not in-cluding the U.S., Luxembourg, France and Russia. The bubble size indicates the absolute space budget (Based on the Space
Report 2017, Euroconsult, and publicly available data)
Contrasting the GDP share of public space funds and per capita public space funds pro-vides another picture of institutional invest-ment in space, (see Figures 2.4 and 2.5). While the U.S. continues to excel in terms of budget size, spending per capita, and as a per-centage of GDP in 2016, Luxembourg emerged in second place in terms of spending per cap-ita, and as a percentage of GDP. Yet, some caution is needed when considering these fig-ures, due to fluctuating exchange rates, and the uncertainty of reported values; and more specifically, these figures likely underestimate both China and Russia’s efforts and capability in space.
2.3 Overview of Commercial Space Markets
The Satellite Industry Association (SIA) re-ported that global industry revenues from sat-ellite services, satellite manufacturing, launch industry, and ground equipment segments grew by 2.2% in 2016 reaching $260.5 billion from $254.8 billion in 2015.56 But according to the Space Report 2017, the combined revenue from commercial space products and services,
56 “2017 State of the Satellite Industry Report.” 15 June 2017. Satellite Industry Association and Bryce Space and Technology 12 July 2017 <http://www.sia.org/wp-con-tent/uploads/2017/07/SIA-SSIR-2017_full-1.pdf>. 57 C.f. The Space Report 2017. Colorado Springs: The Space Foundation, 2017: 16, and The Space Report 2016. Colorado Springs: The Space Foundation, 2016, 16.
and from commercial infrastructure and sup-port industries, increased by 2.6% to $252.88 billion in 2016 from $246.42 billion in 2015.57 It should be noted that these authorities use different methodologies in reaching their as-sessments, and there is continued discrepancy in the findings of SIA and the Space Report, resulting in a difference of $7.2 billion in the figures for 2016, from $8.4 billion in 2015.
The following section presents key figures and data on commercial space activities divided by field of activity, based primarily on available SIA figures generated by Bryce Space and Technology, in addition to previous Tauri Group reports.
2.3.1 Satellite Services
According to the SIA, the revenue earned from satellite services stayed flat for 2016, increas-ing by only 0.2% to $127.7 billion in 2016 from $127.4 billion in 2015; the rate has steadily decelerated in recent years.58 Satellite services accounted for a 49.0% share of the total revenue earned by the global satellite in-dustry in 2016. Moreover, the bulk of satellite service revenue came from its consumer ser-vices subgroup which continues to be a key driver for the overall satellite industry with an
58 “2017 State of the Satellite Industry Report.” 15 June 2017. Satellite Industry Association and Bryce Space and Technology 12 July 2017: 11 <http://www.sia.org/wp-con-tent/uploads/2017/07/SIA-SSIR-2017_full-1.pdf>.

ESPI Report 63 18 September 2017
82.0% share of satellite services revenue earned in 2016.59
Satellite services can be further distinguished by its subgroups, including consumer services (i.e. satellite TV (DBS/DTH), satellite radio (DARS), and satellite broadband services), fixed satellite services (i.e. transponder agree-ments and managed services), mobile services (voice and data), and Earth Observation. The following is a breakdown of the industry’s key developments and trends, according to the na-ture of the services provided.
Consumer Services
Consumer services include satellite television, satellite radio, and satellite broadband ser-vices. The segment’s downstream services revenue grew by less than 0.4% to $104.7 bil-lion in 2016 from $104.3 billion in 2015; more-over, $58.3 billion of 2016 revenue was earned outside of the U.S., mainly in DBS/DTH services and from some growth in satellite broadband. With around 220 million satellite television subscribers worldwide, DBS/DTH customers, increasingly in emerging markets, are a key driver in consumer services revenue; however, there is the potential for a further slowdown in demand growth for DBS/DTH ser-vices as customers opt for internet-based video services. Demand growth for satellite ra-dio increased by 8.7% to $5 billion in 2016 from $4.6 billion in 2015, coming primarily from U.S. customers, and satellite broadband revenue increased by 5.3% to $2.0 billion in 2016 from $1.9 billion in 2015, with a notable increase outside of the U.S.60 Satellite televi-sion accounted for 93.3% of consumer service revenue, followed by satellite radio at 4.8%, and satellite broadband services at 1.9%.61
Fixed Satellite Services
Fixed Satellite Services (FSS) refers to the use of spacecraft that utilise land terminals in fixed positions to broadcast. Here, FSS relates to commercial signal agreements, such as tran-sponder agreements and managed network services. The segment contracted by 2.8%, earning $17.4 billion in 2016 from $17.9 billion in 2015, due to a decrease in transponder agreements outside of the U.S. Revenue from transponder agreements decreased by 9.7% to $11.2 billion in 2016 from $12.4 billion in 2015; nearly all of the revenue generated is from the non-U.S. market. The decrease in the FSS market was offset by 12.7% revenue growth in managed network services reaching $6.2 billion in 2016 from $5.5 billion in 2015,
59 Ibid. at 4. 60 Ibid. at 11. 61 Ibid.
driven primarily by the increase in high-throughput capacity and inflight services.62
Mobile Satellite Services
Mobile Satellite Services (MSS) offer both mo-bile data service and mobile voice service (in-cluding satellite phones). MSS revenue grew by 5.9% to $3.6 million in 2016 from $3.4 mil-lion in 2015. Nearly all of the increase came from outside of the U.S.; MSS revenue from the U.S. was flat, remaining at $0.5 billion in both 2016 and 2015.63
Earth Observation Services
Earth observation services refers to commer-cial companies that provide optical and radar images to the open market; however, demand for such services is mostly driven by govern-ment entities. Nevertheless, new entrants such as Terra Bella and Planet (formerly Planet Labs) have continued to raise capital, and have begun to deploy initial constellations. Earth observation services revenue increased by 11.1% to $2.0 billion in 2016 from $1.8 bil-lion in 2015; and about 60% of that revenue was generated outside the U.S.64
2.3.2 Satellite Manufacturing
The SIA reported that the total revenue of sat-ellite manufacturers that built satellites both for governmental and commercial customers decreased by 13.1% to $13.9 billion in 2016 from $16.0 billion in 2015 (Figure 2.6). It should be noted that the manufacturing sec-tor, while mostly driven by the telecoms sec-tor, remains sensitive downturns which took place despite the emergence of new players which are driving an increased competition. Manufacturers outside the U.S. were more af-fected by the drop in revenue, decreasing by 24.2% to $5.0 billion in 2016 from $6.6 billion in 2015. In contrast, U.S. manufacturers ex-perienced a decrease of 5.3% to $8.9 billion in 2016 from $9.4 billion in 2015, shifting its share in global revenues to 64% in 2016 from 59% in 2015. Military surveillance satellites accounted for 44% of the revenue generated for the year, followed by communications sat-ellites which dropped to second position earn-ing 22% of the total revenues (i.e. 16% from commercial communications and 6% for civil/military communications). Next, naviga-tion satellites and Earth Observation satellites each
62 Ibid. at 14. 63 Ibid. 64 Ibid. at 12.

Space Policies, Issues and Trends in 2016–2017
ESPI Report 63 19 September 2017
Figure 2.6: World satellite manufacturing revenue (Source: SIA)
accounted for 12%, followed by scientific sat-ellites at 5%, meteorology satellites at 4%, while satellites developed for R&D purposes amounted to 1%. Cubesats continued to rep-resent less than 1% of the total revenue gen-erated for the year.65
2.3.3 Launch Sector
There were 21 commercial launch events in 2016; however two anomalies occurred in the year, including the early shutdown of the first stage of the Atlas V launcher carrying the Cyg-nus CRS-6 ISS resupply capsule in March 2016, which did not affect the success of the mission, and the explosion of the Falcon 9 FT during a static-fire test in September 2016, which occurred days prior to the scheduled launch. The 21 successful commercial launches carried 37 mostly commercial ser-vices payloads into orbit. Commercial launches accounted for 24.7% of the total 85 launches in 2016; and commercial payloads amounted to 35.6% of the 222 payloads launched. Of the 222 payloads that were launched in 2016, 57 were cube satellites launched directly into or-bit, while another 49 cube satellites were in-tended to be released into orbit from the ISS. When not considering cube satellites, the per-centage of commercial payloads launched amounted to 25.0%, or 29 commercial pay-loads out of a total of 116 non-cube satellite payloads.
In 2016, U.S. launch providers conducted 11 commercial launches out of a total 22 launches, including the successful launches of
65 Ibid. at 18.
7 Falcon 9 FT flights, 3 Atlas V flights, and 1 flight by the Antares launcher, amounting to a share of 52.4% of commercial launches for the year. Here SpaceX’s Falcon 9 has begun to surpass ULA’s Atlas V and Delta 4 launchers in recent years, due partly to its more competi-tive offer and non-reliance on Russian en-gines; in order to remain competitive, ULA likely will need to reshape its offer. China con-ducted 22 non-commercial launches, but did not have any commercial launch activity in 2016. Russia was third in terms of launches in 2016, while only 2 of its 17 launches were for commercial purposes; its share of total com-mercial launches lowered to 9.5% for 2016. However, this downturn is due to production issues; Russia is expected make a stronger re-turn to the market in 2017 which likely will in-crease the competitive pressure. Next, Europe conducted 8 commercial launches and 3 more non-commercial launches in 2016; increasing its share of total commercial launches to 38.1% for the year (not counting the actual number of payloads launched). And finally, In-dia conducted 7 non-commercial launches, fol-lowed by Japan with 4 non-commercial launches, and Israel and North Korea each with a single non-commercial launch.
The total estimated revenue from commercial launch activities increased by 14.7% to $2.467 billion in 2016, up from $2.15 billion in 2015. The U.S. nearly doubled its commercial launch revenue, increasing to an estimated $1.185 billion in 2016 from $617 million in 2015. Eu-rope generated the second highest revenue for 2016, increasing by 8.1% to $1.152 billion in 2016 from $1.066 billion in 2015. And Russia

ESPI Report 63 20 September 2017
held the third position earning an estimated $130 million, a decrease of 55.0% from the $289 million earned in 2015.66
Arianespace conducted a total of 11 launches from its French Guiana spaceport in 2016. Its Ariane 5 ECA launcher had 6 launches, lifting 7 commercial telecommunications satellites (Intelsat 29e, Eutelsat 65 West A, Echostar 18, Intelsat 33e, Intelsat 36, StarOne D1, and JCSat 15), and 3 civil government communi-cations satellite (BRIsat, NBN-Co 1B, and GSat 18) into GEO orbit. The Ariane 5 ES launcher had one launch, placing 4 Galileo navigation
satellites (Galileo FOC-7, -12, -13, and -14) to medium Earth orbit (MEO) for the European Commission. The Europeanized Soyuz had 2 launches, one lifting the Sentinel 1B along with several other smaller spacecraft into LEO, and the second that lifted the Galileo FOC-10 and -11 into MEO for the European Commission. The Vega launcher conducted another two launches, one which lifted a military remote sensing satellite for the government of Peru and four commercial remote sensing satellites for Terra Bella, and one that launched Turkey’s Göktürk 1A reconnaissance satellite to LEO.
Figure 2.7: Commercial Launch Activity by Country in 2016 (Source: FAA)
Figure 2.8: Commercial Launch Revenues by Country in 2016 (Source: FAA)
66 Federal Aviation Administration. The Annual Compen-dium of Commercial Space Transportation: 2017. Wash-ington DC: FAA, Jan. 2017: 40.
Space Policies, Issues and Trends in 2016–2017
ESPI Report 63 21 September 2017
2.3.4 Ground Equipment
Ground equipment revenue includes infra-structure elements, such as mobile terminals, gateways and control stations, and consumer equipment, such as very small aperture termi-nals (VSAT), ultra small aperture terminals (USAT), DTH broadcast dishes, satellite phones and digital audio radio satellite (DARS) equipment. Portable Navigation Devices (PND) form one of the sub-segments of end-user electronics that incorporate GNSS chip sets.
Ground equipment revenues increased by 7.0% to $113.4 billion in 2016 from $106.0 billion in 2015, driven by growth in consumer equipment for satellite navigation including standalone devices and embedded chipsets for smartphones, traffic information systems, and transport vehicles, and by increasing demand for network equipment for managed network services. In contrast, consumer equipment for satellite TV, satellite radio, and satellite broad-band saw flat growth, offset somewhat by growth in terrestrial broadband and some mo-bile equipment sales.67 Consumer equipment for satellite navigation increased by 8.3% to $84.6 billion in 2016 from $78.1 billion in 2015, while network equipment grew by 7.3%
to $10.3 billion in 2016 from $9.6 billion in 2015. In contrast, consumer equipment for satellite TV, satellite radio, and satellite broad-band grew by just 1.1% to $18.5 billion in 2016 from $18.3 billion in 2015. Overall, ground equipment revenues accounted for a 43.5% share of $260.5 billion world satellite industry revenue earned in 2016.
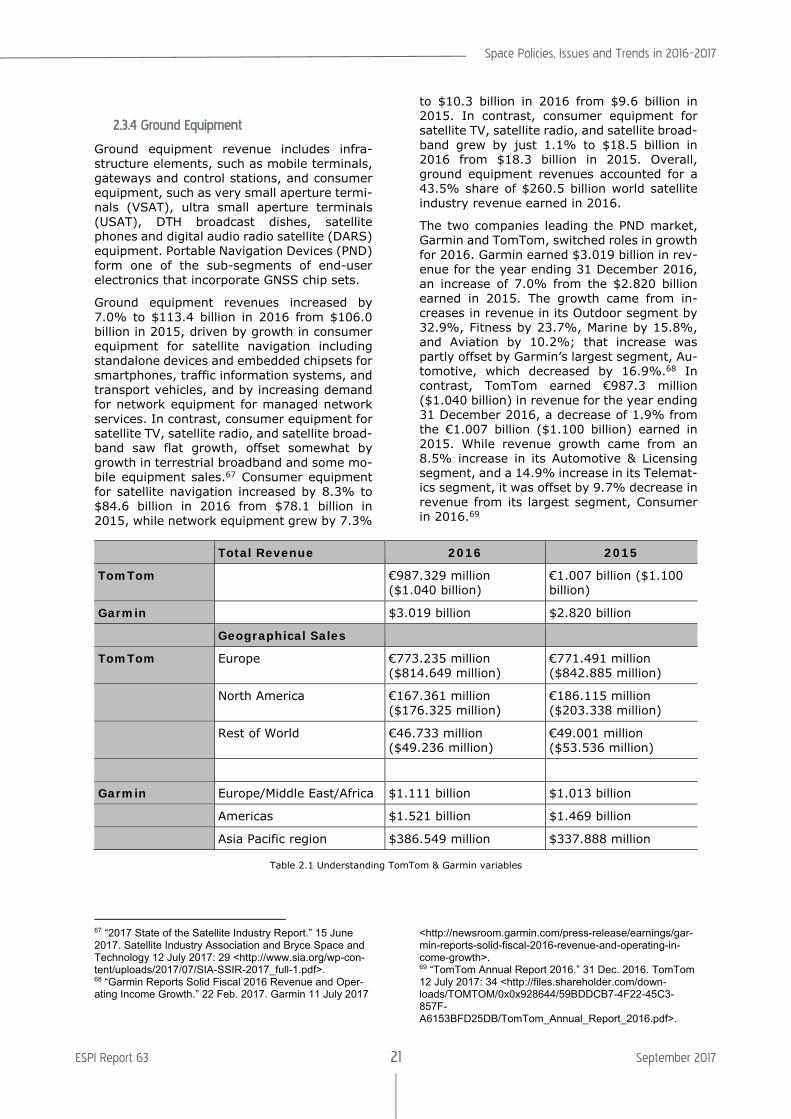
The two companies leading the PND market, Garmin and TomTom, switched roles in growth for 2016. Garmin earned $3.019 billion in rev-enue for the year ending 31 December 2016, an increase of 7.0% from the $2.820 billion earned in 2015. The growth came from in-creases in revenue in its Outdoor segment by 32.9%, Fitness by 23.7%, Marine by 15.8%, and Aviation by 10.2%; that increase was partly offset by Garmin’s largest segment, Au-tomotive, which decreased by 16.9%.68 In contrast, TomTom earned €987.3 million ($1.040 billion) in revenue for the year ending 31 December 2016, a decrease of 1.9% from the €1.007 billion ($1.100 billion) earned in 2015. While revenue growth came from an 8.5% increase in its Automotive & Licensing segment, and a 14.9% increase in its Telemat-ics segment, it was offset by 9.7% decrease in revenue from its largest segment, Consumer in 2016.69
Total Revenue 2016 2015
TomTom €987.329 million ($1.040 billion)
€1.007 billion ($1.100 billion)
Garmin $3.019 billion $2.820 billion
Geographical Sales
TomTom Europe €773.235 million ($814.649 million)
€771.491 million ($842.885 million)
North America €167.361 million ($176.325 million)
€186.115 million ($203.338 million)
Rest of World €46.733 million ($49.236 million)
€49.001 million ($53.536 million)
Garmin Europe/Middle East/Africa $1.111 billion $1.013 billion
Americas $1.521 billion $1.469 billion
Asia Pacific region $386.549 million $337.888 million
Table 2.1 Understanding TomTom & Garmin variables
67 “2017 State of the Satellite Industry Report.” 15 June 2017. Satellite Industry Association and Bryce Space and Technology 12 July 2017: 29 <http://www.sia.org/wp-con-tent/uploads/2017/07/SIA-SSIR-2017_full-1.pdf>. 68 “Garmin Reports Solid Fiscal 2016 Revenue and Oper-ating Income Growth.” 22 Feb. 2017. Garmin 11 July 2017
<http://newsroom.garmin.com/press-release/earnings/gar-min-reports-solid-fiscal-2016-revenue-and-operating-in-come-growth>. 69 “TomTom Annual Report 2016.” 31 Dec. 2016. TomTom 12 July 2017: 34 <http://files.shareholder.com/down-loads/TOMTOM/0x0x928644/59BDDCB7-4F22-45C3-857F-A6153BFD25DB/TomTom_Annual_Report_2016.pdf>.

ESPI Report 63 22 September 2017
2.3.5 Insurance Sector
Insurance premiums for the launch and first year in orbit of satellites reached a historic low of around 5% in 2016, i.e. 60% lower than coverage in 2006, despite the fact that several launch failures in 2015 resulted in either a loss or marginal profit year for insurance under-writers. Moreover, aside from the eventual claim by Intelsat for the shortened in-orbit life of its Intelsat-33e satellite due to a defective propulsion system, 2016 is expected to be a profitable year for underwriters, likely gener-ating between $450 million and $600 million, as no other claims for launch or satellite-re-lated damages are anticipated. The continued success of the Ariane 5 launcher since 2002 has generated consistent profits for underwrit-ers over the years allowing its insurance rate to lower to around 4%, followed by SpaceX whose rates are slightly higher. By compari-son, the numerous failures experienced by Russia’s Proton-M in the past 5 years have in-creased its insurance rate to around 12%. However, as several next generation launch-ers are in the pipeline for the near future, in-surance rates for these new launchers will likely be higher since they might fail more fre-quently than flight-proven vehicles.70 The risks associated with launching satellites on refur-bished launchers will also need to be ad-dressed by insurance underwriters, in addition to the risks linked to space tourism.
The pre-launch insurance premiums, normally generating between $10 million to $12 million in total volume annually, will likely increase following the loss of the Amos-6 satellite on 1 September 2016, which was destroyed in the explosion of the Falcon 9 launcher during preparations for a static-fire test days prior to its scheduled launch, and the extensive dam-age sustained by the Superbird-8/DSN-1 com-munications satellite while being transported to Europe’s Guiana Space Centre spaceport in French Guiana in June 2016.71 Having wiped out more than 20 years of insurance premium for the pre-launch market with the single loss of Amos-6, cargo and marine insurance under-writers may refuse to take on that risk again at the prevailing rates in the prelaunch mar-ket.72 In contrast, in-orbit insurance premiums beyond the first-year have decreased substan-tially, dropping to as low as 0.4% in 2016 from 2.5% in earlier years, despite the $158 million total loss claim of the Amos-5 satellite which
70 De Selding, Peter B. “Space insurers warn that current low rates are not sustainable.” 10 Oct. 2016. SpaceNews 9 Nov. 2016 <http://spacenews.com/space-insurers-warn-that-current-low-rates-are-not-sustainable/>. 71 De Selding, Peter B. “Japan’s DSN-1 military communi-cations satellite damaged during transport to launch base.”
stopped communicating from its Geostation-ary orbit on 21 November 2015. With new forms of insurance coverage that require the loss of a few satellites in a constellation before full compensation for the lost spacecraft, these low rates are likely to hold in the near future.73
2.4 Sectoral Overview
2.4.1 Launch Sector
The launch sector is an enabler rather than a primary economic activity. Yet, with the growth in low-cost launch services, the mar-ginal revenue the launch sector generates is becoming a more important factor to watch.
Launch activity decreased in 2016, with a total of 85 launches conducted by launch providers from the United States, China, Russia, Europe, India, Japan, Israel, and North Korea. Two launch failures, and one pre-launch failure oc-curred in 2016, resulting in the loss of a re-mote sending satellite, a communications sat-ellite, and an ISS cargo resupply mission. The first failure occurred on 31 August 2016, with the Long March 4C carrying the Gaofen 10 re-mote sensing spacecraft which did not reach orbit due to a failure of the launcher’s third stage. A pre-launch failure of the Falcon 9 oc-curred during a static fire test on 1 September 2016, two days prior to the intended launch date; it was carrying Israeli-based Spacecom’s Amos-6 satellite at the time of the explosion. The final failure occurred on 1 December 2016, with the Soyuz U Progress MS-4 ISS cargo re-supply mission which lost telemetry just be-fore separating from the third stage prema-turely causing a collision between the third stage and spacecraft 382 seconds into the launch.
When looking into the launches of specific countries (Table 2.2), the United States and China each shared the first position in the number of launches for 2016, conducting 25.9% of total launches. Russia took the next position with a 20.0% share, followed by Eu-rope which had a 12.9% share of the total. In-dia was in fifth position with an 8.2% share, followed by Japan with 4.7%, and Israel and
20 June 2016. SpaceNews 24 July 2017 <http://space-news.com/japans-dsn-1-military-communications-satellite-damaged-during-transport-to-launch-base/>. 72 De Selding, Peter B. “Space insurers warn that current low rates are not sustainable.” 10 Oct. 2016. SpaceNews 9 Nov. 2016 <http://spacenews.com/space-insurers-warn-that-current-low-rates-are-not-sustainable/>. 73 Ibid.

Space Policies, Issues and Trends in 2016–2017
ESPI Report 63 23 September 2017
North Korea each accounting for 1.2% of the total launch figure (see Figure 2.9).74
The United States conducted 22 launches us-ing fourteen launch system configurations.75 China also conducted 22 launches but used ten launch system configurations (including the failed launch of its Long March 4C).76 Russia used six different launch configurations for its 17 launches (including the failed launch of the Soyuz U).77 Europe relied on its workhorse Ar-iane 5 ECA launcher, in addition to its Vega
launcher and Europeanized Soyuz variants to have 11 launches (6 Ariane 5 ECA, 1 Ariane 5 ES, 2 Vega, 1 Soyuz STB Fregat-M, and 1 So-yuz STB Fregat-MT). India used three launcher configurations (i.e. 5 PSLV XL, 1 PSLV G, and 1 GSLV Mk.2) for its 7 launches; while Japan used three launcher configurations (i.e. 2 H-IIA 202, 1 H-IIB 304, and 1 Epsilon 2) for its 4 launches. Israel conducted a single launch of its Shavit 2 launcher, while North Korea con-ducted a failed launch of its Unha-3 launcher.
Figure 2.9: Worldwide launches by country in 2016 (Source: FAA)
Launch system utilization moved to 43 active launch systems in 2016 from 40 used in 2015. The U.S., China, and Russia accounted for a combined share of 71.8% of the number of launches for 2016 while launch activity in Eu-rope, India, and Japan either grew or re-mained the same from 2015. Moreover, this indicator overlooks the fact that certain launchers have dual-launch capabilities such as Europe’s Ariane 5, which can lift two stand-ard-size payloads to geostationary orbit. Hence the number of launches does not reflect the number of payloads brought to orbit.
The FAA’s Annual Compendium of Commercial Space Transportation noted that 21 commer-cial launches occurred in 2016; however, it
74 Federal Aviation Administration. The Annual Compen-dium of Commercial Space Transportation: 2017. Wash-ington DC: FAA, Jan. 2017: 39. 75 i.e. Antares 230, Atlas 5 (401), Atlas 5 (411), Atlas 5 (421), Atlas 5 (431), Atlas 5 (541), Atlas 5 (551), Delta 4 Heavy (upgrade), Delta 4 Medium +(5,4) (Upgrade), Delta 4 Medium+ (4,2), Delta 4 Medium+ (5,2) (upgrade), Falcon 9 FT, Falcon 9 v1.1, and Pegasus XL.
should be noted that its definition of a com-mercial launch includes either one where the primary payload’s launch contract was award according to a fair and open process, or one where the launch is privately financed by a pri-vate actor without government support.78 Eu-rope was in second position in terms of the number of commercial launches in 2016, and in the amount of commercial launch revenue generated for the year even with its Ariane 5 dual payload capability. Meanwhile, the U.S. led with the most commercial launches and the highest amount of launch revenue earned in 2016. Russia decreased its number of com-mercial launches to 2, while it stayed in third
76 i.e. Long March 2D, Long March 2F, Long March 3A, Long March 3B, Long March 3C, Long March 4B, Long March 4C, Long March 5, Long March 7, and Long March 11. 77 i.e. Proton M Briz-M (Ph.3), Soyuz 2.1a, Soyuz 2.1b, So-yuz FG, Soyuz U, and Rokot KM. 78 Federal Aviation Administration. The Annual Compen-dium of Commercial Space Transportation: 2017. Wash-ington DC: FAA, Jan. 2017: 89.

ESPI Report 63 24 September 2017
Lau
nch
ers
Nu
mb
er o
f la
un
ch s
yste
ms
acti
ve in
20
16
Tota
l nu
mb
er o
f la
un
ches
Com
mer
cial
lau
n-
ches
Non
-com
mer
cial
la
un
ches
United States 14 22 11 11
China 10 22 0 22
Russia 6 17 2 15
Europe 5 11 8 3
India 3 7 0 7
Japan 3 4 0 4
Israel 1 1 0 1
North Korea 1 1 0 1
Total 43 85 21 64 Table 2.2: Worldwide launches in 2016 per country, num-ber of launched systems, and commercial status (Source:
FAA)
position in terms of commercial revenue gen-erated. When considering non-commercial launches, China led the pack with a 34.4% share, followed by Russia with 23.4% of the launches, and the U.S. in the third position with a 17.2% share. The remaining 25% of
non-commercial launches was split between India, Japan, Europe, Israel and North Korea.
While the number of payloads launched de-creased to 222 in 2016, from 265 in 2015, the ratio of commercial launches to non-commer-cial launches remained at about 1 to 3. More-over, the ratio of commercial payloads to non-commercial payloads was 1 to 1.81 in 2016 which can be attributed to large number of commercial cube satellites launched; when considering non-cube payloads, the commer-cial-to-non-commercial ratio was 1 to 3 in 2016.
In terms of the global share of payloads launched in 2016 (Figure 2.10), the U.S. was in first position with a 33.8% share of the total payloads placed in orbit, i.e. 75 payloads of the 222 total. China was in the second spot, launching 42 payloads, with an 18.9% share. India was in third position, launching 34 pay-loads, amounting to a 15.3% share, followed by Europe in fourth position having lifted 27 payloads (12.2%). Japan and Russia came next, each with 21 payloads (9.5%); then Is-rael and North Korea each with 1 payload (0.5%). The global share of payloads launched changes considerably when excluding the total 106 cube satellite payloads from the assess-ment. In this case, the U.S. moves to second position with a decreased 22.4% share; China moves to first position with a 24.1% share. Europe follows closely in the third spot with a 20.7% share. Moreover, Russia’s share in-creases to 16.4% of the total non-cube pay-loads, while India’s share drops to fourth posi-tion with 11.2%, followed by Japan (3.4%), Israel (0.9%) and North Korea (0.9%).
Figure 2.10: Total payloads launched in 2016 by country, share and commercial status (Source: FAA)

Space Policies, Issues and Trends in 2016–2017
ESPI Report 63 25 September 2017
Figure 2.11: Distribution of the payloads launched in 2016 by mass class (Source: FAA)
Payloads by mass class 2016 Percentage Average Mass (kg) Mass Sum (kg)
Micro 57 25.7% 13.1 743.9
Micro * to be released from ISS 49 22.1% 5.0 243.7
Small 34 15.3% 412.9 14,038.0
Medium 18 8.1% 1,569.8 28,256.0
Intermediate 27 12.2% 3,226.0 87,102.0
Large 34 15.3% 6,420.4 218,295.0
Heavy 3 1.4% 13,787.3 41,362.0
222 100.00% 1,756.9 390,040.6
Table 2.3: Distribution of the payloads launched in 2016, including mission failures, by mass class (Source: FAA and Gunter’s Space Page)
There were also some changes in the distribu-tion of payload sizes in 2016 (Figure 2.11 and Table 2.3). The number of “Micro” sized pay-loads reduced to 106, accounting for 47.7% of the total payloads launched in 2016. The av-erage mass of the total number of cube satel-lite payloads was around 9.3 kg, with the sum of their mass reaching 987.6 kg. In 2016, 49 cube satellites were launched to the ISS to be later ejected into orbit, however one Spire
cube satellite failed to deploy properly from the ISS. “Small” and “Large” satellites shared second position, each with 34 payloads, amounting to shares of 15.3%. The “Interme-diate” mass class was in third position with 27 payloads at 12.2%. While “Medium” payloads were in the fourth position with 18 payloads, at 8.1%, and 3 “Heavy” payloads accounted for a 1.4% share of the payloads launched in 2016.79
79 Micro payloads have a mass of 91 kg or less, and are mainly science satellites, technological demonstrators or small communications satellites. Small payloads weigh be-tween 92 and 907 kg and are very often Earth Observation satellites, similar to the Jason or the RapidEye series. Me-dium payloads weigh between 908 and 2,268 kg, and fea-ture the most diverse set of satellites, including small sat-coms in geostationary orbit, Earth Observation satellites,
and most of the Russian military satellites from the Kos-mos series. Intermediate payloads, weighing between 2,269 and 4,536 kg, comprise medium satcoms and big scientific satellites. Large payloads, between 4537 and 9,072 kg, refer to big satcoms, as well as to the Soyuz and Progress spacecraft flying to the ISS. Finally, Heavy pay-loads, exceeding 9,072 kg, are linked to ISS activity, such as the cargo spacecraft, ATV, HTV, etc. See Commercial Space Transportation: 2011 Year in Review, 32.

ESPI Report 63 26 September 2017
Figure 2.12: Share of launch contracts for GEO satellites in 2016 by launch service provider
Once again, Arianespace conducted the most launches in GEO in 2016, with a 27.0% share, followed by the U.S. United Launch Alliance with a 21.6% share. China Aerospace Science and Technology Corporation (CASC) and SpaceX each had a 16.2% share, while India had 10.8%, Russia’s International Launch Ser-vices had 5.4% and Japan’s Mitsubishi had a 2.7% share (Figure 2.12 and Table 2.4). Ari-anespace placed 9 commercial communica-tions satellites along with India’s Gsat 18 com-munications satellite into GEO orbit using six Ariane 5 ECA launchers. The ULA had seven launches, lifting 1 signals intelligence satellite (NRO L-37), 3 military communications satel-lites (MUOS 5, NRO L-61, and WGS-8), 2 space surveillance satellites (GSSAP 3, and GSSAP 4), 1 meteorology satellite for NOAA (GOES-R), and 1 commercial communications satellite (EchoStar 19) into GEO orbit with var-ious Delta 4 and Atlas V launch configurations. China’s CASC had six launches to GEO orbit, i.e. 3 communication satellites, 1 Beidou nav-igation satellite, 1 meteorology satellite, and 1 technology demonstration satellite (Shijian 17) possibly intended for signals intelligence, using mainly Long March 3B and 3C launchers, and one Long March 5. And the SpaceX Falcon 9 was used five times, not counting the 1 Sep-tember 2016 pre-launch explosion, to launch six commercial communications satellites (SES 9, JCSat 14, Thaicom 8, Eutelsat 117 West B, ABS 2A, JCSat 16) into GEO orbit. Three of India’s PSLV XL launchers lifted the IRNSS 1E, 1F, and 1G navigation satellites, while its GSLV Mk.2 launched the Insat 3DR meteorology satellite to GEO orbit. The Rus-sian ILS conducted two Proton M launches to place 2 commercial communication satellites (Eutelsat 9B, and Intelsat 31) to GEO orbit. And lastly, Japan’s H-IIA 202 launcher was used to launch the Himawari 9 meteorology satellite into GEO orbit.
Lau
nch
se
rvic
es
pro
vid
er
Lau
nch
es
Pay
load
s
Per
cen
t-ag
e
Arianespace 6 10 27.03%United Launch Alli-ance (ULA)
7 8 21.62%
China Aerospace Science and Tech-nology Corporation (CASC)
6 6 16.22%
SpaceX 5 6 16.22%India 4 4 10.81%International Launch Services (ILS)
2 2 5.41%
Mitsubishi Heavy Industries
1 1 2.70%
31 37 100.00%
Table 2.4: Share of launch contracts for GEO satellites in 2016 by launch service provider (Source: FAA)
2.4.2 Manufacturing Sector
Looking at the market share of satellites launched and ordered in a given year provides a good indication of the vitality of domestic space industries, while also providing clues to global trends in the space industry.
In 2016, 222 payloads were launched (includ-ing an estimated 106 cube satellites, 14 crewed, cargo, or hardware missions to the
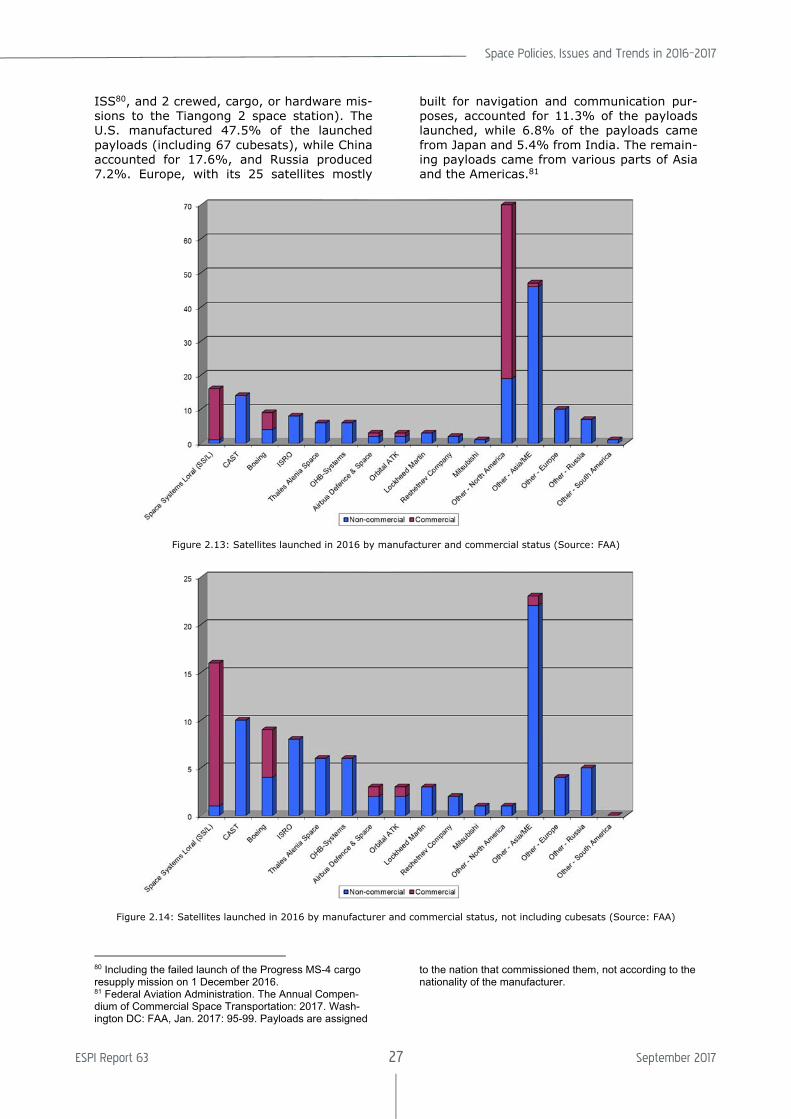
Space Policies, Issues and Trends in 2016–2017
ESPI Report 63 27 September 2017
ISS80, and 2 crewed, cargo, or hardware mis-sions to the Tiangong 2 space station). The U.S. manufactured 47.5% of the launched payloads (including 67 cubesats), while China accounted for 17.6%, and Russia produced 7.2%. Europe, with its 25 satellites mostly
built for navigation and communication pur-poses, accounted for 11.3% of the payloads launched, while 6.8% of the payloads came from Japan and 5.4% from India. The remain-ing payloads came from various parts of Asia and the Americas.81
Figure 2.13: Satellites launched in 2016 by manufacturer and commercial status (Source: FAA)
Figure 2.14: Satellites launched in 2016 by manufacturer and commercial status, not including cubesats (Source: FAA)
80 Including the failed launch of the Progress MS-4 cargo resupply mission on 1 December 2016. 81 Federal Aviation Administration. The Annual Compen-dium of Commercial Space Transportation: 2017. Wash-ington DC: FAA, Jan. 2017: 95-99. Payloads are assigned
to the nation that commissioned them, not according to the nationality of the manufacturer.

ESPI Report 63 28 September 2017
Of the 206 satellites launched in 201682, 64.1% were non-commercial. In this field, 52.3% of the 132 non-commercial satellites were built by manufacturers from Asia (includ-ing 14 by China’s CAST, 8 by India’s ISRO, 1 by Japan’s Mitsubishi and 46 Other Asia/ME). Another 22.0% of the non-commercial satel-lites were built by manufacturers in North America (including 4 by Boeing, 3 by Lockheed Martin, 2 by Orbital ATK, 1 by SS/L and 19 Other North America). Europe’s share of non-commercial spacecraft was 18.2% of non-commercial satellites (including 6 by Thales Alenia Space, 6 by OHB Systems, 2 by Airbus D&S and 10 by other manufacturers in Eu-rope). Russia’s share was 6.8% of non-com-mercial satellites (including 2 from ISS Resh-etnev and 7 more by Other Russian manufac-turers). The remaining non-commercial satel-lite was developed in South America, and accounted for a 0.8% share.
In 2016, 35.9% of the 206 satellites launched were built for commercial purposes. About 97.3% of the 74 commercial satellites came from North America (including 15 by SS/L, 5 by Boeing, 1 by Orbital ATK, and 51 – mostly either Planet or Spire cube satellites – from other parts of North America). Airbus D&S was Europe’s only manufacturer to build a com-mercial satellite, along with another commer-cial satellite manufactured in Other Asia/ME, each accounting for 1.35% shares (Figure 2.13).83
In 2016, 18.4% of the 206 satellites launched were geostationary satellites (Figure 1.15). In this field, 64.9% of the 37 GEO satellites were built by manufacturers from North America (including 11 by SS/L, 6 by Boeing, 3 by Or-bital ATK, 2 by Lockheed Martin, and 2 Other North America). Another 32.4% of the GEO satellites was built by manufacturers in Asia (including 5 by China’s CAST, 5 by India’s ISRO, 1 by Japan’s Mitsubishi and 1 Other Asia/ME). Airbus D&S was Europe’s only man-ufacturer to have a satellite lifted to GEO orbit, accounting for a 2.7% share.84
Among the 169 non-GEO orbiting satellites, North America’s share decreased to 45.6% with 77 non-GEO satellites (5 by SS/L, 3 by Boeing, 1 by Lockheed Martin, and another 68 – mostly cube satellites – from other parts of North America). Manufacturers in Asia held a 34.3% share with 58 non-GEO satellites (9 by China’s CAST, 3 by India’s ISRO, and another 46 developed in Other – Asia/ME). Europe’s share was 14.2% with 24 non-GEO satellites (6 by Thales Alenia Space, 6 by OHB Systems, 2 by Airbus Defence & Space, and 10 from other European makers). Russia’s share was 5.3% with 9 non-GEO satellites (2 from ISS Reshetnev, and the remaining by Other Rus-sian manufacturers). The remaining non-GEO satellite was developed in South America and accounted for a 0.6% share.85
Figure 2.15: Satellites launched in 2016 by manufacturer and orbit type (Source: FAA)
82 i.e. not counting the 14 crewed, cargo, or hardware mis-sions to the ISS, and 2 crewed, cargo, or hardware mis-sions to the Tiangong 2 space station. 83 Ibid.
84 Federal Aviation Administration. The Annual Compen-dium of Commercial Space Transportation: 2017. Wash-ington DC: FAA, Jan. 2017: 39. 85 Ibid. at 95-99.

Space Policies, Issues and Trends in 2016–2017
ESPI Report 63 29 September 2017
Figure 2.16: Satellites launched in 2016 by manufacturer and orbit type, not including cubesats (Source: FAA)
Figure 2.17: GEO satellite orders in 2016 by manufacturer and customer region

ESPI Report 63 30 September 2017
In 2016, North American prime spacecraft manufacturers had a combined lead in orders for GEO communications satellites, accounting for 52.6% of the 19 contracts awarded, whereas European contracts decreased to 26.3% of the available awards. Boeing Satel-lite Systems won 4 commercial satellite orders (AMOS 17, GiSAT 1, ViaSat-3 Americas, and ViaSAT-3 EMEA), as did Space Systems/Loral (Eutelsat 7C, Intelsat 39, SXM 7 and SXM 8). Lockheed Martin won an order to build the JCSat 17, while Orbital ATK won an order for the Eutelsat 5 West B. In Europe, Airbus De-fence & Space received 4 orders (including the DirecTV 16, KMilSatCom 1, SatKomHan 1, and a MilSatCom satellite for Egypt), while Thales Alenia Space received one order for the SES 17. China’s CGWIC had a 10.5% share from 2 contracts (APStar 6D and TCStar 1), as did Russia’s ISS Reshetnev (Ekspress 80 and Ek-spress 103).86
2.5 International Sectoral Comparison
In order to assess the scope and dynamism of the activities, strategies and plans of the main space-faring nations, key space activities, such as the ability to launch missions, and also
the number and type of missions launched, must be considered.
2.5.1 Launch Sector
The possession of launch vehicles and space-ports is a central element in enabling inde-pendence in space activities. Moreover, the number of launches and the level of activity of the space bases give an indication of the dy-namism of a country in the space sector.
In 2016, eight countries carried out a total of 85 orbital launches, down from 87 orbital launches by seven countries in 2015 (Figure 2.18). The U.S. shared the top position with China in 2016, both carrying out 22 launches each; the U.S. led in the number of launches to GEO, followed by Europe, while China led in the number of launches to LEO, followed by Russia. Russia took the next highest position with 17 launches, followed by Europe with 12, India with 7, Japan 4, and Israel and North Ko-rea each with a single launch. Overall, the trend remained consistent with previous years, with the pace of respective launching states performing to their capacities.
The number of missions reduced to 222 in 2016 from 265 in 2015; although the large number of microsatellite missions still tends to skew activity in the sector, representing
Figure 2.18: Total worldwide orbital launches per country/institution 2016 (Source: FAA)
86 “Recently awarded GEO-Sat Contracts.” 18 Aug. 2017. Gunter’s Space Page 20 Aug. 2017 <http://space.sky-rocket.de/doc_sat/sat-contracts.htm>.

Space Policies, Issues and Trends in 2016–2017
ESPI Report 63 31 September 2017
Figure 2.19: Number of missions launched into space by country/institution and payload size in 2016 (Source: FAA)
47.7% of the total number of spacecraft launched in 2016 (Figure 2.19). In 2016, a to-tal of 106 microsatellites were launched into space from 143 microsatellites launched in 2015. The U.S., China, and Russia once again held the top three positions in terms of the number of missions launched. Europe was in sixth position, after Japan and India, with 10 missions for ESA/EU (that number increases to 26 when including missions by individual Eu-ropean countries). The U.S. conducted a total of 92 missions (including 67 microsatellites missions) for a share of 41.4% of the total missions launched, followed by China with 39 (17.6%), Europe with a combined 26 missions (11.7%), Russia with 16 (7.2%), Japan with 15 (6.8%), and India with 12 missions (5.4%).
While the number of missions in recent years is partly skewed due to the growth of mi-crosatellite missions, removing the 106 mi-crosatellites from consideration would yield a slightly different outcome. Of the remaining 116 missions conducted, China becomes the most active nation in space when excluding microsatellites, with a 24.2%. The U.S. moves to second position with a 21.6% share, while Europe is third with 16.4%, followed by Russia with 12.1%, Japan 6.0%, and India with
87 Micro payloads have a mass of 91 kg or less, and are mainly science satellites, technological demonstrators or small communications satellites. Small payloads weigh be-tween 92 and 907 kg and are very often Earth Observation satellites, similar to the Jason or the RapidEye series. Me-dium payloads weigh between 908 and 2,268 kg, and fea-ture the most diverse set of satellites, including small sat-coms in geostationary orbit, Earth Observation satellites,
6.9%; combining to about 87.2% of the total non-microsatellite missions launched 2016.
Figure 2.20 presents the distribution of the to-tal mass of payloads launched by launching state in 2016. In 2016, U.S. launch systems placed 121.16 tons of payload into orbit, of which 82.1% was for its domestic market. Chi-nese launchers lifted 81.62 tons of payload into orbit; 93.5% of the mass came from Chi-nese payloads. Russian launchers lifted 75.33 tons of payload into orbit, of which 77.4% were Russian payloads; moreover, Russian launchers lifted all the Russian payloads for the year. Europe placed 61.4 tons of payload into orbit, with 48.6% of that mass coming from European flagship projects including Gal-ileo and Copernicus, along with satellites for Luxembourg, France, Italy, Belgium, and Den-mark. Japan lifted 23.2 tons of payload into orbit, with 99.9% of its lifted mass belonging to Japanese payloads. India lifted 9.6 tons of payload into orbit, with 91.7% of the mass coming from Indian payloads. And Israel’s Shavit 2 launcher lifted around 800 kg of pay-load into orbit, while North Korea using its Unha 3 launcher lifted an estimated 200 kg of payload into orbit.87
and most of the Russian military satellites from the Kos-mos series. Intermediate payloads, weighing between 2,269 and 4,536 kg, comprise medium satcoms and big scientific satellites. Large payloads, between 4537 and 9,072 kg, refer to big satcoms, as well as to the Soyuz and Progress spacecraft flying to the ISS. Finally, Heavy pay-loads, exceeding 9,072 kg, are linked to ISS activity, such as the cargo spacecraft, ATV, HTV, etc. See Commercial Space Transportation: 2011 Year in Review, 32.
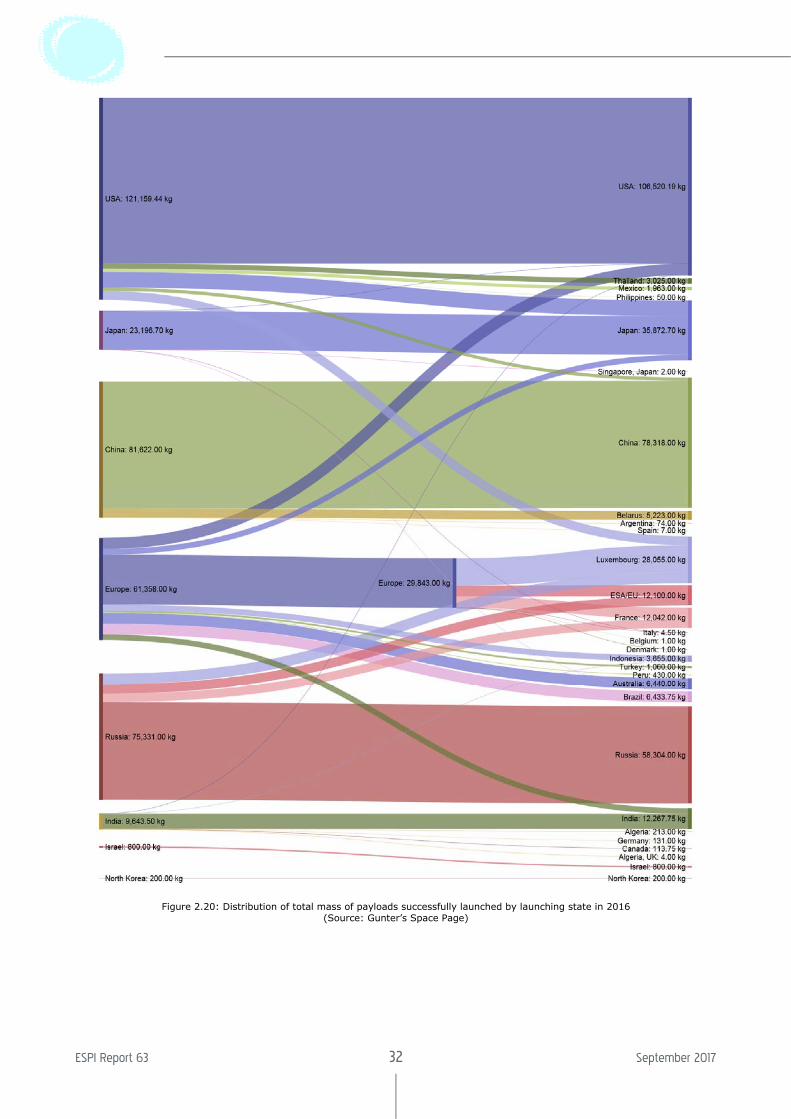
ESPI Report 63 32 September 2017
Figure 2.20: Distribution of total mass of payloads successfully launched by launching state in 2016 (Source: Gunter’s Space Page)

Space Policies, Issues and Trends in 2016–2017
ESPI Report 63 33 September 2017
Country Micro Small Medium Intermediate Large Heavy
USA 49 2 5 4 13 2
China 14 6 2 15 5 0
India 21 8 5 0 0 0
Europe 3 12 2 4 6 0
Japan 17 1 0 2 0 1
Russia 2 3 4 2 10 0
Israel 0 1 0 0 0 0
North Korea 0 1 0 0 0 0
Total 106 34 18 27 34 3
Table 2.5: Distribution of the payloads launched in 2016 by Country (Source: FAA and Gunter’s Space Page)
Figure 2.21: Types of missions launched into orbit in 2016 (Source: FAA)

ESPI Report 63 34 September 2017
Figure 2.22: Types of missions launched into orbit in 2016, not including Earth Observation satellites (Source: FAA)
In 2016, 83 missions were classified as civilian earth observation, including 56 satellites from the U.S. (i.e. including 50 cubesats mostly from Planet or Spire). Moreover, China’s 10 ci-vilian earth observation mission included 3 cu-besats, 3 small satellites, and 4 more interme-diate-sized missions. The other earth observa-tion satellites are peppered in the missions of the other spacefaring countries (Figure 2.21). When removing the 83 civilian earth observa-tion missions from consideration, the remain-ing 139 missions covered nearly the entire spectrum of missions. The remaining 36 U.S. missions focused on science, technology demonstrations, ISS resupply missions, and various types of defence and early warning systems. China, with its remaining 29 satel-lites, focused technology demonstrations, communications, navigation and early warning satellites; China also launched its Tiangong 2 space station and a crewed Shenzhou 11 mis-sion to its space station. Russia successfully launched 2 of its 3 cargo resupply missions to the ISS, and 4 of its crewed missions, along
with several technology demonstration and navigation systems. Much of Europe’s activity centred on launching its Galileo navigation satellites, along with the launch of the Coper-nicus Sentinel 1b and Sentinel 3a remote sensing satellite, and numerous communica-tion satellites (Figure 2.22).
Among the remaining 139 non-remote sensing missions, technology demonstration missions had the highest share of activity, at about 35.3% in 2016; yet, it should be mentioned that these technological demonstrations were conducted mostly by non-European space ac-tors. While civil communication missions ac-counted for 17.3%, scientific missions at 13.0%, and navigation missions at 10.8%. Next, the total amount of various types of de-fence and early warning systems accounted for 9.4%, followed by ISS cargo missions at 6.5%, meteorology missions at 3.6%, and ISS crewed missions at 2.8%. The launch of the Tiangong 2 and its crewed mission each ac-counted for 0.7% shares.
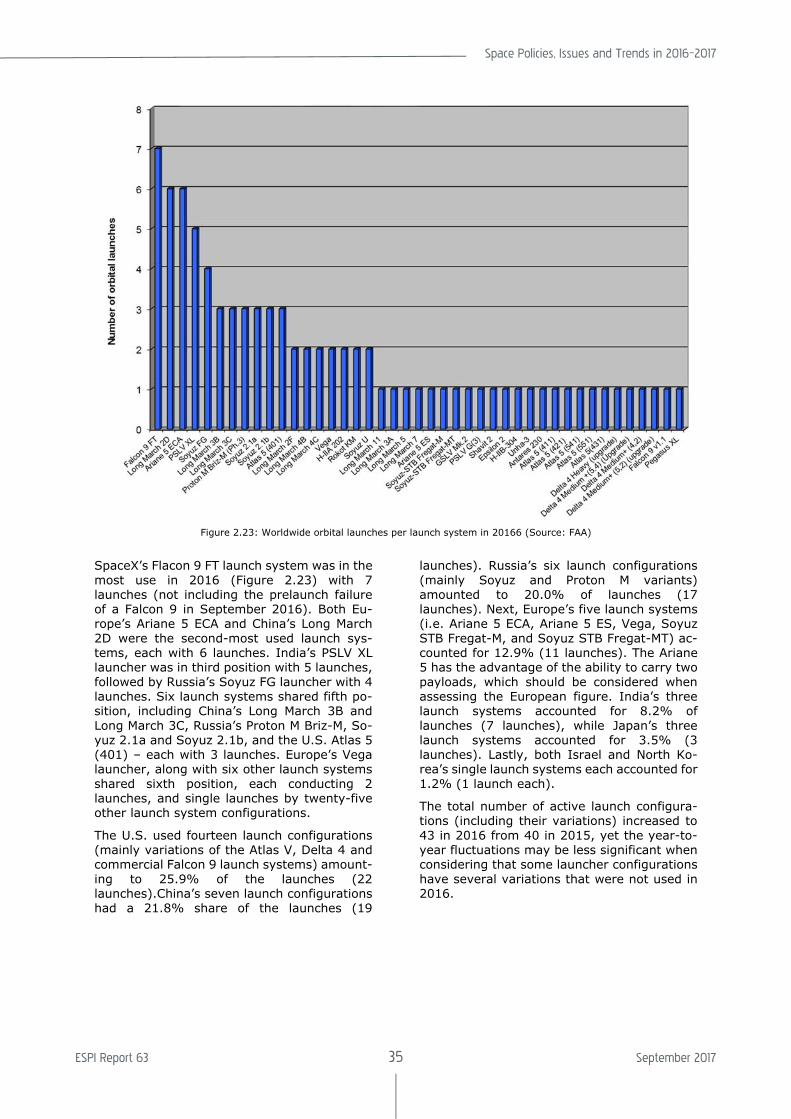
Space Policies, Issues and Trends in 2016–2017
ESPI Report 63 35 September 2017
Figure 2.23: Worldwide orbital launches per launch system in 20166 (Source: FAA)
SpaceX’s Flacon 9 FT launch system was in the most use in 2016 (Figure 2.23) with 7 launches (not including the prelaunch failure of a Falcon 9 in September 2016). Both Eu-rope’s Ariane 5 ECA and China’s Long March 2D were the second-most used launch sys-tems, each with 6 launches. India’s PSLV XL launcher was in third position with 5 launches, followed by Russia’s Soyuz FG launcher with 4 launches. Six launch systems shared fifth po-sition, including China’s Long March 3B and Long March 3C, Russia’s Proton M Briz-M, So-yuz 2.1a and Soyuz 2.1b, and the U.S. Atlas 5 (401) – each with 3 launches. Europe’s Vega launcher, along with six other launch systems shared sixth position, each conducting 2 launches, and single launches by twenty-five other launch system configurations.
The U.S. used fourteen launch configurations (mainly variations of the Atlas V, Delta 4 and commercial Falcon 9 launch systems) amount-ing to 25.9% of the launches (22 launches).China’s seven launch configurations had a 21.8% share of the launches (19
launches). Russia’s six launch configurations (mainly Soyuz and Proton M variants) amounted to 20.0% of launches (17 launches). Next, Europe’s five launch systems (i.e. Ariane 5 ECA, Ariane 5 ES, Vega, Soyuz STB Fregat-M, and Soyuz STB Fregat-MT) ac-counted for 12.9% (11 launches). The Ariane 5 has the advantage of the ability to carry two payloads, which should be considered when assessing the European figure. India’s three launch systems accounted for 8.2% of launches (7 launches), while Japan’s three launch systems accounted for 3.5% (3 launches). Lastly, both Israel and North Ko-rea’s single launch systems each accounted for 1.2% (1 launch each).
The total number of active launch configura-tions (including their variations) increased to 43 in 2016 from 40 in 2015, yet the year-to-year fluctuations may be less significant when considering that some launcher configurations have several variations that were not used in 2016.

ESPI Report 63 36 September 2017
Figure 2.24: Distribution of total mass of launch systems launched by launching state in 2016 (Source: Gunter’s Space Page and Spaceflight 101)

Space Policies, Issues and Trends in 2016–2017
ESPI Report 63 37 September 2017
Country Launch System Number of Launches
Mass of Launcher
(metric ton)
Mass Sum (metric ton)
Antares 230 1 298 298 Atlas 5 (401) 3 334.5 1003.5 Atlas 5 (411) 1 386.8 386.8 Atlas 5 (421) 1 428 428 Atlas 5 (431) 1 482.5 482.5 Atlas 5 (541) 1 540.3 540.3 Atlas 5 (551) 1 587 587 Delta 4 Medium+ (4,2) 1 292.7 292.7 Delta 4 Medium+ (5,2) (upgrade) 1 332 332 Delta 4 Medium+ (5,4) (upgrade) 1 404.6 404.6 Delta 4 Heavy (upgrade) 1 733 733 Falcon 9 FT 7 549.1 3843.7 Falcon 9 v1.1 1 505.8 505.8 Pegasus XL 1 24 24 Long March 2D 6 232.3 1393.8 Long March 2F 2 479.8 959.6 Long March 3A 1 241 241 Long March 3B 3 456 1368 Long March 3C 3 367.5 1102.5 Long March 4B 2 249.2 498.4 Long March 4C 2 250 500 Long March 5 1 879 879 Long March 7 1 594 594 Long March 11 1 58 58 Proton M Briz-M (Ph.3) 3 712.8 2138.4 Rokot KM 2 107 214 Soyuz 2.1a 3 303 909 Soyuz 2.1b 3 303 909 Soyuz FG 4 305 1220 Soyuz U 2 313 626 Ariane 5 ECA 6 777 4662 Ariane 5 ES 1 773 773 Vega 2 137 274 Soyuz-STB Fregat-M (Europe) 1 306.6 306.6 Soyuz-STB Fregat-MT (Europe) 1 308 308 PSLV G(3) 1 294 294 PSLV XL 5 320 1600 GSLV Mk.2 1 414 414 H-IIA 202 2 285 570 H-IIB 304 1 531 531 Epsilon 2 1 91 91
Israel Shavit 2 1 30.9 30.9 North Korea Unha-3 1 91 91
Table 2.6: Distribution of the mass of launch systems launched by launching state in 2016 (Source: Gunter’s Space Page and Spaceflight 101)
Figure 2.24 presents the distribution of the to-tal mass of launch systems by launching state in 2016. The demand for specific launch sys-tems is seen on the left side of the figure, while countries that supplied the launchers are dis-played on the right side. As seen in Figure
2.20, the majority of U.S., Chinese, and Rus-sian launch systems catered to their respec-tive institutional markets, whereas a substan-tial portion of Europe’s launch systems were used by non-European actors.
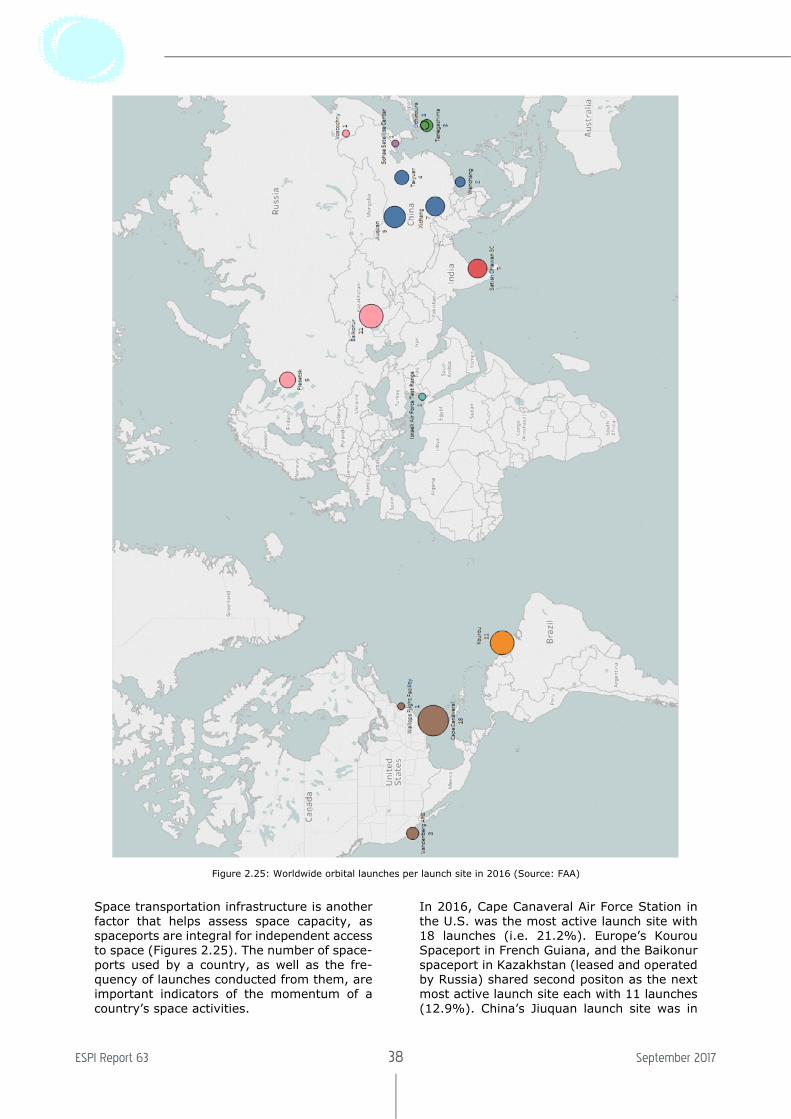
ESPI Report 63 38 September 2017
Figure 2.25: Worldwide orbital launches per launch site in 2016 (Source: FAA)
Space transportation infrastructure is another factor that helps assess space capacity, as spaceports are integral for independent access to space (Figures 2.25). The number of space-ports used by a country, as well as the fre-quency of launches conducted from them, are important indicators of the momentum of a country’s space activities.
In 2016, Cape Canaveral Air Force Station in the U.S. was the most active launch site with 18 launches (i.e. 21.2%). Europe’s Kourou Spaceport in French Guiana, and the Baikonur spaceport in Kazakhstan (leased and operated by Russia) shared second positon as the next most active launch site each with 11 launches (12.9%). China’s Jiuquan launch site was in

Space Policies, Issues and Trends in 2016–2017
ESPI Report 63 39 September 2017
Figure 2.26: Total payload mass launched per launch site in 2016 (Source: FAA)

ESPI Report 63 40 September 2017
third position with 9 launches (10.6%), fol-lowed by China’s Xichang launch site and In-dia’s Satish Dhawan Space Centre each with 7 launches (8.2%). Russia’s Plesetsk site had 5 launches (5.9%), while China’s Taiyuan launch site had 4 launches (4.7%). Next, Japan’s Tanegashima Space Center, and the Vanden-berg Air Force Base in the U.S., each had 3 launches (3.5%), while China’s Wenchang Satellite Launch Center had 2 launches (2.4%). Lastly, the U.S. Wallops Flight Facility, Russia’s Vostochny Cosmodrome, Japan’s Uchinoura Space Center, Israel’s Air Force Test Range, and North Korea’s Sohae Satellite Center each had 1 launch (1.2%).
While Europe is stable with the spaceport in Kourou – remaining in third position in terms
of total mass of payload lifted in 2016 – it runs the risk of being further outdistanced by the U.S., China, and Russia, which benefit from the numerous launch sites available and in-creased activity. This risk is counterbalanced with the availability of the launcher Ariane 5 launcher family, in addition to the Vega launcher, and the Europeanized Soyuz 2 launcher which will operate from Kourou through 2019. In 2016, U.S. and China sites each hosted 25.9% of total launches followed by 20.0% in Russia, and 12.9% for Europe. This situation is likely to continue as China’s Wenchang Satellite Launch Center and Rus-sia`s Vostochny Cosmodrome increase their launch activity.
Country/Re-gion
Spaceport Micro Small Me-dium
Inter-medi-ate
Large Heavy
Europe Kourou, French Guiana 3 12 2 4 6 0
Cape Canaveral AFS 38 1 5 3 12 1
Vandenberg AFB 7 1 0 1 0 1
Wallops Flight Facility 4 0 0 0 1 0
Xichang 0 0 1 3 3 0
Jiuquan 10 4 1 3 2 0
Taiyuan 3 2 0 3 0 0
Wenchang 1 0 0 6 0 0
Baikonur (Kazakhstan) 1 1 0 1 10 0
Plesetsk 0 0 4 1 0 0
Vostochny 1 2 0 0 0 0
India Satish Dhawan 21 8 5 0 0 0
Tanegashima 17 0 0 2 0 1
Uchinoura 0 1 0 0 0 0
Israel Israeli Air Force Test Range 0 1 0 0 0 0
North Korea Sohae Satellite Center 0 1 0 0 0 0
Table 2.7: Distribution of the payloads launched in 2016 by Launch site (Source: FAA and Gunter’s Space Page)

Space Policies, Issues and Trends in 2016–2017
ESPI Report 63 41 September 2017
2.6 State of the European Industry
The financial results of Europe’s space manu-facturing industry in 2016 provide insight into the European space industry’s long-term de-velopments and character, operating as both a strategic sector and infrastructure supplier. The trends reviewed in this section are mainly based on statistics generated by ASD-Eurospace.88
The European space industry continued to see a steady incremental increase in turnover in recent years, increasing by 9.4% to €8.247 billion in 2016 from €7.538 billion in 2015 (Fig-ure 2.27). Despite that increase, the number of commercial GEO communications
satellite orders won by European prime con-tractors decreased to a combined share of 5 out of 19 contracts (26.3%). European prime contractor Airbus Defence & Space won 4 con-tracts from non-European institutional cus-tomers, while its competitor Thales Alenia Space won a single contract from Europe’s SES; marking a reduction from the 8 of 26 contracts awarded to European prime contrac-tors (33.3%) in 2015.89
Employment levels are another way to gauge the situation of the main companies in the space sector (Figure 2.28). The number of jobs created has steadily increased in recent years, growing by close to 5000 jobs from 2013 to 2016. Around 1984 jobs were created in 2016 alone, marking an acceleration compared to the incremental growth in earlier years.
Figure 2.27: Estimated consolidated turnover of the European space sector in Euros (Copyright by Eurospace – all rights reserved, used with permission, reproduction forbidden)
88 ASD-Eurospace. “Facts & figures – The European Space Industry in 2016.” 21st edition. June 2017.
89 “Recently awarded GEO-Sat Contracts.” 18 Aug. 2017. Gunter’s Space Page 20 Aug. 2017 <http://space.sky-rocket.de/doc_sat/sat-contracts.htm>.

ESPI Report 63 42 September 2017
Figure 2.28: European space industry employment
(copyright by Eurospace – all rights reserved, used with permission, reproduction forbidden)
In the European space sector, most funding goes toward institutional civil programmes ra-ther than to institutional military programmes. Here, ESA’s role continues to increase, aided by the development of EU’s two flagship space programmes, Copernicus and Galileo. In 2016, 76.4% of the final sales in Europe’s space in-dustry came from European customers, while 23.6% of final sales came from exports.90 ESA procurement alone represented more than a third of industry revenues with sales ranging from scientific spacecraft, to satellite applica-tions and launchers. In Europe’s domestic market, sales to European institutional cus-tomers (both civil and military) were the main source of revenue reaching 77.8% in 2016, while sales to European commercial customers such as satellite or launch service operators (e.g. Eutelsat, Arianespace, etc.) generated 21.0%, and the remaining 1.2% was gener-ated by other/unknown.91 From Figure 2.29, the turnover in institutional civil programmes had an increasing share, with ESA as the main driver in developing and procuring satellites for the Copernicus and Galileo EU flagship pro-grammes, along with meteorological satellites on behalf of EUMETSAT. National pro-grammes, mainly CNES, DLR and ASI, also
90 ASD-Eurospace. “Facts & figures – The European Space Industry in 2016.” 21st edition. June 2017: 12.
represent a sizable share of turnover. Moreo-ver, while turnover in commercial satellites appears to be increasing, the turnover gener-ated by operational launchers and parts de-creased in 2016 relative to the other seg-ments.
When looking at the European space industry by sector (Figure 2.30), there was a 9.4% overall increase in turnover in 2016, with the most growth coming from satellite applications increasing by 12.5%, launcher developments and production increasing by 11.1%, and other unknown which increased by 39.5%. Support and test turnover also increased by 4.3% in 2016, while scientific programmes in-creased by 1.2%.
While Figure 2.30 displays the impact of the turnover per sector, and provides a historical timeline, it is possible to drill down further into each category to assess the impact of the in-crease in turnover. In 2016, the 12.5% growth turnover in satellite applications varied among the three parts of the satellite applications sec-tor (i.e., telecommunication, earth observa-tion, and navigation/localisation systems). While turnover in Earth observation systems
91 Ibid. at 6.

Space Policies, Issues and Trends in 2016–2017
ESPI Report 63 43 September 2017
Figure 2.29: Estimated share of European space industry consolidated turnover per institutional customer
(copyright by Eurospace – all rights reserved, used with permission, reproduction forbidden)
Figure 2.30: Estimated share of European space industry consolidated turnover per sector (copyright by Eurospace – all rights reserved, used with permission, reproduction forbidden)
(e.g. Copernicus) jumped by 75.9%, earning €1.397 billion from €794 million in 2015, turn-over in Navigation and telecommunications systems decreased in 2016. Turnover in navi-gation systems decreased by 51.5% to €194 million from €400 million in 2015, while turn-
92 Ibid. at 18.
over from telecommunication systems de-creased by 5.7% to €706 million from €749 million in 2015.92
In launcher development and production, it should be noted that European launcher devel-opments are funded almost exclusively by

ESPI Report 63 44 September 2017
ESA. In 2016, expenditure on launcher devel-opment activities appears to have increased to close to €900 million from €600 million in 2015, while operational launcher systems and parts turnover seemed to lower to €900 million in 2016 from just under €1 billion in 2015.93
Next, scientific programmes in turnover in-crease by 3.3% to €1.085 billion in 2016 from €1.061 billion in 2015, mainly due to an in-crease in human space infrastructure spending which offset the decrease in turnover in sci-ence and exploration segments.94
93 Ibid. at 16. 94 Ibid. at 18.

Space Policies, Issues and Trends in 2016–2017
ESPI Report 63 45 September 2017
3. Space Industry Evolutions
This chapter focuses on major developments among companies within the space industry. The year-end results of major launch compa-nies, satellite operators, and satellite prime
contractors, and other competitors are pro-vided, along with elaboration on notable achievements within the industry. Segments within each geographical region are also grouped to establish a basis for comparison.
Figure 3.1: Compilation of Financial Results for Chapter 3 (all results are converted to euros)

ESPI Report 63 46 September 2017
3.1 Europe
At the end of 2016, Arianespace reported its revenue to be €1.4 billion annually, and while operating profit was not disclosed for the year, it was expected to break even when counting €100 million in price support from ESA. Ari-anespace conducted 11 launches in 2016, in-cluding 7 Ariane 5 launches (i.e. 6 Ariane 5 ECA and 1 Ariane 5 ES), 2 Europeanized Soyuz launches, and 2 Vega launches. These launches orbited 27 satellites in total, includ-ing 10 geostationary telecommunications sat-ellites, 7 EO satellites, 6 navigation satellites, 1 scientific satellite, and 3 cubesats. Ari-anespace also won 13 new launch contracts in 2016, valued at slightly more than €1 billion, including 9 Ariane 5 contracts, 2 Vega con-tracts, and 2 new contracts for the European-ized Soyuz launcher. Moreover, it has a back-log of 55 launches at the end of 2016, valued at €5.2 billion, and has 12 launches planned for 2017.95 Moreover, following the confirma-tion of the Vega C and Ariane 6 programmes in 2016, whose inaugural flights are expected in 2019 and 2020, Arianespace is now prepar-ing the first offers for these two launchers. And despite the change of its governance struc-ture, with Airbus Safran Launchers as the ma-jority shareholder in Arianespace with a 74% stake, Arianespace will continue to be a full-fledged company acting as the single point-of-contact for its customers at each stage of their contractual and operational relationship.
ASL’s first priority in developing the Ariane 6 launcher is to reduce the cost of launching a heavy telecomm satellite to geostationary transfer orbit by 50% in comparison to the Ar-iane 5.96 In addition to its modernized and simpler design, and the reshaped role of in-dustry, expenditures on the Ariane 6 will be 95 “Building on its 2016 successes, Arianespace looks to the future with confidence at the service of its customers.” 4 Jan. 2017. Arianespace 22 Aug. 2017 <http://www.ari-anespace.com/press-release/building-on-its-2016-suc-cesses-arianespace-looks-to-the-future-with-confidence-at-the-service-of-its-customers/>. 96 De Selding, Peter B. “ESA Approval Paves Way for Ari-ane 6, Vega-Contracts.” 17 July 2015. SpaceNews 13 Jan. 2016 <http://spacenews.com/esa-approval-paves-way-for-ariane-6-vega-contracts/>. 97 De Selding, Peter B. “ESA Inks $3.8 Billion in Contracts for Ariane 6, Vega-C and Spaceport Upgrades.” 12 Aug. 2015. SpaceNews 5 Jan. 2016 <http://space-news.com/esa-inks-3-8-billion-in-contracts-for-ariane-6-vega-c-and-spaceport-upgrades/>. 98 De Selding, Peter B. “With Revenue Looking Up, Ari-anespace Seeks To Bring Ariane 5 Costs Down.” 21 Oct. 2015. SpaceNews 13 Jan. 2016 <http://space-news.com/with-revenue-looking-up-arianespace-seeks-to-bring-ariane-5-costs-down/>. 99 Gallois, Dominique. “Ariane 6, un chantier européen pour rester dans la course spatiale.” 1 Dec. 2014. Le
reduced by integrating the launcher horizon-tally; a notable departure from the vertical in-tegration of previous Ariane launchers.97 Ca-pable of lifting two telecom satellites with a combined mass of 9,500 kg to geostationary transfer orbit at a total cost of around €90 mil-lion, the 64 configuration of the Ariane 6 with four boosters will be sold for €96.34 million per launch (or €48.17 million per customer).98 The 62 configuration of the Ariane 6 with two boosters for small satellites will cost around €75 million.99
Eutelsat earned €1.529 billion in revenue for the year ending 30 June 2016, an increase of 3.6% from the €1.476 billion earned in 2015. Its EBITDA increased by 2.9% to €1.165 billion (representing 76.2% of revenue) by mid-2016 from €1.132 billion (76.7% of revenue) in mid-2015. And while its operating profit had nom-inal growth at €662.0 million by mid-2016 from €661.5 million in mid-2015, its net profit decreased by 1.9% amounting to €348.5 mil-lion from €355.2 million in the previous year.100 The share of revenue generated from European regions continued to decrease, this time to 56.1% from 59.0% in 2015, while rev-enue was on the uptick in all other regions; i.e. Americas (21.6%), Middle East (13.3%), Af-rica (6.3%), Asia (2.6%), and Other (0.1%).101 Moreover, in Eutelsat’s first half 2016-2017 results, it earned €755 million, down 2.5% from €774.4 million in the previ-ous year. And Eutelsat’s order backlog of guar-anteed long-term satellite capacity contracts had decreased from €5.6 billion by mid-2016 to €5.3 billion at the end of the year.102 During its fiscal-year, Eutelsat had successfully launched five satellites: two to address the Af-rican broadband market (Eutelsat 8 West B and Eutelsat 36C), along with three more sat-ellites to replace and increase capacities in Eu-rope and the Americas.103 Eutelsat, in collabo-
Monde 9 Mar. 2016 <http://www.lemonde.fr/economie/article/2014/12/01/les-europeens-s-appretent-a-mettre-ariane-6-en-chantier_4532259_3234.html>. 100 “EUTELSAT COMMUNICATIONS FULL YEAR 2015-16 RESULTS.” 29 July 2016. Eutelsat 3 July 2017 <http://news.eutelsat.com/pressreleases/eutelsat-commu-nications-full-year-2015-16-results-1497983>. 101 Reference Document 2015-2016. 1 Sept. 2016. Eutel-sat 3 July 2017: 157 <http://www.eutelsat.com/files/contrib-uted/inves-tors/pdf/AG2016/Eutelsat%20Communications%20Reference%20Document%202015-2016.pdf>. 102 Press Release. “Eutelsat Communications First Half 2016-2017 Results.” 9 Feb. 2017. Eutelsat 4 July 2017 <http://news.eutelsat.com/pressreleases/eutelsat-commu-nications-first-half-2016-2017-results-1794262>. 103 “EUTELSAT COMMUNICATIONS FULL YEAR 2015-16 RESULTS.” 29 July 2016. Eutelsat 3 July 2017 <http://news.eutelsat.com/pressreleases/eutelsat-commu-nications-full-year-2015-16-results-1497983>.

Space Policies, Issues and Trends in 2016–2017
ESPI Report 63 47 September 2017
ration with Facebook, had also expected to in-crease its African coverage with the Amos-6, having leased its Ka-band capacity from Is-rael’s Spacecom in October 2015; however, following the loss of the Amos-6 satellite in the pre-launch failure of the Falcon 9 launcher in September 2016, it secured Ka-band capacity from Yahsat to launch its African broadband initiative in the first half of 2017.
SES earned €2.069 billion in revenue for the year ending 31 December 2016, an increase of 2.7% from €2.014 billion earned in 2015. Its EBITDA lowered by 2.9% to €1.452 billion (70.2% of revenue) in 2016 from €1.494 bil-lion (74.2% of revenue) in 2015. And operat-ing profit grew by 47.1% to €1.316 billion in 2016 from €894.6 million in 2015, which came from a €495.2 million gain on disposal of non-controlling equity interest prior to the full con-solidation of O3b on 1 August 2016. Moreover, its backlog of guaranteed long-term satellite capacity contracts for the year grew to €8.1 billion in 2016 from €7.4 billion in 2015. SES plans to launch SES plans to launch six new satellites in 2017; moreover, it plans to add 8 new satellites to O3b’s unique high throughput and low latency MEO constellation beginning in 2018.104
Intelsat earned $2.188 billion in revenue for the year ending 31 December 2016, a de-crease of 7.0% from the $2.352 billion earned in 2015. Its adjusted EBITDA for 2016 de-creased by 10.9% to $1.651 billion (75.4% of revenue) in 2016 from $1.854 billion (78.8% of revenue) in 2015. Moreover, while its oper-ating profit grew to $920.6 million in 2016 from a negative balance of $3.028 billion in 2015, its net profit reached $990.2 million in 2016, from a net loss of $3.933 billion in 2015. And its contracted backlog representing future revenue under existing contracts with custom-ers reached $8.7 billion in 2016 from $9.4 bil-lion in 2015, reflecting a lowering of overall net new contracts. Intelsat’s first Epic Next Gen-eration high throughput satellite, Intelsat 29e, was launched into geostationary orbit on 27 January 2016. Its Intelsat 33e and Intelsat 36 satellites were launched on 24 August 2016; while the Intelsat 36 satellite entered into ser-vice in the following month, a malfunction in Intelsat 33e’s primary thruster for orbit raising caused its service to be delayed until the be-ginning of 2017. Intelsat also plans to launch
104 “SES Annual report 2016 – New Accelerations.” 6 Apr. 2017. SES 22 Aug. 2017 <https://www.ses.com/sites/de-fault/files/2017-04/SES_AP_A4_EN_web.pdf>. 105 “Intelsat Announces Preliminary Fourth Quarter and Full Year 2016 Results.” 28 Feb. 2017. Intelsat 5 July 2017 <http://www.intelsat.com/wp-content/uploads/2017/03/In-telsat4Q2016EarningsRelease2.29.17.pdf>. 106 “HISPASAT increased its total revenue by 4.2% in 2016.” 24 Mar. 2017. HISPASAT 27 June 2017
additional Epic NG satellites in 2017, i.e. Intel-sat 32e in the first quarter of 2017, Intelsat 35e in the second, and Intelsat 37e in the third.105
HISPASAT earned €228.9 million in revenue for the year ending 31 December 2016, an in-crease of 4.2% from the €219.6 million earned in 2015. Its EBITDA had lowered by 1.8% to €175.7 million (76.8% of revenue) in 2016 from €178.9 million (81.5% of revenue) in 2015, due to extraordinary expenditures for third-party capacity to provide service from the 36° West position until the Hispasat 36W-1 satellite arrives at its orbital position in mid-2017. Moreover, while operating profit grew by 8.1% reaching €99.9 million in 2016 from €92.4 million in 2015, HISPASAT’s net profit decreased by 59.9% to €25.1 million in 2016 from €62.6 million in 2015; without the ex-traordinary expenses, its net profit would have otherwise increased by 33.4% to €79.1 mil-lion. And its backlog of guaranteed long-term satellite capacity contracts reached €1.485 bil-lion in 2016, i.e. 6.5 times the annual revenue, a leader in the sector. Its revenue from space capacity rentals also grew by 4.2%, reaching €225.5 million in 2016 from €216.4 million in 2015; this year 64.6% of the revenue came from clients in the Americas, while 35.4% came from leasing space capacity to clients in Europe and North Africa.106
Telenor Satellite Broadcasting of Norway, a subsidiary of the Telenor Group, changed its name to Telenor Satellite on 25 January 2016.107 Telenor Satellite earned 955 million kroner (€105.1 million) in revenue for the year ending 31 December 2016, a 5.6% decrease from the 1.012 billion kroner (€105.8 million) earned in 2015, mainly due to declining prices in the data communication market and the ter-mination of a satellite uplink contract in the fourth quarter of 2015. Its EBITDA decreased by 3.0% to 650 million kroner (€71.5 million) (68% of revenue) in 2016 from 670 million kroner (€70.0 million) (66.2% of revenue) in 2015, as the revenue reduction was partly compensated by lower capacity lease and op-erating costs. Moreover, its operating profit decreased by 19.3% reaching 313 million kro-ner (€34.4 million) in 2016 from 388 million kroner (€40.6 million) in 2015.108 It should be noted that total broadcasting revenue (includ-ing Nordic DTH subscribers and households in
<http://www.hispasat.com/en/press-room/press-re-leases/archivo-2017/257/hispasat-increased-its-total-reve-nue-by-42-in-2016>. 107 “Telenor Satellite Broadcasting becomes Telenor Satel-lite.” 25 Jan. 2016. Telenor Satellite 27 June 2017 <http://www.telenorsat.com/news/telenor-satellite-broad-casting-becomes-telenor-satellite/>. 108 Q4-2016. Interim report January – December 2016. 31 Jan. 2017. Telenor Group 27 June 2017: 10

ESPI Report 63 48 September 2017
SMATV networks, revenues from satellite ser-vices, revenues from terrestrial radio and TV transmission and sale of encryption and con-ditional access services for TV distribution) in-creased by 1.8% to 6.186 billion kroner (€680.8 million) from 6.076 billion kroner (€635.04 million) in 2015.109
Inmarsat earned $1.329 billion (€1.261 bil-lion) in revenue for the year ending 31 Decem-ber 2016, an increase of 4.3% from $1.274 billion (€1.17 billion) in 2015. Its EBITDA in-creased by 9.5% to $794.8 million (€754.27 million) (59.8% of revenue) from $726.0 mil-lion (€664.41 million) (57.0% of revenue) in 2015. Its operating profit increased by 4.8% reaching $447.1 million (€424.30 million) in 2016 from $426.4 million (€390.23 million) in 2015. About 91.0% of that revenue came from its wholesale Mobile Satellite Services (MSS) and other revenue & terminals, amounting to $1.210 billion (€1.15 billion); the remaining 9.0% came from the Ligado Agreement (for-merly the LightSquared Cooperation Agree-ment) which earned $119.4 million (€113.31 million) in 2016. While Inmarsat’s revenue from its five business units increased by 4.3% to $1.329 billion (€1.26 billion) in 2016, its revenue growth in Government, increasing by 15.3% to $330.5 million (€313.65 million), and Aviation which grew by 12.5% to $142.6 million (€135.33 million) was offset by de-creases in Maritime by 3.0% to $575.3 million (€545.97 million), Enterprise 9.3% to $144.6 million (€137.23 million), and Central Services by 14.4% to $16.6 million (€15.75 million) as a result of challenging markets and a decline in legacy product revenue.110
The Airbus Group’s Airbus Defence and Space (Airbus D&S) division (including Military Air-craft; Space Systems; and Communications, Intelligence & Security (CIS)) earned €11.854 billion in revenue for the year ending 31 De-cember 2016, a decrease of 9.4% from the €13.080 billion earned in 2015; with 31% of that revenue coming from its space systems business line (around €3.674 billion). Its
<https://www.telenor.com/wp-content/up-loads/2017/01/Telenor-Group-Q4-2016-Report-c56b3b5ec5fb3b727eaef25c56a63814.pdf> 109 Annual Report 2016. 29 Mar. 2017. Telenor Group 27 June 2017: 89 <https://www.telenor.com/wp-content/up-loads/2017/03/Annual-Report-2016-Q-960dfcfa007ceee404c193b48ad20cff.pdf>. 110 “Inmarsat plc reports Preliminary Full Year Results 2016.” 8 Mar. 2017. Inmarsat 28 June 2017 <http://inves-tors.inmarsat.com/wp-content/uploads/2017/02/FY16-results-announcement-final.pdf>. 111 Derived from EBIT + depreciation and amortisation; “Fi-nancial Statements 2016.” 17 June 2017. Airbus 30 June 2017: 27 <http://company.airbus.com/dam/assets/air-busgroup/int/en/investor-relations/docu-ments/2017/AGM/Financial-Statements-2016-
EBITDA dropped to €390 million (3.3% of rev-enue) in 2016 from €1.39 billion (10.6% of revenue) in 2015111; likely coming from the negative impact from a parameter change in its portfolio reshaping as its Airbus Safran Launchers 50:50 joint venture became fully operational on 30 June 2016. Meanwhile, its operating profit (adjusted EBIT) had de-creased by 4.7% to €1.002 billion in 2016 from €1.051 billion in 2015, and while its order backlog fell by 3.2% to €41.499 billion in 2016 from €42.861 billion in 2015, its order intake for 2016 grew by 6.6% to €15.393 billion from €14.440 billion in 2015.112 Its telecom and Earth observation, navigation and science sat-ellites showed particular success in 2016, with ESA ordering two Sentinel-2 Earth observation satellites, and Eutelsat’s appointment of Air-bus D&S as the co-prime contractor with ESA for the first Quantum satellite contract, which will be the first satellite capable of adapting its coverage, bandwidth, power and frequency, and its orbital position according to changing customer requirements.
The Thales Group’s Aerospace segment, which includes its Avionics and Space Global Busi-ness Units e.g. Thales Alenia Space and Tele-spazio under its Space Alliance strategic part-nership with Finmeccanica, earned €5.812 bil-lion in revenue for the year ending 31 Decem-ber 2016, an increase of 7.9% from €5.387 billion earned in 2015. Its EBITDA increased by 10.7% to €753.8 million (12.8% of reve-nue) in 2016 from €681.1 million (12.4% of revenue) in 2015.113 And its operating profit increased by 10.2% to €571 million in 2016 from €518 million in 2015, while the Aero-space segment’s order backlog grew to €9.914 billion in 2016 from €9.779 billion in 2015.114 In 2016, Thales Alenia Space entered into a contract with SES to build its SES-17 telecom-munications satellite aimed for the MSS mar-ket; this is the second contract for Thales Ale-nia Space’s all-electric Spacebus NEO satellite platform, and will provide flexible connectivity services, optimised for commercial aviation, over the Americas. Thales Alenia Space also
FINAL0/Airbus%20Financial%20Statements%202016.pdf>. 112 “Annual Report 2016.” 17 June 2017. Airbus 30 June 2017: 27 <http://company.airbus.com/dam/assets/air-busgroup/int/en/investor-relations/docu-ments/2017/AGM/Airbus-Annual-Report-2016/Airbus%20Annual%20Report%202016.pdf>. 113 Derived from EBIT + Depreciation and amortisation of property, plant and equipment and intangible assets; “2016 Registration Document Including the Annual Financial Re-port.” 1 Jan. 2017. Thales 29 June 2017: 36 <https://www.thalesgroup.com/sites/default/files/asset/doc-ument/thales_ddr_2016_va.pdf>. 114 “2016 Registration Document Including the Annual Fi-nancial Report.” 1 Jan. 2017. Thales 29 June 2017: 36 <https://www.thalesgroup.com/sites/default/files/asset/doc-ument/thales_ddr_2016_va.pdf>.

Space Policies, Issues and Trends in 2016–2017
ESPI Report 63 49 September 2017
entered into a phase B contract with LeoSat Enterprise for the development of an 80-120 LEO constellation of satellites offering very high-speed broadband, at a low latency and secure global connectivity. In Earth observa-tion, it signed a contract with ESA and the EU to build the C and D models of the Sentinel 3A environmental monitoring satellite under the Copernicus programme. And in the field of navigation, the European Commission awarded it with a contract to provide system engineering and operational support services for the Galileo programme. Thales Alenia Space also entered into an export contract with the Korea Aerospace Research Institute (KARI) to provide the Korean Augmentation Satellite System, based on its previously de-veloped EGNOS system. And in science and exploration, Thales Alenia Space has con-tracted with Orbital ATK to supply nine addi-tional pressurized cargo modules for resupply missions to the ISS, and ESA awarded it the final contract of the ExoMars programme for its 2020 mission.115
OHB AG earned €728.39 million in total reve-nue for the year ending 31 December 2016, a slight decrease of 0.3% from €730.38 million earned in 2015. Its EBITDA increased by 5.6% to €55.08 million (7.6% of revenue) in 2016 from €52.13 million (7.1% of revenue) in 2015. And operating profit grew by 6.2% to €42.70 million in 2016 from €40.21 million in 2015. Moreover, while OHB’s Space Systems business unit had generated €559.5 million of the revenue, its order backlog stood at €1.341 billion as at the end of 2016. OHB System de-livered HISPASAT’s Hispasat 36W-1 satellite to Europe’s Kourou spaceport in early December 2016; the spacecraft marked its first GEO communications satellite, and it is also OHB’s first satellite to be assembled using its modu-lar SmallGEO platform - which is capable of many different configurations to address the needs of institutional and commercial custom-ers in telecommunications and Earth observa-tion. Moreover, six additional OHB-built Galileo FOC satellites were launched in 2016, includ-ing four simultaneously delivered to orbit by an Ariane 5 launcher in November 2016, bringing its total to 14 Galileo FOC in orbit, with eight more to follow in 2017 and 2018. OHB had also made a significant contribution to ESA’s ExoMars’ Trace Gas Orbiter, which successfully reached Mars orbit in October 2016. By the end of 2016, OHB’s staff num-bered 2,298, an increase of 242 personnel;
115 2016 Registration Document Including the Annual Fi-nancial Report.” 1 Jan. 2017. Thales 29 June 2017: 106 <https://www.thalesgroup.com/sites/default/files/asset/doc-ument/thales_ddr_2016_va.pdf>. 116 Annual Report 2016. 20 Mar. 2017. OHB 29 June 2017 <https://www.ohb-system.de/tl_files/sys-tem/pdf/OHB_GB_2016_en_s.pdf>.
the increase was mainly derived from the opening of the OHB “Optics and Science” Space Center in Oberpfaffenhofen, Germany on 18 April 2016, which brought on around 360 employees. About 65.3% of those em-ployees worked in OHB’s Space Systems busi-ness unit, while the remainder worked mainly in other Aerospace and Industrial Products. Moreover, 78.5% of OHB’s employees were based in companies in Germany, while 15.7% were in other parts of Europe, and the remain-ing 5.8% worked in the rest of the world.116
RUAG Space, a subsidiary of the RUAG Group, earned CHF 345 million (€321.25 million) for the year ending 31 December 2016, an in-crease of 11.3% from the CHF 310 million (€286.27 million) earned in 2015. Its EBITDA increased by 6.7% to CHF 48 million (€44.70 million) (13.9% of revenue) in 2016 from CHF 45 million (€41.56 million) (14.5% of revenue) in 2015. And operating profit grew by 33.3% to CHF 32 million (€29.80 million) in 2016 from CHF 24 million (€22.16 million) in 2015, with sales and profits exceeding their perfor-mance targets. RUAG Space is in the midst of its expansion strategy, already showing suc-cess in its launch vehicle business in Europe and the U.S., and participation in all aspects of European space programmes and a focus on commercial product development and indus-trial series production. RUAG Space will de-velop the payload fairing for ASL’s Ariane 6 launcher; it will also produce carbon fibre structures for the U.S. United Launch Alliance’ Atlas 5 and Vulcan launchers, and is also build-ing a production facility in Cape Canaveral, Florida to manufacture up 900 structures in series for the OneWeb constellation led by Air-bus D&S . Moreover, in May 2016, RUAG Space acquired the German company HTS along with its staff, specialising in engineering services and custom-made components for spaceflight. Subsequently, RUAG Space’s presence has expanded from Switzerland, Sweden, Austria, and Finland, to also include the U.S. and Germany. Its staff increased by 53 members to 1,257 employees in 2016.117
3.2 United States
Boeing’s Network & Space Systems segment, under its Defence, Space & Security division, earned $7.046 billion for the year ending 31 December 2016, a decrease of 9.1% from
117 Annual Report 2016. 23 Mar. 2017. RUAG 29 June 2017: 11 <https://annualre-port.ruag.com/sites/ar16/files/media_document/2017-03/RUAG_GB_2016_EN_Web.pdf>.

ESPI Report 63 50 September 2017
$7.751 billion earned in 2015. While its EBITDA was not disclosed in its financial re-sults, its operating earnings decreased by 32.1% to $493 million (7.0% of revenue) in 2016, from $726 million (9.4% of revenue) in 2015. Moreover, its order backlog decreased to $5.1 billion at the end of 2016, from $7.4 billion in 2015.118 Boeing’s Network & Space Systems successfully launched the first of six Boeing-built Intelsat Epic satellites, Intelsat 29e, on the Ariane 5 launcher on 27 January 2016. However, its third quarter performance decreased due to a charge on the Commercial Crew development program - largely driven by delays in completion of engineering and supply chain activities. In the second half of 2016, Boeing was awarded a contract for its 702MP satellite with a new digital payload offering twice the capacity of previous designs; and, its eighth Wideband Global SATCOM satellite was also launched with an upgraded digital pay-load. Boeing’s Network & Space Systems de-livered 7 satellites to customers in 2016, i.e. 5 commercial/civil satellites and 2 military satel-lites.119
Lockheed Martin’s Space Systems segment, whose portfolio includes the development of satellites, strategic and defensive missile sys-tems and space transportation systems (in-cluding its 50% ownership interest in ULA), earned $9.409 billion for the year ending 31 December 2016, an increase of 3.3% from the $9.105 billion earned in 2015. About 13% of the Space Systems revenue earned in 2016 ($1.223 billion) came from satellite products and services, down from 15% of revenue ($1.366 billion) in 2015.120 It should be noted that in 2016 91% of Lockheed Martin’s Space Systems revenue came from U.S. institutional customers, while 5% came from U.S. commer-cial customers, and the remaining 4% came from international customers. While its EBITDA was not disclosed in its financial re-sults, its total Space Systems operating earn-ings increased by 10.1%, to $1.289 billion (13.7% of revenue) in 2016, from $1.171 bil-lion (12.9% of revenue) in 2015. Moreover, its 118 “Boeing Reports Fourth-Quarter Results and Provides 2017 Guidance.” 25 Jan. 2017. Boeing 4 July 2017 <http://investors.boeing.com/investors/investor-news/press-release-details/2017/Boeing-Reports-Fourth-Quarter-Results-and-Provides-2017-Guidance/de-fault.aspx>. 119 “Boeing Reports Fourth-Quarter Results and Provides 2017 Guidance.” 25 Jan. 2017. Boeing 4 July 2017 <http://investors.boeing.com/investors/investor-news/press-release-details/2017/Boeing-Reports-Fourth-Quarter-Results-and-Provides-2017-Guidance/de-fault.aspx>. 120 “Lockheed Martin Reports Fourth Quarter and Full Year 2016 Results.” 24 Jan. 2017. Lockheed Martin 4 July 2017 <http://news.lockheedmartin.com/2017-01-24-Lockheed-Martin-Reports-Fourth-Quarter-and-Full-Year-2016-Re-sults>.
order backlog increased to $18.9 billion at the end of 2016, from $17.4 billion in 2015. Lock-heed Martin’s increase in revenue came mainly from its majority ownership of the AWE Man-agement Limited (AWE) venture (which oper-ates the United Kingdom’s nuclear deterrent programme), and an increase in the volume of sales of its Fleet Ballistic Missiles; and while its commercial space transportation programs earned an additional $150 million due to in-creased launch-related activities, these in-creases in revenue were offset by the decrease in the volume of SBIRS and MUOS satellites ordered for U.S. government satellite pro-grammes.121
The United Launch Alliance (ULA) was granted another exemption for the purchase of 18 RD-180 engines under the National Defense Au-thorization Act for Fiscal Year 2017 (NDAA-17) in addition to the 34 RD-180 engines that were ordered while the NDAA-15 was still pend-ing122, and the 20 more RD-180 engines ULA had ordered 23 December 2015.123 Since ULA uses RD-180 engines for the first stage of its Atlas 5 launcher, the restriction, which fol-lowed Russia’s annexation of Crimea from Ukraine, had limited the launchers’ use before ULA’s follow-on Vulcan launcher - powered by Blue Origin’s BE-4 engine - is ready in 2020. The access to 18 additional engines allows ULA to remain competitive with SpaceX.124
Orbital ATK has three business segments, in-cluding its space-related Space Systems group and Flight Systems group, and its non-space Defense Systems group. Orbital ATK’s Space Systems group earned $1.237 billion in reve-nue for the year ending 31 December 2016, an increase of 6.2% from the $1.165 billion earned in 2015. While its EBITDA is unknown, its operating earnings nearly doubled reaching $129.5 million (10.5% of revenue) in 2016, from $46.5 million (4.0% of revenue) in 2015; the 178.5% increase was primarily due to Or-bital Sciences Corporation’s results prior to its merger with Alliant Techsystems Inc. (ATK) which had been previously excluded when the
121 “2016 Annual Report.” Lockheed Martin 4 July 2017: 6, 43-44 <http://www.lockheedmartin.com/content/dam/lock-heed/data/corporate/documents/2016-annual-report.pdf>. 122 Gruss, Mike. “House-Senate Conference Measure To End Pentagon Use of RD-180.” 5 Dec. 2014. SpaceNews 22 July 2015 <http://spacenews.com/42701house-senate-conference-measure-to-end-pentagon-use-of-rd-180/>. 123 Shalal, Andrea. “ULA Orders 20 More RD-180 Rocket Engines.” 23 Dec. 2015. SpaceNews 14 Jan. 2016 <http://spacenews.com/ula-orders-20-more-rd-180-rocket-engines/>. 124 Gruss, Mike. “HASC doubles Air Force allotment of RD-180 engines, focuses funding on building its replacement.” 28 Apr. 2016. SpaceNews 8 Nov. 2016 <http://space-news.com/the-rd-180-amendment-was-one-of-two-launch-related-provisions-that-made-it-into-the-national-defense-authorization-act-of-2017-by-the-time-the-committee-voted-60-to-2-to-send-the-bill-to-the-full/>.

Space Policies, Issues and Trends in 2016–2017
ESPI Report 63 51 September 2017
merger was adjusted as of 9 February 2015, and from the non-recurrence of profit adjust-ments that took place in 2015. Moreover, its Flight Systems group earned $1.497 billion in revenue for 2016, an increase of 1.8% from $1.497 billion earned in 2015. Its operating earnings decreased by 14.1% to $204.7 mil-lion (13.7% of revenue) in 2016 from $238.3 million (16.2% of revenue), again due to the non-recurring adjustments that had taken place in 2015. By the end of 2016, the Flight Systems group had launched an Antares cargo delivery mission to the ISS, and the successful launch of a Pegasus launcher carrying eight small weather satellites to low Earth orbit for NASA. Orbital ATK’s total backlog for its three segments (Space Systems, Flight Systems, and Defense Systems) increased to $9.34 bil-lion in 2016, from $8.1 billion at the end of 2015.125
DigitalGlobe, the commercial high-resolution Earth observation satellite imagery provider, earned $725.4 million in revenue for the year ending 31 December 2016, an increase of 3.3% from the $702.4 million earned in 2015. Its adjusted EBITDA grew by 7.6% to $382.7 million (52.8% of revenue) in 2016 from $355.7 million (50.6% of revenue) in 2015. Moreover, its operating income increased by 67.9% reaching $102.1 million in 2016 from $60.8 million in 2015, while its net income grew by 13.7% to $26.5 million in 2016 from $23.3 million for 2015.126 DigitalGlobe’s main customer is the U.S. government, accounting for 63.7% ($462.2 million) of its revenue for 2016, another 8.2% ($59.7 million) came from commercial customers in the U.S., and the remaining 28.0% ($203.5 million) came from international customers.127
Following Blue Origin’s historic first successful test flight of its reusable New Shepard subor-bital launcher on 23 November 2015, which conducted a powered vertical landing, while its
125 “Orbital ATK Announces Fourth Quarter and Full Year 2016 Financial Results.” 8 Mar. 2017. Orbital ATK 4 July 2017 <http://www.orbitalatk.com/news-room/PrinterFriendly.asp?prid=229>. 126 DigitalGlobe 2016 Annual Report. 27 Feb. 2017. Digital-Globe 11 July 2017: 29, 41 <http://investor.digital-globe.com/phoenix.zhtml?c=70788&p=irol-reportsannual>. 127 Ibid. at 74. 128 Calandrelli, Emily. “Blue Origin continues successful, record-setting year with another NASA contract.” 6 June 2016. Tech Crunch 1 Sept. 2017 <https://techcrunch.com/2016/06/06/blue-origin-continues-successful-record-setting-year-with-another-nasa-con-tract/>. 129 Richardson, Matthew. “Blue Origin shares construction update for new $205M rocket factory (Photos).” 6 Dec. 2016. Puget Sound Business Journal 1 Sept 2017 <https://www.bizjournals.com/seat-tle/news/2016/12/06/blue-origin-rocket-factory-florida-space-bezos.html>.
unoccupied crew capsule parachuted to a land-ing after separating at its peak, two more suc-cessful flights were conducted in the first half of 2016. Another test flight was already being prepared by mid-2016, which included one in-tentional parachute failure (one of three para-chutes) during the descent of the crew capsule to observe how the capsule will respond in a scenario similar to the Apollo 15 mission in 1971. Blue Origin aims to have its first crewed test flights in 2017 and to conduct commercial services for paying passengers as early as 2018.128 Additionally, Blue Origin also began constructing its rocket manufacturing facility in Florida, USA, in June 2016. Valued at $205 million, the facility will be complete by the end of 2017; Blue Origin aims to orbital vehicles from launch complex 36 in Cape Canaveral within the next decade.129 And while financial details of Blue Origin is not available since the company is privately funded, its owner Jeff Be-zos stated that he sells $1 billion of shares of Amazon stock each year to put toward Blue Origin.130
While SpaceX is a privately held company whose financial performance is normally shrouded from public view, internal docu-ments published by the Wall Street Journal at the beginning of 2017 showed that SpaceX ex-perienced a $260 million loss for 2015. The loss resulted from the explosion of its Dragon commercial resupply mission on 28 June 2015, which also grounded the launch company for the next six months.131 While financial results for 2016 were not disclosed, the explosion of the Falcon 9 on its launch pad on 1 September 2016 and subsequent grounding of the launch company likely resulted in another losing year, as the aerospace company has a thin bottom line that is vulnerable to accidents; the loss is estimated at up to $740 million for the year.132 SpaceX’s revenue for 2015 was $1.3 billion, which came mainly from a $1 billion invest-ment by Google and Fidelity and advance pay-ments. SpaceX expected to earn $55 million in
130 Fernholz, Tim and Christopher Groskopf. “If Jeff Bezos is spending a billion a year on his space venture, he just started.” 12 Apr. 2017. Quartz 1 Sept. 2017 <https://qz.com/956607/jeff-bezos-the-worlds-second-wealthiest-human-isnt-spending-billions-on-his-space-ven-ture-blue-origin/>. 131 Winkler, Rolfe and Andy Pasztor. “Exclusive Peek at SpaceX Data Shows Loss in 2015, Heavy Expectations for Nascent Internet Service.” 13 Jan. 2017. The Wall Street Journal 1 Sept. 2017 <https://www.wsj.com/articles/exclu-sive-peek-at-spacex-data-shows-loss-in-2015-heavy-ex-pectations-for-nascent-internet-service-1484316455> 132 Mosher, Dave. “SpaceX lost a quarter of a billion dollars after one of its rockets blew up.” 13 Jan. 2017. Business Insider 1 Sept. 2017 <http://www.busi-nessinsider.de/spacex-financials-rocket-accident-costs-revenue-2017-1>.

ESPI Report 63 52 September 2017
operating profit following 20 launches in 2016, however it conducted only 8 launches prior to the September 2016 explosion.133 Optimisti-cally, the documents reveal that SpaceX aims to increase its launches from 27 in 2017 to 52 by 2019.134
3.3 Russia
Russia’s Vostochny Cosmodrome conducted its first launch using a Soyuz 2.1a on 28 April 2016.135 Construction of the spaceport is on-going, with the completion of a second pad for its Angara launcher expected in 2021, and five other pads to come.136 From the beginning of 2015, signs already indicated that the space-port would miss its target of being ready be-fore the beginning of 2016. Moreover, there have been many reports of construction being behind schedule, billions of dollars over budget, and cases of embezzlement and the non-payment of workers for months at a time.137 Yet the importance of the Vostochny Cosmodrome for Russia should be stressed, as it will give Russia an alternative launch port to the Baikonur Cosmodrome that has been leased from Kazakhstan since the Soviet Un-ion’s collapse in 1991 at an annual cost of $115 million.138
The Russian Satellite Communications Com-pany (RSCC) and Europe’s Eutelsat and Ari-anespace were caught in the midst of an on-going dispute between the Russian govern-ment and the former shareholders of Russia’s Yukos energy company, following a 2014 rul-ing by an international arbitration panel in The Hague, Netherlands, that awarded the ex-Yu-kos shareholders $50 billion from the Russian government. The ex-Yukos shareholders claim was that government’s illegal discriminatory treatment led to the company’s bankruptcy and dissolution; following the award, the ex-
133 Wang, Brian. “Spacex financials show it is a big startup and the 4000 satellite internet business is the big payday.” 18 Jan. 2017. nextBIGfuture 1 Sept. 2017 <https://www.nextbigfuture.com/2017/01/spacex-finan-cials-show-it-is-big.html>. 134 Racke, Will. “SpaceX financial records show huge loss in 2015 due to rocket explosion.” 13 Jan. 2017. L.A. BIZ 1 Sept. 2017 <https://www.bizjournals.com/losange-les/news/2017/01/13/spacex-financial-records-show-huge-loss-in-2015.html>. 135 “Russia’s brand new cosmodrome launches first-ever rocket.” 28 Apr. 2016. RT 15 Aug. 2017 <https://www.rt.com/news/341192-vostochny-cosmo-drome-first-launch/>. 136 Haines, Lester. “First rocket finally departs Russia's Vostochny cosmodrome.” 28 Apr. 2016. The Register 15 Aug. 2017 <https://www.theregister.co.uk/2016/04/28/vos-tochny_launch/>. 137 Eremenko, Alexey and Alexander Smith. “Vostochny Cosmodrome: Russian Space Project Isn’t Going to Plan.”
Yukos shareholders sought to collect govern-ment assets in legal environments outside of Russia, including France and Belgium, were they were able to freeze payments by Eutelsat to RSCC, and by Arianespace to Roscosmos. On 12 April 2016, a court in Evry, France found that a €300 million payment owed by Ari-anespace to Roscosmos did not directly belong to the Russian government and should not be held hostage in the Yukos legal action. Another decision issued on 15 April 2016 from the Tri-bunal de Grande Instance of Paris, also lifted the ex-Yukos shareholders’ freeze on €400 million owed by Eutelsat to RSCC, based on a similar ruling.139 Eutelsat made its first pay-ment of €70 million to RSCC on 23 November 2016 following a further court ruling that omit-ted restrictions on making payments. How-ever, the ruling involving the €300 million owed by Arianespace and Roscosmos was still in the appeals process. On 21 October 2016, the Russian government sent a formal warning to the French government wanting a resolution of the Roscosmos payment by March 2017, or else Russia would take France to court for vio-lating a 1989 bilateral treaty and other Euro-Russian space projects would be at risk if the stalemate continued.140
3.4 Japan
Mitsubishi Electric Co. (Melco) of Japan devel-ops satellites within its Information and Com-munication Systems (ICS) business segment; however, as this segment does not separate satellite-related revenue from its telecommu-nication, information systems, and electronic systems business, it should only be seen as generating a small portion of the total revenue earned by this segment. Melco earned ¥4.394 trillion in total revenue for the year ending 31 March 2016, a 1.6% increase from the ¥4.323 trillion earned in 2015. Melco’s ICS segment generated 11.1% of Melco’s total revenue,
31 July 2016. NBC News 16 Aug. 2017 <http://www.nbcnews.com/science/space/vostochny-cos-modrome-russian-space-project-isn-t-going-plan-n618846>. 138 Soldatkin, Vladimir. “Putin orders building hastened at new Russian spaceport.” 27 Aug. 2014. Reuters 16 July 2015 <http://www.reuters.com/article/2014/09/02/us-rus-sia-space-idUSKBN0GX1AV20140902>. 139 De Selding, Peter B. “French court rulings ease threat to Arianespace, Eutelsat business in Russia.” 18 Apr. 2016. SpaceNews 10 Nov. 2016 <http://space-news.com/french-court-rulings-ease-threat-to-arianespace-eutelsat-business-in-russia/>. 140 De Selding, Peter B. “Eutelsat, freed by Paris court rul-ing, makes overdue payment on $424 million RSCC con-tract.” 28 Nov. 2016. SpaceNews 4 Jan. 2017 <http://spacenews.com/eutelsat-freed-by-paris-court-rul-ing-pays-russias-rscc-long-due-424-million/>.

Space Policies, Issues and Trends in 2016–2017
ESPI Report 63 53 September 2017
earning ¥561.119 billion in 2016. While reve-nues from Melco’s ICS segment had steadily increased over the past five years, its growth was flat in 2016, from the ¥559.521 billion earned in 2015. Its operating income de-creased by ¥3.9 billion to ¥14.9 billion (2.7% of revenue) primarily due to a shift in its pro-ject portfolios of large-scale projects in the de-fence systems business, however its electronic systems business saw an increase in orders for large-scale projects in the space business. Ad-ditionally, 57.4% of Melco’s total revenue for 2016 came from customers in Japan, while other Asian countries accounted for 21.9%, North America 10.2%, Europe 8.4%, and oth-ers 2.1%.141
With four decades of experience in developing communication subsystems, NEC Corporation of Japan is entering into satellite integration. Its satellite-related revenue is within its Public Business segment under its other Major Prod-ucts and Services, and includes systems inte-gration, maintenance and support, outsourc-ing/cloud services, and system equipment; hence, its satellite-related business should only be seen as generating a small portion of the total revenue earned by this segment.142 NEC earned ¥2.821 trillion in total revenue for the year ending 31 March 2016, a 3.9% de-crease from the ¥2.936 trillion earned in 2015. NEC’s Public Business segment generated 27% of its total revenue, earning ¥766.8 bil-lion in 2016. However, the segment’s revenue decreased by 6.7% from the ¥821.9 billion earned in in 2015, mainly due to decreased sales from large-scale projects for governmen-tal agencies and public services. Its operating income decreased by 23.1%, reaching ¥57.5 billion in 2016 from ¥74.8 billion in 2015. Ad-ditionally, 78.6% of NEC’s total revenue for 2016 came from customers in Japan, while China and other Asia Pacific (APAC) countries accounted for 9.4%, the Americas for 7.1%, and Europe, the Middle East and Africa (EMEA) for 4.9%.143
3.5 China
AsiaSat of Hong Kong earned HK$1.272 billion for the year ending 31 December 2016, a de-crease of 3.0% from the HK$1.311 billion
141 2016 Annual Report – For the year ended March 31, 2016. 26 July 2016. Mitsubishi Electric 13 July 2017 <http://www.mitsubishielectric.com/company/ir/library/an-nual_report/pdf/ar2016.pdf>. 142 “Annual Report 2016 – Year ended March 31, 2016.” 1 July 2016. NEC 13 July 2017 <http://www.nec.com/en/global/ir/pdf/annual/2016/ar2016-e.pdf>. 143 “Annual Report 2016 (Financials) – Year ended March 31, 2016.” 18 Sept. 2016. NEC 13 July 2017
earned in 2015. Its gross profit decreased by 12.0% to HK$645.0 million (50.7% of reve-nue) in 2016 from HK$732.8 million (55.9% of revenue) in 2015. Meanwhile, operating profit decreased by 16.0% reaching HK$511.3 mil-lion in 2016 from HK$608.7 million in 2015, and profit attributable to owners decreased by 2.3% to HK$430 million in 2016 from HK$440 million in 2015.144 In 2016, AsiaSat’s fleet of five in-orbit satellites (AsiaSat 4, 5, 6, 7, and 8) performed nominally, while its AsiaSat 3S, launched in 1999, remained operational and provided services to customers for short-term contracts. By January 2016, AsiaSat had suc-cessfully regained access to the China video market with its AsiaSat 6 satellite after receiv-ing full regulatory approval in China; Asiasat had exited China’s market in 2007. Moreover, AsiaSat signed a four-year utilization agree-ment with the Israel-based Spacecom in De-cember 2016, where it will relocate its AsiaSat 8 satellite to replace the capacity shortfall cre-ated by the loss of the Amos 6 satellite in Sep-tember 2016, with service expected to com-mence at the end of February 2017.145
Two additional DFH-4 telecommunication sat-ellites were launched into orbit in 2016: Belintersat 1 on 15 January 2016, sold by CASC’s China Great Wall Industry Corporation (CGWIC) commercial arm to Belarus in a con-tract signed in 2011146; and Shijian 17 on 3 November 2016 as an experimental geosta-tionary satellite to test new technologies and components, including solar cells, green pro-pellant, and to observe orbital debris at high altitudes, possibly with proximity opera-tions.147 Of the 17 DFH-4 commercial satellites that have been launched since the platform’s development in 2006, CGWIC has sold 9 to in-ternational customers; it plans 10 more DFH-4 spacecraft in the coming years.
3.6 India
ISRO’s Antrix commercial arm earned ₹1,923.63 crore in revenue for the year ending 31 March 2016, an increase of 3.4% from ₹1,860.71 crore earned in 2015. Its gross profit decreased slightly by 0.5%, reaching ₹324.07 crore (16.8% of revenue) in 2016 from ₹325.83 crore (17.5% of revenue) in
<http://www.nec.com/en/global/ir/pdf/an-nual/2016/ar2016_fin.pdf>. 144 2016 Annual Report. 31 Dec. 2016. AsiaSat 11 July 2017: 62 <http://www.asiasat.com/sites/de-fault/files/E01135_AR_0421_0656.pdf>. 145 Ibid. at 6,7. 146 “Belintersat 1 (ZX 15, ChinaSat 15).” 2 June 2017. Gun-ter’s Space Page 7 Aug. 2017 <http://space.sky-rocket.de/doc_sdat/belintersat-1.htm>. 147 “SJ 17.” 26 June 2017. Gunter’s Space Page 7 Aug. 2017 <http://space.skyrocket.de/doc_sdat/sj-17.htm>.

ESPI Report 63 54 September 2017
2015, while net profit increased by 2.0% to ₹209.64 crore in 2016 from ₹205.50 crore in 2015. Antrix earned around ₹230 crore in 2016 through commercial launch services148; and by the end of the fiscal reporting year, the PSLV launcher had successfully lifted a total of 57 international customer satellites from 21 countries into orbit.149
3.7 Rest of the World
Canada’s MacDonald, Dettwiler and Associates (MDA Corp.) earned C$2.064 billion for the year ending 31 December 2016, a decrease of 2.5% from C$2.117 billion earned in 2015. Its EBITDA decreased by 1.6% to C$370.7 million (18.0% of revenue) in 2016 from C$376.8 mil-lion (17.8% of revenue) in 2015. And operat-ing profit decreased by 4.6% to C$211.0 mil-lion in 2016 from C$221.1 million in 2015. Moreover, its net profit decreased by 2.2% to C$139.6 million in 2016 from $142.8 million in 2015, while its order backlog also decreased to C$2.386 billion in 2016 from 2.887 billion in 2015.150 MDA Corp. has two operating seg-ments in its annual report; i.e. Communica-tions, and Surveillance and Intelligence. Its Communications segment earnings decreased by 4.4% to C$1.442 billion (69.9% of total revenue) in 2016, with an EBITDA of C$213.3 million (14.8% of Communications revenue); its revenue was impacted by the low number of GEO communication satellite contracts awarded in 2016 and 2015, which is expected to continue until the communication satellite market rebounds in 2017-2018. Its Surveil-lance and Intelligence segment earnings in-creased by 2.1% to C$622.2 million (30.1% of total revenue) in 2016, with an EBITDA of C$157.4 million (25.3% of Surveillance and Intelligence revenue); the increase was mainly due to the timing of subcontract activity on larger programmes and from increased con-tracts in the emerging market sector. In 2016, MDA Corp. booked orders to build four GEO communications satellites, and it signed a con-tract with OneWeb Satellite to build 3600 com-munication antenna subsystems for integra-tion on the satellite constellation. Moreover,
148 “Antrix earned Rs 230 crore during 2015-16 through commercial launch services.” 27 July 2016. Indiantelevi-sion.com 13 July 2017 <http://www.indiantelevi-sion.com/satellites/satellite-launches/antrix-earned-rs-230-crore-during-2015-16-through-commercial-launch-ser-vices-160727>. 149 “Annual Report 2015-16.” 15 Jan. 2017. Antrix 13 July 2017 <http://www.antrix.gov.in/sites/default/files/article-at-tachments/2015-16-English.pdf>. 150 “MDA 2016 Annual Report – A Global Communications and Information Company.” 23 Feb. 2017. MDA 5 July 2017: 1 <http://mdacorporation.com/docs/default-source/corporate/investor/financial-reports/mda_2016_an-nualreport.pdf>.
eleven of the geostationary satellites that were launched in 2016 were built by MDA Corp. and its subsidiaries; it was also awarded several contracts from the U.S. government space and defence markets.151
Com Dev International (Com Dev) was fully acquired by Honeywell International Inc. in February 2016, in an arrangement valued at $347 million. Prior to its acquisition, the Cana-dian satellite and space components provider had been coping with fewer tax incentives and a drought of U.S. institutional orders that pushed it to close its facilities in California and bid on U.S. military contracts from Canada; it had also tried to tap the UK’s high-growth space market with acquisitions of MESL Hold-ings and MESL Microwave of Scotland. Com Dev earned $159 million in revenue for the fis-cal year-ended 31 October 2015.152 In the year prior to its acquisition, Com Dev had re-ported total revenue of C$208.2 million for the fiscal year-ended 31 October 2014, down 3.4% from C$215.5 million in 2013.153
Canada’s exactEarth Ltd., spun-off in Novem-ber 2015 from Com Dev during its acquisition by Honeywell, saw sharply lower earnings in its first year as a standalone company in 2016. It earned C$18.9 million for the year ending 31 October 2016, a decrease of 28.9% from C$26.6 million earned in 2015. Its adjusted EBITDA dropped by 94.2% to C$520 thousand (2.7% of revenue) in 2016 from C$9.033 mil-lion (34.0% of revenue) in 2015. And operat-ing profit decreased by 44.5% to C$9.146 mil-lion from C$16.486 million. Moreover, exact-Earth’s net loss dropped to C$35.963 million in 2016, from a loss of C$1.055 million in 2015, due mainly to the impairment and write-down of assets and restructuring of the busi-ness in 2016; without these charges, its net loss would have shrunk to $C7.8 million for 2016. The decrease in revenue for 2016 was due to a lower than expected renewal contract with the Canadian government for exact-Earth’s Automatic Identification System (AIS), which provides maritime traffic information, and the non-recurring sale of historical AIS data to its alliance partner, Harris Corp. More-
151 “MDA 2016 Annual Report – A Global Communications and Information Company.” 23 Feb. 2017. MDA 5 July 2017: 14-18 <http://mdacorporation.com/docs/default-source/corporate/investor/financial-reports/mda_2016_an-nualreport.pdf>. 152 “Honeywell 2016 Annual Report.” 9 Mar. 2017. Honey-well 5 July 2017: 45 <http://www.annualre-ports.com/Click/21194>. 153 “COM DEV Announces Fourth Quarter and Year-End Fiscal 2014 Results.” 15 Jan. 2015. COM DEV Interna-tional 10 Feb. 2015 <http://www.comdev.ca/images/finan-cial-reports/CDV_Q4_14_Financial_Release2.pdf>.

Space Policies, Issues and Trends in 2016–2017
ESPI Report 63 55 September 2017
over, exactEarth expects its revenue to in-crease again after the launch of its second-generation AIS nine-satellite constellation, hosted on Iridium NEXT satellites, beginning in 2017.154
Thailand’s Thaicom earned 11.517 billion Baht in sales and services revenue for the year ended 31 December 2016, a decrease of 7.5% from the 12.453 billion Baht earned in 2015. Its EBITDA decreased by 15.6% to 4.860 bil-lion Baht (40.9% of revenue) in 2016 from 5.758 billion Baht (44.5% of revenue) in 2015. Its operating profit decreased by 35.0% to 1.938 billion Baht in 2016 from 2.981 billion Baht in 2015, and net profit decreased by 24.0% reaching 1.612 billion Baht in 2016 from 2.122 billion Baht in 2015.155 Its satellite and related services amounted to 73.1% of the revenue generated in 2016, down from 74.3% in 2015, Its sales and services revenue
by geographic area came from Thailand (62.6%), Australia (9.4%), India (6.1%), Ja-pan (5.5%), Myanmar (4.6%), China (2.6%), and Others (9.3%); the Indian market had substantial growth with revenue increasing by almost one-third in 2016, while all other geo-graphical areas saw decreases in revenue from the previous year.156 On 20 October 2016, Thaicom’s subsidiary International Satellite Company Limited (ISC) entered into a satellite procurement contract with China Great Wall Industry Corporation (CGWIC) for the con-struction and launch of a telecommunications satellite to strengthen Thaicom’s broadband and mobility services in the Asia-Pacific re-gion. Expected to be launched by the end of 2019 and valued at 7.280 billion Baht ($208 million), all of the satellite’s capacity has been leased to an unknown business partner which has also advanced the funds to pay for the sat-ellite’s construction.157
154 “exactEarth Reports Fiscal 2016 Financial Results.” 19 Jan. 2017. exactEarth 10 July 2017 <http://investors.exact-earth.com/2017-01-19-exactEarth-Reports-Fiscal-2016-Fi-nancial-Results>.
155 “Keep Ahead of the Curve – Annual Report 2016.” 17 May 2017. Thaicom 10 July 2017: 13 <http://thcom.listed-company.com/ar.html>. 156 Ibid. at 74. 157 Ibid. at 64.

ESPI Report 63 56 September 2017
4. European Institutional Market
This chapter analyses institutional space spending in Europe along distinct internal cat-egories. The contributions are explained and contrasted with each other, displaying signifi-cant ratios and proportions regarding Euro-pean space activities, and establishing a basis for comparison with space actors outside Eu-rope.
4.1 Civil ian Space Expenditure
National space budgets in Europe usually en-compass both European and national compo-nents. The former normally consist of contri-butions to the European Space Agency (ESA) and EUMETSAT, and are regarded as civilian for the purposes of this report, as both organ-isations are broadly labelled as civilian despite
the presence of dual-use products and ser-vices. While direct Member State contributions to the European Union do not officially have a space related designation, even prior to the Lisbon Treaty, EU funds have been increas-ingly used to finance space activities, including the two EU flagship programmes Galileo and Copernicus. In this section they are only visi-ble through the ESA budget or are wrapped into the budgets of other actors.
While some European countries are engaged in multinational cooperation through participa-tion in ESA, they may also have bilateral agreements on space activities between them. Through this cooperation, certain security re-lated space projects are funded simultane-ously by European institutions (notably the European Commission and the European De-fence Agency) and by other sources.
Figure 4.1: Estimated European civil public expenditures in 2016.

Space Policies, Issues and Trends in 2016–2017
ESPI Report 63 57 September 2017
Not all European states invest in military and intelligence gathering space activities; and in any event, most institutional spending is di-rected toward civilian activity. The total sum of European institutional spending on space in-creased in 2016, to reach close to €10.757 bil-lion from €8.320 billion in 2015; it should be noted that this increase is likely due to the use of Euroconsult data as an authority, in lieu of Eurospace data, which account for expendi-tures in services. In 2016, total ESA expendi-tures (including contributions from the EU) in-creased by €819.6 million to be €5252.6 bil-lion, while national civil programme expendi-tures are estimated to have increased by a combined total of €1.166 billion to be €3.328 billion. Moreover, total expenditures by the EU is estimated to have increased by €371.1 mil-lion to €1.744 billion, while best estimates of EUMETSAT expenditure saw it increase by a combined €80.6 million to €432.3 million. The share between civilian and military funding is likely to be close to Eurospace’s estimate in 2015, i.e. around 90% civilian and 10% mili-tary. However, Europe’s security-related space activities in both its share-size and amounts invested are still a fraction of what was spent by the U.S.
4.2 European Space Agency
The European Space Agency’s budget in-creased by 9.5% to €5.747 billion in 2017 from €5.253 billion in 2016 (Figure 4.2). The biggest relative change in budget allocation occurred with Human Spaceflight & Robotic Exploration, which increased by 73.4% to €633.0 million, representing 11.0% of the to-tal budget for 2017. Navigation received the second highest relative increase in funding at 65.8%, reaching €1.011 billion; its budget share increased to 17.6%. Meanwhile, Prodex received the largest relative decrease in fund-ing, lowering by 75.5% to €47.2 million and accounting for just 0.8% of total budget; Tel-ecoms & Integrated Applications and Earth ob-servation also saw marginal decreases in fund-ing, while all other programmes increased in 2017. Moreover, funding toward Space Situa-tional Awareness (the second smallest unla-belled box) increased by 17.1% receiving €15 million, while the European Cooperating States Agreement (the smallest unlabelled box) increased by 37.5% to €6 million.158
Figure 4.2: ESA Programmatic Budget Allocations for 2017 (€5.747 billion) (Source: ESA)
158 “ESA budget 2017: by domain.” 16 Jan. 2017. ESA 25 Aug. 2017 <http://www.esa.int/spaceinimages/Im-ages/2017/01/ESA_budget_2017_by_domain>.
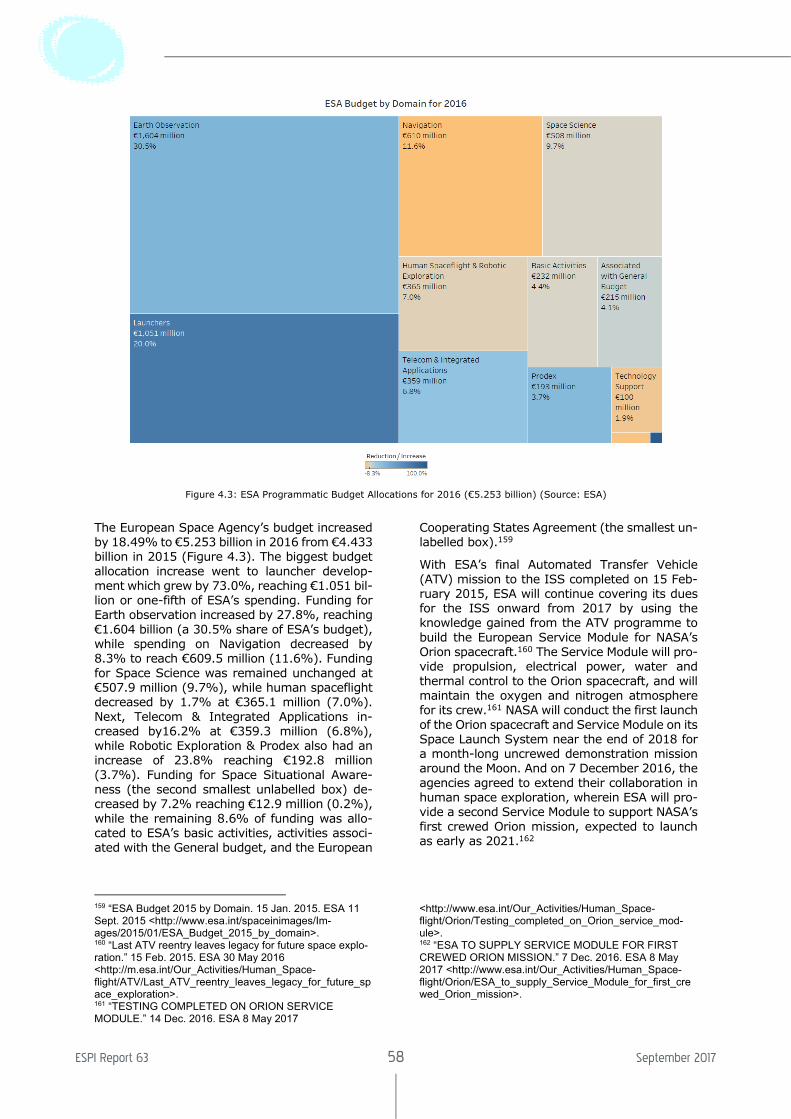
ESPI Report 63 58 September 2017
Figure 4.3: ESA Programmatic Budget Allocations for 2016 (€5.253 billion) (Source: ESA)
The European Space Agency’s budget increased by 18.49% to €5.253 billion in 2016 from €4.433 billion in 2015 (Figure 4.3). The biggest budget allocation increase went to launcher develop-ment which grew by 73.0%, reaching €1.051 bil-lion or one-fifth of ESA’s spending. Funding for Earth observation increased by 27.8%, reaching €1.604 billion (a 30.5% share of ESA’s budget), while spending on Navigation decreased by 8.3% to reach €609.5 million (11.6%). Funding for Space Science was remained unchanged at €507.9 million (9.7%), while human spaceflight decreased by 1.7% at €365.1 million (7.0%). Next, Telecom & Integrated Applications in-creased by16.2% at €359.3 million (6.8%), while Robotic Exploration & Prodex also had an increase of 23.8% reaching €192.8 million (3.7%). Funding for Space Situational Aware-ness (the second smallest unlabelled box) de-creased by 7.2% reaching €12.9 million (0.2%), while the remaining 8.6% of funding was allo-cated to ESA’s basic activities, activities associ-ated with the General budget, and the European
159 “ESA Budget 2015 by Domain. 15 Jan. 2015. ESA 11 Sept. 2015 <http://www.esa.int/spaceinimages/Im-ages/2015/01/ESA_Budget_2015_by_domain>. 160 “Last ATV reentry leaves legacy for future space explo-ration.” 15 Feb. 2015. ESA 30 May 2016 <http://m.esa.int/Our_Activities/Human_Space-flight/ATV/Last_ATV_reentry_leaves_legacy_for_future_space_exploration>. 161 “TESTING COMPLETED ON ORION SERVICE MODULE.” 14 Dec. 2016. ESA 8 May 2017
Cooperating States Agreement (the smallest un-labelled box).159
With ESA’s final Automated Transfer Vehicle (ATV) mission to the ISS completed on 15 Feb-ruary 2015, ESA will continue covering its dues for the ISS onward from 2017 by using the knowledge gained from the ATV programme to build the European Service Module for NASA’s Orion spacecraft.160 The Service Module will pro-vide propulsion, electrical power, water and thermal control to the Orion spacecraft, and will maintain the oxygen and nitrogen atmosphere for its crew.161 NASA will conduct the first launch of the Orion spacecraft and Service Module on its Space Launch System near the end of 2018 for a month-long uncrewed demonstration mission around the Moon. And on 7 December 2016, the agencies agreed to extend their collaboration in human space exploration, wherein ESA will pro-vide a second Service Module to support NASA’s first crewed Orion mission, expected to launch as early as 2021.162
<http://www.esa.int/Our_Activities/Human_Space-flight/Orion/Testing_completed_on_Orion_service_mod-ule>. 162 “ESA TO SUPPLY SERVICE MODULE FOR FIRST CREWED ORION MISSION.” 7 Dec. 2016. ESA 8 May 2017 <http://www.esa.int/Our_Activities/Human_Space-flight/Orion/ESA_to_supply_Service_Module_for_first_crewed_Orion_mission>.

Space Policies, Issues and Trends in 2016–2017
ESPI Report 63 59 September 2017
Figure 4.4: Member States’ Contributions to ESA’s Budget from 2016 to 2017 (Source: ESA)
Figure 4.5: Estimated Shares of European National Institutional Investment in Civilian Space of ESA Members in 2017 (Source: ESA, Euroconsult, The Space Report 2017)

ESPI Report 63 60 September 2017
Figure 4.6: Estimated Shares of European National Institutional Investment in Civilian Space of ESA Members in 2016 (Source: ESA, European Space Technology Master Plan 12th Edition, The European Space Directory 2015)
4.3 EUMETSAT
EUMETSAT’s Council endorsed its new 10-year strategy “Challenge 2025” during its 85th Council meeting held in June 2016. Challenge 2035 establishes the framework for EUMETSAT to reach an optimum realisation of the portfolio of programmes acquired in recent years, and address its future role in Coperni-cus and the “big data” challenge. EUMETSAT also decided to move its Meteosat-8 spacecraft in GEO orbit over the Indian Ocean to replace its aging Meteosat-7 spacecraft as it ap-proaches the end of its service in the first quarter of 2017.163 And Serbia, EUMETSAT’s last remaining Cooperating State, is expected to join as a full Member State by the end of 2017, following the expiry of its Cooperating State Agreement.164
The vast majority of EUMETSAT’s funding comes from contributions from its Member
163 De Selding, Peter B. “Eumetsat to continue gap-filler role over Indian Ocean region.” 30 June 2016. SpaceNews 10 Nov. 2016 <http://spacenews.com/eumetsat-to-con-tinue-gapfiller-role-over-indian-ocean-region/>.
States and Cooperating States. Member con-tributions are calculated on the basis of their Gross National Income (GNI). In 2016, the percentage distribution of contributions were similar to 2015 (Figure 4.7). In 2016, the best estimates of Member State contributions to EUMETSAT saw an average increase of 22.9% from all members. Germany likely remains the largest contributor with an estimated 18.97% share contribution in 2016, from 18.77% in 2015. France followed next with a share con-tribution of 14.60% in 2016, up from 14.48% in 2015. And the United Kingdom’s share was 13.05% in 2016, up from 12.93% in 2015; however, Italy’s share lowered to 11.05% in 2016 from 11.09% in 2015. Spain and the Netherlands rounded out the major contribu-tors at about 7.04% and 4.27% in 2016, re-spectively. In 2016, these six states accounted for about 68.97% of the total allocation. The contributions from the remaining Member States range from 4.08% to 0.06%.165
164 See Eumetsat Annual Report 2015. 30 June 2016. Eu-metsat 21 Oct. 2016: 2-5 <http://www.eumetsat.int/web-site/home/AboutUs/Publications/AnnualReport/in-dex.html>. 165 Best estimates.

Space Policies, Issues and Trends in 2016–2017
ESPI Report 63 61 September 2017
Figure 4.7: Member states’ contributions to Eumetsat in 2016 and 2015 (Source: EUMETSAT Annual Report 2015, and best estimates)
Figure 4.8: Major Programmatic Allocations of EUMETSAT 2016-2014
In 2016, EUMETSAT’S total expenditure is es-timate to have increased by 27.2% to €531.7 million from €418.1 million in 2015, as the in-tergovernmental organisation sought to play a more defined role in the EU’s Copernicus flag-ship programme, and to ensure continuity of services throughout the next decade. Funding for the EUMETSAT Polar System likely saw a 1.1% increase to €74.8 million, and while funding for the EPS Second Generation Prepar-atory Programme decreased to €1.7 million from €18.6 million in 2015, the main EPS Sec-ond Generation programme had the highest growth for 2016, increasing to €152.1 million from €19.7 million in 2015. The Meteosat Third Generation Programme increased by 7.7% to €188.5 million in 2016, while the Meteosat
166 Best estimates.
Second Generation decreased by 62.6% to €25.1 million, and funding for the Meteosat Transition Programme increased by 12.2% to €5.5 million. Next, funding for Jason-3 de-creased again by 62.1% to €2.5 million, fol-lowed by a 28.6% decrease in funding for Ja-son-2 to €500,000, while funding the Jason-CS/Sentinel-6 cooperative mission increased to €15.4 million from of €100,000 in 2015. And EUMETSAT funding toward diversification ac-tivities related to Copernicus increased again to €31.5 million from €15.2 million in 2015, while funding for the Copernicus Sentinel-3 satellite likely stayed at €5.8 million in 2016. The general budget also decreased by 6.6% to reach €28.3 million.166

ESPI Report 63 62 September 2017
Figure 4.9: National civilian programmes 2016 in million euros
‘(Source: Euroconsult and best estimates)
4.4 National Agencies
European national space programme budgets were derived by deducting ESA and estimated EUMETSAT national contributions from Euro-consult’s total government budget expendi-tures for 2016.167 In 2016, the hierarchy of na-tional space European national space budgets changed somewhat compared to 2015 which might be due to the use of estimates derived from Euroconsult, in lieu of Eurospace which do not account for expenditures in services. France remained in the first position in na-tional space expenditure, nearly doubling Ger-many which returns to the second position, followed by Italy and the UK. Here, France, Germany, Italy and the UK accounted for a combined share of around 91.4% of the total expenditure on European national space pro-grammes.
4.4.1 France
Airbus Safran Launcher’s (ASL) formal bid on 7 May 2015 to ESA for the production of the Ariane 6 launcher came with a desire for ASL
167 “Government Spending in Space Programs Reaches $62 Billion in 2016.” 30 May 2017. Euroconsult 22 Aug. 2017 <http://www.euroconsult-ec.com/30_May_2017>. 168 De Selding, Peter B. “New Airbus-Safran Venture Eyes Full Control of Arianespace.” 8 Jan. 2015. SpaceNews 12 Jan. 2016 <http://spacenews.com/new-airbus-safran-ven-ture-eyes-full-control-of-arianespace/>.
to have oversight over the design, production, commercialization and operations of the launcher. ASL also sought to increase its 39% stake in Arianespace to include the near 34.7% stake held by the French government through CNES, which would also remove CNES’s minority blocking power in launcher development.168 The French government agreed to sell its stake in Arianespace to ASL, but reserved informal oversight over the com-pany, which will remain intact at its Evry head-quarters, and will utilize the Ariane 6 launch platform CNES is building in French Guiana.169 Following negotiations between ESA and ASL, it was agreed that ASL would contribute €400 million to the Ariane 6 development contract, while €200 million will be cut out partly by shaving the cost of certain buildings and facil-ities that will integrate the launcher horizon-tally, and an additional €200 million will be re-moved as unnecessary expenditures. On 30 November 2016, CNES announced that it would sell its stake in Arianespace to ASL; ASL’s share capital in Arianespace will increase to 74% and the three directors representing CNES will be replaced by three directors ap-pointed by Airbus Safran Launchers, while CNES will join ESA as statutory censors of Ar-ianespace’s Board of Directors.170 ESA signed
169 De Selding, Peter B. “France Giving up Arianespace Ownership, but not Oversight.” 19 June 2015. SpaceNews 22 Dec. 2015 <http://spacenews.com/france-giving-up-ari-anespace-ownership-but-not-oversight/>. 170 Messier, Doug. “Airbus Safran Launchers Buys CNES Shares of Arianespace.” 3 Dec. 2016. Parabolic Arc 21

Space Policies, Issues and Trends in 2016–2017
ESPI Report 63 63 September 2017
the Ariane 6 development contract with ASL on 12 August 2015. The contract, now valued at around €2.4 billion, will cover development of the launcher from 2015 to its inaugural flight in 2020.
ESA and CNES began developing the Ariane 6 launch pad and horizontal launcher integration facilities in Europe’s Guiana Space Centre in French Guiana Ariane 6 on 12 August 2015. While all previous European launchers have been integrated vertically and then rolled up-right to the launch pad by rail, the Ariane 6 will be integrated horizontally enabling time and cost savings derived from fewer crane and hazardous moving operations and a more fluid production flow. Nevertheless, unlike with spacecraft launched on other horizontally inte-grated launchers, including the SpaceX Falcon 9 launcher, which are stored, integrated onto the launcher and then forced to endure addi-tional vibrations while rolled to the launch pad, Ariane 6 payloads will remain vertical, stored in their fairing and then integrated on the now vertical Ariane 6 launcher at the last mo-ment.171
4.4.2 Germany
In 2016, Germany’s future participation on the ISS was pending an ongoing study to assess the sustainability of the investment and its as-sociated benefits.172 While the assessment was not published, German delegates to the December 2016 ESA Ministerial Council meet-ing acknowledged the excellent opportunities for research under space conditions offered by the ISS, benefits derived by German industry in the field of materials research; Germany ended up politically supporting the extension of ISS operation until 2024, and allocated around €346 million to continuing operation of the ISS until 2019.173
And the ESA/DLR Rosetta mission to perform a detailed study of the comet 67P/Churyumov-Gerasimenko concluded on 30 September 2016. As contact with the spacecraft deterio-rated during its closest approach with the Sun in August 2015, the DLR and ESA extended
Aug. 2017 <http://www.parabolicarc.com/2016/12/03/air-bus-safran-launchers-buys-cnes-shares-arianespace/>. 171 De Selding, Peter B. “Airbus Safran Launchers aims for ‘the discipline of the flow’ in Ariane 6 integration.” 7 Apr. 2016. SpaceNews 8 Nov. 2016 <http://spacenews.com/air-bus-safran-launchers-aims-for-the-discipline-of-the-flow-for-ariane-6-integration/>. 172 De Selding, Peter B. “ESA members give space agency an 18-percent budget boost.” 15 Jan. 2016. SpaceNews 10 Nov. 2016 <http://spacenews.com/esa-members-give-space-agency-an-18-percent-budget-boost/>. 173 “ESA Council meeting at ministerial level in Lucerne – Germany awards approximately two billion euro to space projects.” 2 Dec. 2016. DLR 4 Aug. 2017
Rosetta’s mission into September 2016, and moved was moved the spacecraft to a safe dis-tance to monitor the comet’s evolution as it journeyed deeper into the solar system.
4.4.3 Italy
As Europe’s launch sector begins its substan-tial reorganisation to make it more competitive in the global market, the launch rate of the Vega launcher, developed by Italian prime contractor Avio SpA, is expected to increase. The Vega launcher is sold by European Launch Vehicle (ELV), the public-private joint venture between Avio (70% share) and ASI (30% share). By the end of 2016, Arianespace had used 2 of the 10 Vega rockets that it pur-chased from ELV in 2016 to launch five high-resolution optical EO satellites (i.e. the Peru-vian government’s PerúSat 1, and four SkySat satellites for Google’s Terra Bella constella-tion) on 15 September 2016174 and Turkey’s Göktürk-1 EO satellite on 5 December 2016. The latest launch marked the eighth success of the Vega launcher system since its inaugu-ration in 2012.175 The next Vega launcher lifted the Copernicus programme’s Sentinel-2B satellite into orbit on 7 March 2017. Whereas in 2013, Vega’s backlog of 4 satellite launches was valued at €130 million, or €32.5 million per launch, the value of a launch reached €36.4 million per launch as of June 2015.176
4.5 European Union
The EU Copernicus flagship programme is in its operational phase with five Sentinel space-craft currently in orbit. The Sentinel 3A mis-sion was launched on 16 February 2016 to support ocean forecasting systems, as well as environmental and climate monitoring. The polar-orbiting Sentinel-1B was launched on 25 April 2016, joining the Sentinel-1A which launched on 3 April 2014, to conduct an all-weather, day-and-night radar imaging mission for land and ocean services. And the polar-or-biting Sentinel-2B was launched on 7 March 2017, joining the Sentinel-2A which launched
<http://www.dlr.de/dlr/presse/en/desktopdefault.aspx/tabid-10308/471_read-20304/year-all/#/gallery/25207>. 174 De Selding, Peter B. “Europe’s Vega launches 1 Peru-vian and 4 Terra Bella Earth observation satellites.” 16 Sept. 2016. SpaceNews 8 Nov. 2016 <http://space-news.com/europes-vega-launches-1-peruvian-and-4-terra-bella-earth-observation-satellites/>. 175 Henry, Caleb. “Vega mission orbits Turkish Earth obser-vation satellite.” 5 Dec. 2016. SpaceNews 4 Jan. 2017 <http://spacenews.com/vega-mission-orbits-turkish-earth-observation-satellite/>. 176 De Selding, Peter B. “Vega Launches Sentinel-2A Ob-servation Satellite.” 23 June 2015. SpaceNews 5 Jan. 2016 <http://spacenews.com/vega-launches-sentinel-2a-observation-satellite/>.

ESPI Report 63 64 September 2017
on 23 June 2015, to provide high-resolution optical imaging for land services (e.g. imagery of vegetation, soil and water cover, inland wa-terways and coastal areas).177 The Sentinel-5 Precursor mission will reduce data gaps left open by the inactive Envisat satellite currently in orbit; it is the forerunner of Sentinel 5 and will provide timely data on a multitude of trace gases and aerosols affecting air quality and cli-mate. The Sentinel-4 and Sentinel-5 missions will be dedicated to monitoring the composi-tion of the atmosphere for Copernicus Atmos-phere Services. And the Sentinel-6 will provide high-precision and timely observations of the topography of the global ocean to provide vital information on ocean currents, wind speed and wave height for maritime safety. In coor-dinating the evolution of the Copernicus Space Component, ESA has prepared a long-term plan for the content and associated funding needs, covering the operation of the Sentinels up to 2020, and the procurement of recurrent Sentinel satellites and instruments and access to data available from contributing missions up to 2028.178
The EU Galileo flagship GNSS programme en-tered its operational phase on 15 December 2016, following the European Commission’s Declaration of Initial Service.179 With 18 of 24 Galileo satellites (plus 6 spare satellites) in or-bit by the beginning of 2017, including 6 sat-ellites that were launched in 2016, the Galileo system will provide Open Service to its posi-tioning, navigation and timing signals for the mass-market; Public Regulated Service (PRS) for government-authorised users (including full encryption to provide service continuity for
government users during emergencies or cri-sis situations); and Search and Rescue Service as Europe’s contribution to the international distress beacon locating organisation COSPAS-SARSAT. These Initial Services are managed by the European GNSS Agency (GSA), based in Prague, Czech Republic, and are free of charge for European citizens, business and au-thorities; moreover, Galileo is expected to of-fer full service in 2020.180 At the end of 2016, the EU was still sorting out access to the PRS signals its 28 member states, in addition to still considering whether to make PRS signals available to Norway and the United States.
Funding for Horizon 2020, the EU’s Research and Innovation programme that includes a large variety of space research efforts, is esti-mated to be €1.4 billion over the 7-year period from 2014 to 2020, i.e. €200 million per year.181 The work programme for EU Space R&D focuses on prioritising the EU’s Coperni-cus and Galileo Flagship programmes; ensur-ing support for the protection of space infra-structure; ensuring support to EU industry in enhancing competitiveness and its value-chain in the global market in line with the Commis-sion’s Space Industrial Policy; ensuring that Europe’s investments made in space infra-structure are exploited to the benefit of citi-zens; as well as supporting European space science; and enhancing Europe’s standing as an attractive partner for international partner-ships in space science and exploration.182 While the actual amount allocated to space re-search under Horizon 2020 lowered to €167.1 million in 2016, the budget increased to €183.9 million in 2017.183
177 “Overview.” ESA 1 Sept 2017 <http://www.esa.int/Our_Activities/Observ-ing_the_Earth/Copernicus/Overview4>. 178 “Green Light for GMES Copernicus.” 4 July 2013. ESA 28 Apr. 2014 <http://www.esa.int/Our_Activities/Observ-ing_the_Earth/Coperni-cus/Green_light_for_GMES_Copernicus>. 179 European Commission - Press release. “Galileo goes live!” 14 Dec. 2016. European Commission 1 Sept. 2017 <http://europa.eu/rapid/press-release_IP-16-4366_en.htm>. 180 “Galileo.” European Commission 1 Sept. 2017 <http://ec.europa.eu/growth/sectors/space/galileo_en>.
181 “Space Programs Facing Cuts in Seven-year EU Budget.” 1 Feb. 2013. SpaceNews 25 Apr. 2014 <http://spacenews.com/article/space-programs-facing-cuts-in-seven-year-eu-budget>. 182 “Space.” European Commission 1 Sept. 2017 <https://ec.europa.eu/programmes/horizon2020/en/h2020-section/space>. 183 Commission of the European Communities. Horizon 2020 – Work Programme 2016-2017. 5 iii. Leadership in Enabling and Industrial Technologies – Space, European Commission Decision C(2016)4614 of 25 July 2016. Brus-sels: European Union <http://ec.europa.eu/research/partic-ipants/data/ref/h2020/wp/2016_2017/main/h2020-wp1617-leit-space_en.pdf>.

Space Policies, Issues and Trends in 2016–2017
ESPI Report 63 65 September 2017
5. The Defence Perspective
This chapter considers key developments in the field of military space activities. These de-velopments include military space government programmes and related spending, industrial achievements in military space technologies, and the evolution of space security doctrines of all the major space-faring nations. Given the confidential nature of military space spending, calculating the exact volume and nature of these activities is difficult as the analysis is based only on open sources. Con-sequently, the facts and figures presented must be considered as incomplete in assessing the full range of military space programmes and should be treated accordingly. For these reasons, the following figures are conservative estimates and it is very likely that actual mili-tary space budgets far exceed the amounts that are reported. This is particularly the case with Russian and Chinese programmes that are often classified. With these factors in mind, readers can take from this chapter a relative assessment of global military space activities as per key space faring states, along with an overall estimate of the general trends in this field.
5.1 Trends in Military Expenditure
The Space Report 2017 estimates military space spending in 2016 to be around $33.000 billion, a 3.4% decrease from the $34.151 bil-lion spent in 2015; this decrease is due to a decrease in U.S. spending, and by weak cur-rency exchange rates which mask total mili-tary space spending outside of the U.S..184 Meanwhile, Euroconsult estimates that around 35% of the $62.2 billion in global space budg-ets in 2016 went to military spending, i.e. about $22.86 billion.185 As is typical with the nature of dual-use technology in space activ-ity, there is a risk that certain military activi-ties have been already included in larger budg-ets, which can result in double counting. More-
184 The Space Report 2017. Colorado Springs: The Space Foundation, 2017: 15. 185 Smith, Andrew. “Euroconsult: Government Spending in Space Programs Reaches $62 Billion in 2016.” 30 May 2017. PRWeb 21 Aug. 2017 <http://www.prweb.com/re-leases/2017/05/prweb14377281.htm>.
over, while missions, often listed as civil pro-grammes, may also serve dual-purpose mili-tary objectives, their expenditure is not in-cluded in this section.
According to The Space Report 2017, the U.S. generated a 66.7% share ($22.000 billion) of global military space spending in 2016, de-creasing from 69.0% ($23.572 billion) esti-mated for 2015. Non-U.S. global military spending increased to a 33.3% share ($11.000 billion) from 31.0% ($10.579 billion) in 2015.186 However, as in previous years, a direct comparison of the budgets of these countries in fixed dollar values does not pre-sent a clear picture of their relative space de-fence efforts, since fluctuating exchange rates, variations in purchasing power and different employment costs distort the impact of these investment amounts.
5.2 Europe
According to the latest estimates available from Eurospace, total funding for European military space programmes was about €675.2 million in 2015. France had the highest mili-tary budget at €325.2 million, while the United Kingdom budgeted €285.0 million, with Ger-many at €50.0 million, and Italy at $16.730 million €15.0 million. It should also be noted that Eurospace figures do not account for ex-penditures in services.
On 30 November 2016, the European Commis-sion released its European Defence Action Plan proposing a European Defence Fund and other actions to support more efficient spending by Member States in joint defence capabilities, strengthen European citizens' security and foster a competitive and innovative industrial base.187 The three main pillars under this plan include: 1) Launching a European Defence Fund; 2) Fostering investments in defence supply chains; and 3) Reinforcing the single market for defence. Moreover wherever ap-propriate the Commission will promote civil
186 The Space Report 2017. Colorado Springs: The Space Foundation, 2017: 15. 187 “European Defence Action Plan: Towards a European Defence Fund.” 30 Nov. 2016. European Commission Press Release Database 21 Aug. 2017 <http://eu-ropa.eu/rapid/press-release_IP-16-4088_en.htm>.

ESPI Report 63 66 September 2017
and military synergies within EU policies.188 The business case for defence spending and greater defence cooperation comes from the fact that in 2015, the U.S. invested more than twice as much as the total spending of EU Member States on defence, and that China has increased its defence budget by 150% over the past decade. Moreover, in Europe the lack of cooperation between Member States in the field of defence and security costs between €25 billion and €100 billion annually, due to inefficiencies, lack of competition and lack of economies of scale for industry and produc-tion. Next, around 80% of defence procure-ment is run on a purely national basis, result-ing in duplication of military capabilities. And finally, there would be a positive spill-over ef-fect on the European economy as the Euro-pean defence industry generates a total turn-over of €100 billion per year and 1.4 million highly skilled peopled are directly or indirectly employed in Europe.189 The Commission will set up an Implementation Steering Group with Member States to monitor and facilitate pro-gress on the Actions with the first meeting tak-ing place in the first quarter of 2017.190
5.3 United States
While the U.S. Department of Defense (DoD) space budget decreased to $22.000 billion in 2016 from $23.572 billion in 2015, the budget request for the U.S. Missile Defense Agency (U.S. MDA) increased to $8.313 billion in 2016 from the $7.868 billion it received in FY 2015191; its budget request for Fiscal Year 2017 asked for $7.5 billion.192 In mid-2015, members of the U.S. Congress’ House Armed Services Committee showed renewed interest in a 2009 concept to put several miniaturized kill vehicles on an interceptor missile to over-
188 Communication From The Commission To The Euro-pean Parliament, The European Council, The Council, The European Economic And Social Committee And The Com-mittee Of The Regions. European Defence Action Plan. COM (2016) 950 final of 30 November 2016. Brussels: European Union <https://eeas.eu-ropa.eu/sites/eeas/files/com_2016_950_f1_communica-tion_from_commission_to_inst_en_v5_p1_869631.pdf>. 189 “European Defence Action Plan.” 30 Nov. 2016. Euro-pean Commission 21 Aug. 2017 <europa.eu/rapid/attach-ment/IP-16-4088/en/20161130%20Factsheet_EDAP.pdf>. 190 “The European Defence Action Plan – FAQs.” 30 Nov. 2016. European Commission 21 Aug. 2017 <http://eu-ropa.eu/rapid/press-release_MEMO-16-4101_en.htm>. 191 “Missile Defense Agency Fiscal Year (FY) 2017 Budget Estimates | Overview.” 16 Jan. 2016 MDA 22 Aug. 2017 <http://comptroller.defense.gov/Portals/45/Documents/defbudget/FY2017/budget_justification/pdfs/03_RDT_and_E/MDA_RDTE_MasterJustificationBook_Missile_Defense_Agency_PB_2017_1.pdf>. 192 “Missile Defense Agency FY 2017 Budget Request.” 10 Feb. 2016. Missile Defense Advocacy Alliance 22 Aug.
come the U.S. missile defense system’s inabil-ity to reliably distinguish between missile war-heads and relatively low-tech decoys. The U.S. MDA would make the multi-object kill vehicle (MOKV) a long-term technology, which would come after the completion of its redesigned kill vehicle (RKV) expected to be ready around 2020.193 In August 2015, Boeing, Lockheed Martin, and Raytheon each won study con-tracts worth approximately $9.7 million to de-velop MOKV concepts that are expected to be completed by May 2016.194 The U.S. MDA plans to hold its first non-intercept flight test for the new kill vehicle in 2018, followed by an intercept test in 2019, and to field the RKV in195 2020. Before that time they plan to de-ploy 37 Ground-based Midcourse Defense in-terceptors by the end of 2016 in response to provocations from North Korea’s growing nu-clear capability.
Following the 31 March 2015 launch of Rus-sia’s Cosmos 2504 spacecraft; its resulting manoeuvres, including at least one case where the upper stage of its launcher appeared to be nudged to a higher orbit, motivated the U.S. to early deployment of its once-classified Ge-osynchronous Space Situational Awareness Program (GSSAP) satellites.196 Since the GSSAP programme’s declassification in Febru-ary 2014, U.S. defence officials have acknowl-edged that the satellites will perform their own rendezvous and proximity manoeuvres to al-low close-up looks at spacecraft in GEO or-bits.197 The first two GSSAP satellites were launched in July 2014, and had been taken out of test mode twice by 16 September 2015 to make observations of specific objects in geo-synchronous orbit. On 18 August 2016, a GSSAP satellite was sent to observe the status of the stalled MUOS-5 satellite that had expe-rienced a failure of its orbit raising propulsion system partway through its climb to GEO at the end of June 2016; however, it is unclear
2017 <http://missiledefenseadvocacy.org/alert/missile-de-fense-agency-fy-2017-budget-request/>. 193 Gruss, Mike. “House Bill Would Revive Dormant Missile Defense Kill Vehicle Project.” 11 May 2015. SpaceNews 22 Dec. 2015 <http://spacenews.com/house-bill-would-re-vive-dormant-missile-defense-kill-vehicle-project/>. 194 Gruss, Mike. “MDA Pursues Kill Vehicles with Cost-cut-ting Mandate.” 24 Aug. 2015. SpaceNews 24 Dec. 2015 <http://spacenews.com/mda-pursues-kill-vehicles-with-cost-cutting-mandate/>. 195 Gruss, Mike. “New U.S. kill vehicle will fly in 2018, take on its first target in 2019.” 20 Jan. 2016. SpaceNews 22 Aug. 2017 <http://spacenews.com/new-u-s-kill-vehicle-will-fly-in-2018-take-on-its-first-target-in-2019/>. 196 Gruss, Mike. “Maneuvering Russian Satellite Has Eve-ryone’s Attention.” 17 July 2015. SpaceNews 20 Mar. 2016 <http://spacenews.com/maneuvering-russian-satellite-has-everyones-attention/>. 197 Gruss, Mike. “Space Surveillance Sats Pressed into Early Service.” 18 Sept. 2015. SpaceNews 11 Jan. 2016 <http://spacenews.com/space-surveillance-sats-pressed-into-early-service/>.

Space Policies, Issues and Trends in 2016–2017
ESPI Report 63 67 September 2017
how the information provided by the GSSAP would allow the U.S. Navy to recover the MUOS-5 from its elliptical orbit.198 Two more GSSAP satellites were launched on 19 August 2016.199
5.4 Russia
The Russian government merged its Air Force and its recently-formed Aerospace Defence Forces (VKO) under one unified command structure in mid-2015. The move represents an evolution in Russian military thinking from an era where its air and space forces existed as separate branches with little overlap in command authority to one where air and space will be treated more as a seamless the-atre of war.200 By 17 November 2015, Russia had involved 10 imagery and electronic war-fare reconnaissance satellites, including civil-ian-use spacecraft, to provide support for its operation against ISIS forces in Syria.201
Concerns about the military space capabilities of both Russia and China remained following the annual Worldwide Threat Assessment of the U.S. Intelligence Community to the U.S. Congress on 9 February 2016.202 In addition to Russia’s sophisticated use of imaging and elec-tronic-reconnaissance satellites to support military operations in Syria, both countries are developing counter-space capabilities to deny, degrade, or disrupt U.S. space systems. The statement pointed to the 2014 Military Doc-trine of the Russian Federation which refer-enced three space-enabled capabilities (in-cluding “global strike,” the “intention to station weapons in space,” and “strategic non-nuclear precision weapons”) as its main external mili-tary threats.203 The statement also referenced Russia’s acknowledgment of its deployment of
198 Gruss, Mike. “Air Force sent GSSAP satellite to check on stalled MUOS-5.” 18 Aug. 2017. SpaceNews 21 Aug. 2017 <http://spacenews.com/air-force-sent-gssap-satellite-to-check-on-stalled-muos-5/>. 199 Henry, Caleb. “ULA Orbits Second Set of GSSAP Satel-lites for US Air Force.” 22 Aug. 2016. Via Satellite 21 Aug. 2017 <http://www.satellitetoday.com/launch/2016/08/22/ula-orbits-second-set-gssap-satellites-us-air-force/>. 200 Bodner, Matthew. “Russian Military Merges Air Force and Space Command.” 3 Aug. 2015. The Moscow Times 10 July 2016 <http://www.themoscowtimes.com/busi-ness/article/russian-military-merges-air-force-and-space-command/526672.html>. 201 “Russia involves 10 reconnaissance satellites in Syria operation — General Staff.” 17 Nov. 2015. TASS 20 Mar. 2016 <http://tass.ru/en/science/837273>. 202 Clapper, James R. “Worldwide Threat Assessment of the US Intelligence Community.” 9 Feb. 2016. Armed-ser-vices.senate.gov 11 Aug. 2017 <https://www.armed-ser-vices.senate.gov/imo/media/doc/Clapper_02-09-16.pdf>. 203 “Russian Military Doctrine.” 3 May 2016. GlobalSecu-rity.org 11 Aug. 2017 <http://www.globalsecurity.org/mili-tary/world/russia/doctrine.htm>.
radar-imagery jammers and development of laser weapons designed to blind U.S. intelli-gence and ballistic missile defence satellites, and a 2013 recommendation by Russia’s Par-liament that Russia resume research and de-velopment of its anti-satellite capabilities.204
5.5 China
China’s military space capability has long at-tracted heightened speculation, as China’s space sector has long been intimately con-nected to the People’s Liberation Army (PLA). Nevertheless, China publically stands against the militarization of space, and its recent Mid-dle and Long Term Development Plan for State Civil Space Infrastructure (2015-2025) ap-pears more focussed on enhancing its space capabilities for domestic purposes – particu-larly in establishing its state civil space infra-structure system, and enhancing its competi-tiveness.205
Nonetheless, concerns about China’s military space capabilities remain, especially following the release of a defence white paper on China’s Military Strategy by China’s Ministry of National Defence (MOD) on 26 May 2015.206 In addition to reaffirming decades-old commit-ments not to attack first (but to counterattack strongly), and giving more attention to emerg-ing domains like cyber and space, changes in the white paper were modest and in line with the direction of recent PLA activity. The white paper outlines China’s strategic guideline of active defence, along with modernizing its mil-itary to adapt to new changes in its maritime security environment.207 And in terms of mili-tary space and counter-space activities, aside from a paragraph indicating that China will
204 Clapper, James R. “Worldwide Threat Assessment of the US Intelligence Community.” 9 Feb. 2016. Armed-ser-vices.senate.gov 11 Aug. 2017 <https://www.armed-ser-vices.senate.gov/imo/media/doc/Clapper_02-09-16.pdf>. 205 Google Translated. “关于印发国家民用空间基础设施中长期发展规划(2015-2025年)的通知.” 26 Oct. 2015. Na-
tional Development and Reform Commission 2 Feb. 2016 <http://www.sdpc.gov.cn/zcfb/zcfbghwb/201510/t20151029_756376.html>. 206 Minnick, Wendell. “White Paper Outlines China's Ambi-tions.” 27 May 2015. Defense News 22 Jan. 2016 <http://www.defensenews.com/story/defense/policy-budget/warfare/2015/05/26/china-us-pentagon-taiwan-re-port-south-east-sea-islands-reefs-s400-su35-missiles-sat-ellite-space-deterrence/27957131/>; see also “China’s Mili-tary Strategy.” 26 May 2015. Ministry of National Defense – The People’s Republic of China 3 Feb. 2016 <http://eng.mod.gov.cn/Database/WhitePapers/in-dex.htm>. 207 “III. Strategic Guideline of Active Defense.” 26 May 2015 Ministry of National Defense – The People’s Republic of China 3 Feb. 2016 <http://eng.mod.gov.cn/Data-base/WhitePapers/2015-05/26/content_4586711.htm>.

ESPI Report 63 68 September 2017
strengthen its capabilities for strategic deter-rence and nuclear counterattack, and me-dium- and long-range precision strikes, it later goes on to say that “China will keep abreast of the dynamics of outer space, deal with security threats and challenges in that domain, and se-cure its space assets to serve its national eco-nomic and social development, and maintain outer space security”.208 While China had con-ducted a space launch in July 2014 with a sim-ilar profile to its January 2007 ASAT test, as of 2016 no additional anti-satellite programmes had been publicly acknowledged.209
5.6 Japan
Concern over China’s 2007 direct-ascent anti-satellite weapon test, and subsequent experi-ments focusing on jamming and laser-blinding satellites, is said to have motivated Japan’s shift toward placing security at the forefront of its national space policy.210 Concern also exists over North Korea which has continued devel-opment of long-range ballistic missiles, one of which provocatively overflew Japan dropping its first stage very near Japanese territory in a test conducted in 1998.211
Japan’s defence budget has steadily increased from ¥4.65 trillion in 2012 to ¥4.93 trillion in 2016.212 For the fiscal year 2016 (beginning on 1 April 2016 and ending 30 March 2017), Ja-pan allocated ¥34.2 billion of its ¥332.4 billion in space spending to its Ministry of Defence (MOD). Interestingly, these figures do not in-clude the ¥191.5 billion in space-related bal-listic missile defence (BMD) expenditure, which accounts for 87.3% of the total ¥219.3 billion budgeted for Japan’s BMD programme; another ¥26.4 billion went to its space activi-ties to strengthen information gathering capa-bilities and command, control, and communi-cation capabilities by using satellites, and im-plement measures to secure the stable use of outer space.213 Moreover, Japan plans to ex-pand its QZSS regional navigation system to
208 “IV. Building and Development of China's Armed Forces.” 26 May 2015 Ministry of National Defense – The People’s Republic of China 3 Feb. 2016 <http://eng.mod.gov.cn/Database/WhitePapers/2015-05/26/content_4586713.htm>. 209 “Office of the Secretary of Defense. “Annual Report to Congress - Military and Security Developments Involving the People’s Republic of China 2016.” 13 May 2016. De-fense.gov 10 Aug. 2017 <https://www.defense.gov/Por-tals/1/Documents/pubs/2016%20China%20Mili-tary%20Power%20Report.pdf>. 210 Kallender-Umezu, Paul. “Japan Boosts Space Spend-ing In Support of Security Focus.” 2 Feb. 2015. Space-News 10 Dec. 2015 <http://spacenews.com/japan-boosts-space-spending-in-support-of-security-focus/>. 211 Rose, Frank A. “Commentary | Strategic Stability in U.S.-China Relations.” 29 Jan. 2015. SpaceNews 10 Dec.
an enhanced seven satellite constellation, in addition to its development of a laser-optical data relay satellite, an advanced Earth obser-vation satellite carrying a ballistic missile early warning sensor as a hosted payload for Ja-pan’s Ministry of Defence, and a new line of multipurpose small satellites capable of rapid production and deployment for a range of mis-sions.214
5.7 India
Separate from the civil space activities of ISRO, India is developing a Ballistic Missile De-fence (BMD) Programme through its Defence Research Development Organization (DRDO) to counter threats raised by Pakistan’s Strate-gic Missile Group which is developing its own medium-range ballistic missiles. The BMD Pro-gramme is a two-tiered system to provide high and low altitude cover against incoming ballis-tic missiles. While the DRDO’s Advanced Air Defence (AAD) system is optimised for sur-face-to-air strikes against aircraft and UAVs at endoatmospheric altitudes between 20-to-40 km, the Prithvi Air Defense (PAD) missile pro-vides exoatmospheric defence at altitudes of 50-to-80 km. On 15 May 2016, the DRDO was reported to have conducted a test of its AAD missile to validate the interceptor in flight mode.215 However, there are conflicting re-ports as to whether the test was successful.216
It should be noted that the PAD missile can also be seen as a further step for India in de-veloping its own anti-satellite capabilities. In this pursuit, the DRDO is looking at the feasi-bility of developing such an anti-satellite vehi-cle by integrating its Angi-3 missile with its PAD. If it succeeds, the anti-satellite missile would have an effective range of about 1400-1500 km, and would advance India’s missile
2015 <http://spacenews.com/commentary-strategic-stabil-ity-in-u-s-china-relations/>. 212 “Defense Programs and Budget of Japan – Overview of FY2016 Budget.” Ministry of Defense. 11 Aug. 2017: 11-13 <http://www.mod.go.jp/e/d_budget/pdf/280330.pdf>. 213 Ibid. 214 Kallender-Umezu, Paul. “Japan Boosts Space Spend-ing In Support of Security Focus.” 2 Feb. 2015. Space-News 10 Dec. 2015 <http://spacenews.com/japan-boosts-space-spending-in-support-of-security-focus/>. 215 “India’s successful AAD makes Pakistan’s missile strik-ing capability obsolete.” 18 May 2016. Defenceupdate.in 7 Aug. 2017 <http://defenceupdate.in/indias-successful-aad-makes-pakistans-missile-striking-capability-obsolete/>. 216 Gady, Franz-Stefan. “Did India Hide a Failed Super-sonic Missile Test?” 26 May 2016 The Diplomat 9 Aug. 2017 <http://thediplomat.com/2016/05/did-india-hide-a-failed-supersonic-missile-test/>.
Space Policies, Issues and Trends in 2016–2017
ESPI Report 63 69 September 2017
capabilities to be on a par with the U.S. and China.217
5.8 North Korea
North Korea successfully lifted its Kwang-myongsong 4 satellite into sun-synchronous LEO on its Unha-3 rocket on 7 February 2016. While the launch was deemed a success, no signals were detected from the spacecraft and ground observations show that it was initially tumbling.218 This launch follows two earlier launches conducted in 2012, the second of which also reached orbit but failed to transmit signals. In addition to placing small satellites into orbit, the Unha-3 rocket is thought to be
capable of reaching western U.S. territories. The Kwangmyongsong 4 reportedly carries earth observation equipment and is 200 kg. Other sources say that North Korea has sev-eral more satellite launch vehicles planned in the near future; the next Unha-3 launch is ex-pected to carry another Earth observation sat-ellite, while Kwangmyongsong 6, 7, and 8 are presumably communications satellites.219 This launch, as well as North Korea’s ballistic mis-sile and nuclear testing activities, motivated its neighbours and the U.S. to deploy the American-built Terminal High Altitude Area Defense (THAAD) system in South Korea by the end of 2017; while the move will likely to be welcomed by Japan’s strategic interests, it will be vigorously protested by China.220
217 “India Contemplates Anti-Satellite Vehicle Integration with Agni-III Ballistic Missile.” 15 Oct. 2013. Missile Threat 12 May 2014 <http://missilethreat.com/india-contemplates-anti-satellite-vehicle-integration-with-agni-iii-ballistic-mis-sile/>. 218 “Kwangmyŏngsŏng 4 (KMS 3).” 2 June 2017. Gunter’s Space Page 1 Sept. 2017 <http://space.sky-rocket.de/doc_sdat/kwangmyongsong-4.htm>.
219 Herman, Steve. “More N. Korean Long-Range Rocket Launches Expected ‘Soon’.” 31 July 2013. Voice of Amer-ica 24 Apr. 2014 <https://www.voanews.com/a/nkorea-claim-of-more-long-range-rocket-lauches-seen-as-credi-ble/1713495.html>. 220 Sang-Hun, Choe. “North Korea Test-Fires Missile From Submarine.” 23 Aug. 2016. The New York Times 17 Aug. 2017 <https://www.ny-times.com/2016/08/24/world/asia/north-korea-submarine-missile.html>.

ESPI Report 63 70 September 2017
6. Space Policies and Strategies around the World
The following chapter presents an overview and analysis of the space policies of all major space-faring countries. Attention is particu-larly given to high-level policy developments and general trends that reveal the different ac-tors’ strategic rationales. Military space and defence related policies were considered in more detail in Chapter Five.
6.1 European Union
With the EU’s three flagship space pro-grammes (Copernicus, Galileo and EGNOS) being well advanced, Europe has shifted its fo-cus from building space infrastructure toward ensuring strong market uptake of their space data and services by the public and private sectors. The European Commission released its Space Strategy on 26 October 2016 with the overarching aim of building a sustainable space economy. The strategy focuses on the need for investing in start-ups through its In-vestment Plan for Europe and boosting private investment with the development of a Pan-Eu-ropean Venture Capital Fund-of-Funds. It also aims to build on Europe’s space situational awareness capability, and restated its support for a GovSatCom programme.221
The Strategy proposes four strategic goals to be set by the European Commission. The first is to “maximise the benefits of space for soci-ety and the EU economy” by encouraging the uptake of space services and data, and ad-vancing the EU space programmes and meet-ing new user needs. Here, the Commission will promote the uptake of Copernicus, EGNOS and Galileo solutions in EU policies; facilitate the use of Copernicus data and information; stim-ulate the development of space applications; and promote the efficient and demand-driven use of satellite communications to foster ubiq-uitous connectivity in all Member States. The Commission will also maintain the stability of the EU space programmes and prepare the new generations on a user-driven basis; and it will address emerging needs related to climate
221 “Space.” European Commission 31 July 2017 <http://ec.europa.eu/growth/sectors/space_en>. 222 Commission of the European Communities. Communi-cation from the Commission to the European Parliament, the Council, the European Economic and Social Commit-
change, sustainable development, and secu-rity and defence.222
Its second goal is to “foster a globally compet-itive and innovative European space sector” by supporting research and innovation and devel-opment of skills, and fostering entrepreneur-ship and new business opportunities. Here, the Commission will step up its efforts to support space R&D activities and to boost the compet-itiveness of the European space sector; it will strengthen the use of innovative procurement schemes to stimulate the demand-side of in-novation and explore new ways to leverage private sector investments and partnerships with industry; it will promote the use of com-mon technology roadmaps to ensure greater complementarity of R&D projects; and will in-clude space and Earth observation in its blue-print for sectoral cooperation on skills address-ing new skills requirements in the sector. It will also step up support to space entrepre-neurs through EU funding programmes; en-gage in a dialogue with the European Invest-ment Bank (EIB) and European Investment Fund (EIF) on the support of investment in the space sector; and support space start-ups, in-cluding by exploring synergies with the up-coming Pan-European Fund of Funds.223
Its third goal is to “reinforce Europe's auton-omy in accessing space in a safe and secure environment” by maintaining Europe’s auton-omous access to space; ensuring access to ra-dio frequency spectrum; ensuring the protec-tion and resilience of critical European space infrastructure; and reinforcing synergies be-tween civil and security space activities. Here, the Commission will aggregate its demand for launch services to provide visibility to industry and reduce implementation costs; support re-search and innovation efforts to react to and anticipate disruptive changes, such as in launcher re-usability and small launchers; support European launch infrastructure facili-ties in line with its policy goals; and encourage the development of commercial markets for new space activities. Additionally, the Com-
tee and the Committee of the Regions. COM (2016) 705 fi-nal of 26 October 2016. Brussels: European Union <https://ec.europa.eu/transpar-ency/regdoc/rep/1/2016/EN/COM-2016-705-F1-EN-MAIN.PDF>. 223 Ibid.

Space Policies, Issues and Trends in 2016–2017
ESPI Report 63 71 September 2017
mission will enhance the current EU space sur-veillance and tracking (SST) services frame-work and will raise awareness of risks to criti-cal European space infrastructure, while also considering a more comprehensive space situ-ational awareness service (e.g. space debris, space weather and cyber alerts) in the long-term. Lastly, it will propose a GovSatCom ini-tiative to ensure reliable, secured and cost-ef-fective satellite communication services for EU and national public authorities and infrastruc-ture, and strengthen security requirements when developing EU space systems.224
In its fourth goal, the Commission aims to “strengthen Europe’s role as a global actor and promoting international cooperation” by pur-suing space dialogues with strategic interna-tional partners, by taking space policy into ac-count in EU export control dialogues with third countries, and it will use economic diplomacy and trade policy instruments to assist Euro-pean companies active in global markets and to address societal challenges. The Commis-sion will also foster the EU's contribution to GEO and CEOS, and will engage with interna-tional partners to promote responsible behav-iour in outer space and the preservation and protection of the space environment.225
6.2 European Space Agency
ESA’s budget increased by 18.5% to €5.253 billion in 2016 from €4.433 billion in the pre-vious year. Direct funding from ESA Member States increased by 15.4% to €3.740 billion, while funding from the EU and EUMETSAT grew by 26.7% to €1.510 billion for the year.226 The biggest budget allocation increase went to launcher development which grew by 73.0%, reaching €1.051 billion or one-fifth of ESA’s spending. Funding for Earth observation increased by 27.8%, reaching €1.604 billion (a 30.5% share of ESA’s budget), while spending on Navigation decreased by 8.3% to €609.5 million (11.6%). Funding for Space Science re-mained unchanged at €507.9 million (9.7%), while human spaceflight decreased by 1.7% to €365.1 million (7.0%). Next, Telecom & Inte-grated Applications increased by16.2% to €359.3 million (6.8%), while Robotic Explora-tion & Prodex also had an increase of 23.8% to €192.8 million (3.7%). Funding for Space 224 Ibid. 225 Ibid. 226 “ESA Budget 2016.” 20 Jan. 2016. ESA 20 July 2017 <http://www.esa.int/spaceinimages/Im-ages/2016/01/ESA_budget_2016>. 227 “ESA Budget 2016 by Domain. 14 Jan. 2016. ESA 20 July 2017 <http://www.esa.int/spaceinimages/Im-ages/2016/01/ESA_budget_2016_by_domain>. 228 “Shared vision and goals for the future of Europe in space.” 26 Oct. 2016. ESA 31 July 2017
Situational Awareness decreased by 7.2% reaching €12.9 million (0.2%), while the re-maining 8.6% of funding was allocated to ESA’s basic activities, activities associated with the General budget, and the European Cooperating States Agreement.227
ESA Director General Jan Woerner and Euro-pean Commissioner Elżbieta Bieńkowska signed a ‘Joint Statement on Shared Vision and Goals for the Future of European Space’ on 26 October 2016, coinciding with the re-lease of the European Commission’s ‘Space Strategy for Europe’. The document identified the following common interests as guiding principles for future cooperation: maximising the integration of space into European society and economy, fostering a globally competitive European space sector, and ensuring Euro-pean autonomy in accessing and using space in a safe and secure environment. It also em-phasised ESA’s and the EU’s intention to rein-force their cooperation in the future as fore-seen in the ESA/EU Framework Agreement of 2004. This shared vision and goals was also used as a high-level policy guiding element in the preparation of ESA DG Woerner’s proposal to ESA Member States for the 2016 Ministerial Council in December 2016.228
ESA’s Ministerial Council meeting took place on 1-2 December 2016, in Lucerne, Switzer-land. The meeting was intended to define ESA’s objectives based on the vision of a ‘United Space in Europe in the era of Space 4.0’. Here, Space 4.0 represents the evolution of the space sector into a new era where the increased number of new actors around the world (including the emergence of private companies, participation with academia, in-dustry and citizens, digitalization and global interaction) have changed the playing field among governments, the private sector, soci-ety and politics. Moreover, the Space 4.0 motif is analogous and intertwined with Industry 4.0 which represents the fourth industrial revolu-tion of manufacturing and services currently taking place.229 At the Ministerial, ESA tabled four future goals, in-line with the Joint State-ment between ESA and the EU in October 2016, aiming for a total sum of €11 billion in investment; by the conclusion of the meeting €10.3 billion in investments beyond 2021 had been committed by ministers to reach those
<http://m.esa.int/About_Us/Wel-come_to_ESA/Shared_vision_and_goals_for_the_future_of_Europe_in_space>. 229 “Media Backgrounder: ESA’s Ministerial 2016 in Lu-cerne.” 14 Nov. 2016. ESA 1 Aug. 2017 <http://www.esa.int/About_Us/Ministerial_Coun-cil_2016/Media_back-grounder_ESA_s_Ministerial_2016_in_Lucerne>.

ESPI Report 63 72 September 2017
future goals. Its first goal, to maximize the in-tegration of space into European society and economy received the targeted €2.5 billion; the second goal, to foster a globally competi-tive European space sector received €1.4 bil-lion, below its €1.5 billion target; the third goal, to ensure European autonomy in access-ing and using space in a safe and secure envi-ronment received €1.8 billion, much less than the €2.5 billion target; while the development of a foundation of excellence in space science and technology received €4.6 billion, higher than its €4.5 target.230
Within that €10.3 billion package, ESA’s Sci-ence programme will receive €508 million per year between 2017 and 2022, increasing by 1% annually; moreover, its ExoMars Mission will get €440 million, with €340 coming from additional contributions by governments while the remaining balance will be sourced from the ESA’s budget for mandatory activities. In com-mitments to the International Space Station to 2024, ESA agreed to spend a total of €960 mil-lion, including €153 million that will go toward experiments on Europe’s Columbus laboratory on the station. ESA is also building the service module for NASA’s Orion spacecraft to offset its 8.3% annual pro-rata share of the ISS’s op-erating costs. The Space Rider mission was al-lowed to move to the critical design review, which will use the structure of ESA’s Interme-diate Experimental Vehicle (IEV) to build an orbital reusable vehicle that is capable of being launched vertically on a Vega launcher and landing horizontally on an airstrip. Moreover, ESA has also agreed to spend up to €100 mil-lion on the Prometheus engine, intended to form the basis of a reusable first-stage for a future rocket. However, ESA’s Asteroid Impact Mission (AIM) with NASA did not gain the nec-essary support to begin.231 The next ESA Min-isterial Council meeting will take place in Spain in late 2019.
6.3 EUMETSAT
The European Organisation for the Exploitation of Meteorological Satellites (EUMETSAT) is an intergovernmental organisation that supplies
230 “European Ministers Ready ESA for a United Space in Europe in the Era of Space 4.0.” 2 Dec. 2016. ESA 1 Aug. 2017 <http://www.esa.int/About_Us/Ministerial_Coun-cil_2016/European_minis-ters_ready_ESA_for_a_United_Space_in_Europe_in_the_era_of_Space_4.0>. 231 De Selding, Peter B. “Europe commits to the space sta-tion and ExoMars as part of $11 billion in commitments to ESA.” 2 Dec. 2016. SpaceNews 4 Jan. 2017 <http://space-news.com/europe-commits-to-the-space-station-and-exo-mars-as-part-of-11-billion-in-commitments-to-esa/>. 232 “EUMETSAT Strategy Challenge 2025 Summary.” 15 June 2016. EUMETSAT 31 July 2017 <https://www.eu-
weather and climate-related satellite data to the National Meteorological Services of its Member and Cooperating States in Europe, and other users worldwide. EUMETSAT’s 85th Council meeting took place in Darmstadt, Ger-many, on 28 and 29 June 2016. At that meet-ing, the Council endorsed its new strategy “Challenge 2025” which establishes the frame-work for its activities in the next decade; the strategy focuses on the smooth transition of the current generation systems to the new MTG, EPS-SG and Jason-CS satellite systems and the full implementation of the Copernicus Sentinel -3, -4, -5 and -6 missions on behalf of the EU and further cooperation with inter-national partners.232 As a first step, the Coun-cil approved moving the Meteosat-8 spacecraft in GEO orbit over the Indian Ocean to replace its aging Meteosat-7 spacecraft as it ap-proaches the end of its service in the first quarter of 2017. The approval is EUMETSAT’s best-effort contribution to the multi-partner Indian Ocean Data Coverage (IODC) mission which also involves geostationary satellites from India, Russia and China; and it relieves a source of strain regarding a gap in coverage with the U.S. Air Force in 2015, as it relied on Meteosat-7 data for cloud characterization and weather imagery over the war-wracked re-gion, both essential for maintaining bat-tlespace awareness.233 Moreover, implemen-tation of its Polar System Second Generation (EPS-SG) programme progressed following the Council’s approval of a cooperation agree-ment with the DLR for the development of three METimage instruments and of an im-portant ground segment development contract covering all systems required to command and control the operations of the Metop-SG satel-lites from Darmstadt, Germany. The Council also approved the Third Continuous Develop-ment and Operations Phase (CDOP 3) of EUMETSAT’s eight Satellite Application Facili-ties (SAF) covering the period 2017-2022.234
During EUMETSAT’s 86th Council meeting, held on 6 and 7 December 2016 in Darmstadt, Ger-many, Council members agreed to shift the Metop-A polar-orbiting satellite into a drifting orbit in June 2017, and extend its operating life by two to three years while also conserving enough fuel to deorbit the spacecraft at the
metsat.int/web-site/wcm/idc/idcplg?IdcService=GET_FILE&dDocName=PDF_BR_COR02SUM_EN&RevisionSelectionMethod=LatestReleased&Rendition=Web>. 233 Gruss, Mike. “U.S. Military Faces Weather Coverage Gap over Hot Zones.” 13 Mar. 2015. SpaceNews 22 Dec. 2015 <http://spacenews.com/u-s-central-command-faces-weather-coverage-gap-over-hot-zones/>. 234 “At its 85th session, the EUMETSAT Council endorsed a new strategy establishing the framework for EUMETSAT activities in the next decade.” 29 June 2016. EUMETSAT 31 July 2017 <https://www.eumetsat.int/web-site/home/News/DAT_3112252.html>.

Space Policies, Issues and Trends in 2016–2017
ESPI Report 63 73 September 2017
end of its service. Metop-A is part of the space segment of EUMETSAT’s current EUMETSAT Polar System (EPS) programme. The EPS pro-gramme consists of three identical polar-orbit-ing Metop satellites together with relevant ground systems. The Metop satellites are launched at six-year intervals between 2006 and 2018. Metop-A was launched on 19 Octo-ber 2006, joined by Metop-B on 17 September 2012; Metop-C is expected to launch in Octo-ber 2018.235 The Council meeting also ap-proved a contract with Thales Alenia Space for the payload data acquisition and processing function of the ground segment for the Metop-SG satellites.236
Six Metop Second Generation (Metop-SG) sat-ellites will form the space segment of the Sec-ond Generation EUMETSAT Polar System (EPS-SG). The entire program is budgeted at about €4.1 billion, with EUMETSAT contrib-uting about 80% of the budget, while ESA will cover the rest; the satellites are intended to operate between 2021 and around 2042.237 The Metop-SG satellites will operate in 3 pairs, each carrying a different but complementary suite of instruments, and will be manufactured by Airbus D&S under a €1.32 billion contract signed on 16 October 2014.238 While the first two Metop-SG satellites, Metop-SG A and Metop-SG B, are scheduled to launch 2021 and 2022 respectively, both satellites have under-gone a late redesign to include larger propel-lant tanks to ensure a controlled deorbit at the end of their service.239
EUMETSAT’s current Meteosat programme consists of both Meteosat First Generation (MFG) and the Meteosat Second Generation (MSG) satellites operating in geostationary or-bit over Europe and Africa. EUMETSAT had added the MSG-4 satellite to its MSG pro-gramme on 15 July 2015, and following its commissioning phase the spacecraft was re-named Meteosat-11 in December 2015. Fol-lowing its successful launch and commission-ing, Meteosat-11 will be placed into in-orbit storage for 2.5 years, meant for use prior to the deployment of Eumetsat’s MTG system.
235 “Metop.” Eumetsat 31 July 2017 <http://www.eu-metsat.int/website/home/Satellites/CurrentSatel-lites/Metop/index.html>. 236 Henry, Caleb. “Eumetsat will shift Metop-A’s orbit to prolong its life, ensure deorbiting.” 16 Dec. 2016. Space-News 31 July 2017 <http://spacenews.com/eumetsat-will-shift-metop-as-orbit-to-prolong-its-life-ensure-deorbiting/>. 237 De Selding, Peter B. “ESA, Eumetsat Finalize Contract for Next-gen Weather Satellites.” 6 Oct. 2015. SpaceNews 13 Jan. 2016 <http://spacenews.com/esa-eumetsat-final-ize-contract-for-next-gen-weather-satellites/>. 238 De Selding, Peter B. “Airbus Signs $1.7 Billion Contract for Six Metop Weather Satellites.” 16 Oct. 2015. Space-News 3 June 2016 <http://spacenews.com/42212airbus-signs-17-billion-contract-for-six-metop-weather-satellites/>.
The MSG programme has three other satellites in operation, Meteosat -8 to -10, which are ex-pected to end service in 2019, 2021, and 2022 respectively. With the health of all Meteosat satellites confirmed as at February 2016, EUMETSAT’s Council was then willing to use the residual capacity of Meteosat-8 to support the IODC above the Indian Ocean.240
The Meteosat Third Generation (MTG) system is a series of sounding and imaging satellites in geostationary orbit, being developed by France’s Thales Alenia Space and Germany’s OHB AG, and is aimed at providing services for the 2020 to 2040 timeframe. On 24 July 2015, the EUMETSAT Council approved the contract with Arianespace for the launches of the first three MTG satellites (the MTG-I1, MTG-S1, and one option for MTG–I2).241 The satellites are scheduled to be launched to GEO orbit within the 2019-2023 timeframe, and will op-erate from 2020 to 2040.242
6.4 National Governments
6.4.1 France
On 1 June 2016, the merged launch direc-torate of the French space agency (CNES) and the European Space Agency (ESA) presented two reusable projects to France’s space policy minister, Thierry Mandon. The first project, Prometheus is a joint initiative of CNES and Airbus Safran Launchers (ASL) for the devel-opment a cheaper reusable first stage engine. Currently, the Vulcain cryogenic engine on the first stage of the Ariane 5 launcher, and in-tended for the Ariane 6 launcher, costs up-wards of €10 million for each launch, not in-cluding its strap-on boosters. Depending on its configuration, the future Prometheus engine could reduce that cost by half, as each engine will cost €1 million. The second project, Cal-listo is a joint CNES-DLR-JAXA project that is intended as a reusable launcher technology demonstrator of Prometheus to launch before
239 Henry, Caleb. “Eumetsat will shift Metop-A’s orbit to prolong its life, ensure deorbiting.” 16 Dec. 2016. Space-News 31 July 2017 <http://spacenews.com/eumetsat-will-shift-metop-as-orbit-to-prolong-its-life-ensure-deorbiting/>. 240 De Selding, Peter B. “Eumetsat to continue gap-filler role over Indian Ocean region.” 30 June 2016. SpaceNews 10 Nov. 2016 <http://spacenews.com/eumetsat-to-con-tinue-gapfiller-role-over-indian-ocean-region/>. 241 “EUMETSAT and Arianespace announce signature of launch contract for three MTG satellites.” 16 July 2015. Eu-metsat 3 June 2016 <http://www.eumetsat.int/web-site/home/News/DAT_2703454.html?lang=EN&pState=1>. 242 Henry, Caleb. “Arianespace Wins Fresh Eumetsat Con-tract After MSG 4 Launch.” 16 July 2015. Via Satellite 3 June 2016 <http://www.satel-litetoday.com/launch/2015/07/16/arianespace-wins-fresh-eumetsat-contract-after-msg-4-launch/>.

ESPI Report 63 74 September 2017
2020.243 While CNES is the driver in develop-ing the Prometheus engine, ESA agreed to contribute €80 million to the project following the ESA Ministerial Council meeting on 2 De-cember 2016.244
CNES enhanced its collaborative relationships in 2016. On 25 January 2016, CNES President Jean-Yves Le Gall and ISRO’s president A.S. Kiran Kumar signed three cooperation agree-ments during French President François Hol-lande’s State visit to India. CNES and ISRO will develop a thermal climate-monitoring satellite to map heat exchanges on Earth’s surface and to offer support to new applications in agricul-ture, forest monitoring, soil and groundwater pollution monitoring and volcanology. ISRO’s Oceansat3 satellite will host France’s Argos 4 environmental data collection and location in-strument when it is launched in 2018. And the Agencies signed a Letter of Intent on CNES’s participation in ISRO’s next Mars Mission.245 Also, on 6 September 2016, CNES signed an agreement with the Vietnamese Academy of Science and Technology (VAST) to reinforce cooperation between France and Vietnam. France and Vietnam have long-standing rela-tions in this field, with the launches of three Vietnamese satellites having been carried out from the Guiana Space Center in Kourou, French Guiana.246
6.4.2 Germany
The German space agency (DLR) formed and reinforced several collaborative relationships in 2016. The first took place on 19 January 2016 in the form of a three-year agreement between the DLR’s Project Management De-partment and China’s National Centre for Sci-ence and Technology Evaluations (NCSTE) for cooperation in the development of research
243 “Thierry Mandon visits CNES’s Launch Vehicles Direc-torate (DLA) : presentation of Ariane 6 and Vega-C pro-grammes and their future evolutions.” 1 June 2016. CNES 18 July 2017 <https://presse.cnes.fr/en/thierry-mandon-vis-its-cness-launch-vehicles-directorate-dla-presentation-ari-ane-6-and-vega-c>. 244 Henry, Caleb. “ESA kickstarts Prometheus reusable en-gine with first funding tranche.” 22 June 2017. SpaceNews 18 July 2017 <http://spacenews.com/esa-kickstarts-prome-theus-reusable-engine-with-first-funding-tranche/>. 245 “List of Agreements/MOUs signed during the State Visit of President Francois Hollande of the French Republic to India (January 25. 2016).” 25 Jan. 2016. Ministry of Exter-nal Affairs – Government of India 20 Aug. 2017 <http://www.mea.gov.in/bilateral-docu-ments.htm?dtl/26294/List+of+Agree-mentsMOUs+signed+during+the+State+Visit+of+Presi-dent+Francois+Hollande+of+the+French+Republic+to+In-dia+January+25+2016>. 246 “France / Vietnam : la visite de François Hollande relance la coopération économique.” 7 Sept. 2016. Le Moci 19 Aug. 2017 <http://www.lemoci.com/actual-ites/pays-marches/france-vietnam-la-visite-de-francois-hol-lande-relance-la-cooperation-economique/>.
and innovation, i.e. specifically in terms of quality assurance and the evaluation of re-search projects, the continued development of national promotion systems and joint publica-tions on selected topics.247 On 23 February 2016, the DLR signed an Implementing Agree-ment with the Korea Aerospace Research In-stitute (KARI) to strengthen their partnership in the operation of and reception of data from Korean EO satellites, and for increased scien-tific exchange. And on 25 February 2016, the DLR and the Japan Aerospace Exploration Agency (JAXA) signed an ‘Inter Agency Ar-rangement for Strategic Partnership’ to achieve common strategic goals, including the development and use of aeronautic and space technologies that contribute to solving global societal challenges, expanding their founda-tions for scientific excellence in research, and guaranteeing the enhancement of the compet-itiveness of both countries.248 The DLR and France’s CNES also renewed their 2002 frame-work agreement for bilateral cooperation on 2 June 2016249, and the two agencies signed an-other agreement for the design, construction and operation phases of the Methane Remote Sensing LIDAR Mission (MERLIN) environmen-tal satellite on 14 September 2016.250 And a Memorandum of Understanding was signed between the DLR and the private Russian uni-versity, Skolkovo Institute of Science and Technology, for scientific cooperation covering materials research, life sciences, climate re-search, space law, and planetary research.251
6.4.3 Italy
The Italian space agency (ASI) released its Strategic Vision Document for the period 2016 – 2025 (Documento di Visione Strategica 2016-2025) on 14 December 2016. The docu-ment lays out four strategic priorities for ASI
247 “Germany and China broaden their collaboration in sci-ence management.” 22 Jan. 2017. DLR 3 Aug. 2017 <http://www.dlr.de/dlr/presse/en/desktopdefault.aspx/tabid-10172/213_read-16485/#/gallery/21731>. 248 “DLR is expanding cooperation with Japan and South Korea.” 29 Feb. 2016. DLR 3 Aug. 2017 <http://www.dlr.de/dlr/en/desktopdefault.aspx/tabid-10857/1527_read-16946/#/gallery/22220>. 249 “DLR and CNES renew their framework agreement for bilateral cooperation.” 2 June 2016. DLR 3 Aug. 2017 <http://www.dlr.de/dlr/en/desktopdefault.aspx/tabid-10081/151_read-18064/year-2016/151_page-4/#/gal-lery/23231>. 250 “Climate protection – DLR and CNES sign an agree-ment for the construction and operation of the MERLIN en-vironmental satellite.” 14 Sept. 2016. DLR 3 Aug. 2017 <http://www.dlr.de/dlr/en/desktopdefault.aspx/tabid-10081/151_read-19317/year-2016/151_page-3/#/gal-lery/24323>. 251 “Abkommen zur Wissenschaftskooperation mit der rus-sischen SkolTech-Universität unterzeichnet.” 13 June 2016. DLR 3 Aug. 2017 <http://www.dlr.de/dlr/desk-topdefault.aspx/tabid-10857/1527_read-18243#/gal-lery/23392>.
Space Policies, Issues and Trends in 2016–2017
ESPI Report 63 75 September 2017
over the next decade. Those goals are: 1) to promote the development of services and ap-plications for the space economy; 2) to pro-mote the development and use of infrastruc-tures for the space economy; 3) to accelerate and support scientific and cultural progress (science diplomacy); and 4) to raise the coun-try’s international prestige (space diplo-macy).252 Nested within these goals are spe-cific intervention areas and programmes areas that indicate the direction in which ASI will op-erate in order to make progress in satisfying each goal. The first goal focuses on the up-stream and downstream components of the space value chain, and is centred on “user up-take” of services to facilitate the growth of the space economy over the next decade. The sec-ond goal looks at developing infrastructures that facilitate the emergence an industrial and economic base in which new initiatives can grow. The third goal envisages the preferred approach of defining and coordinating scien-tific programmes, identifying seven areas of focus: high-energy and space astrophysics; planetology, solar system science and ex-oplanetology; cosmology; fundamental phys-ics; Earth sciences; scientific and technological research on the ISS; and disseminating space culture. The fourth goal seeks to raise Italy’s global prestige in space diplomacy in three ar-eas: cooperation on European level, coopera-tion with NASA, and cooperation with other space agencies and institutions in the world.253
ASI formed and reinforced several collabora-tive relationships in 2016. The first took place on 25 January 2016, in the form of a Memo-randum of Understanding (MoU) with the United Arab Emirates (UAE) Space Agency, which provided a broad framework agreement to carry out cooperative space activities be-tween the two entities.254 On 18 May 2016, the heads of ASI and the Argentinian Space Agency (CONAE) signed a Letter of Intent to extend and strengthen collaboration in the field of space activities255; and on 17 June 2016 another MoU was agreed between ASI and the Russian Space Agency (Roscosmos) to cooperate in the field of remote sensing and
252 Battiston, Roberto. “Documento di Visione Strategica 2016-2025.” 14 Dec. 2016. ASI 2 Aug. 2017 <http://www.asi.it/it/news/documento-di-visione-strategica-2016-2015>. 253 “STRATEGIC VISION DOCUMENT 2016-2025.” 14 Dec. 2016. ASI 2 Aug. 2017 <http://www.asi.it/sites/de-fault/files/attach/dettaglio/dvs-ing_web.pdf>. 254 Bongiorno, Massimo. “Italy and the United Arab Emir-ates space agreement.” 25 Jan. 2016. ASI 1 Aug. 2017 <http://www.asi.it/en/news/italy-and-united-arab-emirates-space-agreement>. 255 “Italy - Argentina means space collaboration.” 18 May 2016. ASI 1 Aug. 2017 <http://www.asi.it/en/news/italy-ar-gentina-means-space-collaboration>. 256 “Australia, Italy sign contract for a collaborative partner-ship in space.” 27 Oct. 2016. Geospatial World 1 Aug.
Earth observation during the Saint Petersburg Economic Forum. And on 27 October 2016, ASI and the government of Australia signed a collaborative partnership agreement to pursue space activities, promoting future joint re-search and development, academic exchange and industry cooperation.256
6.4.4 United Kingdom
The UK Government’s National Space Policy document was released near the end of 2015. It sets out its vision to capture a greater share of the world’s thriving space market as the UK aims to become a future European hub for commercial spaceflight and related space sec-tor technologies.257 The National Space Policy commits to four key principles in the govern-ment’s use of space: i.e. it recognises the stra-tegic importance of space; commits to pre-serving and promoting the safety and security space; supports the growth of the space sec-tor; and commits to international cooperation to deliver maximum benefit from UK invest-ment in space.258 In that pursuit, the UK gov-ernment spent much of 2016 working with in-dustry and the science community to develop a new strategy for its implementation, issuing a call for ideas and evidence to help develop a new space strategy on 15 November 2016.259
On 7 April 2016, the UK Space Agency pub-lished its Corporate Plan for the period 2016/2017, laying out an overview of the Agency’s mandate, strategy, and key targets and milestones. Between 2016 and 2017, it expects to launch its NovaSAR imaging space-craft. It also hopes to expand its Space for Smarter Government Programme, and con-tinue the International Partnership Pro-gramme (IPP). Lastly, it hopes to deliver the UK flight instruments for integration in the ESA’s ExoMars Rover and Solar Orbiter, and to receive the first science survey results from Gaia and the first data from Lisa Pathfinder.260
The United Kingdom also took a step closer to realising its goal to a spaceport for orbital and suborbital commercial launch activities. On 12
2017 <https://www.geospatialworld.net/news/australia-it-aly-sign-contract-collaborative-partnership-space/>. 257 “National Space Policy.” 13 Dec. 2015. GOV.UK 27 July <https://www.gov.uk/government/uploads/system/up-loads/attachment_data/file/484865/NSP_-_Final.pdf> 258 Ibid. 259 “Call for ideas and evidence: help develop a new space strategy.” 15 Nov. 2016. GOV.UK 27 July 2017 <https://www.gov.uk/government/publications/call-for-ideas-and-evidence-help-us-develop-our-new-strategy>. 260 “UK Space Agency Corporate Plan 2016 – 2017.” 7 Apr. 2016. GOV.UK 27 July 2017 <https://www.gov.uk/government/publications/uk-space-agency-corporate-plan-2016-2017>.

ESPI Report 63 76 September 2017
July 2016, the British government awarded feasibility-study contracts for horizontal or vertical launch proposals by five industrial teams: Airbus Safran Launchers; Orbital Ac-cess (in association with BAE Systems and Re-action Engines Ltd); Virgin Galactic; Deimos Space UK (in association with Firefly Space Systems of the US); and Lockheed Martin. As proposals of the last three teams are centred on U.S.-based technology, they would need to clear export restrictions under the multilateral Missile Technology Control Regime and the U.S. ITAR261. The total value of the contracts is a modest £1.5 million, but aside from that injection there were no other government commitments to funding spaceport develop-ment in 2016.262
6.5 United States
On 23 December 2016, U.S. President Obama signed the National Defense Authorization Act for Fiscal Year 2017 (NDAA-17) which re-pealed a provision in the previous year’s NDAA permitting the use of the Russian-built RD-180 engine for the U.S. Evolved Expendable Launch Vehicle (EELV) Program with the ex-ception of orders or options for RD-180 en-gines already awarded under a contract signed on 18 December 2013, and for contracts for the use of a total of 18 additional RD-180 en-gines between the date of the enactment of the NDAA-2017 and ending 31 December 2022.263 Russia’s 2014 incursion in Ukraine has stoked continuing tensions between the U.S. and Russia which led the U.S. Congress to prohibit U.S. companies from contracting with Russian suppliers of rocket engines or re-newing current contracts for space launch ac-tivities.264 Since ULA uses RD-180 engines for
261 De Selding, Peter B. “Britain selects U.S., French, Brit-ish teams to study spaceport feasibility.” 13 July 2016. SpaceNews 10 Nov. 2016 <http://spacenews.com/britain-selects-u-s-french-british-teams-to-study-spaceport-feasi-bility/>. 262 De Selding, Peter B. “Britain endorses ESA, promises increased export-credit support for industry.” 25 Nov. 2016. SpaceNews 4 Jan. 2017 <http://spacenews.com/britain-endorses-esa-promises-increased-export-credit-support-for-industry/>. 263 “Statement by the President on Signing the National Defense Authorization Act for Fiscal Year 2017.” 23 Dec. 2016. The White House President Barack Obama 15 Aug. 2017 <https://obamawhitehouse.archives.gov/the-press-of-fice/2016/12/23/statement-president-signing-national-de-fense-authorization-act-fiscal>. 264 Section 1608. Carl Leven and Howard P. “Buck” McKeon National Defense Authorization Act for Fiscal Year 2015, Pub. L. no 113-291 (2014) <http://www.gpo.gov/fdsys/pkg/CPRT-113HPRT92738/pdf/CPRT-113HPRT92738.pdf>. 265 Gruss, Mike. “House-Senate Conference Measure To End Pentagon Use of RD-180.” 5 Dec. 2014. SpaceNews
the first stage of its Atlas 5 launcher, the re-striction limited its use before ULA’s follow-on Vulcan launcher - powered by Blue Origin’s BE-4 engine - is ready in 2022. The result is that while ULA has an exemption for the 34 RD-180 engines that were ordered while the NDAA-15 was still pending265, and the 20 more RD-180 engines ULA had ordered by 23 De-cember 2015266, the NDAA-17 gives ULA ac-cess to 18 more RD-180 engines in order to remain competitive with SpaceX.267
On 29 December 2016, the incoming admin-istration of President-Elect Trump announced the idea of relaunching the National Space Council (NSC) to oversee U.S. space policy. The NSC had originated during the inception of NASA in 1958 as a mechanism to help guide the U.S. space agenda. Upon taking office, it is likely that the NSC will be established within the White House with Vice President Mike Pence as its chair. Some cross-cutting issues that it might choose to address include: export control and acquisition reform; the health of the U.S. space industrial base; space debris mitigation and space traffic management; the facilitation of emerging commercial space in-dustries; and the determination of goals and priorities for space activities beyond LEO.268
6.5.1 National Aeronautics and Space Administration (NASA)
The White House released its 2017 NASA budget request to the U.S. Congress on 9 Feb-ruary 2016, seeking $19.025 billion for 2017, a decrease of 1.3% from the $19.285 billion it received from the 2016 omnibus spending bill signed by President Obama on 18 December 2015.269 Exploration programmes saw the sharpest cuts in spending, decreasing from $4.030 billion in 2015 to $3.337 billion; the decrease came from a $689.7 million cut to
22 July 2015 <http://spacenews.com/42701house-senate-conference-measure-to-end-pentagon-use-of-rd-180/>. 266 Shalal, Andrea. “ULA Orders 20 More RD-180 Rocket Engines.” 23 Dec. 2015. SpaceNews 14 Jan. 2016 <http://spacenews.com/ula-orders-20-more-rd-180-rocket-engines/>. 267 Gruss, Mike. “HASC doubles Air Force allotment of RD-180 engines, focuses funding on building its replacement.” 28 Apr. 2016. SpaceNews 8 Nov. 2016 <http://space-news.com/the-rd-180-amendment-was-one-of-two-launch-related-provisions-that-made-it-into-the-national-defense-authorization-act-of-2017-by-the-time-the-committee-voted-60-to-2-to-send-the-bill-to-the-full/>. 268 David, Leonard. “Playing the Space Trump Card: Re-launching a National Space Council.” 29 Dec. 2016. Space.com 19 Aug. 2017 < https://www.space.com/35163-trump-administration-national-space-council.html>. 269 Smith, Marcia S. “NASA Gets Big Boost in Final FY2016 Appropriations Bill.” 16 Dec. 2015. Space Policy Online 30 June 2016 <http://www.spacepolicy-online.com/news/nasa-gets-big-boost-in-final-fy2016-ap-propriations-bill>.

Space Policies, Issues and Trends in 2016–2017
ESPI Report 63 77 September 2017
the SLS programme and $150.2 million cut in the Orion programme, amounting to $1.310 billion and $1.120 billion respectively. Despite raising concerns in Congress about whether the request will keep NASA on track with its exploration goals, NASA officials believe the budget will support the Exploration Mission (EM) 1 of the first launch of the SLS and Orion spacecraft in 2018, and a second launch of EM-2 as early as 2021.270 NASA’s Science pro-gramme received nearly the same funding as in 2016, however Earth Science will increase by $111.2 million to $2.032 billion, while Plan-etary Science will decrease by almost the same amount ($112.3 million) to $1.519 bil-lion. The funding requested for NASA’s Com-mercial Crew Programme also decreased by $59 million, reaching $1.185 billion for 2017.271 A final 2017 appropriations bill was not approved by Congress by the end of 2016, as the U.S. House of Representatives passed its final bills of the 114th Congress on 8 De-cember 2016, while the U.S. Senate passed a NASA authorization bill on the following day – leaving the Senate’s amended version the ‘NASA Transition Authorization Act of 2016’ open for discussion when the 115th Congress convenes in January 2017.272
6.5.2 National Oceanic and Atmospheric Administration (NOAA)
The U.S. White House sent its 2018 fiscal budget request for NOAA to Congress on 23 May 2017 requesting $4.775 billion in overall funding, a decrease of 15.8% from the $5.675 billion NOAA received in 2016. Its National En-vironmental Satellite, Data and Information Service (NESDIS) division received a 17.6% decrease in funding, amounting to $1.816 bil-lion in the FY18 request from the $2.204 billion it received in 2016, while nearly every other NOAA divisions also had substantial reductions in funding.273 It should be noted that the White House administration’s 2017 budget request also sought a decrease to reflect its planned ramp-down of the Geostationary Operational Environmental Satellite R (GOES-R) and Joint Polar Satellite System (JPSS), however this new budget request would accelerate NOAA’s Polar Follow-On programme for the third and fourth JPSS satellites, while also cutting for the
270 Foust, Jeff. “Bolden defends NASA budget in a House committee farewell.” 18 Mar. 2016. SpaceNews 10 Nov. 2016 <http://spacenews.com/bolden-defends-nasa-budget-in-a-house-committee-farewell/>. 271 Foust, Jeff. “White House proposes $19 billion NASA budget.” 9 Feb. 2016. SpaceNews 10 Nov. 2016 <http://spacenews.com/white-house-proposes-19-billion-nasa-budget/>. 272 Foust, Jeff. “In symbolic move, Senate passes NASA authorization bill.” 10 Dec. 2016. SpaceNews 4 Jan. 2017 <http://spacenews.com/in-symbolic-move-senate-passes-nasa-authorization-bill/>.
Earth Observing Nanosatellite-Microwave (EON-MW) mission that act as a gap-filler in case a similar instrument on the first JPSS sat-ellite encounters a problem.274 While NOAA plans to launch its JPSS-1 satellite in 2017 and JPSS-2 in 2021, work on a Polar Follow-on sys-tem is already underway to mitigate the risk of a premature failure of the JPSS-2, which would result in gap in critical weather data. The request also proposed the cancellation of four Earth science missions: i.e. the Plankton, Aerosol, Cloud, ocean Ecosystem (PACE) sat-ellite, the Climate Absolute Radiance and Re-fractivity Observatory (CLARREO) Pathfinder, and the Orbiting Carbon Observatory (OCO) 3 instruments for the International Space Sta-tion, and the Earth imaging instruments on the Deep Space Climate Observatory (DSCOVR). The 2018 budget request for the JPSS system had a planned decrease of 3.9% to $775.8 mil-lion from $807.4 million received in 2016; meanwhile the Polar Follow-On programme re-quest decreased by 51.3% to $180.0 million from the $369.3 million initial tranche appro-priated in 2016, to work on the two final JPSS-3 and JPSS-4 satellites. The funding request for GOES-R’ four satellite constellation had a planned decrease of 38.0% amounting to $518.5 million from $836.243 million received in 2016; the first GEOS-R was launch on 19 November 2016. Funding for the joint U.S.-Taiwan COSMIC-2 constellation decreased by 39.5% to total $6.1 million from the $10.1 mil-lion it received in 2016. And finally, with the launch of Jason-3 on 19 January 2016, NOAA requested an increase of $3.1 million for tech-nical and engineering assistance and a planned system refresh of the current ground system; it also requested an increase of $2.4 million to continue on-orbit support for the DSCOVR satellite, which launched on 11 Feb-ruary 2015.275
6.6 Canada
On 22 November 2016, Canada’s Innovation, Science and Economic Development (ISED) Minister Navdeep Bains announced that a new Canadian space strategy would be released in June of 2017. While it was discussed during
273 “NOAA Cut 16% in President Trump’s Budget Request.” 31 May 2017. The Bridge 31 Aug. 2017 <http://thebridge.agu.org/2017/05/31/noaa-cut-16-presi-dent-trumps-budget-request/>. 274 Foust, Jeff. “White House seeks near-term cuts to NASA and NOAA programs.” 28 Mar. 2017. SpaceNews 31 Aug. 2017 <http://spacenews.com/white-house-seeks-near-term-cuts-to-nasa-and-noaa-programs/>. 275 FY 2018 NOAA Budget Summary. 23 May 2017. NOAA 31 Aug. 2017: 41-49 <http://www.corporateser-vices.noaa.gov/nbo/fy18_bluebook/FY18-BlueBook.pdf>.

ESPI Report 63 78 September 2017
the AIAC 2016 Canadian Aerospace Space Summit, the announcement hinted that MDA and its partners would continue to be sup-ported with a C$54 million contribution from its Technology Demonstration Programme (TDP) and that Canada’s government is com-mitted to revitalizing the Space Advisory Board (SAB). Prior to the strategy’s release in June, the SAB will consult stakeholders to de-fine the key elements of a space strategy, and similar to Europe’s Space Strategy, it will focus on using space to drive broader economic growth through supporting talent, research and entrepreneurship in the industry.276
The CSA budget for the fiscal year 2016-17 covering 1 April 2016 to 31 March 2017, de-creased by 10.6% to C$432.39 million from C$483.43 million in the previous year. About 49.7% of the funding was allocated to its Space Data, Information and Services, while 23.0% went to Space Exploration, 15.3% went to Future Canadian Space Capacity, and the remaining 12.0% share went to Internal Ser-vices. The decrease came mainly from a C$43.3 million reduction related to the RADARSAT Constellation Mission (RCM), due to a change in cash flow requirements. Also its contribution to ESA increased to C$27.031 million in 2016-17, from C$26.215 million in the previous year. 277 Under its Economic Ac-tion Plan, Canada plans to increase its spend-ing by an additional C$30 million for ESA’s ARTES programme, distributed over the period of 2016 to 2019. Moreover, Canada has also committed to extending its participation in the ISS to 2024, and has historically provided 2.3% of the ISS’s common operating costs.278
6.7 Russia
On 28 December 2015, Russian President Vla-dimir Putin signed a decree dissolving Russia’s Federal Space Agency, known as Roscosmos, transferring the agency's responsibilities to
276 Boucher, Marc. “New Canadian Space Strategy Coming in June 2017.” 22 Nov. 2016. SpaceRef Canada 21 Aug. 2017 <http://spaceref.ca/news/new-canadian-space-strat-egy-coming-in-june-2017.html>. 277 “Main Estimates - 2016–17 Estimates - Canadian Space Agency.” 23 Feb. 2017. Government of Canada 20 Aug. 2017 <https://www.canada.ca/en/treasury-board-sec-retariat/services/planned-government-spending/govern-ment-expenditure-plan-main-estimates/2016-17-esti-mates/main-estimates.html#toc7-37>. 278 SpaceNews Editor. “Editorial | Canadian Commitment Builds Momentum for Space Station Extension.” 5 May 2015. SpaceNews 11 Jan. 2016 <http://space-news.com/editorial-canadian-commitment-builds-momen-tum-for-space-station-extension/>. 279 “Russian space agency gets replaced by state corpora-tion — Kremlin.” 28 Dec. 2015 TASS 18 Aug. 2017 <http://tass.com/science/847295>.
the newly formed ‘Roscosmos State Corpora-tion’.279 The decree took effect on 1 January 2016, and while the powers and functions of Roscosmos will remain the same, the new or-ganization will be run as a corporation with control over Russia’s entire space industry.280 The creation of the Roscosmos State Corpora-tion is another step in Russia’s reorganization of its space sector which began in December 2013.281 In addition to increasing Russia’s competitiveness, both in gaining market share and in securing parity and advantage over ge-opolitical opponents, the reorganization is in-tended to strengthen Russia’s struggling space industry, which has a seen a number of high-profile failures in recent years. In that context, on 19 April 2016 Roscosmos provided a 20 bil-lion rouble cash infusion to the space-hard-ware builder Khrunichev Space Center to re-pay its suppliers. As the total debt of the Khrunichev Space Center stood at 114 billion as at 2014, Roscosmos will facilitate subsidies from the Russian government and loans from the Russian development bank,Vnesheconom-bank, to stabilize its accounts as part of the first phase of Khrunichev’s 10-year recovery schedule. The second phase, taking place be-tween 2017 and 2020, will include a broad re-organization of Khrunichev which should yield sustained profitability between 2021 and 2025, in addition to continued increases in both labour productivity and salaries.282
On 18 August 2016, Boeing and its Russian and Ukrainian partners in the Sea Launch joint venture reached a preliminary framework agreement to settle a lawsuit initiated by Boe-ing in February 2013. Boeing had sued Rus-sia’s RSC Energia and the Ukrainian launch ve-hicle manufacturer Yuzhnoye for refusing to pay more than $350 million following Sea Launch’s 2009 bankruptcy, leaving Boeing to cover $449 million in loan guarantees to third-party creditors on its own. In its lawsuit, Boe-ing said that RSC Energia owed at least $222.3 million and that Yuzhnoye owed at least $133.4 million.283 On 12 May 2016, the U.S. District Court in California issued a judgment
280 Nowakowski, Tomasz. “Russia dissolves its federal space agency, what now?” 30 Dec. 2015. Spaceflight In-sider 18 Aug. 2017 <http://www.spaceflightinsider.com/or-ganizations/roscosmos/russia-dissolves-federal-space-agency-now/>. 281 “Putin Signs Decree on Creation of United Rocket and Space Corporation.” 2 Dec. 2013. TASS 18 Aug. 2017 <http://en.itar-tass.com/russia/709849>. 282 De Selding, Peter B. “Russia bails out debt-ridden Khrunichev.” 20 Apr. 2016. SpaceNews 10 Nov. 2016 <http://spacenews.com/russian-government-provides-debt-ridden-khrunichev-with-cash-and-loans/>. 283 Raymond, Nate. “Boeing sues Sea Launch partners for $350 million.” 4 Feb. 2013. Reuters 18 Aug. 2017 <http://www.reuters.com/article/2013/02/04/boeingse-alaunch-idUSL1N0B31GP20130204>.

Space Policies, Issues and Trends in 2016–2017
ESPI Report 63 79 September 2017
in favour of Boeing, concluding that RSC Ener-gia owed Boeing more than $320 million in re-imbursement obligations as defined in prior agreements. Boeing and RSC Energia expect to reach a final agreement to settle the lawsuit by the end of 2016, wherein the parties have agreed that Boeing will write-off part of the judgement in compensation for a cooperative agreement to develop a docking adaptor that could be used by both Boeing’s CST-100 Star-liner crew spacecraft and Russia’s next-gener-ation crewed spacecraft called ‘Federation, be-ing developed by Energia for Roscosmos.284 The settlement still leaves open the status of Sea Launch which is now primarily owned by RSC Energia, and has remained docked in port in California since its last mission to launch Eutel-sat’s Eutelsat 3B to GEO on 26 May 2014.
6.8 Japan
Japan’s Space Policy Commission published a revised version of the third iteration of its Basic Plan for Space Policy on 11 November 2015.285 Other than recommending that the IGS system be expanded to eight satellites (plus two relay satellites to support the constellation) from the original two optical and two radar satellites (plus one on-orbit spare), the revised version was in line with the original third iteration of its Basic Plan for Space Policy published on 9 Jan-uary 2015. This new 10-year roadmap marks a shift Japan’s priorities from its previous Basic Plans published in 2009, and updated early in 2013, now focusing on security and commerce rather than its earlier emphasis on the peaceful use of outer space. Another departure in this policy is in the naming of China as a destabiliz-ing factor in global security, particularly in its growing counter-space capability and develop-ment of anti-satellite weapons.286 The new pol-icy puts greater focus on developing Japan’s In-formation Gathering Satellites (IGS) to further improve the country’s surveillance and recon-naissance competencies. Moreover, it looks to
284 Foust, Jeff. “Boeing and Energia negotiating Sea Launch settlement.” 19 Aug. 2016. SpaceNews 18 Aug. 2017 <http://spacenews.com/boeing-and-energia-negotiat-ing-sea-launch-settlement/>. 285 Kallender-Umezu, Paul. “What’s Behind Japan’s Sud-den Thirst for More Spy Satellites.” 13 Nov. 2015. Space-News 7 Jan. 2016 <http://spacenews.com/whats-behind-japan-sudden-thirst-for-more-spy-satellites/>. 286 Kallender-Umezu, Paul. “Japan Boosts Space Spend-ing In Support of Security Focus.” 2 Feb. 2015. Space-News 10 Dec. 2015 <http://spacenews.com/japan-boosts-space-spending-in-support-of-security-focus/>. 287 Rajagopalan, Rajeswari Pillai. “Op-ed | Japan’s Space Policy Shift Reflects New Asian Realities.” 23 Feb. 2015. SpaceNews 10 Dec. 2015 <http://spacenews.com/op-ed-japans-space-policy-shift-reflects-new-asian-realities/>. 288 The Space Report 2017. Colorado Springs: The Space Foundation, 2017: 16
increasing its cooperation with the U.S. on an equal basis, while also maintaining and strengthening its own industrial and science and technology sector.287
According to the Space Report 2016, Japan’s combined space budget was increased by 2.4% to ¥332.4 billion for the fiscal year 2016 (begin-ning on 1 April 2016 and ending 31 March 2017).288 The 2015 budget in the same fiscal period was ¥324.5 billion. The 2016 budget, en-compassing the space activity of 11 govern-ment ministries, saw a 1.7% funding decrease (i.e. ¥179.3 billion) for the Ministry of Educa-tion, Culture, Sports, Science and Technology (MEXT) which governs the Japan Aerospace Ex-ploration Agency (JAXA); meanwhile, Japan’s Ministry of Defence had a 15% increase in fund-ing (i.e. ¥34.2 billion), likely excluding Japan’s Ballistic Missile Defence budget as in the previ-ous year.289
In line with its enhanced cooperation with the U.S., Japan has agreed to extend its participa-tion in the International Space Station (ISS) through 2024. By December 2015, the Strate-gic Headquarters for Space Policy of the Cabi-net Office in Japan’s government officially ap-proved a plan to develop the HTV-X to follow on from JAXA’s next three HTV missions to the ISS, not including HTV-6. The HTV-7 will launch in February 2018, followed by HTV-8 in Febru-ary 2019 and then by HTV-9 in February 2020; the HTV-X will be launched in 2021.290 Japan spends about ¥40 billion on the ISS annually.291
6.9 China
China’s 13th Five Year Plan (2016-2020) was preliminarily approved by China’s Communist Party on 29 October 2015, while its details were finalised in early-2016.292 The 13th Five Year Plan has been formulated around five philo-sophical tenets, i.e. innovation, coordination, green growth, opening up; and inclusive devel-opment.293 Its major objectives for economic
289 Ibid. 290 Gebhardt, Chris. “Japan’s HTV-6 resupply vehicle ar-rives at the ISS.” 13 Dec. 2016. NASASpaceflight.com 19 Aug. 2017 <https://www.nasaspace-flight.com/2016/12/jaxa-iss-htv-6-resupply-launch-sta-tion/>. 291 Foust, Jeff. “Japan Seeks To Become Full Partner with U.S. in Space.” 11 Dec. 2015. SpaceNews 7 Jan. 2016 <http://spacenews.com/japan-seeks-to-become-full-part-ner-with-u-s-in-space/>. 292 Magnier, Mark. “China’s Communist Party Approves Five-Year Plan.” 29 Oct. 2015. The Wall Street Journal 1 Feb. 2016 <http://www.wsj.com/articles/chinas-communist-party-approves-five-year-plan-1446124597>. 293 “An Overview Of The 13th Five-Year Plan.” 7 Dec. 2016. NDRC People’s Republic of China 19 Aug. 2017 <http://en.ndrc.gov.cn/news-release/201612/t20161207_829923.html>.

ESPI Report 63 80 September 2017
and social development are as follows: 1) main-tain a medium-high rate of growth; 2) achieve significant results in innovation-driven develop-ment; 3) further coordinate development; 4) improve standards of living and quality of life; 5) improve the overall calibre of the population and the level of civility in society; 6) achieve an overall improvement in the quality of the envi-ronment and ecosystems; and 7) ensure all in-stitutions become more mature and better es-tablished.294
China’s Middle and Long Term Development Plan for State Civil Space Infrastructure (2015-2025) was released on 26 October 2015.295 Un-der this new roadmap, satellite remote sensing, communications, broadcasting, and navigation systems will be built up during the 13th Five Year Plan to establish the state civil space in-frastructure system. Using those systems, the 2015-2025 space development plan aims to produce comprehensive application demonstra-tions in 12 fields (including territory, mapping, energy, communications, and environmental protection) to provide core business with timely, accurate, and stable space information service. Additionally, the 2015-2025 plan stresses the importance of investment in its do-mestic industry, and calls for more investment of private capital.296 For instance, it foresees 100 launches of its Long March launcher family during the 2015-2025 period to meet domestic demand; it also aims to court commercial launch contracts by providing commercial launch services outside of its territory.297
6.10 India
In 2016, India’s parliament allocated 75.09 bil-lion rupees to the Indian Space Research Or-ganisation (ISRO) for the fiscal year 2016-2017, beginning on 1 April 2016. The budget was later revised to 80.45 billion rupees, an in-crease of 15.6% from the 69.6 billion rupees allocated in ISRO’s revised 2015-2016 budget. A total of 72.87 billion rupees of the revised 2016-2017 fiscal budget went toward ISRO’s Central Sector Schemes/Projects covering
Space Technology, Space Applications, Space Sciences, and ISRO’s INSAT constellation of communications and meteorological satellites. Space Technology accounted for 62.9% of that spending, while ISRO’s Space Applications ac-counted for 15.2%, and Space Sciences re-ceived just 1.8% of the allocation. Moreover, around 20.1% was allocated toward ISRO’s INSAT system.298
India’s satellite telecommunications market is known for its high barriers-to-entry for foreign satellite operators wishing to access its large DTH growth market for satellite-TV, -Broad-band and cellular backhaul. Non-Indian opera-tors (including SES, Eutelsat, Intelsat, Measat, AsiaSat, SingTel, ABS, and APT Satellite) are only permitted to have an operating licence if India’s own Insat telecommunications satel-lites, owned and operated by ISRO, do not have sufficient capacity to meet programmers’ de-mand. While the Insat system is normally una-ble to keep up with market demand, another hurdle for non-Indian operators is that rather than being allowed to deal with their customers directly, they must sell their own bandwidth to their competitor ISRO, which then resells it to broadcasters at prices set by ISRO. This is not the case for television broadcasters which seek operating licences using India’s own Insat sys-tem; moreover, they are given preferential treatment under Indian law.299
On 23 May 2016 the Telecom Regulatory Au-thority of India (TRAI) published a “pre-consul-tation paper” highlighting the savings that sat-ellite-television broadcasters could realise if they transmitted popular satellite television programmes using common transponder space shared by multiple DTH providers, rather than transmitting the same programmes individual on different satellites. TRAI went on to empha-size that sharing transponder capacity would help to cut the flow of revenue to non-Indian operators which provide most of the satellite capacity. Nevertheless, the proposal will likely be met with resistance from India’s domestic broadcasters and from DTH operators, as it threatens their business models which focus on differentiation.300
294 “The 13th Five-Year Plan for Economic and Social De-velopment of The People’s Republic of China (2016–2020).” 7 Dec. 2016. NDRC People’s Republic of China 19 Aug. 2017 <http://en.ndrc.gov.cn/news-release/201612/P020161207645765233498.pdf>. 295 Google Translated. “关于印发国家民用空间基础设施中长期发展规划(2015-2025年)的通知.” 26 Oct. 2015. Na-
tional Development and Reform Commission 2 Feb. 2016 <http://www.sdpc.gov.cn/zcfb/zcfbghwb/201510/t20151029_756376.html>. 296 “Middle and Long Term Development Plan for Civil Space Infrastructure Issued.” 13 Jan. 2016. LexisNexis 2 Feb. 2016 <https://hk.lexiscn.com/latest_message.php?ac-cess=show_detail&id=184408>.
297 De Selding, Peter B. “With Naga-L Rocket, China Would Turn Tables on U.S. Export Ban.” 15 Oct. 2015. SpaceNews 24 Dec. 2015 <http://spacenews.com/with-naga-l-rocket-china-would-turn-tables-on-u-s-export-ban/>. 298 Notes on Demands for Grants, 2017-2018. “Department of Space | No.91 | Department of Space.” 1 Feb. 2017. In-diabudget.nic.in 5 Aug. 2017 <http://indiab-udget.nic.in/ub2016-17/eb/sbe84.pdf>. 299 De Selding, Peter B. “Satellite operators give negative reviews of Indian regulator’s satellite-TV proposal.” 8 June 2016. SpaceNews 10 Nov. 2016 <http://space-news.com/satellite-operators-give-negative-reviews-of-in-dian-regulators-satellite-tv-proposal/>. 300 Ibid.

Space Policies, Issues and Trends in 2016–2017
ESPI Report 63 81 September 2017
List of Acronyms
Acronym Explanation
A
AAD Advanced Air Defence
ABS Asia Broadcast Satellite
AG Aktiengesellschaft
Airbus D&S Airbus Defence and Space
AIS Automatic Identification Satellites
APAC China and other Asia Pacific
ASAT Anti-Satellite
ASI Agenzia Spaziale Italiana (Italian Space Agency)
ASL Airbus Safran Launchers
ATV Automated Transfer Vehicle
AWE AWE Management Limited
B
BMD Ballistic Missile Defence
C
CASC China Aerospace Science and Technology Corporation
CAST China Aerospace Science and Technology Corp.
CDOP 3 Third Continuous Development and Operations Phase
CGWIC China Great Wall Industry Corporation
CHF Swiss franc
CLARREO Climate Absolute Radiance and Refractivity Observatory
CMA Governing Body of the Paris Agreement
CNES Centre National d’Études Spatiales (French Space Agency)
CONAE Argentinian Space Agency
COP Conference of the Parties
CRS Commercial Resupply Services
CSA Canadian Space Agency
D
DARS Digital Audio Radio Service
DBS Direct Broadcast Services
DLR Deutsches Zentrum für Luft- und Raumfahrt (German Aerospace Center)

ESPI Report 63 82 September 2017
Acronym Explanation
DoD Department of Defence
DRDO Defence Research and Development Organisation
DSCOVR Deep Space Climate ObserVatoRy
DTH Direct To Home
E
EBIT Earnings Before Interest and Taxes
EBITDA Earnings Before Interest, Taxes, Depreciation and Amortization
ECA Evolution Cryotechnique type A
EELV U.S. Evolved Expendable Launch Vehicle Program
EIB European Investment Bank
EIF European Investment Fund
ELV European Launch Vehicle
EM Exploration Mission
EON-MW Earth Observing Nanosatellite-Microwave
EPS-SG European Polar System Second Generation
ESA European Space Agency
ESA DG ESA Director General
EU European Union
EUMETSAT The European Organisation for the Exploitation of Meteorological Satellites
EUTELSAT European Telecommunications Satellite Organisation
F
FAA Federal Aviation Administration
FSS Fixed Satellite Services
FY Fiscal Year
G
GDP Gross Domestic Product
GEO Geostationary Earth Orbit
GmbH Gesellschaft mit beschränkter Haftung
GNI Gross National Income
GNSS Global Navigation Satellite Systems
GOES-R Geostationary Operational Environmental Satellite R
GPS Global Positioning System
GSA European GNSS Agency
GSLV Geosynchronous Satellite Launch Vehicle
GSSAP Geosynchronous Space Situational Awareness Program
GTO Geosynchronous Transfer Orbits

Space Policies, Issues and Trends in 2016–2017
ESPI Report 63 83 September 2017
Acronym Explanation
H
HTV H-2 Transfer Vehicle
I
ICS Information and Communication Systems
IGS International GNSS Service
ILS International Launch Services
IMF International Monetary Fund
IODC Indian Ocean Data Coverage
IPP International Partnership Programme
IRNSS India Regional Navigation Satellite System
ISC International Satellite Company Limited
ISED Innovation, Science and Economic Development
ISIS Islamic State
ISRO Indian Space Research Organization
ISS International Space Station
ITAR International Traffic in Arms Regulations
J
JAXA Japan Aerospace Exploration Agency
JPSS Joint Polar Satellite System
K
KARI Korea Aerospace Research Institute (Korean Space Agency)
L
LEO Low Earth Orbit
M
MDA MacDonald, Dettwiler and Associates Ltd.
Melco Mitsubishi Electric Co.
MEO Medium Earth Orbit
MERLIN Methane Remote Sensing LIDAR Mission
Metop Meteorological Operational Satellite
Metop-SG Metop Second Generation
MEXT Ministry of Education, Culture, Sports, Science and Technology
MFG Meteosat First Generation
MOD Ministry of National Defense
MOKV multi-object kill vehicle

ESPI Report 63 84 September 2017
Acronym Explanation
MoU Memorandum of Understanding
MSG Meteosat Second Generation
MSS Mobile Satellite Service
MTG Meteosat Third Generation
N
NASA National Aeronautics and Space Administration
NATO North Atlantic Treaty Organisation
NCSTE China’s National Centre for Science and Technology Evaluations
NDAA National Defense Authorization Act
NDCs Nationally Determined Contributions
NEC Nippon Electric Company
NEO Near-Earth Orbit
NGA National Geospatial-Intelligence Agency
NOAA National Oceanic and Atmospheric Administration
NRO National Reconnaissance Office
O
OCO Orbiting Carbon Observatory
OECD Organisation for Economic Co-operation and Development
OHB Orbitale Hochtechnologie Bremen
OPEC Organization of the Petroleum Exporting Countries
P
PACE Plankton, Aerosol, Cloud, ocean Ecosystem
PAD Prithvi Air Defense
PLA People’s Liberation Army
PND Portable Navigation Devices
PRS Public Regulated Service
PSLV Polar Satellite Launch Vehicle
Q
QZSS Quasi-Zenith Satellite System
R
RCM RADARSAT Constellation Mission
RKV Redesigned Kill Vehicle
Roscosmos Roscosmos State Corporation

Space Policies, Issues and Trends in 2016–2017
ESPI Report 63 85 September 2017
Acronym Explanation
S
SAF Satellite Application Facilities
SDGs Sustainable Development Goals
SES Société Européenne des Satellites
SIA Satellite Industry Association
SLS Space Launch System
SpaceX Space Exploration Technologies
SS/L Space Systems/Loral
SSO Sun-synchronous orbit
T
TDP Technology Demonstration Programme
TEU Treaty on European Union
THAAD Terminal High Altitude Area Defense system
TRAI Telecom Regulatory Authority of India
U
UAE United Arab Emirates
UAV Unmanned Aerial Vehicle
UK United Kingdom
ULA United Launch Alliance
UN United Nations
UNCTAD United Nations Conference on Trade and Development
UNFCCC United Nations Framework Convention on Climate Change
U.S. United States of America
U.S. MDA Missile Defense Agency
USAT Ultra Small Aperture Terminals
V
VAST Vietnamese Academy of Science and Technology
VKO Aerospace Defence Forces
VSAT Very Small Aperture Terminals
W
WGP World Gross Product

ESPI Report 63 86 September 2017
Acknowledgements
My gratitude goes to ESPI Director Jean-Jacques Tortora and to the ESPI staff for their
kind advice and support throughout the re-port’s production.
About the Author
Cenan Al-Ekabi works as a Research Fellow at the European Space Policy Institute (ESPI) in Vienna, Austria. He joined ESPI in 2011, after completing two advanced studies LL.M. de-grees in Air & Space Law and in European & International Business Law from Leiden Uni-versity in the Netherlands; and he recently participated in the ISU Space Studies Program in 2016. He is a specialist in current and his-torical evolutions in the civil, military, industry and commercial space domains, and has con-ducted macroeconomic and microeconomic
assessments for ESPI’s stakeholders in the Eu-ropean space sector. He is responsible for the management and production of ESPI’s Year-book on Space Policy book series and its Space Policies, Issues and Trends report series, in-cluding their related databases. His other pro-jects at ESPI have addressed the stakes for European commercial spacecraft industry competitiveness, challenges for Europe to maintain autonomous access to space, and measuring the future benefits of space explo-ration.

Mission Statement of ESPI The European Space Policy Institute (ESPI) provides decision-makers with an informed view on mid- to long-term issues relevant to Europe’s space activi-ties. In this context, ESPI acts as an independent platform for developing po-sitions and strategies.

www.espi .or .at