Soya Industries Limited
43
Soya Industries Limited
Transcript of Soya Industries Limited
Soya Industries Limited
Strictly Private and Confidential 2
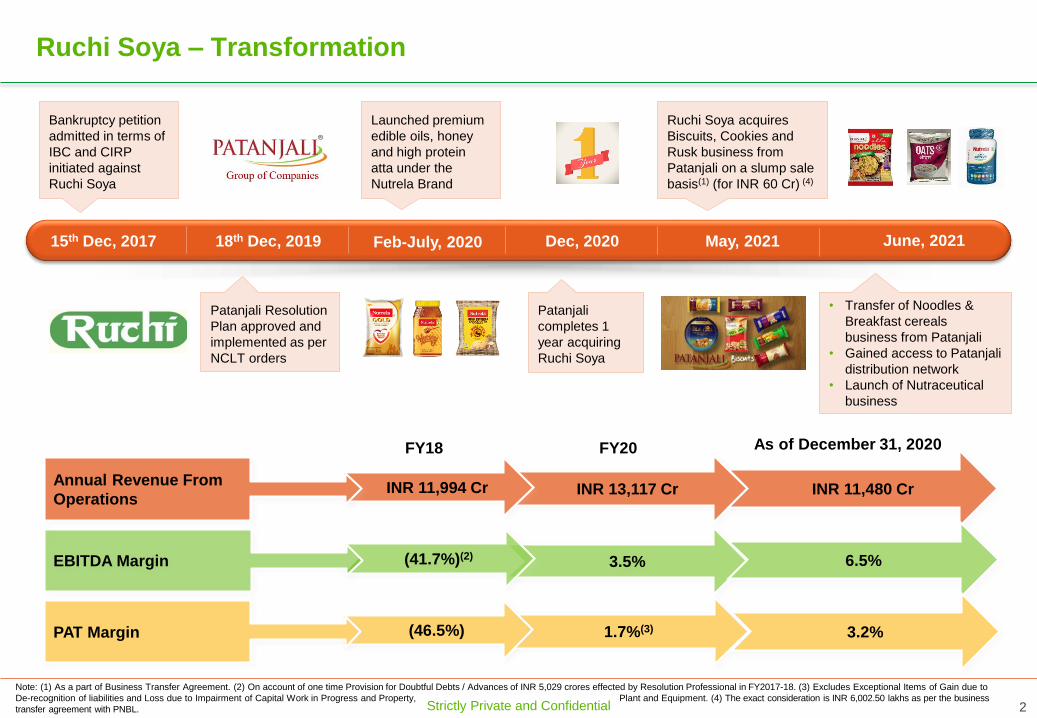
Ruchi Soya – Transformation
FY18 FY20
INR 13,117 CrINR 11,994 CrAnnual Revenue From
OperationsINR 11,480 Cr
3.5%(41.7%)(2)EBITDA Margin 6.5%
1.7%(3)(46.5%)PAT Margin 3.2%
As of December 31, 2020
15th Dec, 2017 18th Dec, 2019 Dec, 2020 May, 2021
Patanjali Resolution
Plan approved and
implemented as per
NCLT orders
Note: (1) As a part of Business Transfer Agreement. (2) On account of one time Provision for Doubtful Debts / Advances of INR 5,029 crores effected by Resolution Professional in FY2017-18. (3) Excludes Exceptional Items of Gain due to
De-recognition of liabilities and Loss due to Impairment of Capital Work in Progress and Property, Plant and Equipment. (4) The exact consideration is INR 6,002.50 lakhs as per the business
transfer agreement with PNBL.
Bankruptcy petition
admitted in terms of
IBC and CIRP
initiated against
Ruchi Soya
June, 2021
• Transfer of Noodles &
Breakfast cereals
business from Patanjali
• Gained access to Patanjali
distribution network
• Launch of Nutraceutical
business
Patanjali
completes 1
year acquiring
Ruchi Soya
Ruchi Soya acquires
Biscuits, Cookies and
Rusk business from
Patanjali on a slump sale
basis(1) (for INR 60 Cr) (4)
Launched premium
edible oils, honey
and high protein
atta under the
Nutrela Brand
Feb-July, 2020

Agenda
Introduction
Key Segment Summary
Key Strengths
Financial Performance
Strategy & Outlook
Appendix
Strictly Private and Confidential 4
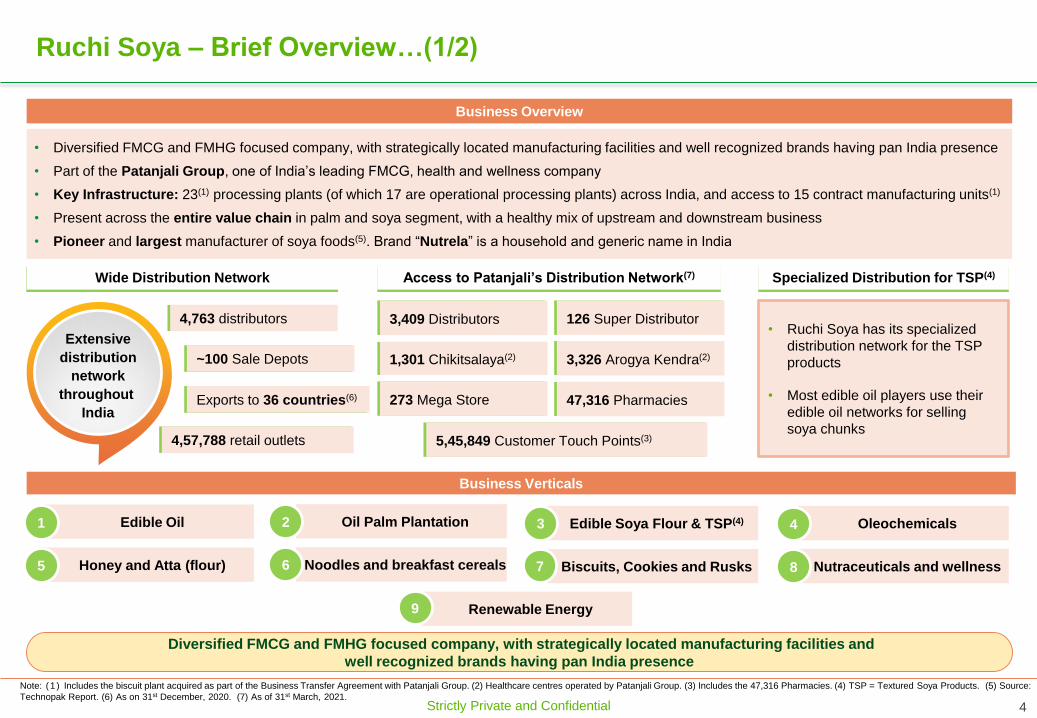
Ruchi Soya – Brief Overview…(1/2)
Diversified FMCG and FMHG focused company, with strategically located manufacturing facilities and
well recognized brands having pan India presence
• Diversified FMCG and FMHG focused company, with strategically located manufacturing facilities and well recognized brands having pan India presence
• Part of the Patanjali Group, one of India’s leading FMCG, health and wellness company
• Key Infrastructure: 23(1) processing plants (of which 17 are operational processing plants) across India, and access to 15 contract manufacturing units(1)
• Present across the entire value chain in palm and soya segment, with a healthy mix of upstream and downstream business
• Pioneer and largest manufacturer of soya foods(5). Brand “Nutrela” is a household and generic name in India
Note: (1 ) Includes the biscuit plant acquired as part of the Business Transfer Agreement with Patanjali Group. (2) Healthcare centres operated by Patanjali Group. (3) Includes the 47,316 Pharmacies. (4) TSP = Textured Soya Products. (5) Source:
Technopak Report. (6) As on 31st December, 2020. (7) As of 31st March, 2021.
Business Overview
Extensive
distribution
network
throughout
India
Access to Patanjali’s Distribution Network(7)
1,301 Chikitsalaya(2) 3,326 Arogya Kendra(2)
273 Mega Store
126 Super Distributor3,409 Distributors
47,316 Pharmacies
Wide Distribution Network
• Ruchi Soya has its specialized
distribution network for the TSP
products
• Most edible oil players use their
edible oil networks for selling
soya chunks
Specialized Distribution for TSP(4)
5,45,849 Customer Touch Points(3)
Business Verticals
Edible Oil
Honey and Atta (flour)
Oil Palm Plantation
Noodles and breakfast cereals
Edible Soya Flour & TSP(4)
Biscuits, Cookies and Rusks
Oleochemicals
Nutraceuticals and wellness
Renewable Energy
1 2 3 4
5 6 7 8
9
~100 Sale Depots
Exports to 36 countries(6)
4,763 distributors
4,57,788 retail outlets
Strictly Private and Confidential 5
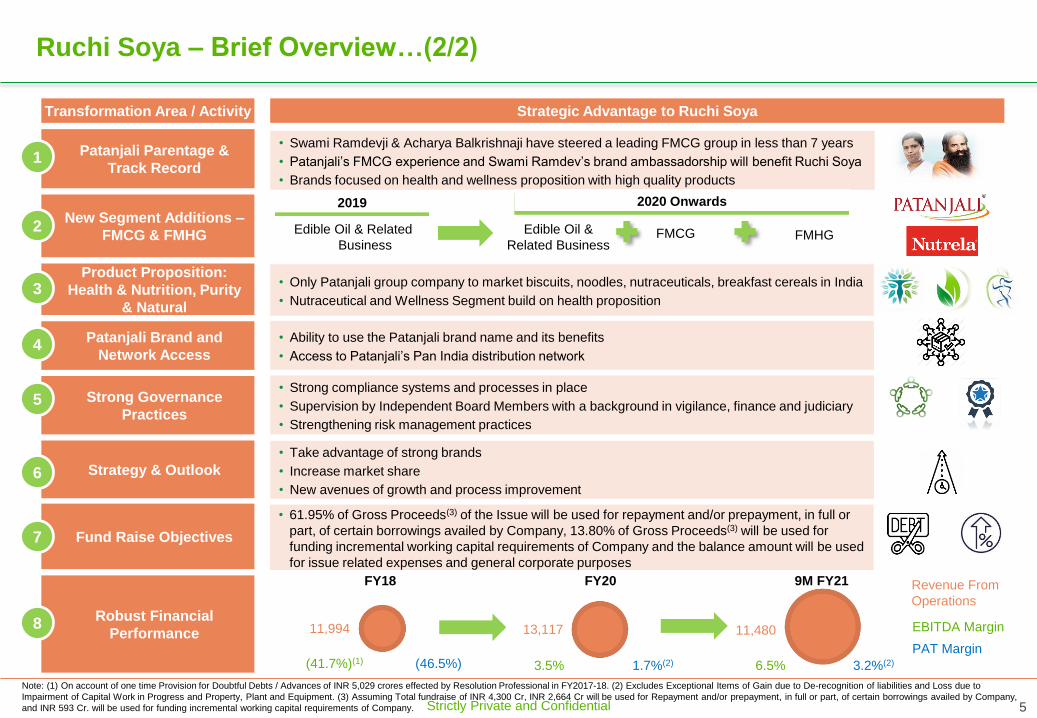
Patanjali Parentage &
Track Record
New Segment Additions –
FMCG & FMHG
Product Proposition:
Health & Nutrition, Purity
& Natural
Patanjali Brand and
Network Access
Strong Governance
Practices
Strategy & Outlook
Fund Raise Objectives
Robust Financial
Performance
Ruchi Soya – Brief Overview…(2/2)
Transformation Area / Activity Strategic Advantage to Ruchi Soya
8
1• Swami Ramdevji & Acharya Balkrishnaji have steered a leading FMCG group in less than 7 years
• Patanjali’s FMCG experience and Swami Ramdev’s brand ambassadorship will benefit Ruchi Soya
• Brands focused on health and wellness proposition with high quality products
2 Edible Oil & Related
Business
Edible Oil &
Related BusinessFMCG FMHG
2019 2020 Onwards
3• Only Patanjali group company to market biscuits, noodles, nutraceuticals, breakfast cereals in India
• Nutraceutical and Wellness Segment build on health proposition
4• Ability to use the Patanjali brand name and its benefits
• Access to Patanjali’s Pan India distribution network
5• Strong compliance systems and processes in place
• Supervision by Independent Board Members with a background in vigilance, finance and judiciary
• Strengthening risk management practices
6
• Take advantage of strong brands
• Increase market share
• New avenues of growth and process improvement
7
• 61.95% of Gross Proceeds(3) of the Issue will be used for repayment and/or prepayment, in full or
part, of certain borrowings availed by Company, 13.80% of Gross Proceeds(3) will be used for
funding incremental working capital requirements of Company and the balance amount will be used
for issue related expenses and general corporate purposes
FY18 FY20 9M FY21
11,994 13,117 11,480
(41.7%)(1) (46.5%) 3.5% 1.7%(2) 6.5% 3.2%(2)
Revenue From
Operations
EBITDA Margin
PAT Margin
Note: (1) On account of one time Provision for Doubtful Debts / Advances of INR 5,029 crores effected by Resolution Professional in FY2017-18. (2) Excludes Exceptional Items of Gain due to De-recognition of liabilities and Loss due to
Impairment of Capital Work in Progress and Property, Plant and Equipment. (3) Assuming Total fundraise of INR 4,300 Cr, INR 2,664 Cr will be used for Repayment and/or prepayment, in full or part, of certain borrowings availed by Company,
and INR 593 Cr. will be used for funding incremental working capital requirements of Company.

Strictly Private and Confidential 6
Consumer Facing Brands
Bakery Fat
Brands
Strictly Private and Confidential 7
Agenda
Introduction
Key Segment Summary
Key Strengths
Financial Performance
Strategy & Outlook
Appendix

Strictly Private and Confidential 8
17.0%
8.0%
6.0%4.0%3.0%
1.0%
60.0%
Adani Wilmar Ruchi Soya Emami Cargill Bunge Marico Others
FY2020: INR 179,500 crores(2)
1,12,000 1,56,000
2,14,000 22,500
23,500
24,000
1,34,500
1,79,500
2,38,000
FY 2015 FY 2020 FY 2025P
Branded Unbranded
Edible Oil, its By-products and Derivatives: Industry Highlights
Market Size Key Players
Value Segment & Key Brands
Leading suppliers of branded refined palm oil and one of the leading suppliers of branded refined soyabean oil in India
Premium
Popular
Adani
WilmarRuchi Soya
Emami
AgrotechCargill Marico Bunge Gemini
1
Data in INR crores
Note: (1) P = Projection. (2) Market Size includes consumption by industries, HoReCa segment and end consumer in branded form.
(1)
Source: Technopak Report.
FortuneHealthy
& TastyLeonardo, Gemini,
Nature FreshSaffola Freedom
Dalda,
Hudson

Strictly Private and Confidential 9
About the Business Operational & Financial Metrics
• One of the largest integrated oil seed solvent extraction and edible oil
refining company in India
• Nutrela brand umbrella used for premium edible oil products
• Key Brands: Ruchi Gold, Mahakosh, Sunrich, Ruchi Star, Nutrela
About the
Business
Key Products
& Brands
FY20
Revenue
9M FY21
Revenue
Vegetable Oil Fats
Refined Vegetable OilCrude Oil BakeryVanaspati
By-Products & Derivatives
RefiningCrushing
209 10,158 692 1,966(1)
Sold as Branded &
Unbranded cooking oils in
retail & bulk
Sold in retail to use
as economical
substitute of Ghee
Various types of fats,
margarine and cream
Oilseed meals and
others primarily used
for cattle feed
Sold to various
industries including
soaps, biodiesel etc.
Blended
Vegetable
Mustard
Cotton Seed
Rice Bran
Palm
Soyabean
Sunflower
Vanaspati
Bakery
Fat
Full Fat
Bakery
shortening
Cream
Margarine
Interesterifi
-ed Veg Fat
Soya Husk
Lecithin
Acid Oil
Fatty Acid
Oil Meals
De oiled cake
Spent Earth
Palm Fatty Acid
Palm Stearin
Gums
Acid Oil
Wax
Sun Fatty Acid
Crude Oil
10,368 9,437
692 597 1,966 1,299
FY20 9M FY21
By-Products & Derivatives
Vanaspati & Bakery Fats
Vegetable Oil
Ruchi Soya is also recognized amongst the largest branded oil packaged food company with a strong and robust portfolio of brands in
various types of cooking oils under categories such as soyabean, mustard, sunflower, palm, cottonseed and groundnut
1 Edible Oil, its By-products and Derivatives: Business Segment
13,02611,334
Data
in INR
crores
Note: (1) Includes revenue for Textured Soya Products.
10,368
127 9,311
9,437
597 1,299(1)
Data in INR crores
Source: Technopak Report.

Strictly Private and Confidential 10
1 Edible Oil, its By-products and Derivatives: Oil Seed Crush Business
About the Industry Key Players
11,000
8,800
4,500
500
Ruchi Soya Adani Wilmar Gujarat Ambuja Emami Agrotech
Crushing Capacity (As of FY20)
MT
per
day
10 8 6 1# of
crushing
plants
• Concentration of soyabean production is in the states of Madhya
Pradesh, Maharashtra, Rajasthan and Andhra Pradesh
• ~15,000 oilseed-crushing mills across India
• Top 2 players contribute ~17-18% of the total capacity of 40 Mn MT:
• Ruchi Soya with a crushing capacity of ~11,000 MT/day
• Adani Wilmar with a crushing capacity of ~8,800 MT/day
Growth Drivers
Strong export
demand of
soybean meal
Governments
focus to reduce
imports
Growth in
Domestic Feed
Industry
• Strong demand for non-GM soybean meal from
the international markets
• The exports have grown by 30% basis volume in
last 3 years
• Measures to increase the domestic production of
edible oil seeds with various initiatives:
Increasing area under cultivation
Improve production & productivity of crops
• The feed industry is growing at a CAGR of 8%
• Poultry, cattle and aqua feed sectors emerging as
major growth drivers
Key
Players
Large domestic
players
Ruchi Soya, Adani Wilmar, Sonic
Biochem, Sanwaria Agro, Gujarat
Ambuja Exports
Regional
Players
Small players with
niche products
Gokul Refoil, Kriti Nutrients, Sitashree
Products, Dewas Soya, Betul Oil
TradersInternational
commodity traders
Bunge, Cargill, Louis Dreyfeus
Mitsui, ADM
Small
Players(1)
Feed
Manufacturers
Suguna Hatcheries, Venkateshwara
Hatcheries, Godrej Agrovet, Srinivasa
Hatcheries
Type of Players in Oilseed Crushing
Source: Technopak Report.
Total Capacity CY19 (Volumes in Mn MT)
Oil Seed TypeTotal
Production
Total produce
crushed
Total capacity
available
Soybean 9.5 7.8 25
Mustard 6.8 5.9 15
(1) Feed manufacturers are small players in oilseed crushing industry.

Strictly Private and Confidential 11
Oil Palm Plantation
• In India, Crude oil is majorly imported, which presents a huge opportunity for
domestic players
• Public Private Partnership Business model, allows company to maintain an
asset-light business model
• Completely digitized procurement and payment process
• GEO tagging and other technological support
Products
Product ApplicationsExtracted
From Generation %
Crude Palm OilPersonal care, cosmetic,
& confectionary
FFBs(1) of
oil palm18%
Crude palm
kernel oil
Confectionary, personal
care & edible oil
Palm
kernel2%
Palm kernel
cakeAnimal Feed
Palm
kernel2.5%
By-Products: Shell
& Palm fibreBoiler FuelN.A.
Shell-4.5%
PF(2)-13%
Manufacturing Facilities
4 Palm oil mills in India
Ampapuram (Vijayawada)(3) Peddapuram (Kakinada)(3)
Plant Dec’20 Mar’20 Mar’19
Installed Capacity 9,00,000 9,00,000 9,00,000
Actual FFBs processed 3,45,437 4,04,035 4,09,628
Actual FFBs procured 3,48,014 4,05,909 4,12,946
(FFB quantity in MT)
Location Collection Centres Fertilizer Godowns
Peddapuram (AP) 57 17
Ampapuram (AP+TS) 35 2
Mysore(Karnataka) 88 3
Total 180 22
58.0%26.1%
4.1%
0.3% 11.5%Indonesia
Malaysia
Thailand
India
Others
CY2020: 75 million MT
Market Size
Mark
et
Bu
sin
ess S
eg
men
t
Backward integration strategy to create one of the largest palm oil plantation companies in India
Operational & Financial MetricsAbout the Business
2
Note: (1) FFB = Fresh Fruit Bunches. (2) PF = Palm Fibre. (3) palm oil mill plant and palm kernel plant.
Allocated Land (lakh ha)
Crushing Capacity (MT/day)
Business Integration
2.5
0.9
0.5
~0.5
3,000
N.A.
1,440
850
Integrated
Integrated
Integrated
Upstream
Key Players
Godrej Agrovet
3F Oil Palm
Navabharat Agro
Source: Technopak Report.
37,053 farmer beneficiaries across 9 states as on 31st December, 2020

Strictly Private and Confidential 12
530 1,000 1,900 650
1,000
1,522
1,180
2,000
3,422
FY 2015 FY 2020 FY 2025P
Branded Unbranded
Edible Soya Flour and Textured Soya Protein (“TSP”)
Key Products
• Pioneered soya chunks in 1980’s in India
• Launched soya chunks through brand ‘Nutrela’ 3 decades ago
• Soya flour and TSP is sold to retail consumers in India under the
Nutrela brand and exported under the Ruchi umbrella brand
• One of the highest exporters of value-added soya products and by-
products, to more than 36 countries in the world
41 46 40 23
38 39 4629
FY18 FY19 FY20 9MFY21
Total Sales - Edible Soya Flour
423 425 454 350
FY18 FY19 FY20 9MFY21
Total Sales - TSP
3.55% 3.36% 3.49% 3.09%
80 84 8752
SKU SizeNutrela
Chunks
Nutrela Mini
Chunks
Nutrela
Granules
Nutrela
TSP
50 gm
54 gm
80 gm
200 gm
220 gm
1 kg
1.12 kg
40.0%
18.0%5.0%
37.0%
Ruchi Soya Adani Wilmar Emami Others
FY2020: INR 1,000 crores(3)
Market Size Key Players
Ma
rke
t B
us
ine
ss
Se
gm
en
t
Pioneers of soya foods in India: household brand “Nutrela” which has a leading (40%) market share in India and exported to 36 countries(2)
Operational & Financial MetricsAbout the Business
0.67% 0.67% 0.67% 0.46%
3
Data in INR crores
Data in INR crores Data in INR crores
% of edible oil sales
Distribution – Nutrela
24%
24%20%
10%
22%
East North West South Others
March 31, 2021: 1,381
Customer Engagement
• Launched a health portal
www.nutrelahealth.com
• The portal provides access to nutritionists,
fitness experts, recipes, health news etc.
• Launched ‘The Soya Cook Book’, in July
2019, containing multiple recipes
Note: (1) P = Projection. (2) As of 31st December, 2020. (3) Market share of key branded players.
(1)
Domestic International
Source: Technopak Report.

Strictly Private and Confidential 13
Oleochemicals
Market Size
Operational & Financial Metrics
Total Sales Value (INR Cr)
Key Products
39 106 128
76
10225
34
24
FY18 FY19 FY20 9MFY21Domestic International
Manufacturing Facility
• Located in Gandhidham (Gujarat) with close proximity to the Kandla
and Mundra port
• Plant Capacity: 42,000 MT of soap noodles, 35,000 MT of split fatty
acids, 33,600 MT of toilet soap, 15,000 MT of castor derivatives
(including hydrogenation) and 9,000 MT of refined glycerine
• Facility Certifications: Kosher, Halal, ISO 9001:2015
1,265 1,600
2,131
FY 2015 FY 2020 FY 2025P
Key Players
~1,150 tonnes / day
~170 tonnes / day
~1,400 tonnes / day
~180 tonnes / day
~323 tonnes / day
~316 tonnes / dayMa
rke
t B
us
ine
ss
Se
gm
en
t
About the Business
• Downstream business utilizes the by-products produced primarily from
the edible oil refineries
Downstream business efficiently utilizing by-products produced primarily from Ruchi Soya’s edible oil refineries
4
Adani Wilmar
VVF
JOCIL
Godrej Industries
Fairchem
Tonnes per Annum
142 131162
100
Note: (1) P = Projection.
(1)
Derivatives Sales Usage
SoyaExport (to Europe and
Indonesia) and Domestic
Paint manufacturing, Used in food
industry as a replacement or a
flavouring agent
Palm Domestic
Detergent, Plastic materials, PVC
industry, Metallic soaps, Rubbers,
Dyes, Crayon, Candle making
Glycerine DomesticPharma, Specialty chemicals, Soap
industry
Castor
Export (Europe, Japan,
China, South East Asia,
Middle East) and Domestic
Lubricants and grease
manufacturing, Skin care waxes,
Underarm cream, Crayon
Source: Technopak Report.

Strictly Private and Confidential 14
890 1,350 2,200 910
1,100 1,300 1,800
2,450 3,500
FY 2015 FY 2020 FY 2025P
Branded Unbranded
Premium Honey & Premium High Protein Atta
• Launched Nutrela High Protein Chakki Atta and Nutrela Honey in Fiscal
2021 under the Nutrela Brand umbrella
• Nutrela Honey launched in the premium segment to take advantage of
the growing consumer need for natural immunity booster
• Growth opportunity for branded honey since its market share is expected
to increase from 55% to 65% in FY 2025
• Nutrela High Protein Chakki Atta, is a combination of wheat and soya
flour and contains 30% more protein than regular wheat flours
• The branded wheat flour industry has a 15% market share which is
expected to rise up to 23% in Fiscal 2025
About the Business Key Products
48.0%
31.0%
10.0%
2.0% 9.0%
Dabur Patanjali
Apis Zandu
Others
41.0%
44.0%
15.0%
Aashirvaad
Regional
Other Pan India
FY2020: INR 14,400 crores(2)
FY2020: INR 1,350 crores(2)
Market Size Key Players
Ma
rke
t B
us
ine
ss
Se
gm
en
t
Capitalizing on the success of Nutrela and Patanjali brands & its high brand recall with nutrition and good health,
expanded our FMCG product portfolio
Brief
Details,
Shelf
Life and
SKUs
• Nutrela Honey is 100%
pure and natural
• Shelf Life: 12 months
• SKUs: 250 gm, 500gm
and 1 kg pack
• Nutrela atta contains 30%
more protein than regular
wheat atta
• Fortified with iron, folic
acid, and vitamin B12
• Shelf Life: 3 months
• SKUs: 1 kg and 5 kg pack
5
Data in INR crores
Data in INR crores
Ho
ne
y
Att
a
Note: (1) P = Projection. (2) Market Share of Key Brands.
(1)
(1)
Source: Technopak Report.
7,400 14,400 29,210 66,600
81,600 97,790
FY 2015 FY 2020 FY 2025P
Branded Unbranded
74,00096,000
1,27,000

Strictly Private and Confidential 15
Noodles & Breakfast Cereals
• Acquired breakfast cereals and atta (wheat) noodles product category, in June 2021 from Patanjali Group
• Sale of Healthier version (whole wheat) noodles and breakfast cereals, under the “Patanjali” brand name
• Access to 4 contract manufacturing units at Rajasthan, Uttarakhand and Haryana under the “Patanjali Assignment Agreement”
• Contract manufacturing enables low capital expenditure
Product Portfolio – Noodles (13 SKU’s)
Chatpata Chatpata Cup Classic Desi Masala Yummy Masala Yummy Masala Cup
Product Portfolio – Breakfast Cereals (28 SKU’s)
4,850 7,800
12,500
FY 2015 FY 2020 FY 2025P
1,100 2,200
4,420
FY 2015 FY 2020 FY 2025P
Player Category
Patanjali • Flakes, Oats, Muesli, Dalia
Kellogg’s • Flakes, Oats, Muesli, Granola
Pepsi Co • Oats, Granola, Flakes
Bagrrys • Oats, Muesli, Cornflakes, & Brans
Marico • Oats
GSK • Oats, Biscuits
Nestle • Flakes, Granola
Mohan Meakin • Poha, Porridge, Oats, Flakes & Muesli
Market Size Key Players
Ma
rke
t B
us
ine
ss
Se
gm
en
t
Building upon Patanjali’s quality, product range and effective pricing to develop customer loyalty in key markets
6
About the Business
Bre
ak
fas
t C
ere
al
No
od
les
Data in INR crores
Data in INR crores
Key Products
RTE Hot Cereals
Note: (1) P = Projection.
(1)
(1)
Source: Technopak Report.
Strictly Private and Confidential 16
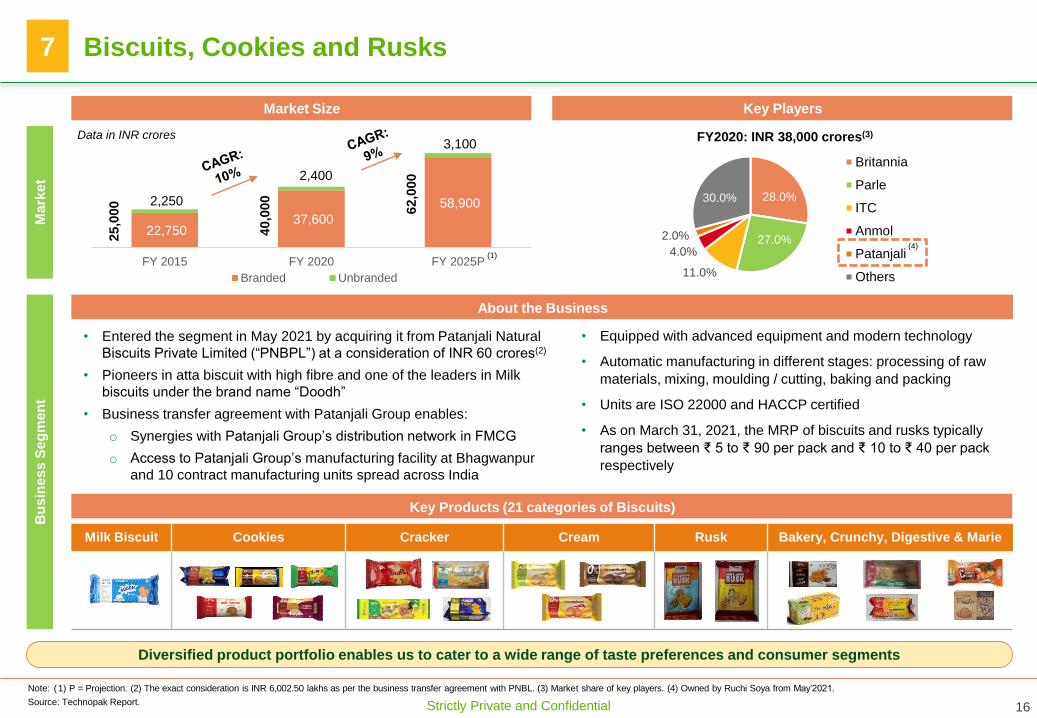
Milk Biscuit Cookies Cracker Cream Rusk Bakery, Crunchy, Digestive & Marie
22,750 37,600
58,900 2,250
2,400
3,100
FY 2015 FY 2020 FY 2025P
Branded Unbranded
Biscuits, Cookies and Rusks
• Entered the segment in May 2021 by acquiring it from Patanjali Natural
Biscuits Private Limited (“PNBPL”) at a consideration of INR 60 crores(2)
• Pioneers in atta biscuit with high fibre and one of the leaders in Milk
biscuits under the brand name “Doodh”
• Business transfer agreement with Patanjali Group enables:
o Synergies with Patanjali Group’s distribution network in FMCG
o Access to Patanjali Group’s manufacturing facility at Bhagwanpur
and 10 contract manufacturing units spread across India
About the Business
28.0%
27.0%
11.0%
4.0%
2.0%
30.0%
Britannia
Parle
ITC
Anmol
Patanjali
Others
FY2020: INR 38,000 crores(3)
Market Size Key Players
Ma
rke
t B
us
ine
ss
Se
gm
en
t
Diversified product portfolio enables us to cater to a wide range of taste preferences and consumer segments
• Equipped with advanced equipment and modern technology
• Automatic manufacturing in different stages: processing of raw
materials, mixing, moulding / cutting, baking and packing
• Units are ISO 22000 and HACCP certified
• As on March 31, 2021, the MRP of biscuits and rusks typically
ranges between ₹ 5 to ₹ 90 per pack and ₹ 10 to ₹ 40 per pack
respectively
7
Data in INR crores
Note: (1) P = Projection. (2) The exact consideration is INR 6,002.50 lakhs as per the business transfer agreement with PNBL. (3) Market share of key players. (4) Owned by Ruchi Soya from May’2021.
(1)
Key Products (21 categories of Biscuits)
Source: Technopak Report.
(4)
25,0
00
40,0
00
62,0
00

Strictly Private and Confidential 17
12,750 31,500
77,250
8,250
20,250
50,250
21,000
51,750
1,27,500
FY 2015 FY 2020 FY 2025P
Functional Food & Beverages Dietary Supplements Total
Nutraceuticals and Wellness Products
• Manufacturing at state of the art plant
located at Patanjali Food and Herbal
Park, Haridwar under contract
manufacturing agreement
• Explore both offline and online avenues of distribution to maximize reach
• Nutraceuticals will be marketed through various sales channels of RSIL and of PAL(2)
including Patanjali Order Me app
• 100% Vegetarian
• Advanced technologies
• Natural, Non-GMO Products(2)
• Confirms regulatory specifications
Market Size
Ma
rke
t B
us
ine
ss
Se
gm
en
t
Foray into the high margin FMHG segment to capitalize on the demand for nutraceutical and wellness products
About the Business
8
Data in INR crores
Note: (1) P = Projection. (2) To an extent possible.
(1)
Emerging Trends in Industry
Transparent
and Effective
Education for
consumers
Consistent
Product
Improvement
Opportunity for
new players
• The players are undertaking the task of educating
the consumers by sharing detailed information
about the products and the advantages and
functions
• Companies are working on number of factors like
enhanced quality levels of the product, improved
transparency, and aggressive pricing to widen the
consumption
• High cost and long-time frames of product
development are entry barriers for new players.
FSSAI have been working on regulations, which
will open avenues for new entrepreneurs
Product Features Manufacturing
Distribution
Source: Technopak Report.

Strictly Private and Confidential 18
100% Vegetarian, Natural & Non – GMO(1) Products
Launched Nutraceuticals across all three product categories
Joint branding under the “Patanjali” and “Nutrela” brand names
Product
Application
Formulations
Key Competition
& their brands
Medical Nutrition
Diabetic nutrition, dialysis nutrition,
bone health, anemics etc.
• Nutrela Bone Health Natural
• Nutrela Vit B12 Natural
• Nutrela Iron Complex
• Nutrela Vit D2 K Natural
• Nutrela Omega 3,6,7,9
• Tablets • Capsules • Powders
Ostocalcium Ensure Q-Dee
General Nutrition
• Nutrela Daily Energy
• Nutrela Active Daily
Overall health and general
wellness such as multi vitamins
and weight management
• Tablets • Capsules • Powders
Nutrilite Proteinex
Sports Nutrition
Energy supplements and mass /
muscle gainers
• Nutrela Weight Gain
• Nutrela Isopure Gold
• Nutrela 100% Whey Perform
• Liquids • Capsules • Protein
Powders
XS Whey Quista
Patanjali Nutrela
Products
Nutraceuticals and Wellness Products – Peer Comparison8
Source: Technopak Report.
Note: (1) To an extent possible.
Amway Danone Amway Himalaya HimalayaGSK Abbott

Strictly Private and Confidential 19
Agenda
Introduction
Key Segment Summary
Key Strengths
Financial Performance
Strategy & Outlook
Appendix

Strictly Private and Confidential 20
Key Strengths
Products with Strong brand recognition in the Indian market
Product Presence across mass, value and premium segments
Strong promoter pedigree of the Patanjali group
Experienced leadership and revamped management team of senior industry professionals
Effective strategy to procure key raw materials and a track record of managing volatility
Strong, established and extensive distribution network
Pioneer and market leader in branded Soya space
Foray into health and wellness space with launch of Nutraceuticals
Upstream and downstream integration and one of the key players in Oil Palm Plantation
Strictly Private and Confidential 21
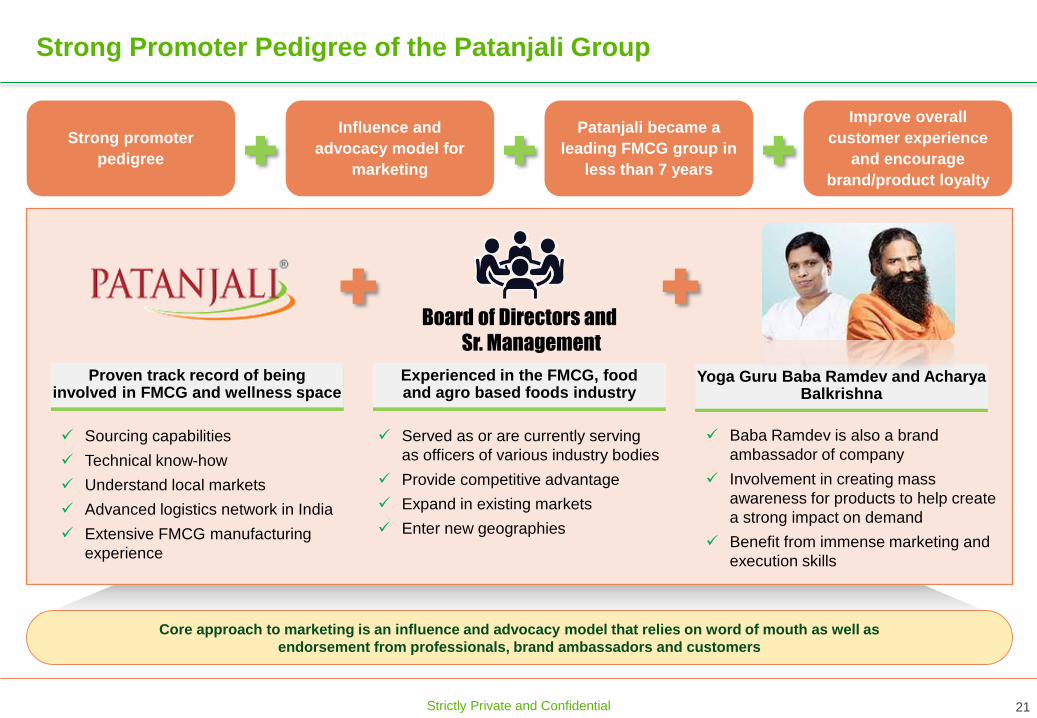
Strong Promoter Pedigree of the Patanjali Group
Board of Directors and
Sr. Management
Sourcing capabilities
Technical know-how
Understand local markets
Advanced logistics network in India
Extensive FMCG manufacturing
experience
Served as or are currently serving
as officers of various industry bodies
Provide competitive advantage
Expand in existing markets
Enter new geographies
Baba Ramdev is also a brand
ambassador of company
Involvement in creating mass
awareness for products to help create
a strong impact on demand
Benefit from immense marketing and
execution skills
Proven track record of beinginvolved in FMCG and wellness space
Experienced in the FMCG, foodand agro based foods industry
Yoga Guru Baba Ramdev and Acharya Balkrishna
Core approach to marketing is an influence and advocacy model that relies on word of mouth as well as
endorsement from professionals, brand ambassadors and customers
Strong promoter
pedigree
Influence and
advocacy model for
marketing
Patanjali became a
leading FMCG group in
less than 7 years
Improve overall
customer experience
and encourage
brand/product loyalty

Strictly Private and Confidential 22
Experienced Promoters, Distinguished Board and Management Team
Acharya Balkrishna Ji – Chairman & Non-
Executive DirectorSwami Ramdev Ji - Non-executive Director
Sh. Ram Bharat - Managing Director Dr. Girish Ahuja - Independent Director
Dr. Tejendra Mohan Bhasin - Independent DirectorJustice Gyan Sudha Misra (Retd.)-
Independent Director
• Received the “UNSDG 10 Most Influential People
in Healthcare”
• Managing Director of Patanjali Ayurved Limited
from Oct, 2007
• General secretary of Divya Yog Mandir Trust
• “Indian of the year business category -2017”
award by CNN-News 18 in 2017
• President of Divya Yog Mandir
• Doctor of Science (Honoris Causa) from Dr. D. Y.
Patil Vidyapeeth, Pune
• Doctor of Philosophy (Honoris Causa) from KIIT
University, Bhubaneshwar
• Doctor of Science (Honoris Causa) from Amity
University, Uttar Pradesh
• Doctor of Laws (Honoris Causa) from Berhampur
University
• Associated with the Patanjali Group for a decade
having joined on October 1, 2011
• Associated with our Company since
implementation of the Patanjali Resolution Plan
• Also serves as non-executive director and
director on boards of other Patanjali Group of
companies
• Director on the boards of Amber Enterprises India
Limited, Devyani Food Industries Limited, RJ Corp
Limited, Flair Publications Private Limited, Unitech
Limited, Sidwal Refrigeration Industries Private
Limited, Ever Electronics Private Limited
• Authored 22 books on the Indian taxation system
• Chartered Accountant and Doctorate in philosophy
from Delhi University
• Ex-vigilance commissioner of the Central Vigilance
Commission, appointed by the President of India
• Former Executive director on the board of United
Bank of India and the chairman and managing
director of Indian Bank
• Chairman of Advisory Board for Banking Frauds
constituted by the central vigilance commission, in
consultation with RBI
• She is a retired Judge of the Supreme Court of India
• Director on the boards of Indiabulls Real Estate
Limited, Indiabulls Housing Finance Limited, Yaarii
Digital Integrated Services Limited, Olectra
Greentech Limited and Indiabulls Life Insurance
Company Limited
Board of Directors
Strictly Private and Confidential 23
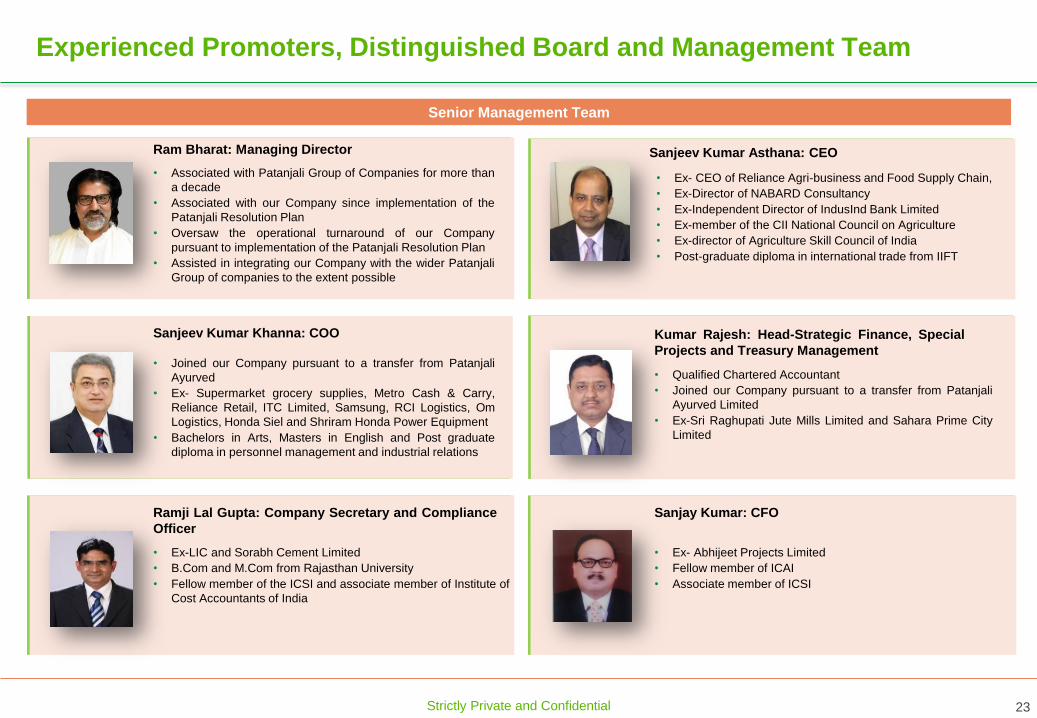
Experienced Promoters, Distinguished Board and Management Team
Ram Bharat: Managing Director Sanjeev Kumar Asthana: CEO
Kumar Rajesh: Head-Strategic Finance, Special
Projects and Treasury Management
Sanjeev Kumar Khanna: COO
• Associated with Patanjali Group of Companies for more than
a decade
• Associated with our Company since implementation of the
Patanjali Resolution Plan
• Oversaw the operational turnaround of our Company
pursuant to implementation of the Patanjali Resolution Plan
• Assisted in integrating our Company with the wider Patanjali
Group of companies to the extent possible
• Ex- CEO of Reliance Agri-business and Food Supply Chain,
• Ex-Director of NABARD Consultancy
• Ex-Independent Director of IndusInd Bank Limited
• Ex-member of the CII National Council on Agriculture
• Ex-director of Agriculture Skill Council of India
• Post-graduate diploma in international trade from IIFT
• Qualified Chartered Accountant
• Joined our Company pursuant to a transfer from Patanjali
Ayurved Limited
• Ex-Sri Raghupati Jute Mills Limited and Sahara Prime City
Limited
• Joined our Company pursuant to a transfer from Patanjali
Ayurved
• Ex- Supermarket grocery supplies, Metro Cash & Carry,
Reliance Retail, ITC Limited, Samsung, RCI Logistics, Om
Logistics, Honda Siel and Shriram Honda Power Equipment
• Bachelors in Arts, Masters in English and Post graduate
diploma in personnel management and industrial relations
Ramji Lal Gupta: Company Secretary and Compliance
Officer
• Ex-LIC and Sorabh Cement Limited
• B.Com and M.Com from Rajasthan University
• Fellow member of the ICSI and associate member of Institute of
Cost Accountants of India
Sanjay Kumar: CFO
• Ex- Abhijeet Projects Limited
• Fellow member of ICAI
• Associate member of ICSI
Senior Management Team
Strictly Private and Confidential 24
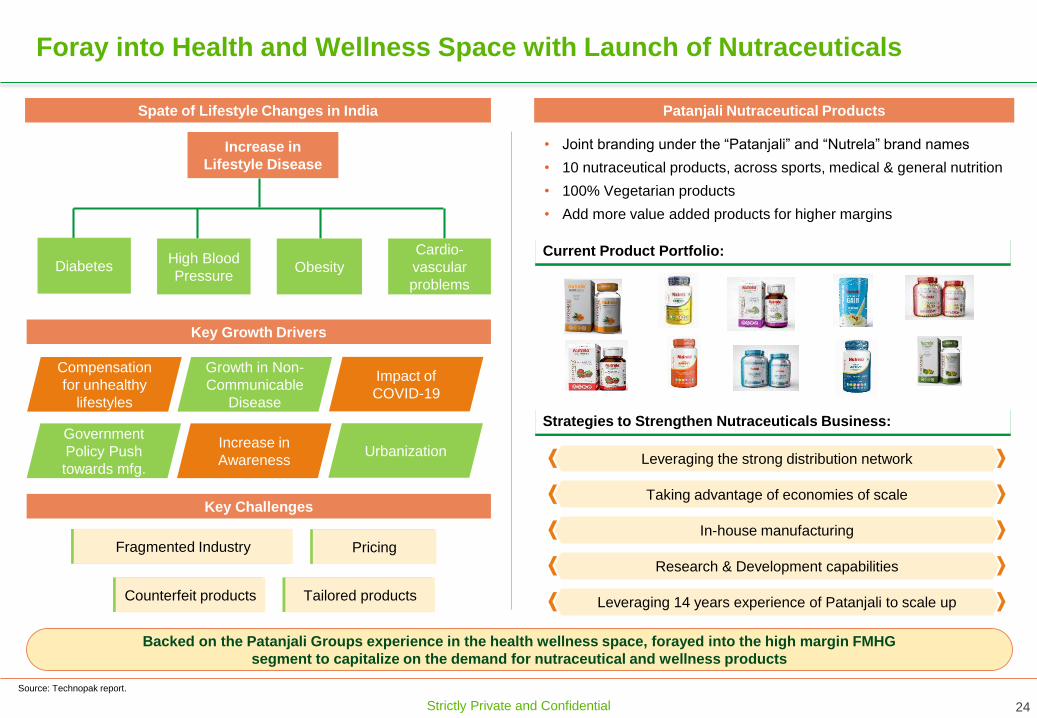
Foray into Health and Wellness Space with Launch of Nutraceuticals
• Joint branding under the “Patanjali” and “Nutrela” brand names
• 10 nutraceutical products, across sports, medical & general nutrition
• 100% Vegetarian products
• Add more value added products for higher margins
Current Product Portfolio:
Key Growth Drivers
Compensation
for unhealthy
lifestyles
Growth in Non-
Communicable
Disease
Impact of
COVID-19
Government
Policy Push
towards mfg.
Increase in
AwarenessUrbanization
Key Challenges
Fragmented Industry
Counterfeit products Tailored products
Pricing
Spate of Lifestyle Changes in India Patanjali Nutraceutical Products
Strategies to Strengthen Nutraceuticals Business:
Leveraging the strong distribution networkLeveraging the strong distribution network
Taking advantage of economies of scaleTaking advantage of economies of scale
In-house manufacturingIn-house manufacturing
Research & Development capabilitiesResearch & Development capabilities
Leveraging experience of Patanjali to scale upLeveraging 14 years experience of Patanjali to scale up
Backed on the Patanjali Groups experience in the health wellness space, forayed into the high margin FMHG
segment to capitalize on the demand for nutraceutical and wellness products
Source: Technopak report.
Increase in
Lifestyle Disease
DiabetesHigh Blood
PressureObesity
Cardio-
vascular
problems

Strictly Private and Confidential 25
Products with Strong Brand Recognition in the Indian Market
Increase in
awareness of health
and hygiene
Growth of the
organized retail
distribution network
Rise in purchasing
power among consumers,
including in rural areas
Increased preference
for branded food products
on account of
• Focused on middle
income segment with
multiple oil varieties
• Market leadership position
• India’s highest selling palm
oil brand
• Mid market sunflower oil
brand
• Extremely strong equity
and recall in various parts
of North, East, Central
and West India
• Contains vitamin E,
which is known to boost
immunity
• Launched Nutraceuticals
under Patanjali and
Nutrela brands
Brands are well positioned across India and are exported to 36 countries across the world(2)
Source: Technopak report. Note: (1) TSP = Textured Soya Products. (2) As on 31st December, 2020.
• Synonymous with TSP(1), household name
• Positioned as a premium brand
• Products: Premium & Blended Oils, Soya
Chunks, Honey and Atta
• Products: Biscuits, Digestive Cookies,
Paushtic Marie, Crackers, Whole Wheat
Rusk, Noodles, Breakfast & Cereals

Strictly Private and Confidential 26
Upstream and Downstream Integration and One of the Key Players in Oil
Palm Plantation
Supply ChainSourcing
En
su
re r
eg
ula
r su
pp
lyP
AN
In
dia
Netw
ork
Strong relationship with large oil suppliers in the world
Palm plantation business: Total aggregate area
of 2,55,207 hectares across 9 States
Imports oil palm in India
• 23 processing plants (of which 17
are operational processing
plants)(1)
• One of the largest refining
capabilities (of 11000 TPD)
• FSSAI, FSSC 22000, ISO
22000:2018, ISO 14001:2015, ISO
45001:2018, HACCP, Non-GMO(2),
Halal and Kosher certifications
• Strategically located oilseed crushing
and oil refining plants
• Inland oilseed crushing plants are
located in key soyabean & mustard seed
producing states
• Refining plants use imported crude
edible oil and hence are located at or
near ports
• At 2 port-based refining plants, direct
pipelines connect port & plant for faster
transportationDev
elo
ped
Eff
icie
nt
Ch
ain
Sta
te-o
f-th
e a
rt M
an
ufa
ctu
rin
g
4,773 Distributors
102 Sale Depots
4.5 Lac+ Retail Outlets
Branding & Distribution Manufacturing
Integrated operations to manage costs effectively, flexibility to alter mix of products and easy scalability leading to competitive advantage
Note: (1) As on March 31, 2021. Pursuant to the biscuits business transfer agreement (2) To an extent possible.
Strictly Private and Confidential 27
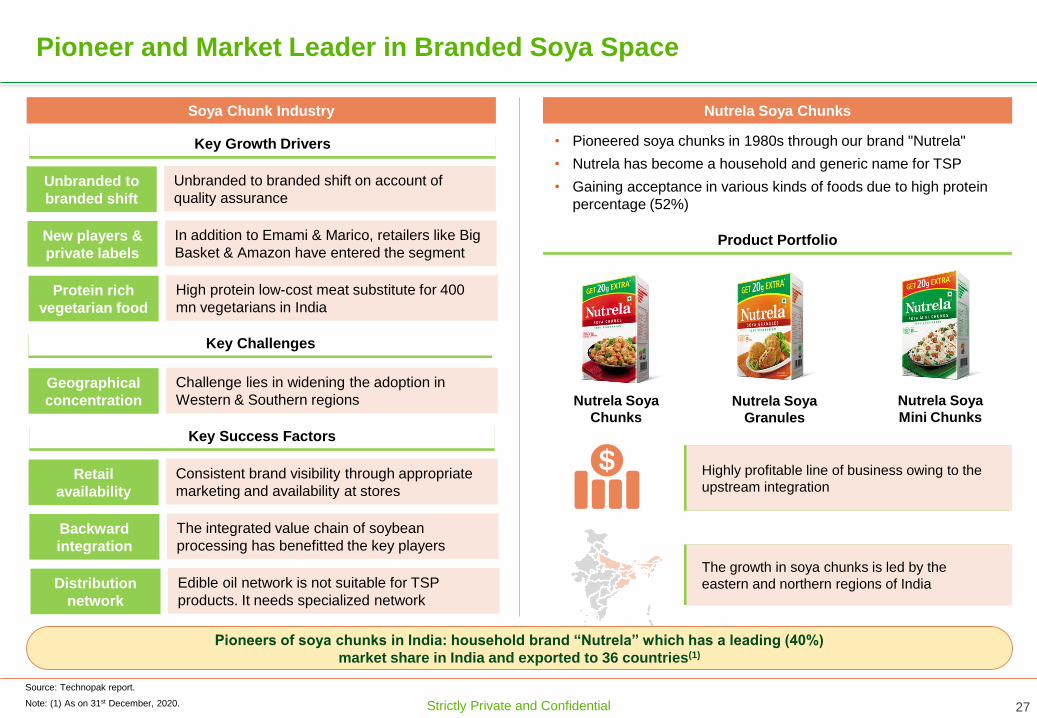
Pioneer and Market Leader in Branded Soya Space
• Pioneered soya chunks in 1980s through our brand "Nutrela"
• Nutrela has become a household and generic name for TSP
• Gaining acceptance in various kinds of foods due to high protein
percentage (52%)
Highly profitable line of business owing to the
upstream integration
The growth in soya chunks is led by the
eastern and northern regions of India
Soya Chunk Industry Nutrela Soya Chunks
Key Growth Drivers
Source: Technopak report.
Key Success Factors
Product Portfolio
Nutrela Soya
Chunks
Nutrela Soya
Granules
Nutrela Soya
Mini Chunks
Pioneers of soya chunks in India: household brand “Nutrela” which has a leading (40%)
market share in India and exported to 36 countries(1)
Key Challenges
Unbranded to
branded shift
New players &
private labels
Protein rich
vegetarian food
Unbranded to branded shift on account of
quality assurance
In addition to Emami & Marico, retailers like Big
Basket & Amazon have entered the segment
High protein low-cost meat substitute for 400
mn vegetarians in India
Retail
availability
Backward
integration
Distribution
network
Consistent brand visibility through appropriate
marketing and availability at stores
The integrated value chain of soybean
processing has benefitted the key players
Edible oil network is not suitable for TSP
products. It needs specialized network
Geographical
concentration
Challenge lies in widening the adoption in
Western & Southern regions
Note: (1) As on 31st December, 2020.

Strictly Private and Confidential 28
Product Presence Across Mass, Value and Premium Segment
• Diversified edible
oil product
portfolio consists
of 233 SKUs
• Continue to expand product portfolio within the existing
product segments
• Strengthen industry position by developing new
products to capitalise on emerging trends
• Focus on increasing sales realization and volumes
• Strive to provide differentiated offerings to consumers
Premium
Mid Market
Mass Appeal India’s highest selling
palm oil brand
Focused on health
and wellness,
targeted at higher
income group
Company will sell
Nutraceuticals under
Patanjali and Nutrela
brands
Products across categories, makes them less susceptible to shifts in consumer preferences,
market trends and risks of operating in a particular category
Source: Technopak report.

Strictly Private and Confidential 29
Effective Strategy to Procure Key Raw Materials and a Track Record Of
Managing Volatility
Company adapts active
hedging strategy to
maintain stable margins
Business
Scenario
Risks Involved
for Operational
Efficiency &
Margin Stability
Risk
Management
Mechanism
Methods &
Systems in
place for Risk
Mitigation
Ruchi Soya is
FMCG company
involved in
commodity
Depend upon sourcing
raw materials from
commodity markets in
India & globally
Exposes company
to various risks
Ability to source raw
material at timely and
cost- effective manner
determines profitability
Domestic
price
volatility
International
price
volatility
Exchange rate
volatility
• Company understands its ability to identify and address the risks is
central to achieving its corporate objectives
• Adapted Central Risk Management Policy
• Risk Management Committee is responsible for setting in place
transaction and risk management policies
• E-procurement through tendering process
Adoption of active
and effective
hedging strategies
Gradually increase
access to FFBs(1) directly
from oil palm plantations
& reduce dependence on
suppliers
Build strong
relationships with
suppliers, farmers
and agents for
regular supply
With years of experience and stringent policies, company has developed the capacity to effectively mange several of risks
Note: (1) FFB = Fresh Fruit Bunches.
With years of experience and stringent policies, company has developed the capacity to effectively manage several of risks
Strictly Private and Confidential 30
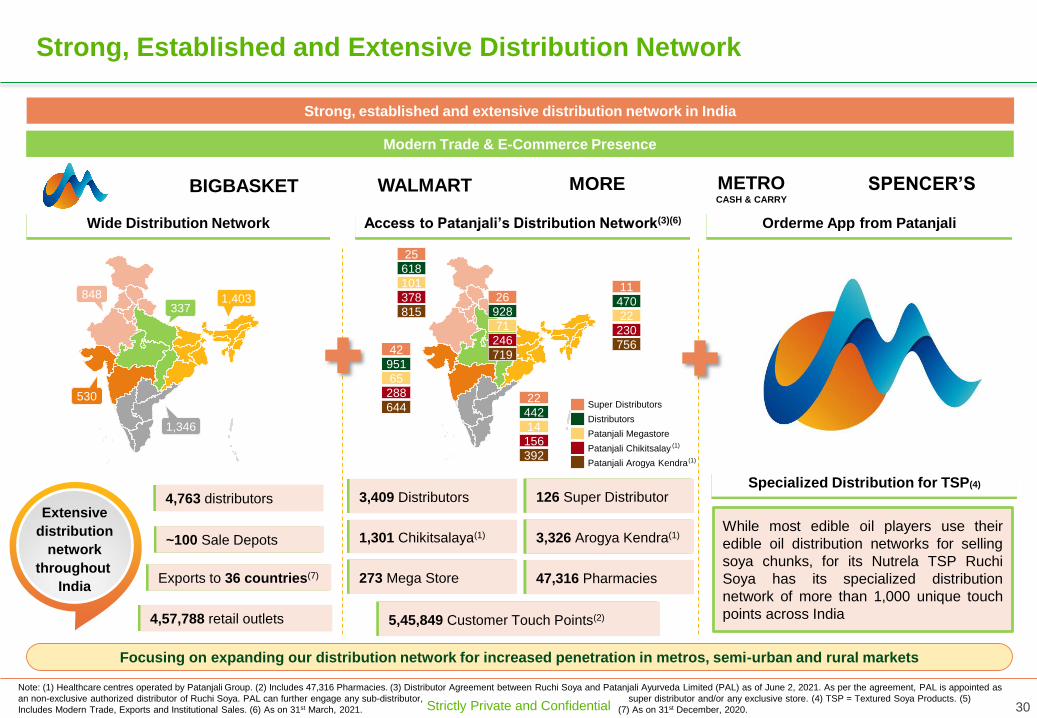
Strong, Established and Extensive Distribution Network
Strong, established and extensive distribution network in India
Access to Patanjali’s Distribution Network(3)(6)Wide Distribution Network
While most edible oil players use their
edible oil distribution networks for selling
soya chunks, for its Nutrela TSP Ruchi
Soya has its specialized distribution
network of more than 1,000 unique touch
points across India
Focusing on expanding our distribution network for increased penetration in metros, semi-urban and rural markets
Orderme App from Patanjali
Note: (1) Healthcare centres operated by Patanjali Group. (2) Includes 47,316 Pharmacies. (3) Distributor Agreement between Ruchi Soya and Patanjali Ayurveda Limited (PAL) as of June 2, 2021. As per the agreement, PAL is appointed as
an non-exclusive authorized distributor of Ruchi Soya. PAL can further engage any sub-distributor, super distributor and/or any exclusive store. (4) TSP = Textured Soya Products. (5)
Includes Modern Trade, Exports and Institutional Sales. (6) As on 31st March, 2021. (7) As on 31st December, 2020.
1
,
4
0
848337
1,403
1,346
530
1
,
4
0
25
618
101
378
815
26
928
71
246
71942
951
65
288
64422
442
14
156
392
Super Distributors
Distributors
Patanjali Megastore
Patanjali Chikitsalay
Patanjali Arogya Kendra
11
470
22
230
756
(1)
Modern Trade & E-Commerce Presence
(1)
WALMART METROCASH & CARRY
Extensive
distribution
network
throughout
India
1,301 Chikitsalaya(1) 3,326 Arogya Kendra(1)
273 Mega Store
126 Super Distributor3,409 Distributors
47,316 Pharmacies
5,45,849 Customer Touch Points(2)
~100 Sale Depots
Exports to 36 countries(7)
4,763 distributors
4,57,788 retail outlets
Specialized Distribution for TSP(4)
BIGBASKET MORE SPENCER’S

Strictly Private and Confidential 31
Agenda
Introduction
Key Segment Summary
Key Strengths
Financial Performance
Strategy & Outlook
Appendix

Strictly Private and Confidential 32
Financial Transformation of Business
Key Financials
Key Metrics (INR Cr) FY18A FY19A FY20A 9MFY21A
Revenue from operations (net) 11,994 12,729 13,117 11,480
Revenue growth (y-o-y) 6.1% 3.1% NA
Gross profit 1,354 1,327 1,545 1,552
Gross margin 11.3% 10.4% 11.8% 13.5%
EBITDA(1) (5,014)(2) 222 458 748
EBITDA margin(1) (41.7%) 1.7% 3.5% 6.5%
PAT excluding exceptional items (5,573) 77 225 366
PAT margin (46.5%) 0.6% 1.7% 3.2%
Reported PAT (5,573) 34 7,715 366
PAT margin (46.5%) 0.3% 58.8% 3.2%
Consistently Improving Margins
Note: (1) EBITDA computation includes Other Income. (2) On account of one time Provision for Doubtful Debts / Advances of INR 5,029 crores effected by Resolution Professional in FY2017-18. (3) Exact point not shown on graph as it is an
outlier. (4) GP = Gross Profit.
(4)
11.3% 10.4%11.8%
13.5%
1.7%3.5%
6.5%
FY18 FY19 FY20 9MFY21
GP Margin EBITDA Margin
(41.7%)(3)

Strictly Private and Confidential 33
Agenda
Introduction
Key Segment Summary
Key Strengths
Financial Performance
Strategy & Outlook
Appendix

Strictly Private and Confidential 34
Strategy & Outlook
Global investment banking
partnership
Dedicated Restructuring
Advisory
Strong Sector CoverageIn-house experienced Tax
Advisory
Enhance the high margin
premium food portfolio
through the Nutrela brand and
increase brand awareness
Expansion of our distribution
network through
diversification and supply
chain optimization
Continue Leverage Patanjali
Brand and enhance synergies
Continue to improve
operational efficiency through
enhanced usage of various
softwares and technology
Strong Sector CoverageIn-house experienced Tax
Advisory
Increase market share by
deeper penetration and
expanding footprint in newer
markets for nutraceuticals &
other products
Focus on “Backward
Integration” by increasing
overall palm plantation area
Strictly Private and Confidential 35
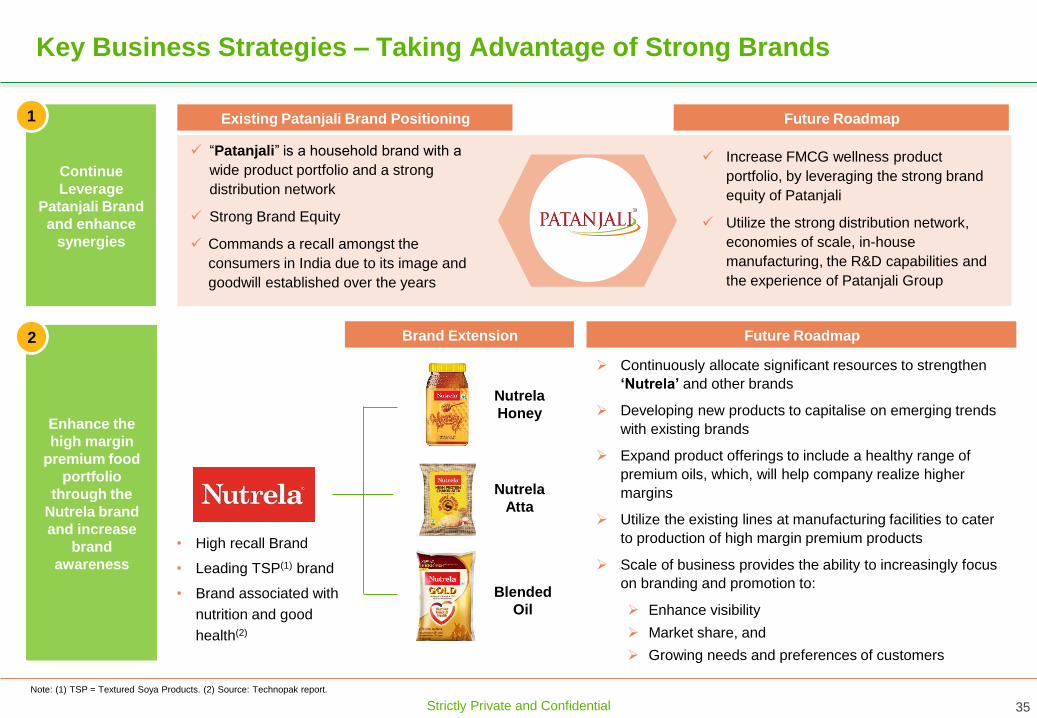
Key Business Strategies – Taking Advantage of Strong Brands
Continue
Leverage
Patanjali Brand
and enhance
synergies
Enhance the
high margin
premium food
portfolio
through the
Nutrela brand
and increase
brand
awareness
Existing Patanjali Brand Positioning Future Roadmap
“Patanjali” is a household brand with a
wide product portfolio and a strong
distribution network
Strong Brand Equity
Commands a recall amongst the
consumers in India due to its image and
goodwill established over the years
Increase FMCG wellness product
portfolio, by leveraging the strong brand
equity of Patanjali
Utilize the strong distribution network,
economies of scale, in-house
manufacturing, the R&D capabilities and
the experience of Patanjali Group
• High recall Brand
• Leading TSP(1) brand
• Brand associated with
nutrition and good
health(2)
Brand Extension
Nutrela
Honey
Nutrela
Atta
Blended
Oil
Future Roadmap
Continuously allocate significant resources to strengthen
‘Nutrela’ and other brands
Developing new products to capitalise on emerging trends
with existing brands
Expand product offerings to include a healthy range of
premium oils, which, will help company realize higher
margins
Utilize the existing lines at manufacturing facilities to cater
to production of high margin premium products
Scale of business provides the ability to increasingly focus
on branding and promotion to:
Enhance visibility
Market share, and
Growing needs and preferences of customers
1
2
Note: (1) TSP = Textured Soya Products. (2) Source: Technopak report.

Strictly Private and Confidential 36
Key Business Strategies – Expansion Strategy
Increase
market share
by deeper
penetration
and
expanding
footprint in
newer
markets for
nutraceuticals
& other
products
R&D activities to
expand product
range in health &
wellness segment
Target marketing
by dividing sales
efforts into
different
segments
Intend to expand
sales and
marketing efforts
into rural markets
Focus on
“Backward
Integration”
by increasing
overall palm
plantation
area
Aim to increase the overall area under palm plantation and
increase the number of nurseries
Aim to increase crushing capacity to benefit from the
increase in availability of FFB(2)
Monitor opportunities to secure access to raw materials
including by way of selective acquisitions and strategic
alliances
Future RoadmapImproving sourcing Ability
Continuous focus on improving sourcing
raw materials from multiple sources in a
timely and cost-effective manner
Secured potential procurement rights for
FFBs(2) that may be cultivated by farmers
in potential areas
Digitised the procurement process
Note: (1) Technopak report (FY20). (2) FFB = Fresh Fruit Bunch.
Nutraceuticals Edible Oil
Market Size
INR 51,750 Cr.(1)
Market Size
INR 1,79,500 Cr. (1)
Ruchi Soya
New Entrant in
the market
Ruchi Soya
Market Share
8%
Diversify product
base, by
launching 25+
new products
Launching
blended oil
variants, expand
into Mustard oil
• Capture
sizeable share
in fast growing
breakfast
cereals and
Noodles market
by leveraging
Patanjali’s
network and
brand presence
• Grow biscuit
business
across
categories
3
4
Textured Soya
Products (TSP)
Premium Honey &
Premium High
Protein Atta
Biscuits, Noodles
and Breakfast
Cereals
Market Size
INR 2,000 Cr. (1)
Ruchi Soya
Market Share
40%
Ruchi Soya
New Entrant in
the market
Expand TSP
market in Western
& Southern
regions
Target premium
segment in honey
and atta market
Market SizeHoney: INR 2,450 Cr. (1)
Atta: INR 96,000 Cr. (1)

Strictly Private and Confidential 37
Key Business Strategies – New Avenues And Improvement
Expansion of
our distribution
network
through
diversification
and supply
chain
optimization
Expand distribution network
Focus is to further strengthen pan India
presence by diversifying distribution
network
Utilize Patanjali’s wide distribution
network
Increase penetration in metros, semi-
urban and rural markets
Increase focus on modern trade and e-
commerce platforms through premium
product
Collaborate with certain regional players
to strengthen the regional presence
Invest in adequate infrastructure to
increase exports
Introduce offers, increase product
visibility, different pack sizes based on
buying patterns and preferences
Continue to
improve
operational
efficiency
through
enhanced
usage of
various
softwares and
technology
Effective and efficient operational
techniques:
o Adoption of best practices in line with
industry standards across production
facilities
o Leverage technological and R&D
capabilities
o Maintain strict operational controls
o Enhance customer service levels
o Continuous process improvement and
consistent quality improvement
Cost efficiency through:
o Backward integration of costs
o Improved product packaging
o Internal sales team
o Inventory management for wastage
reduction
5 6Improve Efficiency

Strictly Private and Confidential
Thank You

Strictly Private and Confidential 39
Agenda
Introduction
Key Segment Summary
Key Strengths
Strategy & Outlook
Financial Performance
Appendix
Strictly Private and Confidential 40
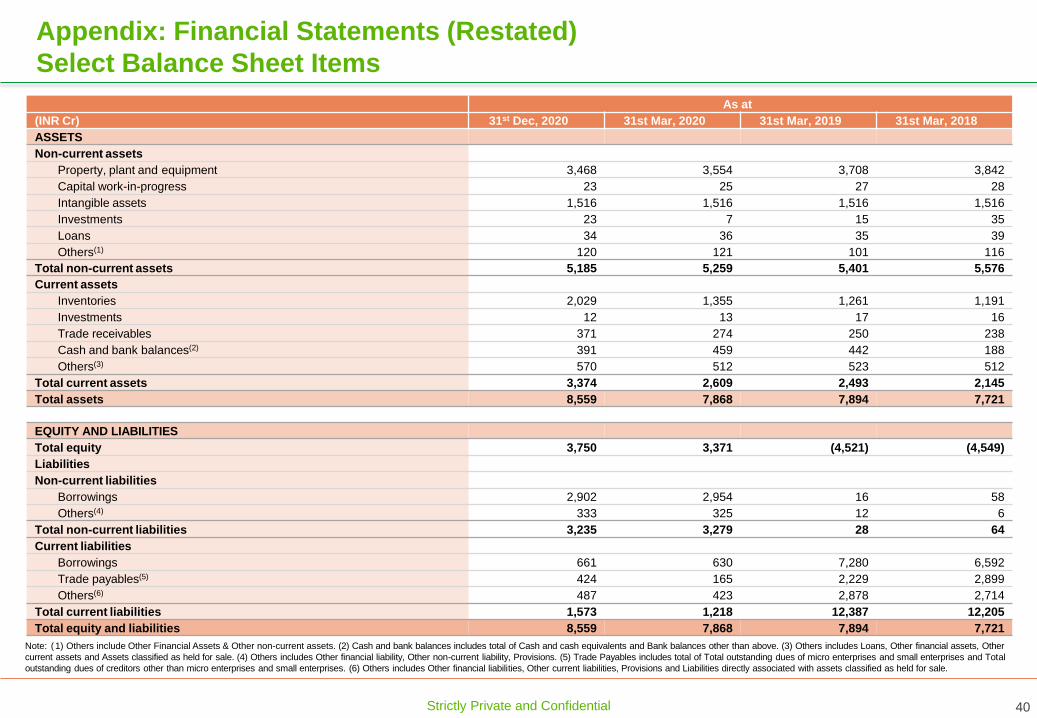
Appendix: Financial Statements (Restated)
Select Balance Sheet Items
As at
(INR Cr) 31st Dec, 2020 31st Mar, 2020 31st Mar, 2019 31st Mar, 2018
ASSETS
Non-current assets
Property, plant and equipment 3,468 3,554 3,708 3,842
Capital work-in-progress 23 25 27 28
Intangible assets 1,516 1,516 1,516 1,516
Investments 23 7 15 35
Loans 34 36 35 39
Others(1) 120 121 101 116
Total non-current assets 5,185 5,259 5,401 5,576
Current assets
Inventories 2,029 1,355 1,261 1,191
Investments 12 13 17 16
Trade receivables 371 274 250 238
Cash and bank balances(2) 391 459 442 188
Others(3) 570 512 523 512
Total current assets 3,374 2,609 2,493 2,145
Total assets 8,559 7,868 7,894 7,721
EQUITY AND LIABILITIES
Total equity 3,750 3,371 (4,521) (4,549)
Liabilities
Non-current liabilities
Borrowings 2,902 2,954 16 58
Others(4) 333 325 12 6
Total non-current liabilities 3,235 3,279 28 64
Current liabilities
Borrowings 661 630 7,280 6,592
Trade payables(5) 424 165 2,229 2,899
Others(6) 487 423 2,878 2,714
Total current liabilities 1,573 1,218 12,387 12,205
Total equity and liabilities 8,559 7,868 7,894 7,721
Note: (1) Others include Other Financial Assets & Other non-current assets. (2) Cash and bank balances includes total of Cash and cash equivalents and Bank balances other than above. (3) Others includes Loans, Other financial assets, Other
current assets and Assets classified as held for sale. (4) Others includes Other financial liability, Other non-current liability, Provisions. (5) Trade Payables includes total of Total outstanding dues of micro enterprises and small enterprises and Total
outstanding dues of creditors other than micro enterprises and small enterprises. (6) Others includes Other financial liabilities, Other current liabilities, Provisions and Liabilities directly associated with assets classified as held for sale.
Strictly Private and Confidential 41
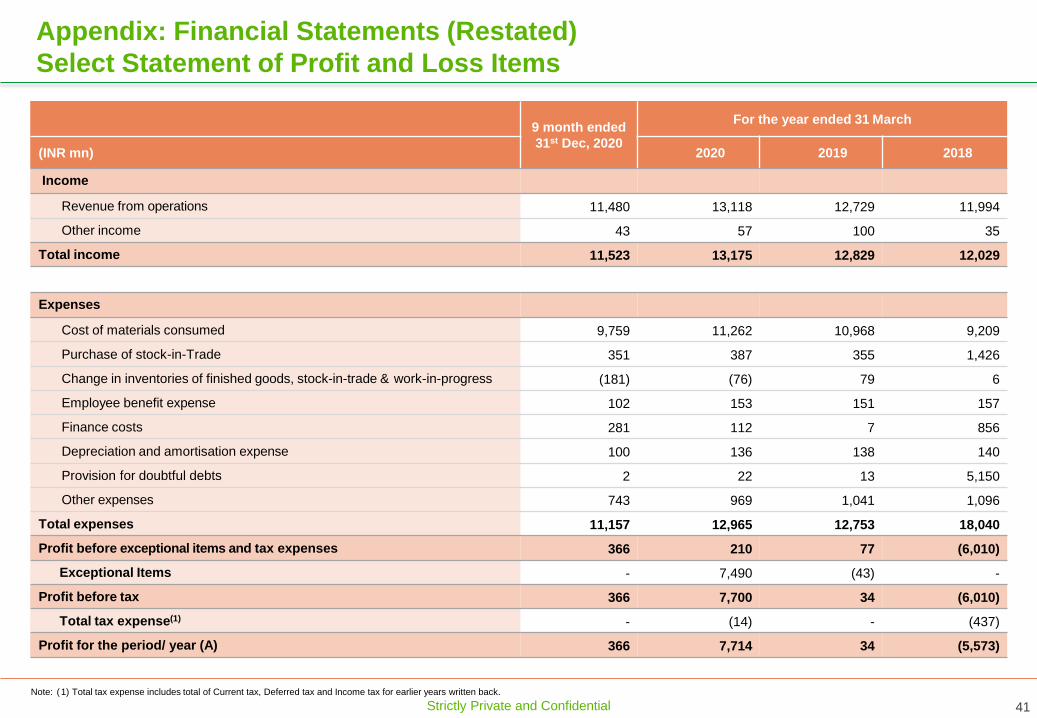
Appendix: Financial Statements (Restated)
Select Statement of Profit and Loss Items
9 month ended
31st Dec, 2020
For the year ended 31 March
(INR mn) 2020 2019 2018
Income
Revenue from operations 11,480 13,118 12,729 11,994
Other income 43 57 100 35
Total income 11,523 13,175 12,829 12,029
Expenses
Cost of materials consumed 9,759 11,262 10,968 9,209
Purchase of stock-in-Trade 351 387 355 1,426
Change in inventories of finished goods, stock-in-trade & work-in-progress (181) (76) 79 6
Employee benefit expense 102 153 151 157
Finance costs 281 112 7 856
Depreciation and amortisation expense 100 136 138 140
Provision for doubtful debts 2 22 13 5,150
Other expenses 743 969 1,041 1,096
Total expenses 11,157 12,965 12,753 18,040
Profit before exceptional items and tax expenses 366 210 77 (6,010)
Exceptional Items - 7,490 (43) -
Profit before tax 366 7,700 34 (6,010)
Total tax expense(1) - (14) - (437)
Profit for the period/ year (A) 366 7,714 34 (5,573)
Note: (1) Total tax expense includes total of Current tax, Deferred tax and Income tax for earlier years written back.

Strictly Private and Confidential 42
Note: (1) Other adjustments includes Exceptional Items, Net Loss on Sale/Discard of Fixed Assets, Share-based payment expense, Impairment on investments and Fair value adjustments (net), Interest Income, Dividend Income, (Gain)/Loss on foreign currency
transaction/translation, Provision for doubtful debt / advances, expected credit loss, write off (Net), (Gain)/loss on sale of Investment, Provision from loss in LLP, Income of investment, Excess Provision/Liabilities no longer required written back. (2) Change in
operating assets and liabilities includes total of (Increase)/ Decrease in inventories , (Increase)/ Decrease in trade and other Receivables, Increase/ (Decrease) in trade and other payables. (3) Others includes total of Proceeds from sale of Property, Plant and
Equipment , Proceeds on account of Capital reduction, (Increase)/ Decrease in Other Balance with Banks, Interest income, Dividend received. (4) Proceeds from borrowings includes Proceeds from debentures, Proceeds from long term borrowings, Proceeds from
short term borrowings (Net). (5) Cash and Cash Equivalents include Cash in hand, In Current Accounts, In Deposit Accounts with less than or equal to 3 months maturity.
Appendix: Financial Statements (Restated)
Select Cash Flow Statement Items
9 month ended
31st Dec, 2020
For the year ended 31 March
2020 2019 2018(INR mn)
Cash flows from operating activities
Profit/(loss) before income tax 366 7,700 34 (6,010)
Adjustments for
Depreciation and amortisation expense 100 136 138 140
Finance Cost 281 112 7 855
Other non-cash adjustments(1) (25) (7,490) 9 5,166
Change in operating assets and liabilities(2) (621) (528) 30 93
Income taxes paid, net (2) (3) 19 (0.1)
Net cash generated from operating activities 99 (73) 238 245
Cash flows from investing activities
Payment for Purchase and Construction of CWIP, Property, Plant and Equipment (14) (19) (9) (2)
Others(3) (27) (7) (103) (68)
Net cash used in investing activities (41) (26) (112) (70)
Cash flows from financing activities
Proceeds from equity share capital 205
Proceeds from preference share capital 450
Proceeds from borrowings(4) 111 3,480
Repayment of long term borrowings (23)
Repayment of short term & long term borrowings pursuant to completion of CIRP (3,977)
Finance costs paid (246) (75) (5) (207)
Lease liability payment (0.3) (0.5)
Net cash (used in)/ generated from financing activities (157) 82 (5) (207)
Net (decrease)/ increase in cash and cash equivalents (99) (16) 121 (33)
Cash and cash equivalents at the beginning of the financial year 154 170 49 82
Cash and cash equivalents at end of the period/ year(5) 55 154 170 49
Strictly Private and Confidential 43
Disclaimer
Ruchi Soya Industries Limited (the “Company”) is proposing, subject to receipt of requisite approvals, market conditions and other considerations, to make a further public offer of its equity shares and has filed a draft red herring
prospectus dated 12 June 2021 (“DRHP”) with the Securities and Exchange Board of India (“SEBI”). The DRHP is available on the website of SEBI at www.sebi.gov.in as well as on the websites of the book running lead managers,
SBI Capital Markets Limited, Axis Capital Limited and ICICI Securities Limited (the “BRLMs”) at www.sbicaps.com , www.axiscapital.co.in and www.icicisecurities.com respectively, and the websites of the stock exchange(s) at
www.nseindia.com and www.bseindia.com, respectively. Any potential investor should note that investment in equity shares involves a high degree of risk and for details relating to such risk, see “Risk Factors” on page 30 of the
DRHP, when available. Potential investors should not rely on the DRHP for any investment decision. If the Company should at any time commence an offering of securities, any decision to invest in any such offer to subscribe for
or acquire securities of the Company must be based wholly on the information contained in the red herring prospectus and the prospectus (including the risk factors mentioned therein) issued or to be issued by the Company in
connection with any such offer and not on the content herein.
This presentation (“the Presentation”) is for information purposes only without regard to specific objectives, financial situations or needs of any persons and does not constitute an offer, solicitation, invitation to offer or
advertisement with respect to the purchase or sale of any securities of the Company in any jurisdiction and no part of it shall form the basis of, or be relied upon in connection with, any contract or commitment whatsoever.
Information contained in this Presentation is qualified in its entirety by reference to an offering document for any potential transaction, if it proceeds. This Presentation is not a complete description of the Company. The
contents of this Presentation have not been independently verified. In preparing this Presentation, we have relied upon and assumed, without any independent verification, the accuracy and completeness of all information
available, including from public sources and none of the Company nor any of its respective affiliates, advisers or representatives has verified this data with independent sources. The information contained in this Presentation is
not to be taken as any recommendation made by the Company or any other person to enter into any agreement with regard to any investment. No representation or warranty (express or implied) is made as to, and no reliance
should be placed on, the accuracy, completeness or correctness of any information, including any forward-looking statements, estimates, targets and opinions contained herein, and no liability whatsoever is accepted as to any
errors, omissions or misstatements contained herein. You acknowledge and agree that the Company and/or its affiliated companies and/or their respective employees and/or agents have no responsibility or liability (express or
implied) whatsoever and howsoever arising (including, without limitation for any claim, proceedings, action, suits, losses, expenses, damages or costs) which may be brought against or suffered by any person as a result of acting
in reliance upon the whole or any part of the contents of this Presentation. All recipients of the information package should make their own independent evaluations and should conduct their own investigation and analysis and
should check the accuracy, reliability and completeness of the information and obtain independent and specified advice from an appropriate professional adviser, as they deem necessary. Unless specifically mentioned, this
Presentation speaks as of its date. This Presentation contains certain assumptions, which we consider reasonable at this point of time and our views as of this date and are accordingly subject to change. Neither the delivery of
this Presentation nor any further discussions of the Company with any of the recipients shall, under any circumstances, create any implication that there has been no change in the affairs of the Company since such date. The
information contained in this Presentation should be considered in the context of the circumstances prevailing at the time and has not been, and will not be, updated to reflect material developments, which may occur after the
date of the Presentation. The information set out herein may be subject to updating, completion, revision, verification and amendment and such information may change materially. It should be understood that subsequent
developments may affect the information contained in this Presentation, which neither the Company nor its affiliates, advisors or representatives are under an obligation to update, revise or affirm.
This document also contains certain forward-looking statements relating to the business, financial performance, strategy and results of the Company and/or the industry in which it operates. Forward-looking statements are
statements concerning future circumstances and results, and any other statements that are not historical facts, generally identified by the words “aim”, “anticipate”, “believe”, “expect”, “estimate”, “intend”, “likely to”,
“objective”, “plan”, “project”, “propose”, “will”, “will continue”, “seek to”, “will pursue” or other words or phrases of similar import. The forward-looking statements contained in this Presentation, including those extracted from
third party sources, are based on certain beliefs, plans and expectations of the Company about the future, and are uncertain and subject to risks. Although the Company believes that such forward-looking statements are based
on reasonable assumptions, it can give no assurance that such expectations will be met. A multitude of factors including, but not limited to, changes in demand, competition and technology, can cause actual events, performance
or results to differ significantly from any anticipated development. Neither the Company nor its affiliates or advisors or representatives, including the BRLMs, nor any such person’s officers or employees guarantee that the
assumptions underlying such forward-looking statements are free from errors, nor do any such persons or entities accept any responsibility for the future accuracy of the forward-looking statements contained in this
Presentation or the actual occurrence of the forecast developments. The information in this Presentation is subject to change without notice, its accuracy is not guaranteed, it may be incomplete or condensed and it may not
contain all material information concerning the Company. The Company expressly disclaims any obligation or undertaking to release any update or revisions to any forward-looking statements in this Presentation as a result of
any change in expectations or any change in events, conditions, assumptions or circumstances on which these forward-looking statements are based.
This Presentation is not intended to be a prospectus (as defined under the Companies Act, 2013, as amended) or draft offer document/an offer document under the Securities and Exchange Board of India (Issue of Capital and
Disclosure Requirements) Regulations, 2018, as amended.
Certain data contained in this Presentation was obtained from various external data sources and the report titled ‘Report on Indian Packaged Food Industry’, dated June 10, 2021 prepared by Technopak Advisors Private Limited.
This Presentation is strictly confidential and is intended only for the exclusive use of the recipients thereof, subject to the provisions stated herein, and may not be disclosed, reproduced, published, retransmitted, summarized,
distributed or furnished, in or whole or in part, or passed on directly or indirectly to any other person or persons whether within or outside your organization or firm, or published in whole or in part, for any purpose by recipients
directly or indirectly to any other person. Any printed form of this Presentation must be returned to us immediately at the conclusion of the Presentation.