Southern Copper Corporation March, 2017 · Cuajone variable cut-off grade + HPGR Expansion (X)...
19
0 Southern Copper Corporation March, 2017
Transcript of Southern Copper Corporation March, 2017 · Cuajone variable cut-off grade + HPGR Expansion (X)...

0
Southern Copper CorporationMarch, 2017
1
I. Introduction

2
Management Presenter
Presenters Title
Raul Jacob Vice President, Finance & CFO
3
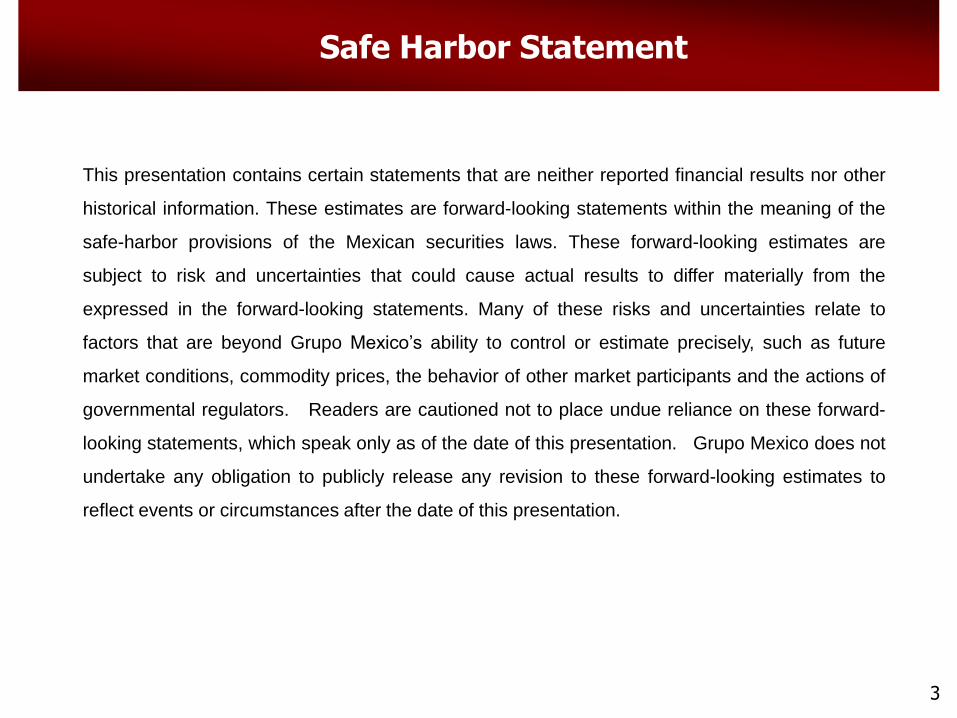
This presentation contains certain statements that are neither reported financial results nor other
historical information. These estimates are forward-looking statements within the meaning of the
safe-harbor provisions of the Mexican securities laws. These forward-looking estimates are
subject to risk and uncertainties that could cause actual results to differ materially from the
expressed in the forward-looking statements. Many of these risks and uncertainties relate to
factors that are beyond Grupo Mexico’s ability to control or estimate precisely, such as future
market conditions, commodity prices, the behavior of other market participants and the actions of
governmental regulators. Readers are cautioned not to place undue reliance on these forward-
looking statements, which speak only as of the date of this presentation. Grupo Mexico does not
undertake any obligation to publicly release any revision to these forward-looking estimates to
reflect events or circumstances after the date of this presentation.
Safe Harbor Statement

4
Corporate Structure
100.0% (*)
99.29 % 99.96 %
11.1% (*)
Public Float
SCC Peru Branch Minera Mexico
(*) As of December 31, 2016
AMERICASMINING
CORPORATION
88.9% (*)
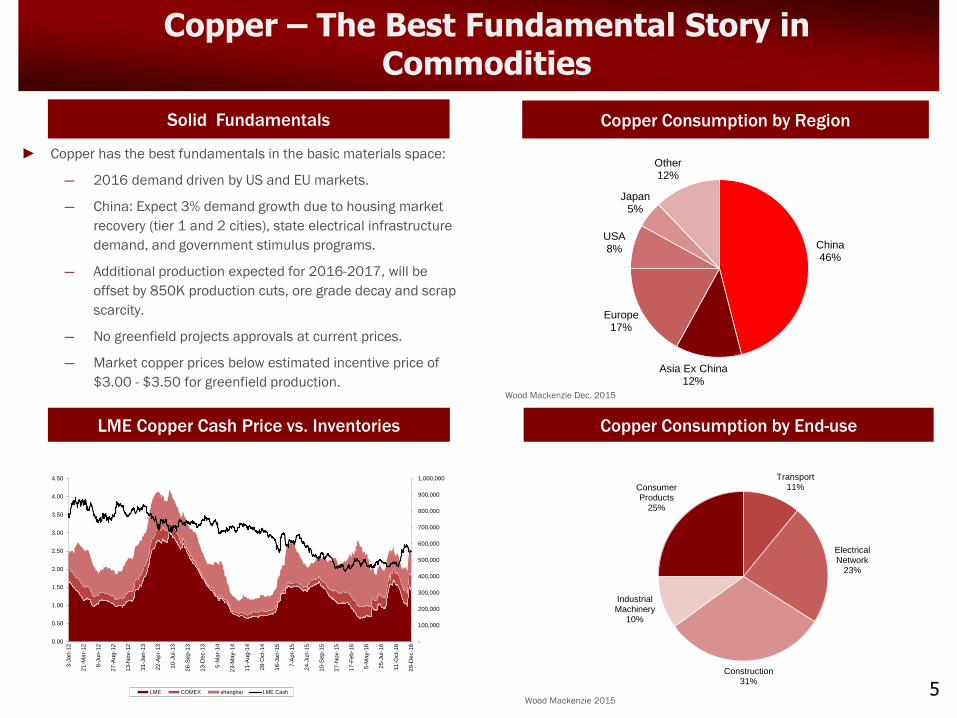
Transport11%
Electrical Network
23%
Construction31%
Industrial Machinery
10%
Consumer Products
25%
China46%
Asia Ex China12%
Europe17%
USA8%
Japan5%
Other12%
LME Copper Cash Price vs. Inventories Copper Consumption by End-use
Solid Fundamentals Copper Consumption by Region
Wood Mackenzie 2015
Copper – The Best Fundamental Story in Commodities
5
► Copper has the best fundamentals in the basic materials space:
― 2016 demand driven by US and EU markets.
― China: Expect 3% demand growth due to housing market
recovery (tier 1 and 2 cities), state electrical infrastructure
demand, and government stimulus programs.
― Additional production expected for 2016-2017, will be
offset by 850K production cuts, ore grade decay and scrap
scarcity.
― No greenfield projects approvals at current prices.
― Market copper prices below estimated incentive price of
$3.00 - $3.50 for greenfield production.Wood Mackenzie Dec. 2015
-
100,000
200,000
300,000
400,000
500,000
600,000
700,000
800,000
900,000
1,000,000
0.00
0.50
1.00
1.50
2.00
2.50
3.00
3.50
4.00
4.50
3-J
an-1
2
21
-Mar-
12
8-J
un-1
2
27
-Aug
-12
13
-Nov-1
2
31
-Jan
-13
22
-Apr-
13
10
-Jul-
13
26
-Sep
-13
13
-Dec-1
3
5-M
ar-
14
23
-May-1
4
11
-Aug
-14
28
-Oct-
14
16
-Jan
-15
7-A
pr-
15
24
-Jun
-15
10
-Sep
-15
27
-Nov-1
5
17
-Fe
b-1
6
5-M
ay-1
6
25
-Jul-
16
11
-Oct-
16
29
-Dec-1
6
LME COMEX shanghai LME Cash
6
Southern Copper Strengths
►Highest copper reserves of the industry
►Excellent organic growth projects
►Low cost, fully integrated operations
►Experienced management team
►Strong financial performance / investment grade since 2005
►Outstanding dividend history
►Good long-term copper & by-product fundamentals
7
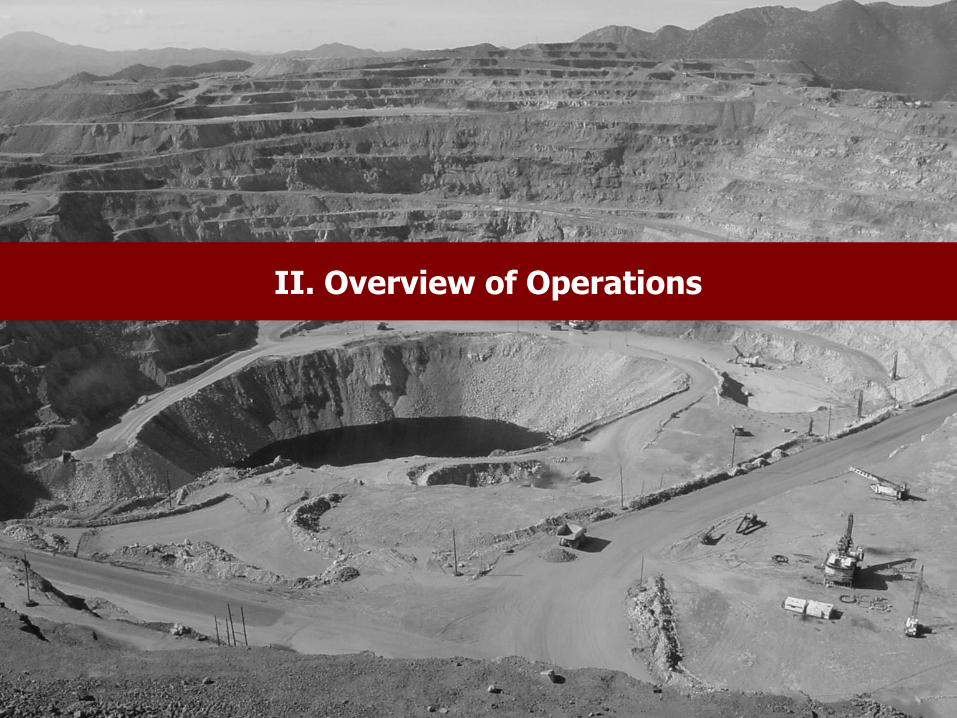
II. Overview of Operations
8
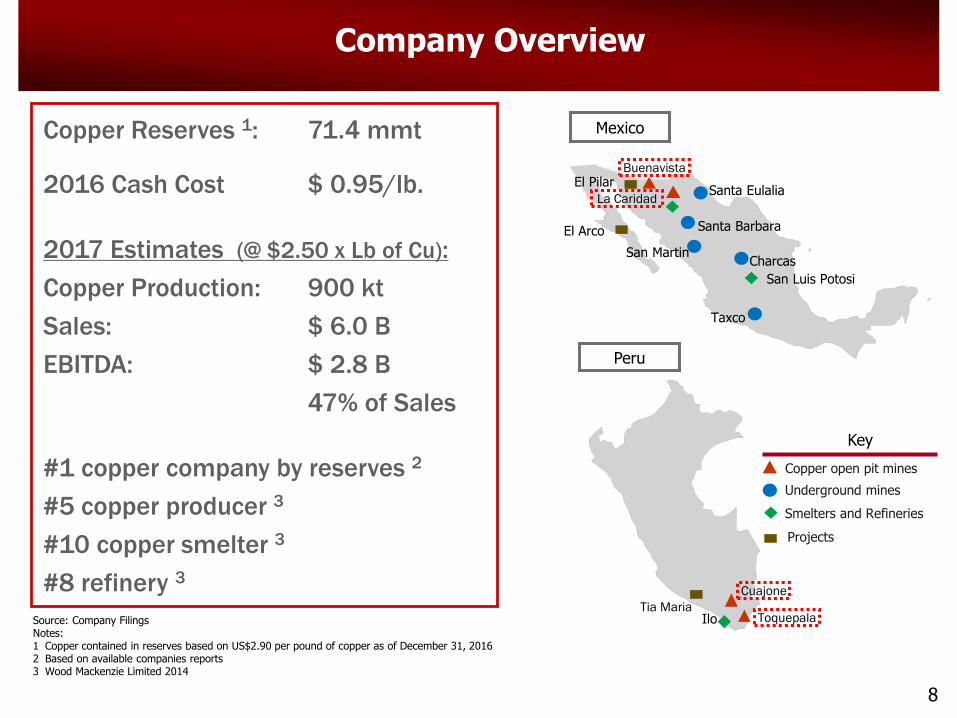
Peru
Ilo
Mexico
Copper open pit mines
Underground mines
Smelters and Refineries
Key
Company Overview
Copper Reserves 1: 71.4 mmt
2016 Cash Cost $ 0.95/lb.
2017 Estimates (@ $2.50 x Lb of Cu):
Copper Production: 900 kt
Sales: $ 6.0 B
EBITDA: $ 2.8 B
47% of Sales
#1 copper company by reserves 2
#5 copper producer 3
#10 copper smelter 3
#8 refinery 3
Source: Company FilingsNotes: 1 Copper contained in reserves based on US$2.90 per pound of copper as of December 31, 20162 Based on available companies reports3 Wood Mackenzie Limited 2014
Santa Barbara
Charcas
Taxco
San Luis Potosi
Santa Eulalia
San Martin
Cuajone
La Caridad
Buenavista
ToquepalaTia Maria
Projects
El Arco
El Pilar

94
59
34 34
2521 21
18
0
20
40
60
80
100
SCC2015
SCC afterexpansion
AngloAmerican
Codelco Freeport BHPBilliton
Rio Tinto Xstrata
9
Copper Reserves as Reported SCC Highlights
►#1 mine life among copper producers
►#5 world’s largest producer of mined copper
►Highly diversified geographical presence
►Four large-scale open-pit mines
►Two world class copper greenfield projects
(El Arco / Tia Maria) and several other
opportunities
Mine Life
World’s Largest Copper Reserves
70.1
56.7
36.633.7 31.8
27.0
20.7
13.0 10.7
0
10
20
30
40
50
60
70
80
SC
C
Co
de
lco
Fre
eport
BH
P B
illiton
Ang
loA
me
rica
n
Gle
ncore
Xstr
ata
Rio
Tin
to
Anto
fagasta
VA
LE
Co
pp
er
Re
serv
es (
Mt)
Source 10K Annual Rep. 10K 20F Annual Rep. Reserve Rep. Annual Rep. 20F 20F
Period Dec.31, 2015 Dec.31, 2014 Dec.31, 2014 Jun. 30, 2015 Dec.31, 2014 Dec. 31, 2014 Dec. 31, 2014 Dec. 31, 2014 Dec. 31, 2014
Cu Price $2.90 N/A $2.00 3.35 N/A N/A N/A $3.10 $3.35
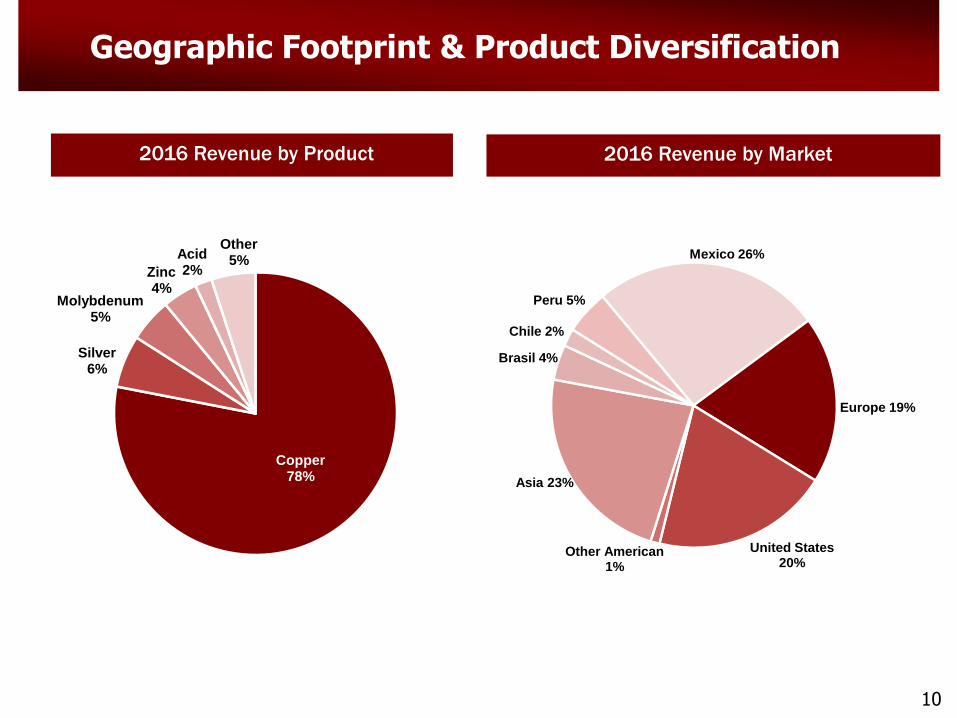
Geographic Footprint & Product Diversification
2016 Revenue by Product 2016 Revenue by Market
10
Copper78%
Silver6%
Molybdenum5%
Zinc4%
Acid2%
Other5% Mexico 26%
Europe 19%
United States20%
Other American1%
Asia 23%
Brasil 4%
Chile 2%
Peru 5%

Operating Materials
20%
Fuel12%
Power18%Labor
13%
Maintenance19%
Other18%
11
Low Cost Operations
Cash Cost per Pound of Copper Produced
Net of By-Products
Cost Structure (1)Operating Cash Cost per Pound of Copper
Produced
Low Cost Drivers
Fully integrated low cost operations
World class assets
Significant SX-EW production
Strong by-product credits
Management focus on cost efficiency
(1) LTM
1.921.89
1.66
1.45
1.20
1.70
2.20
2013 2014 2015 2016
(US
$/lb
)
1.00
1.07
1.11
0.95
0.8
1.0
1.2
2013 2014 2015 2016
(US
$/lb
)
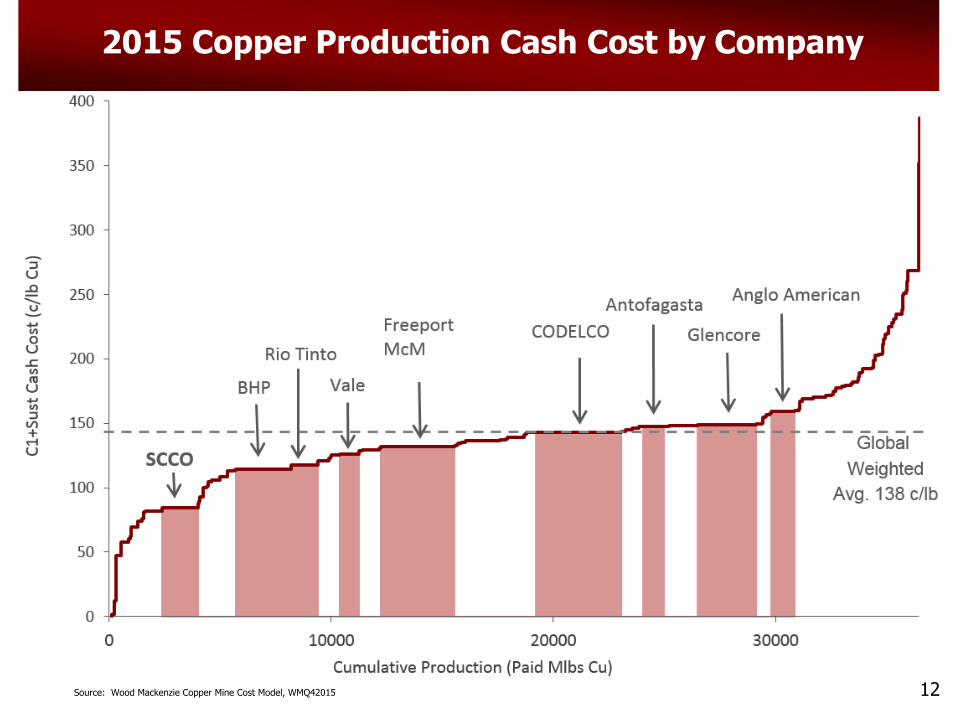
2015 Copper Production Cash Cost by Company
12Source: Wood Mackenzie Copper Mine Cost Model, WMQ42015
13
III. Financial Overview
14
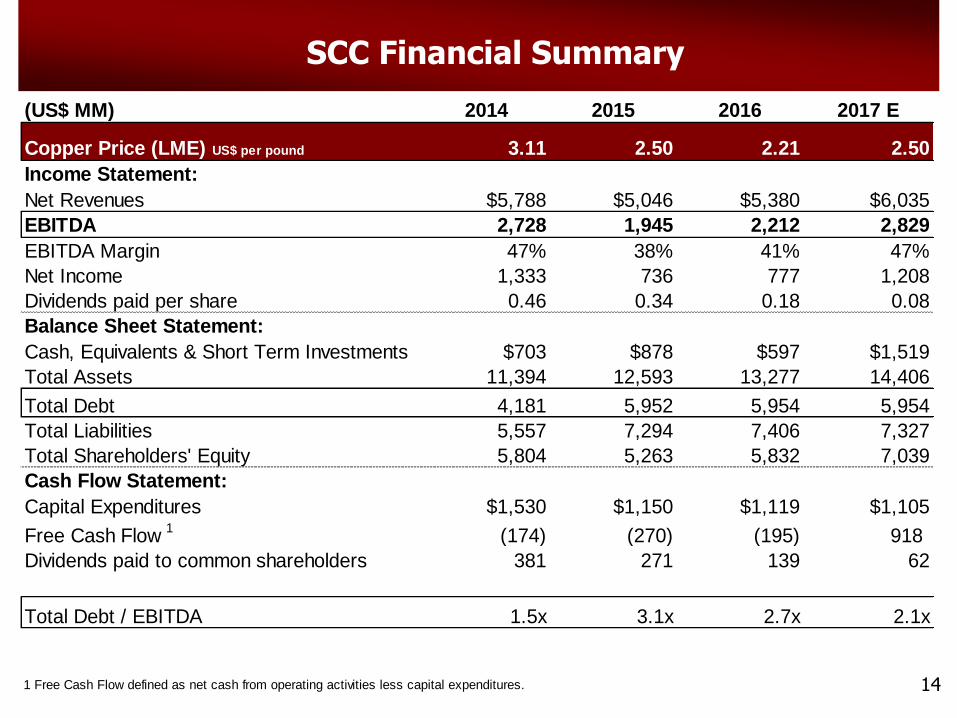
SCC Financial Summary
(US$ MM) 2014 2015 2016 2017 E
Copper Price (LME) US$ per pound 3.11 2.50 2.21 2.50
Income Statement:
Net Revenues $5,788 $5,046 $5,380 $6,035
EBITDA 2,728 1,945 2,212 2,829
EBITDA Margin 47% 38% 41% 47%
Net Income 1,333 736 777 1,208
Dividends paid per share 0.46 0.34 0.18 0.08
Balance Sheet Statement:
Cash, Equivalents & Short Term Investments $703 $878 $597 $1,519
Total Assets 11,394 12,593 13,277 14,406
Total Debt 4,181 5,952 5,954 5,954
Total Liabilities 5,557 7,294 7,406 7,327
Total Shareholders' Equity 5,804 5,263 5,832 7,039
Cash Flow Statement:
Capital Expenditures $1,530 $1,150 $1,119 $1,105
Free Cash Flow 1
(174) (270) (195) 918
Dividends paid to common shareholders 381 271 139 62
Total Debt / EBITDA 1.5x 3.1x 2.7x 2.1x
1 Free Cash Flow defined as net cash from operating activities less capital expenditures.
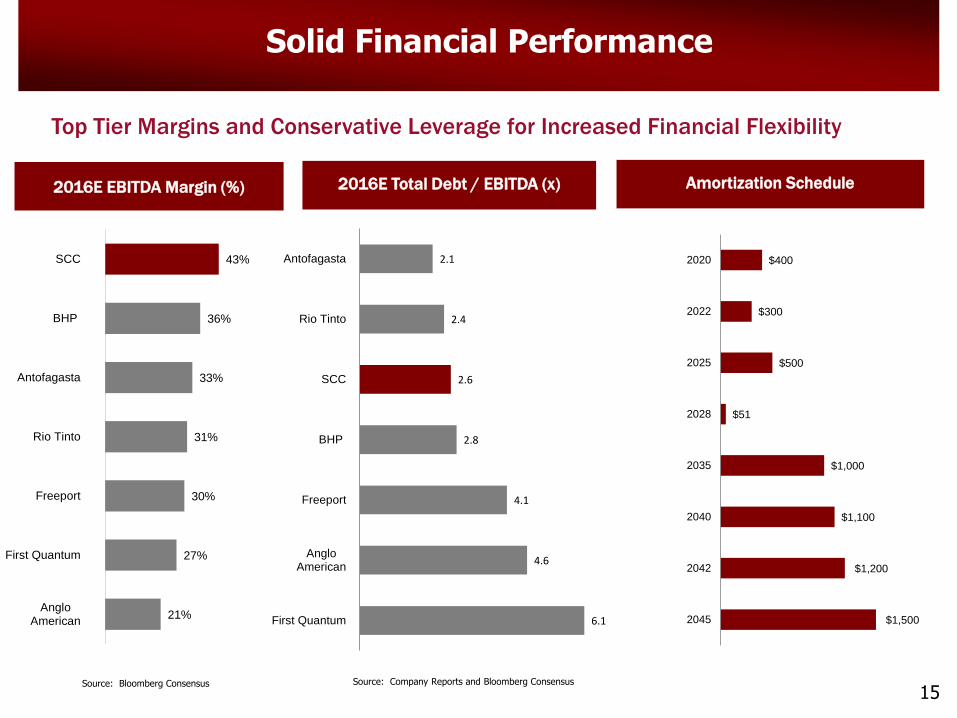
Top Tier Margins and Conservative Leverage for Increased Financial Flexibility
2016E Total Debt / EBITDA (x)2016E EBITDA Margin (%)
15Source: Bloomberg Consensus
Amortization Schedule
Source: Company Reports and Bloomberg Consensus
Solid Financial Performance
$1,500
$1,200
$1,100
$1,000
$51
$500
$300
$400
2045
2042
2040
2035
2028
2025
2022
2020
21%
27%
30%
31%
33%
36%
43%
AngloAmerican
First Quantum
Freeport
Rio Tinto
Antofagasta
BHP
SCC
6.1
4.6
4.1
2.8
2.6
2.4
2.1
First Quantum
AngloAmerican
Freeport
BHP
SCC
Rio Tinto
Antofagasta

1,118 1,105
1,622
1,189
786
472
-
200
400
600
800
1,000
1,200
1,400
1,600
1,800
2016 2017 2018 2019 2020 2021 16Source: SCC
Toquepala Concentrator Expansion
2Q18 - $1.2B - 100K Tons Cu , 3.1K
Tons Mo
2013-16 2017-20Buenavista:
- Molybdenum Plant 3Q13 - $38M - 2K
Tons Mo
- SX/EW III 4Q14 - $525M 120K Tons
Cu
- Concentrator Plant 1Q16 - $1.4B -
188K Tons Cu, 2.6K Tons Mo
- Mine equipment $505M
Buenavista Zinc Conc. 1Q19 - $360M
16K Tons Cu - 60K Tons Zn
Los Chancas Conc. & SX/EW -
$2.8B - 134K Tons Cu, 7.6K
Tons Mo
Pilares 3Q18 - $200M 34.5K Tons Cu
Malpica - $92M 10K Tons Cu
Investment Program to SignificantlyIncrease Production
Board approved Other projects
Cuajone: Variable Cut-off Grade + HPGR
2H13 - $158M - 22K Tons Cu,
0.7K Tons Mo
2016-2021 Capex Program Overview (MM) 2015-2020 Copper Production Forecast (‘000 MT Cu)
Tia Maria SX/EW 2Q20 – $1.4B - 120K
Tons Cu
El Arco Conc. & SX/EW - $2.8B
184K Tons Cu, 105K Oz Au
Cuajone Concentrator
Expansion - $500M – 50K
Tons Cu, 0.7 Tons Mo
Ilo Smelter & Refinery
Expansion
El Pilar 1Q18 - $310M – 35K Tons Cu
MEXICO PERU
Los Chalchihuites - $140M
26K Tons Cu
Angangueo Polymetallic Mine -
$170M - 10.4K Tons Cu, 7K
Tons Zn, 4K Tons Pb, 2.4M Oz
Ag

Initial Capex % of Total Incremental Production Capital Intensity
Type (US$MM) Capex Av. Cu Eq. (kt/a) (US$/tpa Av. Cu Eq.)
Brownfield Projects
Cuajone variable cut-off grade + HPGR Expansion (X) 158.0 2.5% 22.0 7,182
Toquepala concentrator expansion Expansion (N) 1,253.2 19.9% 100.0 12,532
Buenavista SXEW III Expansion (N) 1,363.5 21.6% 120.0 11,363
Buenavista concentrator expansion Expansion (N) 1,785.4 28.3% 188.0 9,497
Pilares Extension 189.5 3.0% 40.0 4,738
Total / Weighted Average Intensity 4,749.6 75.3% 470.0 10,105
Greenfield Projects
Tia Maria SXEW Project Probable 1,379.2 21.9% 120.0 11,493
Angangueo Possible 174.7 2.8% 10.4 16,798
Total / Weighted Average Intensity 1,553.9 24.7% 130.4 11,916
Key Differentiators to Achieve Lower Capital Intensity
• Use of less capital intensive and environmentally friendly SX/EWtechnology for 45% of production growth
• Significant economies of scale in infrastructure for 77% of production increase coming from brownfield expansions
• Reduced mining preparation cost due to low pre stripping for Tia Maria and Buenavista projects
• Experienced project development team focused on capital efficiency
Source: Wood Mackenzie (Global Copper Mine Supply Summary, May 2014), SCCO filings and presentations
Project Capital Intensity at SCCO Projects
Industry-Wide Capital Intensity Comparison vs. SCCO Projects 2011-2015 Capex Evolution
US$MMWeighted Avg. Project Capital Intensity of Existing Projects
US$ 000 per tonne of Cu Equivalent Annual Incremental Production
4.9
9.9 11.7
16.5
10.1
17.7
21.6
11.9
0
5
10
15
20
25
Restarts Extensions ofExisting Mine
Life
Expansionsto Existing
Mine/Plant (X)
ExpansionsNew Process
Plant (N)
SCCOBrownfield
Probable Possible SCCOGreenfield
Brownfield - Industry Greenfield - Industry
SCCO Project Pipeline
17
Best-in-class Mining Projects Reaching Completion Providing Competitive Cash Costs and Increased Production Levels
613
1,052
1,703
1,535
1,150
-
400
800
1,200
1,600
2,000
2011 2012 2013 2014 2015

SCC is the Premier Copper Play
• World class assets in investment grade countries
• #1 in reserves of any company with various exploration prospects
- Increasing copper production
• Capacity to deliver projects through flexible capital structure and significant cash
generation capability. Investments focused on cost competitiveness
• Fully integrated low cost operations
• Outstanding dividend history
• Experienced management with proven track record
(in US$ millions)
SCC EBITDA and % Margin
SCC’s Major Strengths
18
$2,865
$3,910 $3,773
$2,945 $2,728
$1,945$2,212
$2,829
56% 57% 57% 49% 47%38% 41% 47%
2010 2011 2012 2013 2014 2015 2016 2017 E
$3.42 $3.61 $3.11 $2.21Cu price $4.00 $2.50$2.50$3.32