SOUTH CENTRAL COAST LOUISIANA FLOOD PROTECTION AND COASTAL … 1… · 06/11/2018 · FLOOD...
30
SOUTH CENTRAL COAST LOUISIANA FLOOD PROTECTION AND COASTAL STORM RISK MANAGEMENT FEASIBILITY STUDY “The views, opinions and findings contained in this report are those of the authors(s) and should not be construed as an official Department of the Army position, policy or decision, unless so designated by other official documentation.”
Transcript of SOUTH CENTRAL COAST LOUISIANA FLOOD PROTECTION AND COASTAL … 1… · 06/11/2018 · FLOOD...
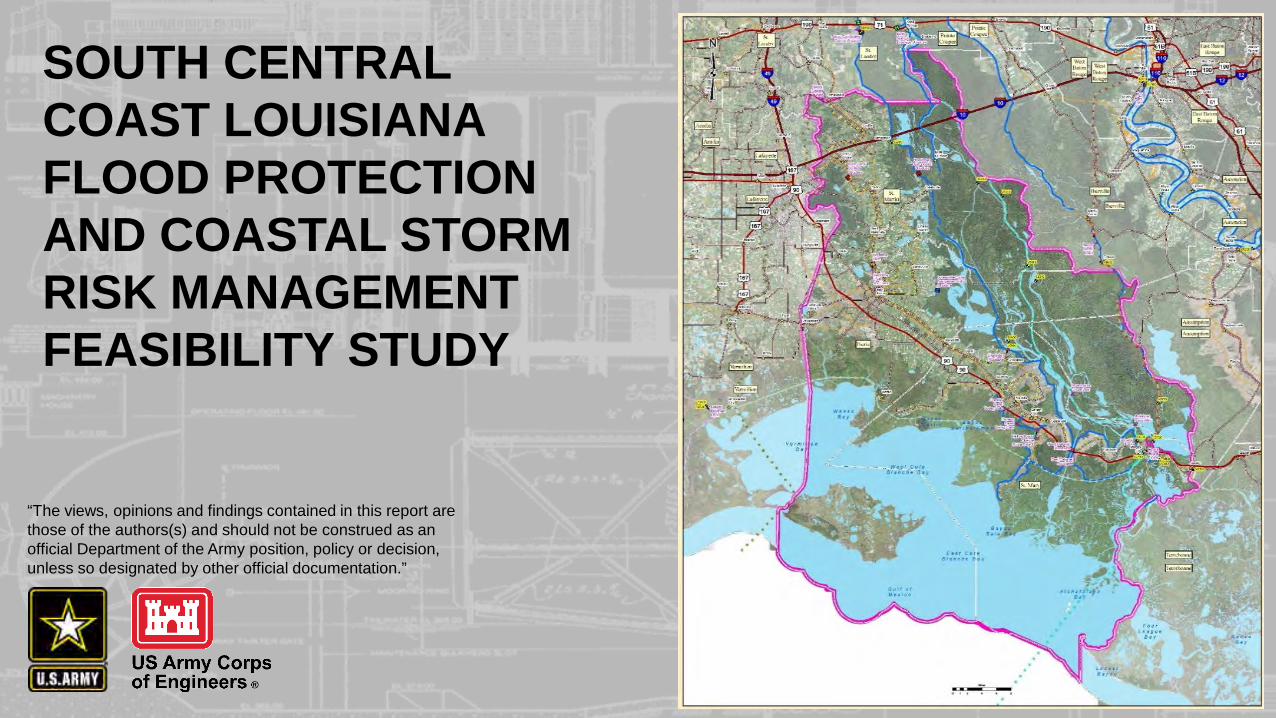
SOUTH CENTRAL COAST LOUISIANAFLOOD PROTECTION AND COASTAL STORM RISK MANAGEMENT FEASIBILITY STUDY
“The views, opinions and findings contained in this report are those of the authors(s) and should not be construed as an official Department of the Army position, policy or decision, unless so designated by other official documentation.”

2OVERVIEW
I. Welcome
II. Project Overview • Authority • Study Area• Coordination• Schedule• Planning Process
III. Planning Steps
IV. Comments

3AUTHORITYH.R. Docket 2767 (20 September 2006)
- Southeast Coastal Louisiana, LA, Resolved by the Committee on Transportation and Infrastructure of the United States House of Representatives, that, in accordance with section 110 of the River and Harbor Act of 1962
“Resolved by the Committee on Transportation and Infrastructure of the United States House of Representatives, that, in accordance with section 110 of the River and Harbor Act of 1962, the Secretary of the Army is requested to survey the coast of Louisiana in Iberia, St. Martin, and St. Mary parishes with a view to determine the feasibility of providing hurricane protection and storm damage reduction and related purposes.” Southeast Coastal Louisiana, LA was effectively renamed South Central Coast Louisiana, LA to avoid confusion with the Southeast Louisiana urban flood control project covering Jefferson, Orleans, and St. Tammany Parishes.”
Bipartisan Budget Act of 2018- (Public Law 115-123), Division B, Subdivision 1, H. R. 1892—13, TITLE IV, CORPS OF
ENGINEERS—CIVIL, DEPARTMENT OF THE ARMY, INVESTIGATIONS- Limits scope to the flood risk management

4
SOUTH CENTRAL COAST LA STUDY AREA

5
Goal 1: Increase sustainability and resiliency of communities to flood events.Objective 1a. Reduce risk to life safety from hurricanes and storm swells
Objective 1b. Reduce economic loss/damages to structures (i.e. residential, commercial, agricultural, and industrial from hurricanes, storm swells, and interior flooding within the Project area.
Goal 2: Maintain and sustain the resiliency of natural ecosystem to reduce flood damages.
Objective 2a. Minimize degradation to vulnerable coastal habitat and wetland areas.
Objective 2b. Increase sustainability of existing natural flood barriers such as wetlands.
GOALS & OBJECTIVES
Above all, the goal is reducing the risk to the people, the culture and a way of life that is uniquely Louisiana
6
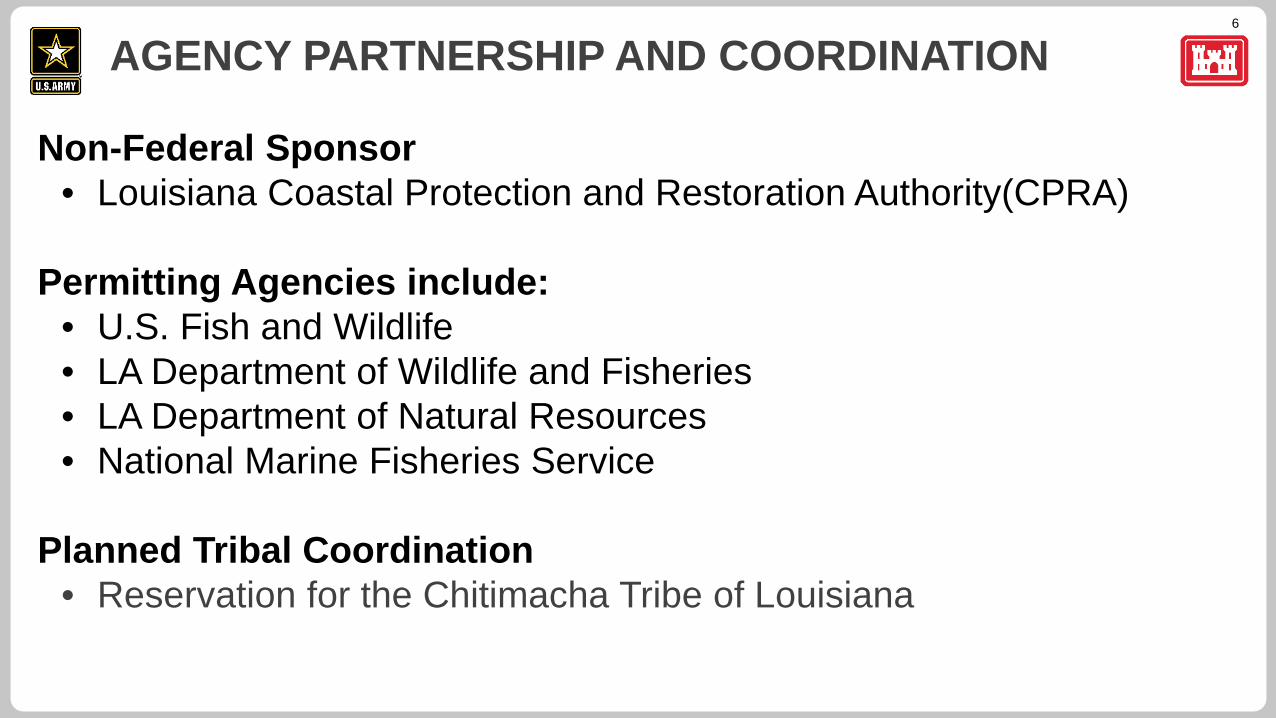
AGENCY PARTNERSHIP AND COORDINATION
Non-Federal Sponsor• Louisiana Coastal Protection and Restoration Authority(CPRA)
Permitting Agencies include:• U.S. Fish and Wildlife • LA Department of Wildlife and Fisheries • LA Department of Natural Resources• National Marine Fisheries Service
Planned Tribal Coordination• Reservation for the Chitimacha Tribe of Louisiana

7
We are here
Future Opportunity for Public Input
TodayDEC 2018 to
OCT 2019
DEC 2019
SEP 2020
SEP 2021

8
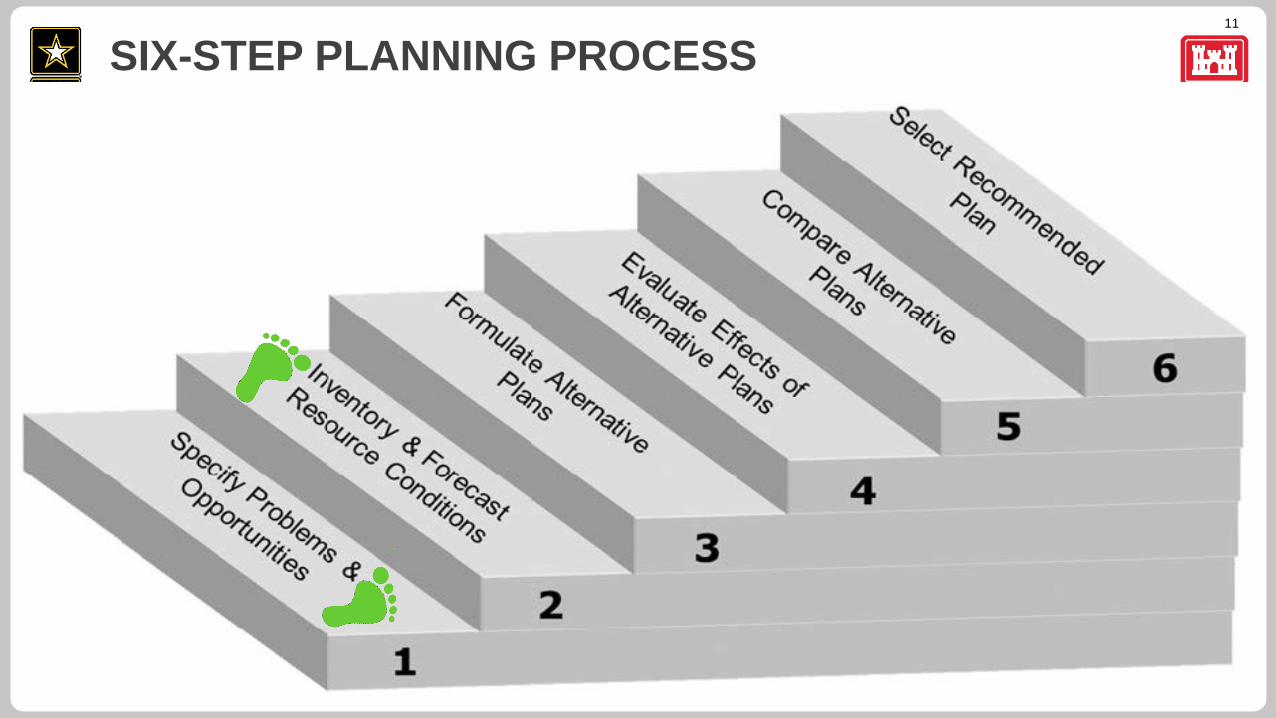
SIX-STEP PLANNING PROCESS
9
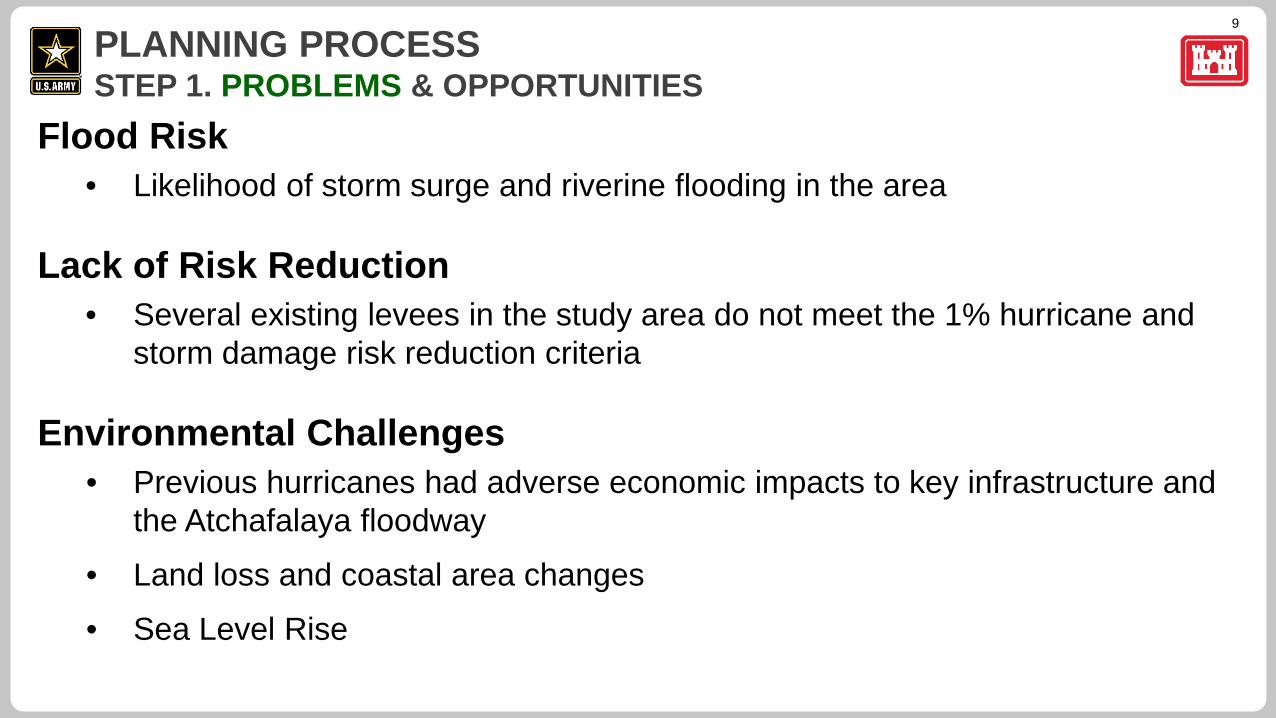
PLANNING PROCESSSTEP 1. PROBLEMS & OPPORTUNITIES
Flood Risk• Likelihood of storm surge and riverine flooding in the area
Lack of Risk Reduction• Several existing levees in the study area do not meet the 1% hurricane and
storm damage risk reduction criteria
Environmental Challenges• Previous hurricanes had adverse economic impacts to key infrastructure and
the Atchafalaya floodway• Land loss and coastal area changes • Sea Level Rise

10
• The safety of the public is the Corps’ top priority• Reduce flood damage risks to land, property by providing
non-structural solutions• Leverage local, state and federal efforts to manage flood risk• Reduce flood risk to commodities and critical infrastructure• Ensure Hwy 90 (future I-49 Corridor) is a reliable evacuation
route• Stem coastal land and wetland loss
PLANNING PROCESSSTEP 1. PROBLEMS & OPPORTUNITIES
11
SIX-STEP PLANNING PROCESS

12
1% STORM SURGE STILL WATER ELEVATION WITH LEVEE DESIGN ELEVATIONS
*Including design levee elevations for Wax Lake Area West, Wax Lake Area East, and Bayou Sale
PLANNING PROCESSSTEP 2. INVENTORY AND FORECASTING
13
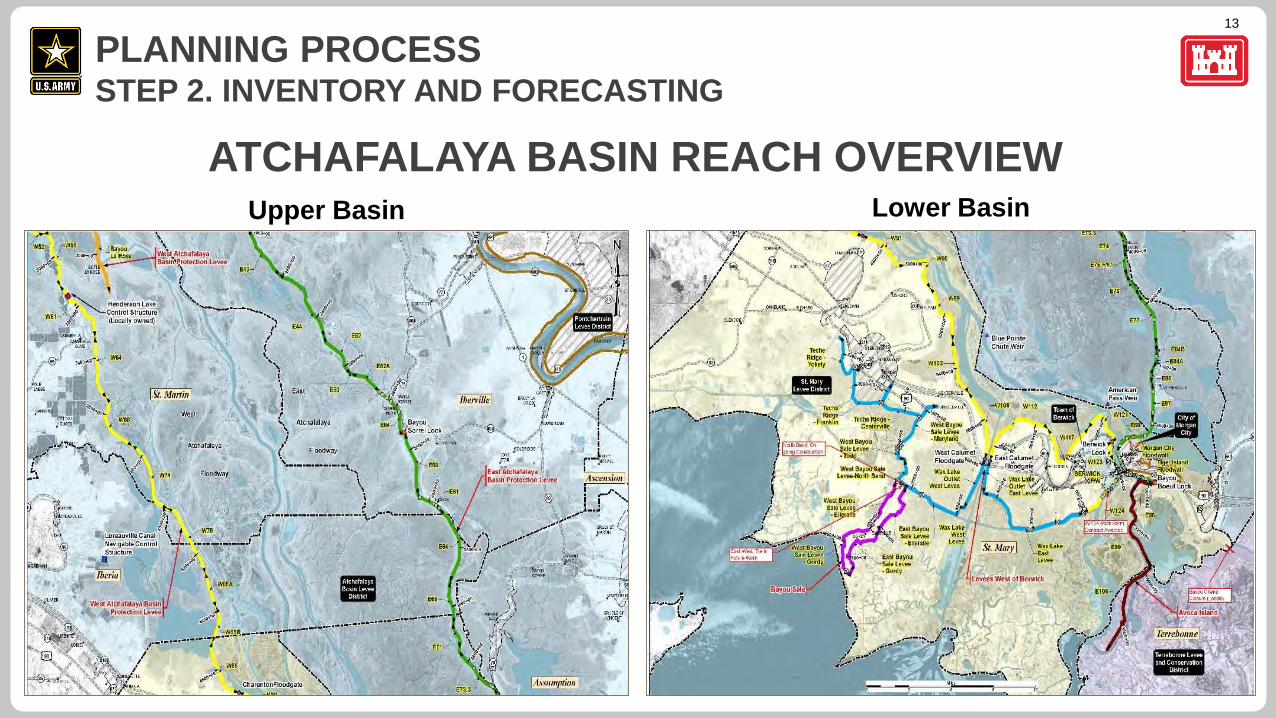
ATCHAFALAYA BASIN REACH OVERVIEW
PLANNING PROCESSSTEP 2. INVENTORY AND FORECASTING
Upper Basin Lower Basin

14
EXISTING FLOOD MANAGEMENT INFRASTRUCTURE
PLANNING PROCESSSTEP 2. INVENTORY AND FORECASTING

15NATIONAL STRUCTURE INVENTORY
SouthCentralStudyArea
St. Mary
Iberia
St. Martin
Population of ~177k people and 75,263 structures valued at $18.6 billion
16
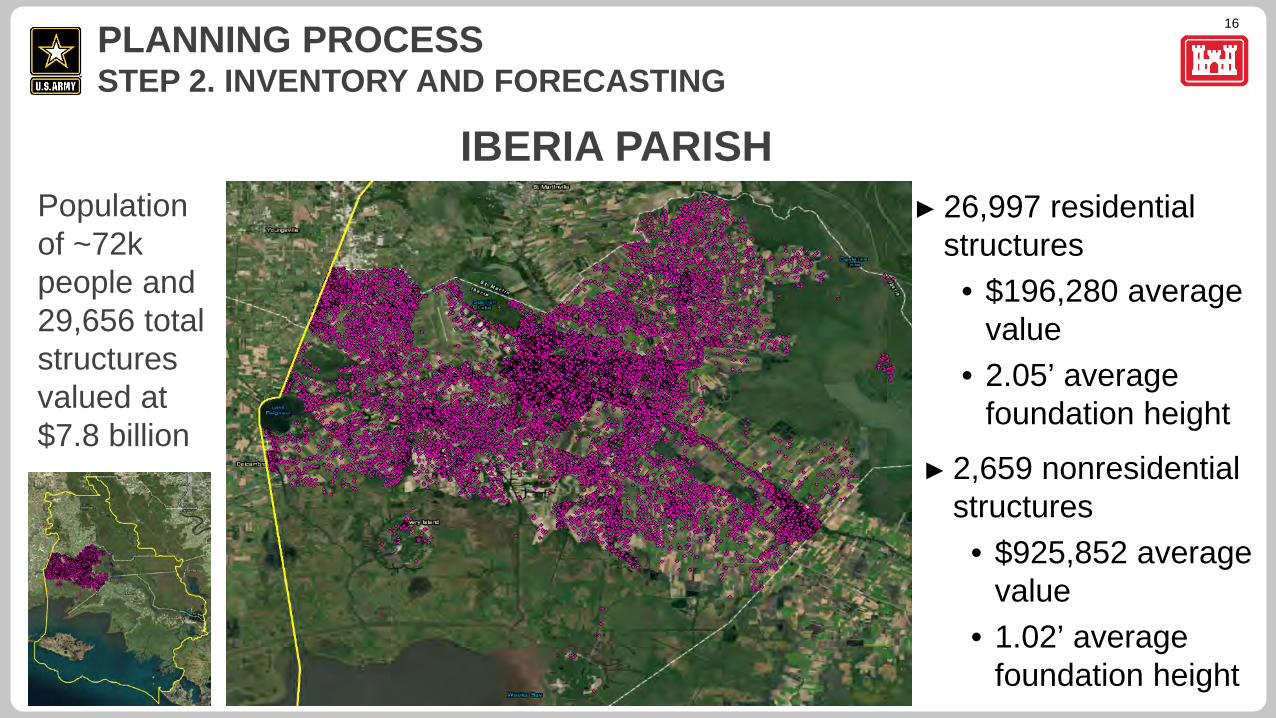
Population of ~72k people and 29,656 total structures valued at $7.8 billion
IBERIA PARISH
► 2,659 nonresidential structures
• $925,852 average value
• 1.02’ average foundation height
► 26,997 residential structures
• $196,280 average value
• 2.05’ average foundation height
PLANNING PROCESSSTEP 2. INVENTORY AND FORECASTING

17
Population of ~54k
people and 22,499 total structures valued at
$5.0 billion
ST. MARTIN PARISH ► 1,399 nonresidential
structures• $728,576 average
value• 1.00’ average
foundation height
► 21,100 residential structures
• $187,935 average value
• 2.04’ average foundation height
PLANNING PROCESSSTEP 2. INVENTORY AND FORECASTING

18
Population of ~51k
people and 23,108 total structures valued at
$5.9 billion
ST. MARY PARISH
► 2,158 nonresidential structures
• $887,410 average value
• 1.02’ average foundation height
► 20,950 residential structures
• $190,597 average value
• 2.04’ average foundation height
PLANNING PROCESSSTEP 2. INVENTORY AND FORECASTING

19
FEMA Flood Claim Statistics (JAN 1978 to SEP 2018)
TOTAL CLOSED OPEN
CLOSED WITHOUT PAYMENT TOTAL
PARISH NAME COMMUNITY NAME LOSSES LOSSES LOSSES LOSSES PAYMENTS------------------------- ------------------------------ ---------- --------- --------- --------- -----------------IBERIA PARISH DELCAMBRE, TOWN OF 517 459 58 $18,744,366
JEANERETTE, CITY OF 47 31 16 $1,135,748LOREAUVILLE, VILLAGE OF 4 3 1 $21,834NEW IBERIA, CITY OF 568 469 1 98 $7,961,104UNINCORPORATED 1,949 1,721 2 226 $66,784,094IBERIA PARISH TOTAL 3,085 2,683 3 399 $94,647,146
ST. MARTIN PARISH BREAUX BRIDGE, TOWN OF 83 63 20 $1,411,911HENDERSON, TOWN OF 51 40 11 $1,181,800PARKS, VILLAGE OF 7 7 $107,800ST. MARTINVILLE, CITY OF 49 36 13 $888,003UNINCORPORATED 1,133 947 2 184 $15,473,956ST. MARTIN PARISH TOTAL 1,323 1,093 2 228 $19,063,470
ST. MARY PARISH BALDWIN, TOWN OF 49 35 1 13 $348,904BERWICK, TOWN OF 78 60 18 $479,856FRANKLIN, CITY OF 555 401 1 153 $6,546,494MORGAN CITY, CITY OF 434 286 148 $1,762,063PATTERSON, CITY OF 63 52 11 $394,737UNINCORPORATED 1,167 960 2 205 $21,934,206ST. MARY PARISH TOTAL 2,346 1,794 4 548 $31,466,260
STUDY AREA TOTAL 6,754 5,570 9 1,175 $145,176,876
PLANNING PROCESSSTEP 2. INVENTORY AND FORECASTING

20
Land use within study area
Emergent Herbaceuous Wetlands 18%
Woody Wetlands 43%
Cultivated Crops 17%
Hay/Pasture 3%
Herbaceuous <1%
Shrub/Scrub <1%
Mixed Forest <1%
Evergreen Forest <1%
Deciduous Forest <1%
Barren Land 1%
Developed, High Intensity <1%
Developed, Medium Intensity <1%
Developed, Low Intensity 3%
Developed, Open Space 2%
Open Water 10%
PLANNING PROCESSSTEP 2. INVENTORY AND FORECASTING

21
USDA crops within study area Wetlands 64%
Sugarcane 11%
Soybeans 3%
Open Water 10%
Grassland/Pasture 4%
Fallow/Idle Cropland 2%
Developed Land 5%
Aquaculture 1%
PLANNING PROCESSSTEP 2. INVENTORY AND FORECASTING

22
CURRENT REGIME – NO ACTION ALTERNATIVEFuture Without Project Condition- is a description of resources and human environment most likely condition if no additional actions are taken as a result of this study
- Increased flood risk- Sea level rise- Increased storm surges
- Increased storm damages- Frequency- Intensity
- Subsidence expected to continue at current rate- Coastal erosion will continue- Damages would likely increase- Salt water intrusion
- Loss of estuary fisheries and rearing grounds- Delta forming at the Wax Lake outlet and Atchafalaya River

23
• Compliance with environmental laws
• Mitigation cost and bank availability
• Appropriation Authority- Not formulating for ecosystem restoration
• Seek to minimize the transfer of flood risk
• Minimize impacts to cultural and historic
• Seek to minimize coastal marsh loss
• Avoid and consider design constraints of local infrastructure and transportation (railroad, bridges, highways)
• Avoid impacts to critical infrastructure such as emergency responder corridors
• Avoid emergency responders and community support facilities
• Avoid impacts to navigation, ports and Gulf Intercostal Waterway (GIWW)
• Hazardous, Toxic, Radioactive Waste (HTRW) if found in project area
CONSTRAINTS
24
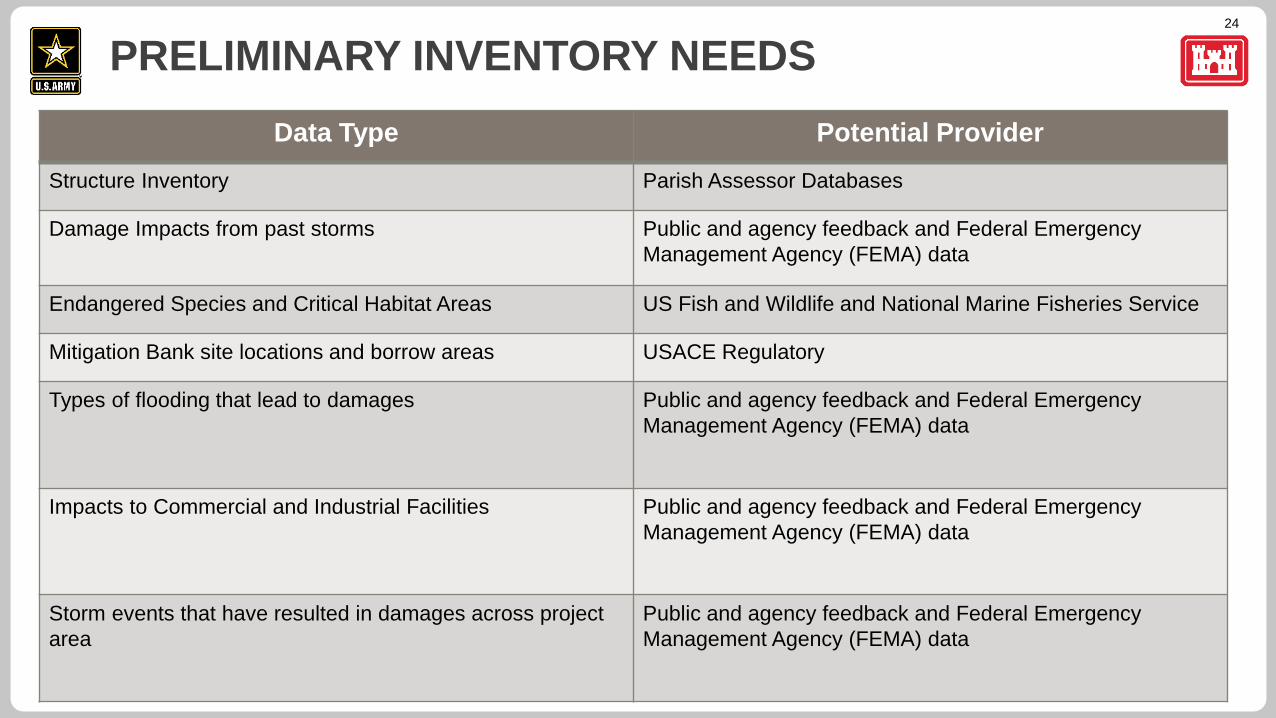
PRELIMINARY INVENTORY NEEDSData Type Potential Provider
Structure Inventory Parish Assessor Databases
Damage Impacts from past storms Public and agency feedback and Federal Emergency Management Agency (FEMA) data
Endangered Species and Critical Habitat Areas US Fish and Wildlife and National Marine Fisheries Service
Mitigation Bank site locations and borrow areas USACE Regulatory
Types of flooding that lead to damages Public and agency feedback and Federal Emergency Management Agency (FEMA) data
Impacts to Commercial and Industrial Facilities Public and agency feedback and Federal Emergency Management Agency (FEMA) data
Storm events that have resulted in damages across project area
Public and agency feedback and Federal Emergency Management Agency (FEMA) data

25
SIX-STEP PLANNING PROCESS

26
ALTERNATIVE STRATEGIES
Strategy - No ActionStrategy –Structural Focus
(CPRA)Strategy – Reduce impacts to at risk
communities
Strategy –Reduce impacts to areas with reoccurring damages
Strategy – Non- Structural Strategy – combination of structures and non- structural alternatives
How Where
27
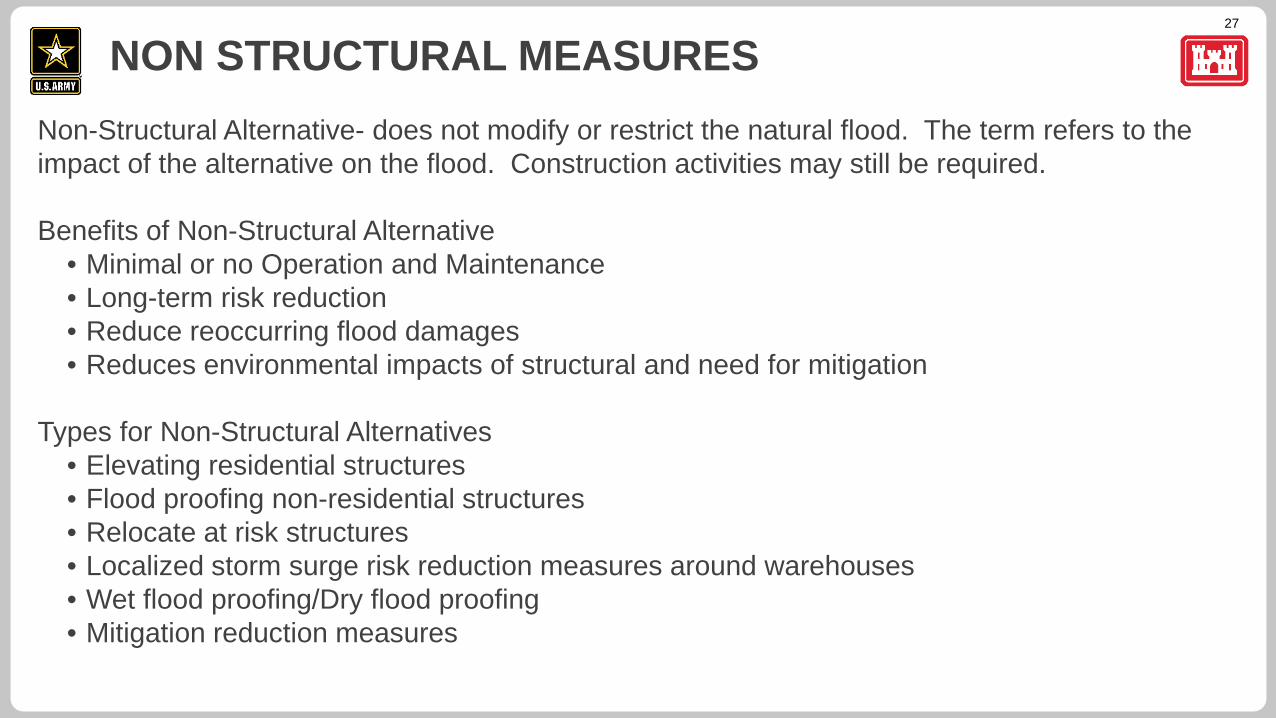
Non-Structural Alternative- does not modify or restrict the natural flood. The term refers to the impact of the alternative on the flood. Construction activities may still be required.
Benefits of Non-Structural Alternative• Minimal or no Operation and Maintenance• Long-term risk reduction • Reduce reoccurring flood damages• Reduces environmental impacts of structural and need for mitigation
Types for Non-Structural Alternatives• Elevating residential structures• Flood proofing non-residential structures• Relocate at risk structures• Localized storm surge risk reduction measures around warehouses• Wet flood proofing/Dry flood proofing• Mitigation reduction measures
NON STRUCTURAL MEASURES

28
Initial Alternative Comparison Criteria may include:
• Reduction in Average Annual Damages
• Reduction in risk to life loss
• Reduction of flood risk based on flood frequency
• Preliminary costs
• Preliminary benefits to National Economic Development Account
• Mitigation costs and bank availability
ALTERNATIVE EVALUATION & COMPARISON

29
1. Are the problems identified capturing what is being experienced in the communities?
2. Are there additional problems related to storm damages and flooding in the project area that are not captured?
3. What flood event did your community see the most damages?
4. Are there alternative strategies that would address the problems more effectively?
5. Are there additional constraints the planning team should consider?
6. Is there any data/studies or other information that is available?
WHAT WE NEED FROM YOU
30
COMMENTS
South Central Coastal Study Website –http://www.mvn.usace.army.mil/About/Projects/BBA-2018/studies/South-Central-
Coastal/
Comments or information can be provided to: U.S. Army Corps of Engineers, New Orleans District
C/O Carrie SchottCEMVN-PM-B
7400 Leake Avenue New Orleans, LA 70118
Or by email to