
Sources and sinks of scallops ( maximus) in the waters of ...
25
Sources and sinks of scallops (Pecten maximus) in the waters of the Isle of Man as predicted from particle tracking models Simon P. Neill & Michel J. Kaiser School of Ocean Sciences, Bangor University, Menai Bridge, Anglesey, LL59 5AB To cite this report: Neill, S.P. & Kaiser, M.J. (2008) Sources and sinks of scallops (Pecten maximus) in the waters of the Isle of Man as predicted from particle tracking models. Fisheries & Conservation report No. 3, Bangor University. Pp. 25..
Transcript of Sources and sinks of scallops ( maximus) in the waters of ...

Sources and sinks of scallops (Pecten
maximus) in the waters of the Isle of Man
as predicted from particle tracking models
Simon P. Neill & Michel J. Kaiser
School of Ocean Sciences, Bangor University, Menai Bridge, Anglesey, LL59 5AB
To cite this report: Neill, S.P. & Kaiser, M.J. (2008) Sources and sinks of scallops (Pecten maximus) in the waters of the Isle of Man as predicted from particle tracking models. Fisheries & Conservation report No. 3, Bangor University.
Pp. 25..

Introduction
Marine Protected Areas (MPAs) are advocated to perform two
functions: i) conservation: protecting biodiversity within the reserve and
ii) fisheries enhancement: improvement of fisheries yields and
sustainability through spillover of adults and larvae from reserves to
fished areas and the prevention of overexploitation (Hilborn et al., 2004;
Kaiser, 2005). Whereas the first function is non-controversial, the second
remains open to debate for temperate systems and there is currently
insufficient empirical scientific evidence for spillover effects of MPAs,
with good examples so far only demonstrated for tropical marine
ecosystems such as coral reefs (Russ and Alcala, 1996; Roberts et al.,
2001; Sweeting and Polunin, 2005). Siting marine reserves at locations
that maximise potential spillover from the MPAs to adjacent fishing
grounds, and at the same time enable the establishment of a network
of reserves linked by larval dispersal, is a crucial step towards
sustainability. However, research on practical methods for achieving
this is in its infancy. Furthermore, setting aside a marine reserve initially
reduces the area that can be fished, thus reducing initial yield. The
question then is whether the yield in the area that remains open will
increase enough to compensate for losses from the closed area
(Hilborn et al., 2004). Displacement of existing fishing effort will lead to
an increase in fishing pressure outside the MPA and an associated
decline in stocks that would have been similar or worse than the
situation without the marine reserve. It is critical to have scientific
evidence to improve the implementation of MPAs and to engage
stakeholders in this management approach. The location of MPAs in
inappropriate locations will reduce their credibility with the fishing
industry if they do not achieve their intended goals.
Unlike fish, scallops (Pecten maximus) are sessile species that are
restricted to specific seabed types that enable the scallop to recess
into the sediment. Scallops release eggs and sperm into the water and
the resulting larvae are transported on tidal currents for a period of 3 –
5 weeks. Given the considerable tidal energy in the Irish Sea, the
dispersal distance from the point of source of larvae could be
considerable. Therefore it is important to study the potential sources
and sinks of scallops if we are to provide evidence to inform the
location of possible areas closed to scallop fishing (designed to
increase scallop biomass and hence generate more larvae). To do this,
particle tracking models (PTMs) are useful tools that enable us to model and
predict the movement of particles (larvae) transported on tidal currents. Such
models simulate larval trajectories in three-dimensional flow fields (Tremblay et
al., 1994; Proctor et al., 1998; Mullon et al., 2003; Pedersen et al., 2003; Miller et
al., 2006). Developing accurate PTMs requires information on hydrodynamic
conditions (tidal flows, currents, gyres, meteorological forcing e.g. wind) and

on larval biology (time of spawning, vertical migration, duration and depth of
planktonic drift, growth and mortality rates).
The present study was undertaken to provide initial insights into the dispersal
dynamics of particles released from six sites in the coastal waters of the Isle of
Man. Three sites were pre-determined as possible source locations (Port Erin,
Douglas and Laxey Bay). These sites were chosen because they are either
existing or were proposed closed areas). Each of the other sites was chosen in
an iterative process advised by the outcome of each successive modelling
exercise (i.e. the outcome of modelling site 1 informed the choice of location
of site 2…). Models were run for 3 and 5 weeks which encompasses published
estimates of the time scallop larvae spend in the water column prior to
settlement.
Methodology
In shelf seas, astronomical tides are the dominant cause of water
movements. However, since tidal currents are oscillatory, they do not
significantly affect the long-term transport of larvae relative to residual
currents. This residual flow is primarily due to local wind stress on the sea
surface and horizontal density gradients (baroclinic flows). For a
numerical model of the Irish Sea applied to Lagrangian transport, it is
essential to account for this residual flow. The 3D baroclinic/barotropic
POLCOMS model was applied in this project at a horizontal resolution
of approximately 1 km with 20 vertical (sigma) layers to the northern
Irish Sea (Fig. 1). Lateral boundaries of the POLCOMS model were
driven by astronomical tides and baroclinic flow provided from an
outer nested model of the northwest European continental shelf at a
resolution of approximately 12 km (Fig. 2). Both outer and inner nests
were coupled with high resolution (hourly) meteorological data of wind
speed, wind direction, atmospheric pressure, air temperature, cloud
cover and relative humidity.
For the purposes of developing realistic baroclinic flows, the model
simulation was started on the 1st March since at that time, stratification
throughout the Irish Sea will be minimal as a result of the preceding
autumn/winter climate. Hence, the assumption was made that a single
temperature value (8ºC) was applied throughout the domain as the
initial condition. Since realistic model output was not required until
August (i.e. 5 months later), the exact nature of this artificial initial
condition is not critical. For both outer and inner nested models, the
temperature and velocity fields were evolved from this initial condition
until August at which point the depth-averaged velocity field for the
high-resolution inner nest was written to file every 15 minutes for a
period of 35 days. Since larval density does not affect hydrodynamics,
the particle tracking model (PTM) was used offline (in conjunction with
POLCOMS-generated flow fields) using advective (deterministic) and
diffusive (stochastic) steps in order to track the larval positions forwards

(and backwards) in time, using the six proposed marine reserve
positions as initial conditions.
Using a high performance (12 processor) Silicon Graphics machine at
Bangor University, 6101 particles were simulated for each release
scenario using a model time step of 5 minutes. Bi-linear interpolation
was applied to each particle position to determine the components of
velocity at sub-grid cell scales. Since the time step of the PTM (5
minutes) does not match the time step of the POLCOMS model output
(15 minutes) it was also necessary to make a temporal linear
interpolation of the velocity field for every time step of the PTM. The
time step of 5 minutes was chosen according to the Courant-Friedrichs-
Lewy condition which states that for stability and accuracy, model
information must not propagate more than one grid cell in one time
step, i.e.
u
xt
and
v
yt
where t is the time step, x and y are the eastwards and northwards
cell size (respectively) and u and v are the eastwards and northwards
velocity (respectively).
Since wind forcing and baroclinic currents are stochastic, the model
was run for 10 different release events (at a spacing of 48 hours)
throughout August and the results combined to give a more robust
prediction of dispersal than a single release would achieve. On each
release, the advection and (turbulent) diffusion of 6101 particles was
simulated. Therefore, with 10 releases, this resulted in 61010 particles
used to derive probability density plots. These quantify on a cell-by-cell
basis the percentage probability that a particle which has originated
from a proposed marine reserve will be located at this new location
over the prescribed time period. The model was also run backwards to
give the probability that particles terminating at a marine reserve have
originated from different source locations.
Results
By way of example, the particle positions for each release scenario (i.e.
staggered in 48 hour intervals) are plotted after 21 days in Fig. 3 for the
Ramsey Bay case. In most of the outputs, the particles have been
entrained by the western Irish Sea gyre (a cyclonic, i.e. anticlockwise,
system). The particles for all ten of these simulations were combined
and the number of particles present at each model grid cell
(approximately 1 km × 1 km) were summed and divided by the total
number of particles released to produce the probability density plot
(Fig. 4). Hence, this is the 21 days forwards dispersal kernel for a
theoretical Ramsey Bay marine reserve.
Considering all simulations together provides useful insights into the
potential connectivity around the waters of the Isle of Man. Ramsey
Bay is of note as it appears to transport particles to the Northeastern
Irish Sea towards the Solway Firth/Cumbrian coast with some larvae
transported to the northwestern coastline of the Isle of Man, and many
retained at the northerly end of Ramsay Bay. However the supply of
larvae to Ramsey Bay would appear to be from a semi-circular array of
offshore seabed that perhaps indicates some form of gyre system in
that region. Offshore regions to the east of the Isle of Man appear to
supply larvae to inshore grounds such as Laxey and Douglas. These two
sites disperse larvae that are advected to the North (Ramsey Bay), but
primarily to the south and southwest of the Isle of Man which is the
location of some of the most important fishing grounds. Larvae
dispersed from Derbyhaven and Port Erin are advected to the south
west grounds but in the case of Port Erin largely to the northwest
offshore area known as ‘The Targets’.
Discussion
The use of a particle tracking model has provided useful preliminary
insights into the connectivity of the scallop grounds around the Isle of
Man. There is considerable connectivity around the Island among the
different known scallop grounds. This would suggest that a network of
areas would increase the resilience of the scallop population from
over-exploitation. However, some source areas were located beyond
those waters under the jurisdiction of the Isle of Man Government.
These source areas are therefore ‘at risk’ from scallop fishing activity by
other fleets that controlled by UK and EU regulations.
Isle of Man fishing industry observations indicate that the scallops in
Douglas and Laxey Bays are poor quality in terms of their meat
condition and yield. However, the predictions generated by the PTM
suggest that these scallops may have a disproportionate importance in
terms of supply of larvae to commercially fished areas to the south and
west of the Isle of Man. Based on these predictions, recommendations
were made that the stock enhancement programme that occurred in
2008 was focussed on the introduction of scallops into Douglas Bay and
the area closed to scallop fishing.
The modelling work undertaken is a preliminary attempt at
understanding the issue of connectivity around the Isle of Man. Further
model runs that incorporate larval behaviour (diurnal vertical migration
between the surface and the seabed or pycnocline) and a wider
range of wind forcing events. It would be highly desirable to take a

forward look at climate change scenarios by running the PTM with wind
and temperature parameters forecast under climate change
scenarios.
Recommendations
Undertake further runs using the PTM to test its sensitivity to larval
behaviour and a wider range of climate forcing events.
Undertake further runs using the PTM to test climate change scenarios
to evaluate the resilience of the scallop fisheries around the Isle of Man
to climate forcing events.
Acknowledgement: This research was funded by the Isle of Man
Government
References
Hilborn, R., Stokes, K., Maguire, J.J., Smith, T., Botsford, L.W., Mangel, M., Orensanz, J.,
Parma, A., Rice, J., Bell, J., Cochrane, K.L., Garcia, S., Hall, S.J., Kirkwood, G.P.,
Sainsbury, K., Stefansson, G., Walters, C., 2004. When can marine reserves
improve fisheries management? Ocean & Coastal Management 47, 197-205.
Kaiser, M.J., 2005. Are marine protected areas a red herring or fisheries panacea?
Canadian Journal of Fisheries and Aquatic Sciences 62, 1194-1199.
Miller, D.C.M., Moloney, C.L., Van der Lingen, C.D., Lett, C., Mullon, C., Field, J.G.,
2006. Modelling the effect of physical-biological interactions and spatial
variability in spawning and nursery areas on transport and retention of sardine
Sardinops sagax eggs and larvae in southern Benguela ecosystem. Journal of
Marine Systems 61, 212-229.
Mullon, C., Freon, P., Parada, C., Van der Lingen, C.D., Huggett, J., 2003. From
particles to individuals: modelling the early stages of anchovy (Engraulis
capensis/encrasicolus) in the southern Benguela. Fisheries Oceanography 12,
396-406.
Neill, S.P., Hashemi, M.R., Elliott, A.J., 2007. An enhanced depth-average tidal model
for morphological studies in the presence of rotary currents. Continental Shelf
Research 27, 82-102.
Neill, S.P., Copeland, G.J.M., Ferrier, G., Folkard, A.M., 2004. Observations and
numerical modelling of a non-buoyant front in the Tay Estuary, Scotland.
Estuarine, Coastal and Shelf Science 59, 173-184.
Pedersen, O.P., Aschan, M., Rasmussen, T., Tande, K.S., Slagstad, D., 2003. Larval
dispersal and mother populations of Pandalus borealis investigated by a
Lagrangian particle-tracking model. Fisheries Research 65, 173-190.
Proctor, R., Wright, P.J., Everitt, A., 1998. Modelling the transport of larval sandeels on
the north-west European shelf. Fisheries Oceanography 7, 347-354.
Roberts, C.M., Bohnsack, J.A., Gell, F.R., Hawkins, J.P., Goodridge, R., 2001. Marine
reserves enhance adjacent fisheries. Science (Washington, D.C.) 294, 1920-
1923.
Russ, G.R., Alcala, A., 1996. Marine reserves - rates and patterns of recovery and
decline of large predatory fish. Ecological Applications 6, 947-961.
Slater, J., 2005. Morphological identification of larval king scallops, Pecten maximus
(L.) from natural plankton samples. Journal of Shellfish Research 24, 937-949.
Tremblay, M.J., Loder, J.W., Werner, F.E., Naimie, C.E., Page, F.H., Sinclair, M.M., 1994.
Drift of scallop larvae Placopecten magellanicus on Georges Bank: a model

study of the roles of mean advection, larval behaviour and larval origin. Deep-
Sea Research II 41, 7-49.
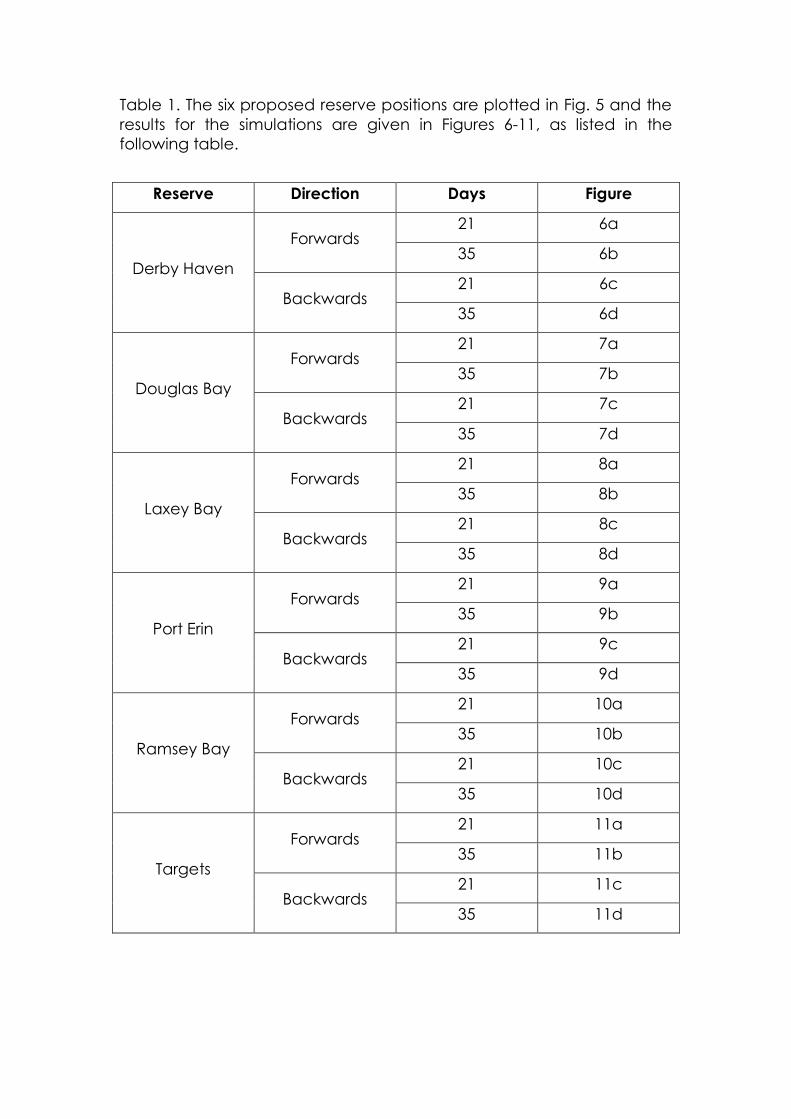
Table 1. The six proposed reserve positions are plotted in Fig. 5 and the
results for the simulations are given in Figures 6-11, as listed in the
following table.
Reserve Direction Days Figure
Derby Haven
Forwards 21 6a
35 6b
Backwards 21 6c
35 6d
Douglas Bay
Forwards 21 7a
35 7b
Backwards 21 7c
35 7d
Laxey Bay
Forwards 21 8a
35 8b
Backwards 21 8c
35 8d
Port Erin
Forwards 21 9a
35 9b
Backwards 21 9c
35 9d
Ramsey Bay
Forwards 21 10a
35 10b
Backwards 21 10c
35 10d
Targets
Forwards 21 11a
35 11b
Backwards 21 11c
35 11d

Figure 1. Model domain of northern Irish Sea.

Figure 2. Domain of outer model nest: northwest European continental
shelf. Also shown are the M2 tidal current ellipses at every tenth
modelled grid point.

Figure 3. Example of individual release scenarios from Ramsey Bay after
21 days of simulation.

Figure 4. 21 day forwards Ramsey Bay probability density plot derived
from the particle positions plotted in Fig. 3. Colour scale is percentage
probability.

Figure 5. Proposed reserve positions used for PTM.

Figure 6a. 21 day forwards Derby Haven probability density plot. Colour
scale is percentage probability.
Figure 6b. 35 day forwards Derby Haven probability density plot. Colour
scale is percentage probability.

Figure 6c. 21 day backwards Derby Haven probability density plot.
Colour scale is percentage probability.
Figure 6d. 35 day backwards Derby Haven probability density plot.
Colour scale is percentage probability.

Figure 7a. 21 day forwards Douglas Bay probability density plot. Colour
scale is percentage probability.
Figure 7b. 35 day forwards Douglas Bay probability density plot. Colour
scale is percentage probability.

Figure 7c. 21 day backwards Douglas Bay probability density plot.
Colour scale is percentage probability.
Figure 7d. 35 day backwards Douglas Bay probability density plot.
Colour scale is percentage probability.

Figure 8a. 21 day forwards Laxey Bay probability density plot. Colour
scale is percentage probability.
Figure 8b. 35 day forwards Laxey Bay probability density plot. Colour
scale is percentage probability.

Figure 8c. 21 day backwards Laxey Bay probability density plot. Colour
scale is percentage probability.
Figure 8d. 35 day backwards Laxey Bay probability density plot. Colour
scale is percentage probability.

Figure 9a. 21 day forwards Port Erin probability density plot. Colour
scale is percentage probability.
Figure 9b. 35 day forwards Port Erin probability density plot. Colour
scale is percentage probability.

Figure 9c. 21 day backwards Port Erin probability density plot. Colour
scale is percentage probability.
Figure 9d. 35 day backwards Port Erin probability density plot. Colour
scale is percentage probability.

Figure 10a. 21 day forwards Ramsey Bay probability density plot. Colour
scale is percentage probability.
Figure 10b. 35 day forwards Ramsey Bay probability density plot. Colour
scale is percentage probability.

Figure 10c. 21 day backwards Ramsey Bay probability density plot.
Colour scale is percentage probability.
Figure 10d. 35 day backwards Ramsey Bay probability density plot.
Colour scale is percentage probability.

Figure 11a. 21 day forwards Targets probability density plot. Colour
scale is percentage probability.
Figure 11b. 35 day forwards Targets probability density plot. Colour
scale is percentage probability.

Figure 11c. 21 day backwards Targets probability density plot. Colour
scale is percentage probability.
Figure 11d. 35 day backwards Targets probability density plot. Colour
scale is percentage probability.