SOURCE WATER PROTECTION PROGRAM WATER PROTECTION PROGRAM ASSESSMENT/PLANNING PROJECT FINAL REPORT...
94
SOURCE WATER PROTECTION PROGRAM ASSESSMENT/PLANNING PROJECT FINAL REPORT Bayou Lafourche Fecal Coliform Sources by Marilyn B. Kilgen, Ph.D. (P.I.) Department of Biological Sciences Balaji Ramachandran, Ph.D. (Co-P.I.) Department of Applied Sciences, Geomatics Program Angela L. Corbin, M.S. (Co-P.I.) Department of Biological Sciences Sam Wise, B.S. (M.S. candidate) Department of Biological Sciences Nicholls State University 906 East First Street Thibodaux, LA 70310 Submitted to: Louisiana Department of Environmental Quality Office of Environmental Assessment P.O. Box 4314 Baton Rouge, LA 70821-4314 September 30, 2009 This project was conducted in cooperation with the State of Louisiana and the United States Environmental Protection Agency, Region 6. CFMS Interagency Agreement No. 658936 OCR Interagency Agreement No. 853 800283
-
Upload
vuongduong -
Category
Documents
-
view
217 -
download
1
Transcript of SOURCE WATER PROTECTION PROGRAM WATER PROTECTION PROGRAM ASSESSMENT/PLANNING PROJECT FINAL REPORT...

SOURCE WATER PROTECTION PROGRAM ASSESSMENT/PLANNING PROJECT FINAL REPORT
Bayou Lafourche Fecal Coliform Sources
by
Marilyn B. Kilgen, Ph.D. (P.I.) Department of Biological Sciences
Balaji Ramachandran, Ph.D. (Co-P.I.)
Department of Applied Sciences, Geomatics Program
Angela L. Corbin, M.S. (Co-P.I.) Department of Biological Sciences
Sam Wise, B.S. (M.S. candidate)
Department of Biological Sciences
Nicholls State University 906 East First Street Thibodaux, LA 70310
Submitted to: Louisiana Department of Environmental Quality
Office of Environmental Assessment P.O. Box 4314
Baton Rouge, LA 70821-4314
September 30, 2009
This project was conducted in cooperation with the State of Louisiana and the United States Environmental Protection Agency, Region 6.
CFMS Interagency Agreement No. 658936 OCR Interagency Agreement No. 853 800283
2
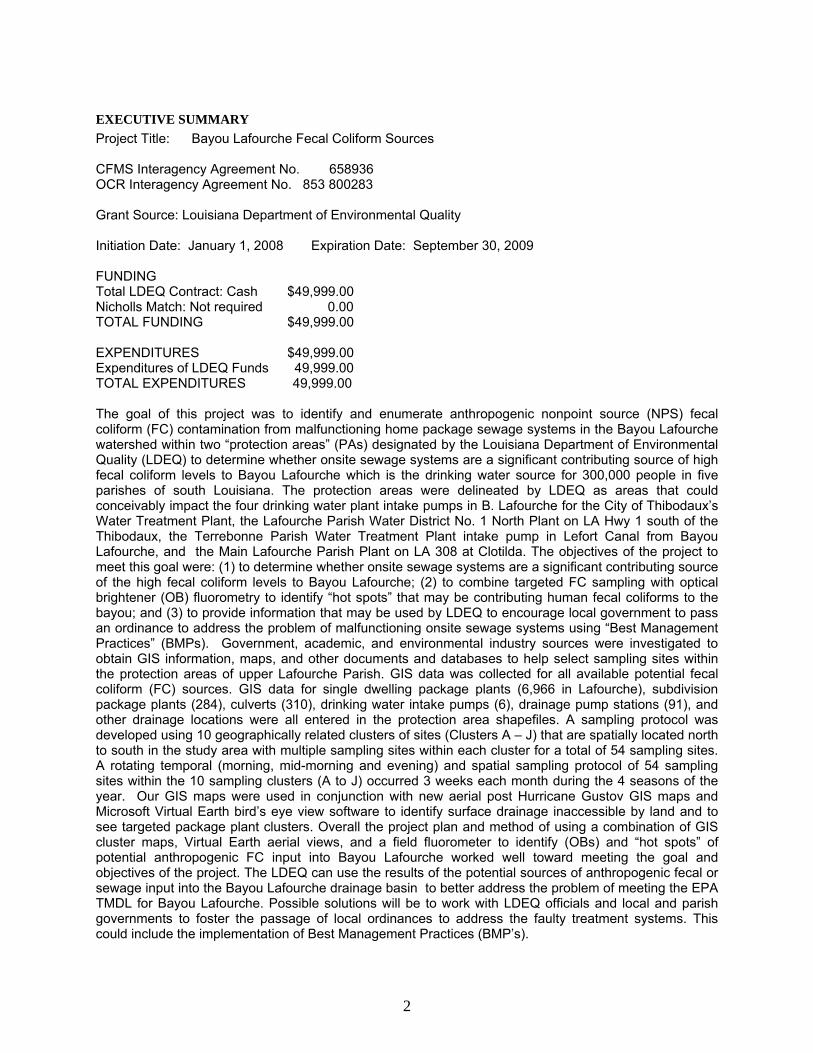
EXECUTIVE SUMMARY Project Title: Bayou Lafourche Fecal Coliform Sources CFMS Interagency Agreement No. 658936 OCR Interagency Agreement No. 853 800283 Grant Source: Louisiana Department of Environmental Quality Initiation Date: January 1, 2008 Expiration Date: September 30, 2009 FUNDING Total LDEQ Contract: Cash $49,999.00 Nicholls Match: Not required 0.00 TOTAL FUNDING $49,999.00 EXPENDITURES $49,999.00 Expenditures of LDEQ Funds 49,999.00 TOTAL EXPENDITURES 49,999.00 The goal of this project was to identify and enumerate anthropogenic nonpoint source (NPS) fecal coliform (FC) contamination from malfunctioning home package sewage systems in the Bayou Lafourche watershed within two “protection areas” (PAs) designated by the Louisiana Department of Environmental Quality (LDEQ) to determine whether onsite sewage systems are a significant contributing source of high fecal coliform levels to Bayou Lafourche which is the drinking water source for 300,000 people in five parishes of south Louisiana. The protection areas were delineated by LDEQ as areas that could conceivably impact the four drinking water plant intake pumps in B. Lafourche for the City of Thibodaux’s Water Treatment Plant, the Lafourche Parish Water District No. 1 North Plant on LA Hwy 1 south of the Thibodaux, the Terrebonne Parish Water Treatment Plant intake pump in Lefort Canal from Bayou Lafourche, and the Main Lafourche Parish Plant on LA 308 at Clotilda. The objectives of the project to meet this goal were: (1) to determine whether onsite sewage systems are a significant contributing source of the high fecal coliform levels to Bayou Lafourche; (2) to combine targeted FC sampling with optical brightener (OB) fluorometry to identify “hot spots” that may be contributing human fecal coliforms to the bayou; and (3) to provide information that may be used by LDEQ to encourage local government to pass an ordinance to address the problem of malfunctioning onsite sewage systems using “Best Management Practices” (BMPs). Government, academic, and environmental industry sources were investigated to obtain GIS information, maps, and other documents and databases to help select sampling sites within the protection areas of upper Lafourche Parish. GIS data was collected for all available potential fecal coliform (FC) sources. GIS data for single dwelling package plants (6,966 in Lafourche), subdivision package plants (284), culverts (310), drinking water intake pumps (6), drainage pump stations (91), and other drainage locations were all entered in the protection area shapefiles. A sampling protocol was developed using 10 geographically related clusters of sites (Clusters A – J) that are spatially located north to south in the study area with multiple sampling sites within each cluster for a total of 54 sampling sites. A rotating temporal (morning, mid-morning and evening) and spatial sampling protocol of 54 sampling sites within the 10 sampling clusters (A to J) occurred 3 weeks each month during the 4 seasons of the year. Our GIS maps were used in conjunction with new aerial post Hurricane Gustov GIS maps and Microsoft Virtual Earth bird’s eye view software to identify surface drainage inaccessible by land and to see targeted package plant clusters. Overall the project plan and method of using a combination of GIS cluster maps, Virtual Earth aerial views, and a field fluorometer to identify (OBs) and “hot spots” of potential anthropogenic FC input into Bayou Lafourche worked well toward meeting the goal and objectives of the project. The LDEQ can use the results of the potential sources of anthropogenic fecal or sewage input into the Bayou Lafourche drainage basin to better address the problem of meeting the EPA TMDL for Bayou Lafourche. Possible solutions will be to work with LDEQ officials and local and parish governments to foster the passage of local ordinances to address the faulty treatment systems. This could include the implementation of Best Management Practices (BMP’s).
3
TABLE OF CONTENTS EXECUTIVE SUMMARY .............................................................................................................................. 2
LIST OF TABLES......................................................................................................................................... 4
LIST OF FIGURES ....................................................................................................................................... 4
1.0 INTRODUCTION .................................................................................................................................... 5 2.0 PROJECT GOALS, OBJECTIVES, AND ACTIVITIES ....................................................................... 10
2.1 PLANNED AND ACTUAL MILESTONES, PRODUCTS, AND COMPLETION DATES..........19 2.2 EVALUATION OF GOAL ACHIEVEMENT AND RELATIONSHIP TO THE STATE NPS MANAGEMENT PLAN..............................................................................................................19 2.3 SUPPLEMENTAL INFORMATION...........................................................................................19
3.0 MONITORING RESULTS..................................................................................................................... 20
4.0 PUBLIC INVOLVEMENT AND COORDINATION ............................................................................... 92
4.1 STATE AGENCIES ...................................................................................................................92 4.2 FEDERAL AGENCIES..............................................................................................................93 4.3 LOCAL GOVERNMENTS, INDUSTRY, ENVIRONMENTAL AND OTHER GROUPS, PUBLIC- AT- LARGE................................................................................................................93 4.4 OTHER SOURCES OF FUNDS................................................................................................94
5.0 ASPECTS OF THE PROJECT THAT DID NOT WORK WELL .......................................................... 94
6.0 FUTURE ACTIVITY RECOMMENDATIONS ....................................................................................... 94
7.0 BIBLIOGRAPHY: ................................................................................................................................. 95

4
LIST OF TABLES Table 1. Decision process for evaluating use support, showing measured parameters for each designated use; Louisiana’s 2004 Integrated Report. (LDEQ, 2004) .....................................................7 Table 2. Fecal coliform TMDL for Bayou Lafourche (subsegment 020401) (EPA 2004) ......................9 Table 4. Laboratory Measurement Performance Criteria......................................................................18 Table 5. Sampling Results and Designated Use Impacts from Fecal Coliforms and OBs ................21 Table 6. Preliminary Optical Brightener UV Degradation Study of the J Cluster site........................91
LIST OF FIGURES Figure 1. Location of Bayou Lafourche in the Barataria Terrebonne National Estuary…………….5 Figure 2. Project study area …………………………………………………………………………………10 Figure 3. Single Dwelling Sewage Treatment Package Plants, Drinking Water Treatment Intake Pumps, LDEQ Report Locations, and Subdivision Package Plants in the Study Area……………………………………………………………………………………12 Figure 4. GIS Locations of the Drainage Culverts and an LDEQ Report of Drainage Emptying into the Study Area, and Drinking Water Treatment Intake Pumps ………….12 Figure 5. Study area with the 10 Clusters of sites (Clusters A – J) and the 54 final sampling sites within these 10 Clusters………………………………………………….15 Figure 6. Protection Areas 1 and 2 showing the 10 Site Clusters (A-J) and 54 total sampling sites in those Clusters………………………………………………………………...16 Figure 7. The A Site Cluster – A1, Bayou Lafourche bridge at HWY 398 Labadieville…………….57 Figure 8. The B Site Cluster – B1, B2, B3, B4……………………………………………………………..59 Figure 9. The C Site Cluster – C1, C2, C3, C4, C5, C6, C7……………………………………………….63 Figure10. The D Site Cluster – D1, D2, D3, D4, D5, D6……………………………………………………67 Figure 11. The E Site Cluster – E1, E2, E3, E4, E5...............................................................................69 Figure 12. Cluster F, Sites F1, F2, F3, F5, F6……………………………………………………………….72 Figure 13. The G Site Cluster –G1, G2, G3, G5……………………………………………………………..74 Figure 14. The H Site Cluster –H1, H2, H4, H5, H6...............................................................................76 Figure 15. The I Site Cluster – I1, I2, I3, I4, I5, I6..................................................................................78 Figure 16. The J Site Cluster – J1, J1a, J2, J3, J4, J5, J6, J6a, J7, J8, J9…………………………….81
5
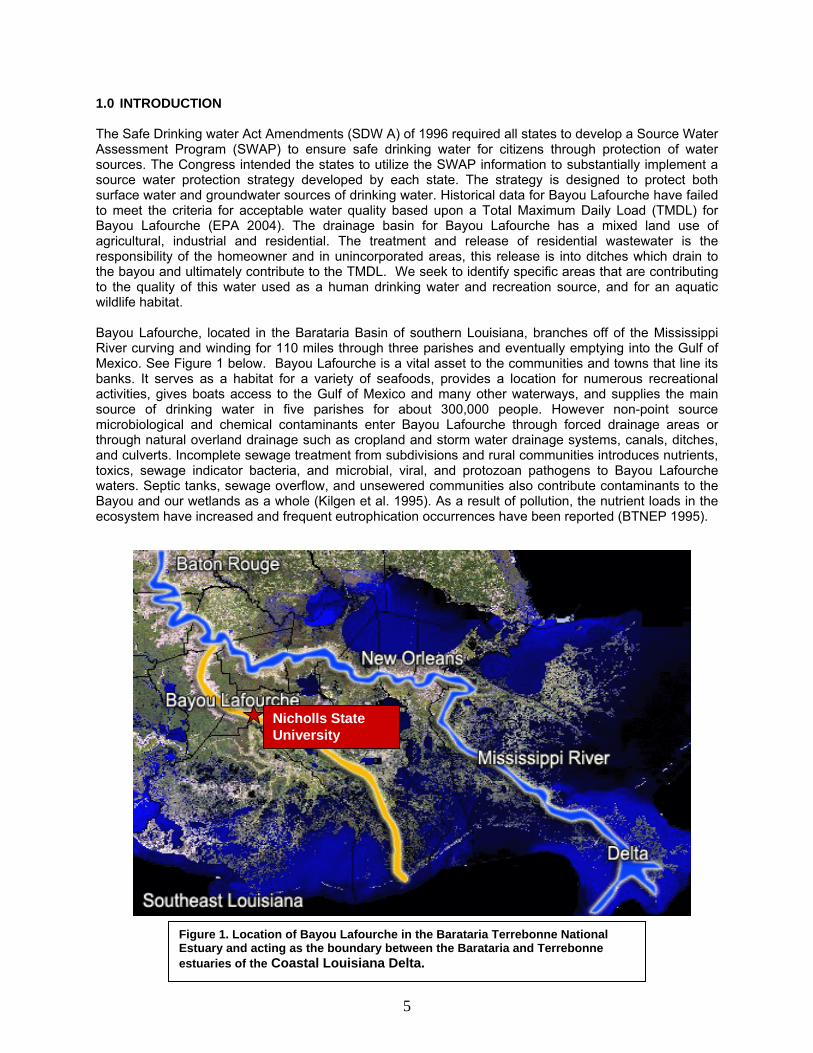
1.0 INTRODUCTION The Safe Drinking water Act Amendments (SDW A) of 1996 required all states to develop a Source Water Assessment Program (SWAP) to ensure safe drinking water for citizens through protection of water sources. The Congress intended the states to utilize the SWAP information to substantially implement a source water protection strategy developed by each state. The strategy is designed to protect both surface water and groundwater sources of drinking water. Historical data for Bayou Lafourche have failed to meet the criteria for acceptable water quality based upon a Total Maximum Daily Load (TMDL) for Bayou Lafourche (EPA 2004). The drainage basin for Bayou Lafourche has a mixed land use of agricultural, industrial and residential. The treatment and release of residential wastewater is the responsibility of the homeowner and in unincorporated areas, this release is into ditches which drain to the bayou and ultimately contribute to the TMDL. We seek to identify specific areas that are contributing to the quality of this water used as a human drinking water and recreation source, and for an aquatic wildlife habitat. Bayou Lafourche, located in the Barataria Basin of southern Louisiana, branches off of the Mississippi River curving and winding for 110 miles through three parishes and eventually emptying into the Gulf of Mexico. See Figure 1 below. Bayou Lafourche is a vital asset to the communities and towns that line its banks. It serves as a habitat for a variety of seafoods, provides a location for numerous recreational activities, gives boats access to the Gulf of Mexico and many other waterways, and supplies the main source of drinking water in five parishes for about 300,000 people. However non-point source microbiological and chemical contaminants enter Bayou Lafourche through forced drainage areas or through natural overland drainage such as cropland and storm water drainage systems, canals, ditches, and culverts. Incomplete sewage treatment from subdivisions and rural communities introduces nutrients, toxics, sewage indicator bacteria, and microbial, viral, and protozoan pathogens to Bayou Lafourche waters. Septic tanks, sewage overflow, and unsewered communities also contribute contaminants to the Bayou and our wetlands as a whole (Kilgen et al. 1995). As a result of pollution, the nutrient loads in the ecosystem have increased and frequent eutrophication occurrences have been reported (BTNEP 1995).
Nicholls State University
Figure 1. Location of Bayou Lafourche in the Barataria Terrebonne National Estuary and acting as the boundary between the Barataria and Terrebonne estuaries of the Coastal Louisiana Delta.

6
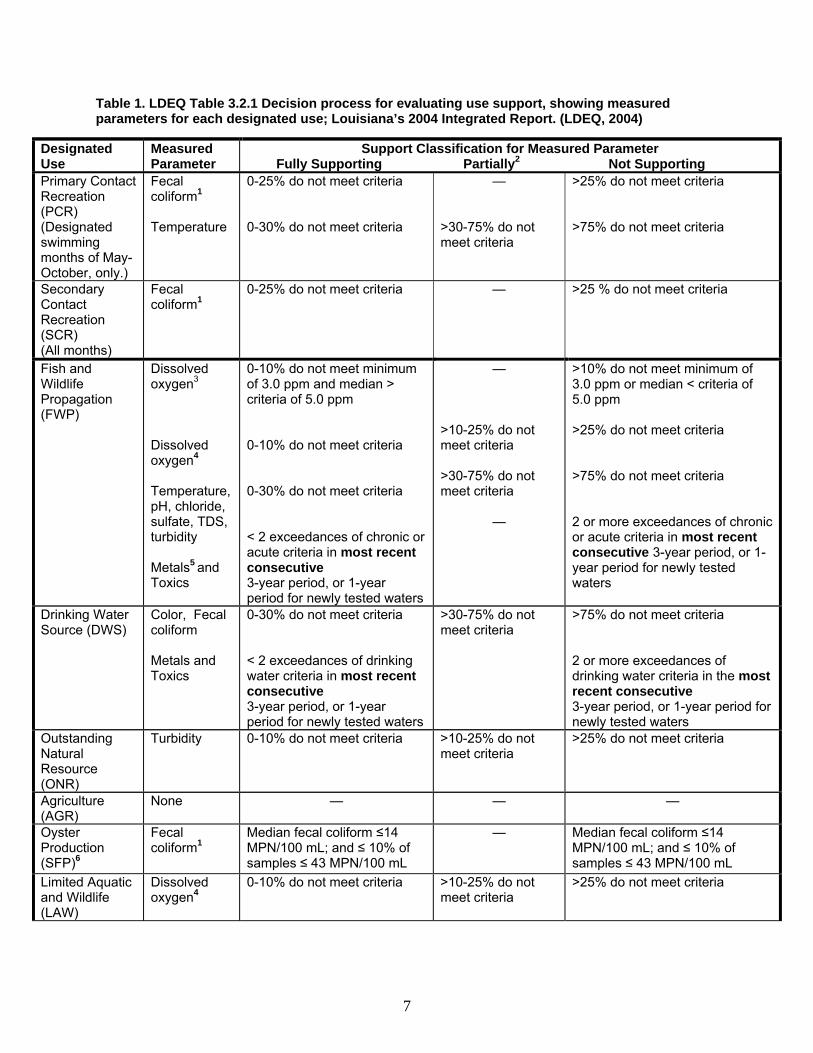
The Federal Clean Water Act requires all states to identify those bodies of water that are not meeting their designated water quality standards and to develop total maximum daily pollutant loads (TMDL) for those water bodies. A TMDL is the maximum amount of pollutant that a water body can assimilate without exceeding the established water quality standard for that pollutant (EPA 2004). The State of Louisiana’s Department of Environmental Quality (LDEQ) sets designated use water quality standards for its bodies of water. These include microbial fecal coliform (FC) standards for drinking water supply, primary contact recreation, secondary contact recreation, oyster propagation and harvesting, and fish and wildlife propagation (dissolved oxygen). These water quality standards are: 1)drinking water supply (monthly arithmetic mean cannot exceed 2,000 MPN fecal coliforms (FC) /100mL); 2) primary contact recreation - swimming (cannot exceed log mean of 200 MPN FC/100mL, with minimum of 5 samples in 30 days for LDHH; or 25% of samples collected annually cannot exceed 400 MPN FC/100mL for LDEQ, with the criteria for secondary contact recreation to apply during the non- primary recreational period of November 1 through April 30); 3) secondary contact recreation - boating/fishing cannot exceed log mean of 1000 MPN FC/100mL, with minimum of 5 samples in 30 days for LDHH; or 25% of samples collected annually cannot exceed 2000 MPN FC/100mL for LDEQ); 4) oyster harvesting waters (14 median MPN FC/100mL, with not more than 10% of samples exceeding 43 MPN/100mL); and 5) dissolved oxygen (DO) criteria for fish and wildlife propagation (5 mg/L DO for fresh water and 4 mg/L for estuarine water). (LDEQ 2004). No designated standards for BOD are cited by LDEQ, however, the average normal BOD in surface fresh and estuarine waters should be less than 15 mg/L. Table 1 below is taken from the State of Louisiana Water Quality Management Plan Water Quality Inventory Integrated Report (Section 305(b) 2004 Report) (LDEQ 2004). It summarizes the designated uses, standards, and the percentage of water bodies meeting these standards.
7
Table 1. LDEQ Table 3.2.1 Decision process for evaluating use support, showing measured parameters for each designated use; Louisiana’s 2004 Integrated Report. (LDEQ, 2004)
Designated Use
Measured Parameter
Support Classification for Measured Parameter Fully Supporting Partially2 Not Supporting
Primary Contact Recreation (PCR) (Designated swimming months of May-October, only.)
Fecal coliform1
Temperature
0-25% do not meet criteria 0-30% do not meet criteria
— >30-75% do not meet criteria
>25% do not meet criteria >75% do not meet criteria
Secondary Contact Recreation (SCR) (All months)
Fecal coliform1
0-25% do not meet criteria —
>25 % do not meet criteria
Fish and Wildlife Propagation (FWP)
Dissolved oxygen3 Dissolved oxygen4 Temperature, pH, chloride, sulfate, TDS, turbidity Metals5 and Toxics
0-10% do not meet minimum of 3.0 ppm and median > criteria of 5.0 ppm 0-10% do not meet criteria 0-30% do not meet criteria < 2 exceedances of chronic or acute criteria in most recent consecutive 3-year period, or 1-year period for newly tested waters
— >10-25% do not meet criteria >30-75% do not meet criteria
—
>10% do not meet minimum of 3.0 ppm or median < criteria of 5.0 ppm >25% do not meet criteria >75% do not meet criteria 2 or more exceedances of chronic or acute criteria in most recent consecutive 3-year period, or 1-year period for newly tested waters
Drinking Water Source (DWS)
Color, Fecal coliform Metals and Toxics
0-30% do not meet criteria < 2 exceedances of drinking water criteria in most recent consecutive 3-year period, or 1-year period for newly tested waters
>30-75% do not meet criteria
>75% do not meet criteria 2 or more exceedances of drinking water criteria in the most recent consecutive 3-year period, or 1-year period for newly tested waters
Outstanding Natural Resource (ONR)
Turbidity 0-10% do not meet criteria >10-25% do not meet criteria
>25% do not meet criteria
Agriculture (AGR)
None —
—
—
Oyster Production (SFP)6
Fecal coliform1
Median fecal coliform ≤14 MPN/100 mL; and ≤ 10% of samples ≤ 43 MPN/100 mL
—
Median fecal coliform ≤14 MPN/100 mL; and ≤ 10% of samples ≤ 43 MPN/100 mL
Limited Aquatic and Wildlife (LAW)
Dissolved oxygen4
0-10% do not meet criteria >10-25% do not meet criteria
>25% do not meet criteria
8
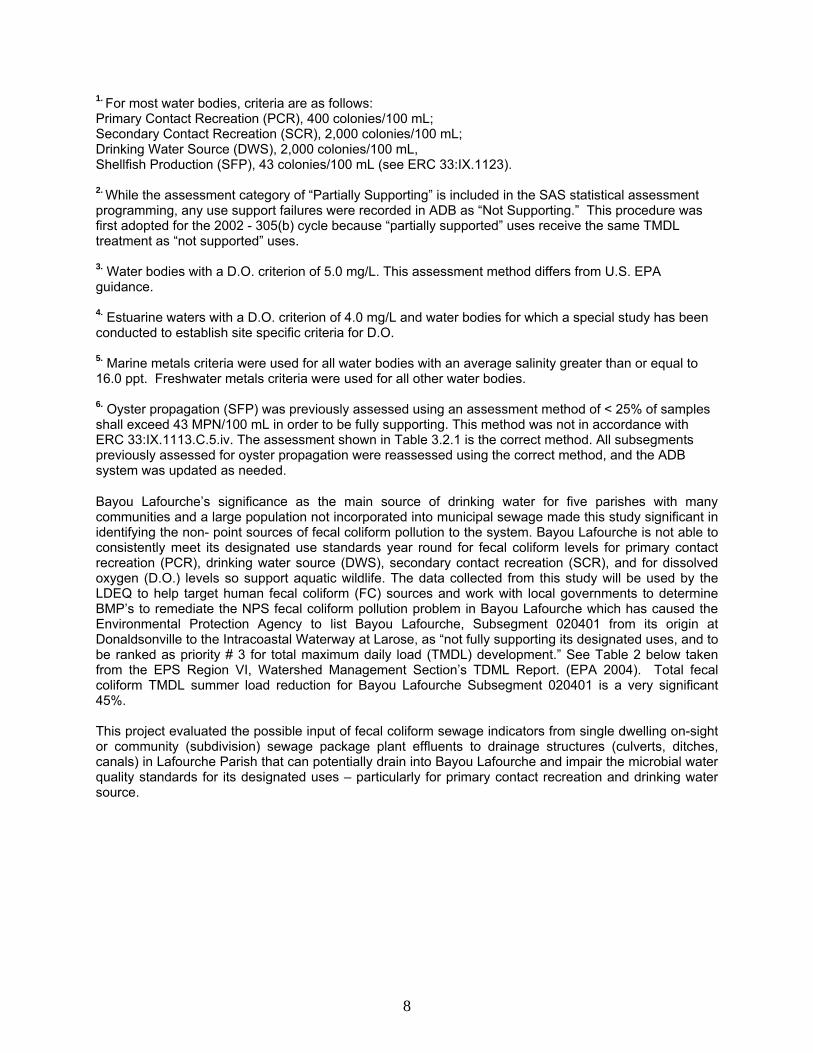
1. For most water bodies, criteria are as follows: Primary Contact Recreation (PCR), 400 colonies/100 mL; Secondary Contact Recreation (SCR), 2,000 colonies/100 mL; Drinking Water Source (DWS), 2,000 colonies/100 mL, Shellfish Production (SFP), 43 colonies/100 mL (see ERC 33:IX.1123).
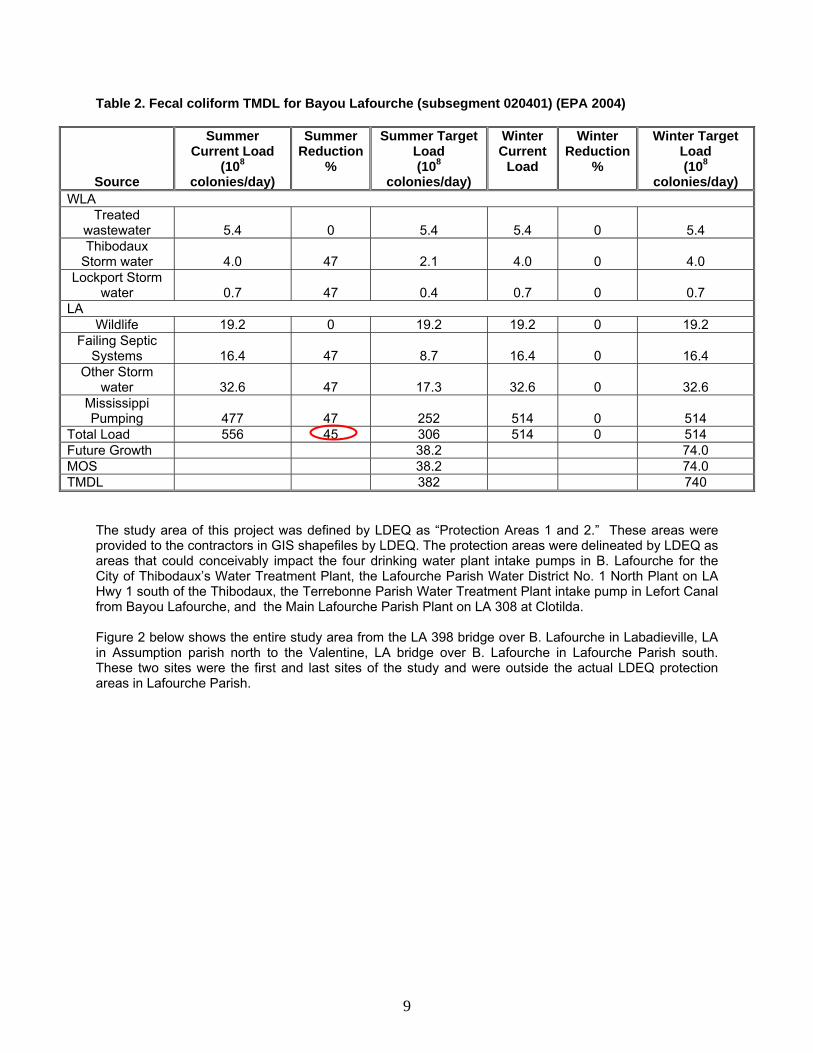
2. While the assessment category of “Partially Supporting” is included in the SAS statistical assessment programming, any use support failures were recorded in ADB as “Not Supporting.” This procedure was first adopted for the 2002 - 305(b) cycle because “partially supported” uses receive the same TMDL treatment as “not supported” uses. 3. Water bodies with a D.O. criterion of 5.0 mg/L. This assessment method differs from U.S. EPA guidance. 4. Estuarine waters with a D.O. criterion of 4.0 mg/L and water bodies for which a special study has been conducted to establish site specific criteria for D.O. 5. Marine metals criteria were used for all water bodies with an average salinity greater than or equal to 16.0 ppt. Freshwater metals criteria were used for all other water bodies. 6. Oyster propagation (SFP) was previously assessed using an assessment method of < 25% of samples shall exceed 43 MPN/100 mL in order to be fully supporting. This method was not in accordance with ERC 33:IX.1113.C.5.iv. The assessment shown in Table 3.2.1 is the correct method. All subsegments previously assessed for oyster propagation were reassessed using the correct method, and the ADB system was updated as needed. Bayou Lafourche’s significance as the main source of drinking water for five parishes with many communities and a large population not incorporated into municipal sewage made this study significant in identifying the non- point sources of fecal coliform pollution to the system. Bayou Lafourche is not able to consistently meet its designated use standards year round for fecal coliform levels for primary contact recreation (PCR), drinking water source (DWS), secondary contact recreation (SCR), and for dissolved oxygen (D.O.) levels so support aquatic wildlife. The data collected from this study will be used by the LDEQ to help target human fecal coliform (FC) sources and work with local governments to determine BMP’s to remediate the NPS fecal coliform pollution problem in Bayou Lafourche which has caused the Environmental Protection Agency to list Bayou Lafourche, Subsegment 020401 from its origin at Donaldsonville to the Intracoastal Waterway at Larose, as “not fully supporting its designated uses, and to be ranked as priority # 3 for total maximum daily load (TMDL) development.” See Table 2 below taken from the EPS Region VI, Watershed Management Section’s TDML Report. (EPA 2004). Total fecal coliform TMDL summer load reduction for Bayou Lafourche Subsegment 020401 is a very significant 45%. This project evaluated the possible input of fecal coliform sewage indicators from single dwelling on-sight or community (subdivision) sewage package plant effluents to drainage structures (culverts, ditches, canals) in Lafourche Parish that can potentially drain into Bayou Lafourche and impair the microbial water quality standards for its designated uses – particularly for primary contact recreation and drinking water source.
9
Table 2. Fecal coliform TMDL for Bayou Lafourche (subsegment 020401) (EPA 2004)
Source
Summer Current Load
(108 colonies/day)
Summer Reduction
%
Summer Target Load (108
colonies/day)
Winter Current
Load
Winter Reduction
%
Winter Target Load (108
colonies/day) WLA
Treated wastewater 5.4 0 5.4 5.4 0 5.4 Thibodaux
Storm water 4.0 47 2.1 4.0 0 4.0 Lockport Storm
water 0.7 47 0.4 0.7 0 0.7 LA
Wildlife 19.2 0 19.2 19.2 0 19.2 Failing Septic
Systems 16.4 47 8.7 16.4 0 16.4 Other Storm
water 32.6 47 17.3 32.6 0 32.6 Mississippi Pumping 477 47 252 514 0 514
Total Load 556 45 306 514 0 514 Future Growth 38.2 74.0 MOS 38.2 74.0 TMDL 382 740
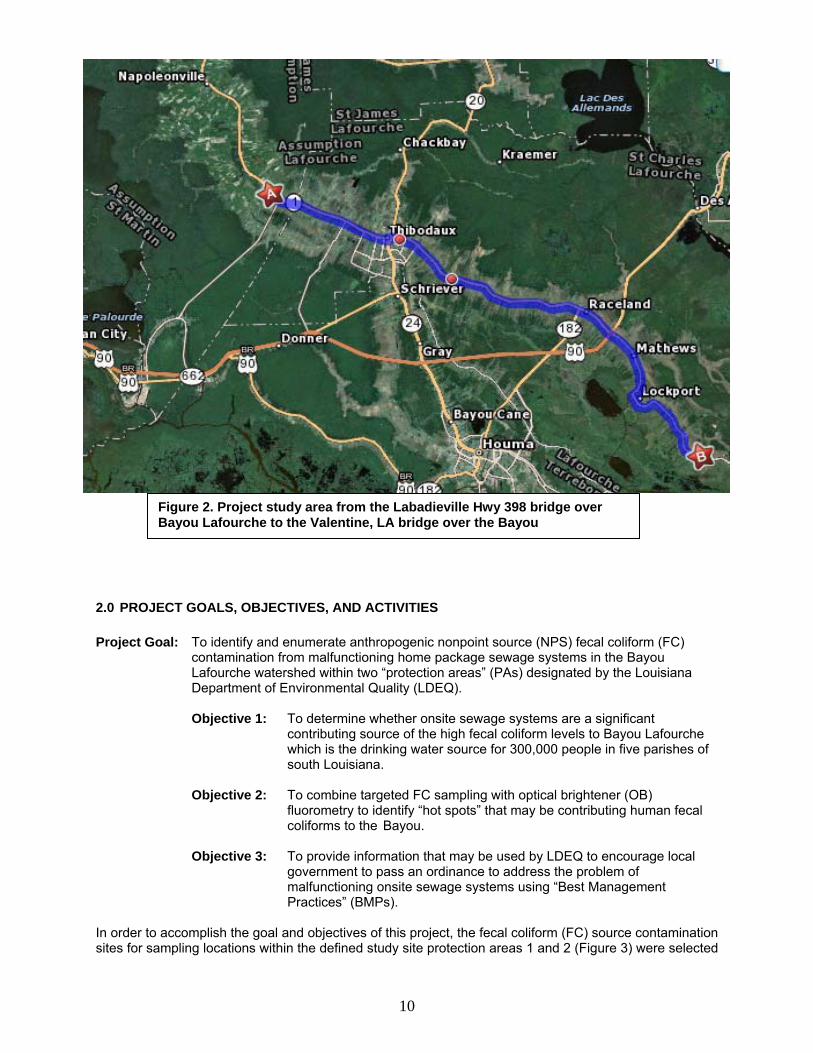
The study area of this project was defined by LDEQ as “Protection Areas 1 and 2.” These areas were provided to the contractors in GIS shapefiles by LDEQ. The protection areas were delineated by LDEQ as areas that could conceivably impact the four drinking water plant intake pumps in B. Lafourche for the City of Thibodaux’s Water Treatment Plant, the Lafourche Parish Water District No. 1 North Plant on LA Hwy 1 south of the Thibodaux, the Terrebonne Parish Water Treatment Plant intake pump in Lefort Canal from Bayou Lafourche, and the Main Lafourche Parish Plant on LA 308 at Clotilda. Figure 2 below shows the entire study area from the LA 398 bridge over B. Lafourche in Labadieville, LA in Assumption parish north to the Valentine, LA bridge over B. Lafourche in Lafourche Parish south. These two sites were the first and last sites of the study and were outside the actual LDEQ protection areas in Lafourche Parish.
10
2.0 PROJECT GOALS, OBJECTIVES, AND ACTIVITIES Project Goal: To identify and enumerate anthropogenic nonpoint source (NPS) fecal coliform (FC) contamination from malfunctioning home package sewage systems in the Bayou Lafourche watershed within two “protection areas” (PAs) designated by the Louisiana Department of Environmental Quality (LDEQ). Objective 1: To determine whether onsite sewage systems are a significant contributing source of the high fecal coliform levels to Bayou Lafourche which is the drinking water source for 300,000 people in five parishes of south Louisiana. Objective 2: To combine targeted FC sampling with optical brightener (OB) fluorometry to identify “hot spots” that may be contributing human fecal coliforms to the Bayou. Objective 3: To provide information that may be used by LDEQ to encourage local government to pass an ordinance to address the problem of malfunctioning onsite sewage systems using “Best Management Practices” (BMPs). In order to accomplish the goal and objectives of this project, the fecal coliform (FC) source contamination sites for sampling locations within the defined study site protection areas 1 and 2 (Figure 3) were selected
Figure 2. Project study area from the Labadieville Hwy 398 bridge over Bayou Lafourche to the Valentine, LA bridge over the Bayou

11
through a process of researching as much background information and data from previous work in the area that was available. The P.I.’s met first with LDEQ officials who provided a map and GIS shape files delineating Protection Areas 1 and 2 in the northern Subsegment 020401 of the Bayou Lafourche drainage basin. The P.I.’s then met with officials of the Bayou Lafourche Fresh Water District, State, Parish, City, and other local government officials, and also private environmental company sources to obtain information and possible maps, blueprints, or other documents to help in determining the best sampling locations within the LDEQ designated protection areas that indicated sources of drainage to the culverts, ditches, and canals emptying directly into the Bayou. GIS data that was collected for all available potential fecal coliform (FC) sources included data for single dwelling package plants (6,966 in Lafourche), subdivision package plants (284), culverts (310), drinking water intake pumps (6), drainage pump stations (91), and other drainage locations were all entered in the protection area shapefiles. GIS maps with all of this information (Figures 3 and 4) were used in conjunction with Microsoft Virtual Earth bird’s eye view software and recently new post Hurricane Gustov GIS aerial maps to identify surface drainage inaccessible by land and to see targeted package plant clusters. Although sites within the protection areas are a higher priority, one site (A1) was above the study protection area 1. It was in Assumption Parish (Labadieville) and was selected for potential impact to the protection area downstream. The last site (J9) was also out of Protection Area 2 at the Valentine Bridge, near the old Valentine Sugar Mill, but was selected to determine the potential downstream impact of the subdivision cluster south of Lockport (sites J5-J9) that had culverts emptying into the Bayou which drained the front of this subdivision and also had large ditches and side canals draining back to the 40 Arpent Canal which is connected to the Company Canal that exerts a direct impact on Bayou Lafourche.
12
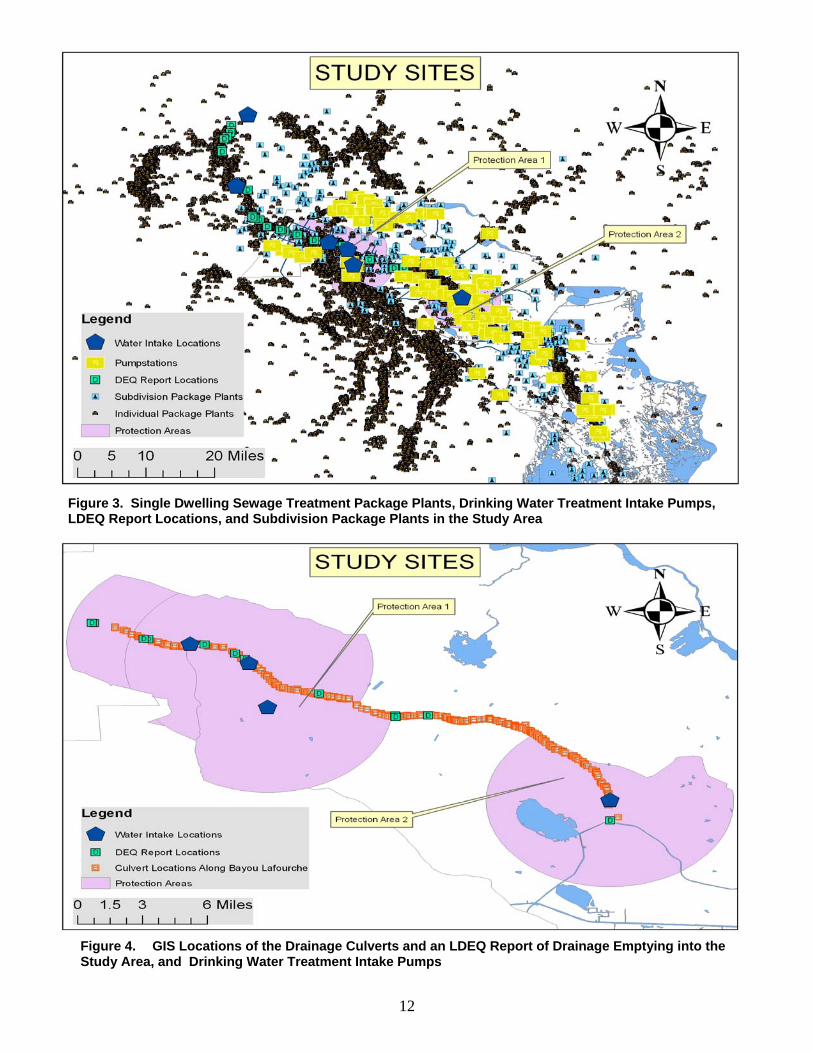
Figure 3. Single Dwelling Sewage Treatment Package Plants, Drinking Water Treatment Intake Pumps, LDEQ Report Locations, and Subdivision Package Plants in the Study Area
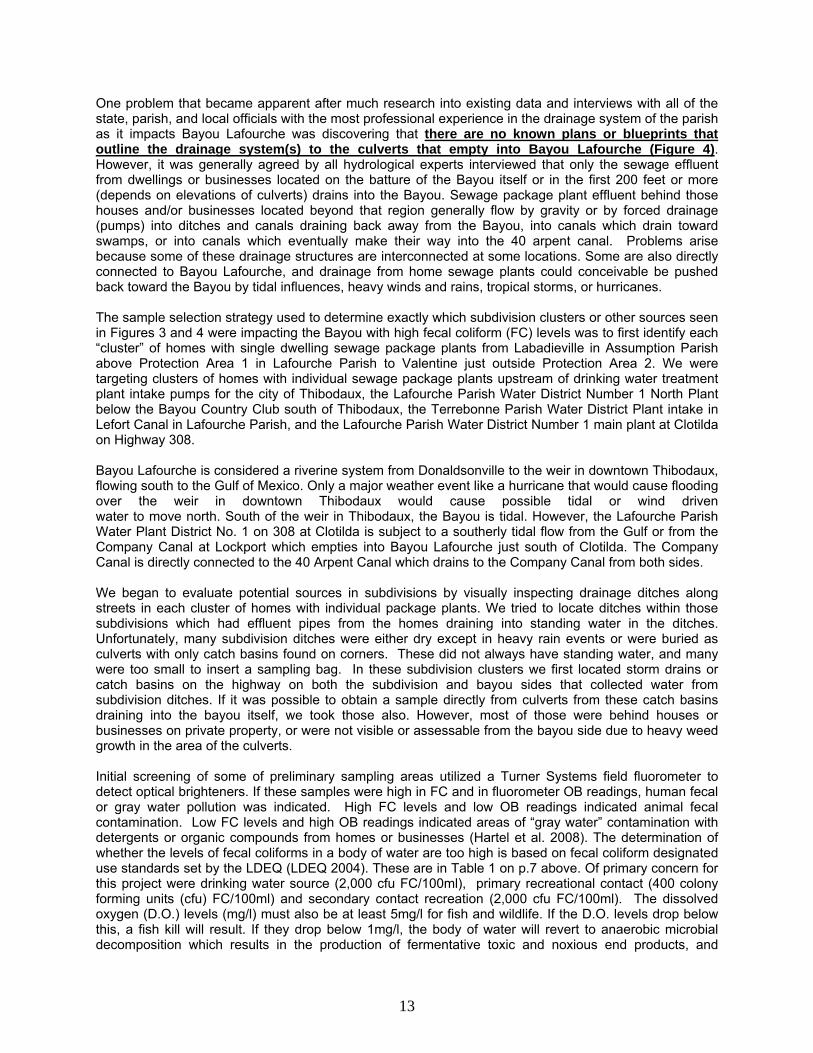
Figure 4. GIS Locations of the Drainage Culverts and an LDEQ Report of Drainage Emptying into the Study Area, and Drinking Water Treatment Intake Pumps
13
One problem that became apparent after much research into existing data and interviews with all of the state, parish, and local officials with the most professional experience in the drainage system of the parish as it impacts Bayou Lafourche was discovering that there are no known plans or blueprints that outline the drainage system(s) to the culverts that empty into Bayou Lafourche (Figure 4). However, it was generally agreed by all hydrological experts interviewed that only the sewage effluent from dwellings or businesses located on the batture of the Bayou itself or in the first 200 feet or more (depends on elevations of culverts) drains into the Bayou. Sewage package plant effluent behind those houses and/or businesses located beyond that region generally flow by gravity or by forced drainage (pumps) into ditches and canals draining back away from the Bayou, into canals which drain toward swamps, or into canals which eventually make their way into the 40 arpent canal. Problems arise because some of these drainage structures are interconnected at some locations. Some are also directly connected to Bayou Lafourche, and drainage from home sewage plants could conceivable be pushed back toward the Bayou by tidal influences, heavy winds and rains, tropical storms, or hurricanes. The sample selection strategy used to determine exactly which subdivision clusters or other sources seen in Figures 3 and 4 were impacting the Bayou with high fecal coliform (FC) levels was to first identify each “cluster” of homes with single dwelling sewage package plants from Labadieville in Assumption Parish above Protection Area 1 in Lafourche Parish to Valentine just outside Protection Area 2. We were targeting clusters of homes with individual sewage package plants upstream of drinking water treatment plant intake pumps for the city of Thibodaux, the Lafourche Parish Water District Number 1 North Plant below the Bayou Country Club south of Thibodaux, the Terrebonne Parish Water District Plant intake in Lefort Canal in Lafourche Parish, and the Lafourche Parish Water District Number 1 main plant at Clotilda on Highway 308. Bayou Lafourche is considered a riverine system from Donaldsonville to the weir in downtown Thibodaux, flowing south to the Gulf of Mexico. Only a major weather event like a hurricane that would cause flooding over the weir in downtown Thibodaux would cause possible tidal or wind driven water to move north. South of the weir in Thibodaux, the Bayou is tidal. However, the Lafourche Parish Water Plant District No. 1 on 308 at Clotilda is subject to a southerly tidal flow from the Gulf or from the Company Canal at Lockport which empties into Bayou Lafourche just south of Clotilda. The Company Canal is directly connected to the 40 Arpent Canal which drains to the Company Canal from both sides. We began to evaluate potential sources in subdivisions by visually inspecting drainage ditches along streets in each cluster of homes with individual package plants. We tried to locate ditches within those subdivisions which had effluent pipes from the homes draining into standing water in the ditches. Unfortunately, many subdivision ditches were either dry except in heavy rain events or were buried as culverts with only catch basins found on corners. These did not always have standing water, and many were too small to insert a sampling bag. In these subdivision clusters we first located storm drains or catch basins on the highway on both the subdivision and bayou sides that collected water from subdivision ditches. If it was possible to obtain a sample directly from culverts from these catch basins draining into the bayou itself, we took those also. However, most of those were behind houses or businesses on private property, or were not visible or assessable from the bayou side due to heavy weed growth in the area of the culverts. Initial screening of some of preliminary sampling areas utilized a Turner Systems field fluorometer to detect optical brighteners. If these samples were high in FC and in fluorometer OB readings, human fecal or gray water pollution was indicated. High FC levels and low OB readings indicated animal fecal contamination. Low FC levels and high OB readings indicated areas of “gray water” contamination with detergents or organic compounds from homes or businesses (Hartel et al. 2008). The determination of whether the levels of fecal coliforms in a body of water are too high is based on fecal coliform designated use standards set by the LDEQ (LDEQ 2004). These are in Table 1 on p.7 above. Of primary concern for this project were drinking water source (2,000 cfu FC/100ml), primary recreational contact (400 colony forming units (cfu) FC/100ml) and secondary contact recreation (2,000 cfu FC/100ml). The dissolved oxygen (D.O.) levels (mg/l) must also be at least 5mg/l for fish and wildlife. If the D.O. levels drop below this, a fish kill will result. If they drop below 1mg/l, the body of water will revert to anaerobic microbial decomposition which results in the production of fermentative toxic and noxious end products, and

14
renders the body of water unsuitable for all of its designated uses. The already low D.O. levels of Bayou Lafourche dropped to 0 mg/l during Hurricane Gustov due to inversion of the anaerobic sludge bottom in the hurricane force winds and addition of a tremendous amount of plant and other organic debris. This resulted in a fish kill and caused the Bayou to turn a dark brown to almost black color with a noxious odor and taste, mainly due to the H2S from anaerobic microbial decomposition and manganese leaching from the organic material and sludge. A method to determine the best sampling locations for this project was developed by estimating which ditches or culverts along subdivision streets actually drained back by elevation or were force pumped back away from the Bayou to a collection drainage ditch like the 40 Arpent Canal which originates in Peltier Park on the south side of Thibodaux to drain storm water from the more southern area of the City. It was deemed subdivision drainage ditches mainly impacted the Bayou in approximately the first 200 to 300 feet back (including houses on the batture itself). The rest of the subdivision should not impact the bayou directly unless water in the drainage ditches and culverts is forced back toward the bayou through flooding, extreme weather conditions, or through the few drainage canals or large ditches which were found to connect the 40 arpent canal back to Bayou Lafourche. Some of these canals and large ditches connecting the 40 arpent canal to Bayou Lafourche are actually gated to prevent the Bayou water from backing up into the subdivision ditches during Bayou flooding or high water weather conditions. However, in heavy flooding some of the drainage ditches and canals may drain back toward the bayou. The main canals in Lafourche Parish connecting the 40 arpent drainage canal behind LA Hwy 1 include: 1) the Dugas Canal at the Ronald Adams Construction Company on LA Hwy 1 just north of Lafourche Crossing (gated before crossing under Hwy 1 in a culvert to prevent the Bayou from backing up into the drainage area); 2) Four Point Canal on LA Hwy 1 near Raceland (mechanically gated about 2 blocks from the Bayou to allow passage of small boats and prevent backup of the Bayou into the drainage canal); and 3) the Company Canal at Lockport which is connected to the Forty Arpent Canal by a pump system which seems to be in place to pump potential flood waters from the 40 arpent canal back of the Lockport Heights subdivision (not incorporated into the Lockport City Sewage Treatment System) into the Company Canal which drains directly into Bayou Lafourche just south of the Lafourche Parish District No. 1 Water Plant intake at Clotilda. The Company Canal is also connected to the 40 Arpent Canal south of Lockport at the Romy St. to Mar St. subdivision (Sites J5-J7, which were found to have very high human fecal coliform input). To evaluate which non-incorporated subdivision drainage ditches did impact the Bayou we developed a protocol to select catch basins on Hwy 1 or Hwy 308 that collected drainage from ditches or underground culverts from homes in the first 200ft or more from the Bayou. These culverts passed under the highways to catch basins and/or to culverts on the Bayou side of the highway. If samples taken from these drainage structures were high in FC and OBs, we also selected a ditch, culvert, or catch basin site more than 300 ft back from the bayouside drainage, and finally took a sample at the back drainage 40 arpent canal (if possible) to evaluate the levels of FC and OBs there. This was to help determine whether the majority of the sewage effluents from the package plants in the subdivision were draining to the back drainage area or to the bayouside. To help identify potential human fecal coliform (FC) sources from sampling sites, relative levels of fluorescence of optical brighteners (OBs) from laundry detergents were correlated to FC levels at that same site. Deionized water (0.0μl /liter of OBs) was used as the negative control, and 50.0μl/liter deionized water 2X Tide liquid detergent (Tide Original Scent 2X, Proctor and Gamble, Cincinnati, OH) was used as a standard source of OBs to calibrate a hand-held Turner Designs field fluorometer to 100 fluorometric units (FU). Although the type and concentrations of OBs in different detergents vary greatly from product to product and are proprietary, this method proved to be very useful in establishing a relative level of OBs compared to a deionized water negative control of 0 μl /liter at each site. Relative FU levels of OBs in conjunction with fecal coliform levels are a screening indicator of the amount of anthropogenic input. A high OB number in conjunction with a high fecal coliform (FC) level is a good indication that the FCs are of anthropogenic origin. However, high FC levels combined with very low OBs at a site indicate that the contamination is probably from animal origin. High OB numbers in conjunction with low FC numbers can indicate a source of “gray water (wash water) without input from actual human fecal matter from toilets or other facilities that normally empty into a septic tank, package plant, or other source of
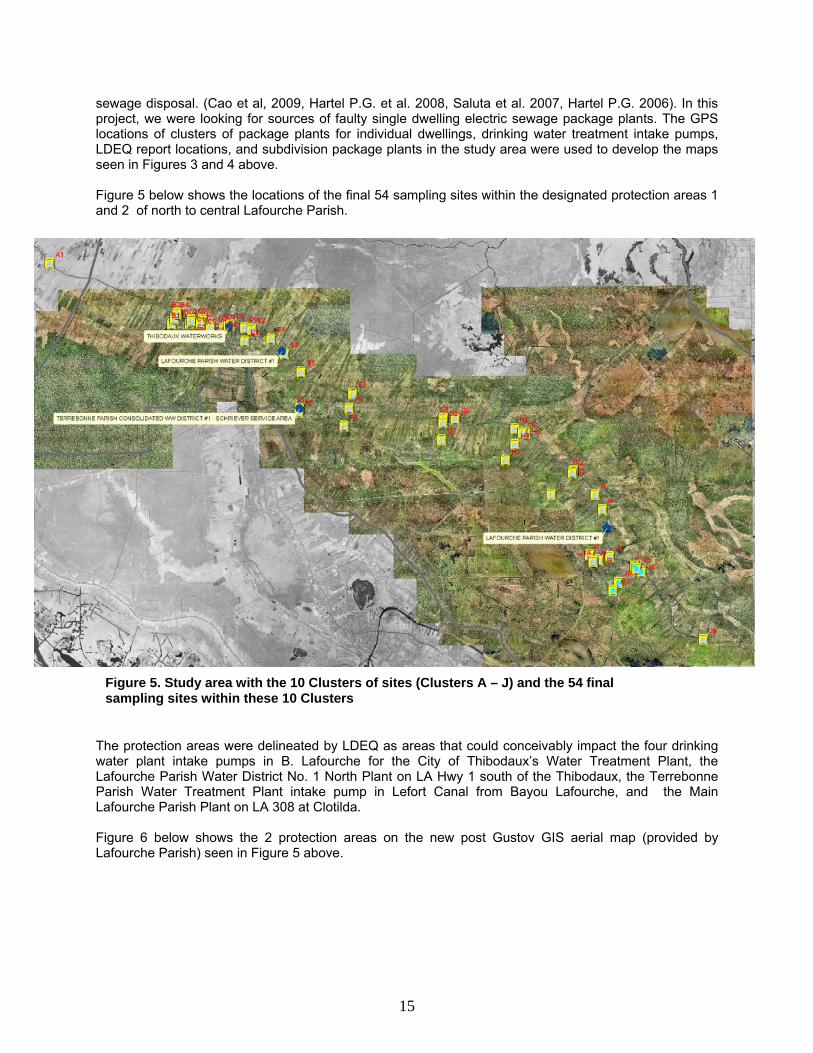
15
sewage disposal. (Cao et al, 2009, Hartel P.G. et al. 2008, Saluta et al. 2007, Hartel P.G. 2006). In this project, we were looking for sources of faulty single dwelling electric sewage package plants. The GPS locations of clusters of package plants for individual dwellings, drinking water treatment intake pumps, LDEQ report locations, and subdivision package plants in the study area were used to develop the maps seen in Figures 3 and 4 above. Figure 5 below shows the locations of the final 54 sampling sites within the designated protection areas 1 and 2 of north to central Lafourche Parish. The protection areas were delineated by LDEQ as areas that could conceivably impact the four drinking water plant intake pumps in B. Lafourche for the City of Thibodaux’s Water Treatment Plant, the Lafourche Parish Water District No. 1 North Plant on LA Hwy 1 south of the Thibodaux, the Terrebonne Parish Water Treatment Plant intake pump in Lefort Canal from Bayou Lafourche, and the Main Lafourche Parish Plant on LA 308 at Clotilda. Figure 6 below shows the 2 protection areas on the new post Gustov GIS aerial map (provided by Lafourche Parish) seen in Figure 5 above.
Figure 5. Study area with the 10 Clusters of sites (Clusters A – J) and the 54 final sampling sites within these 10 Clusters

16
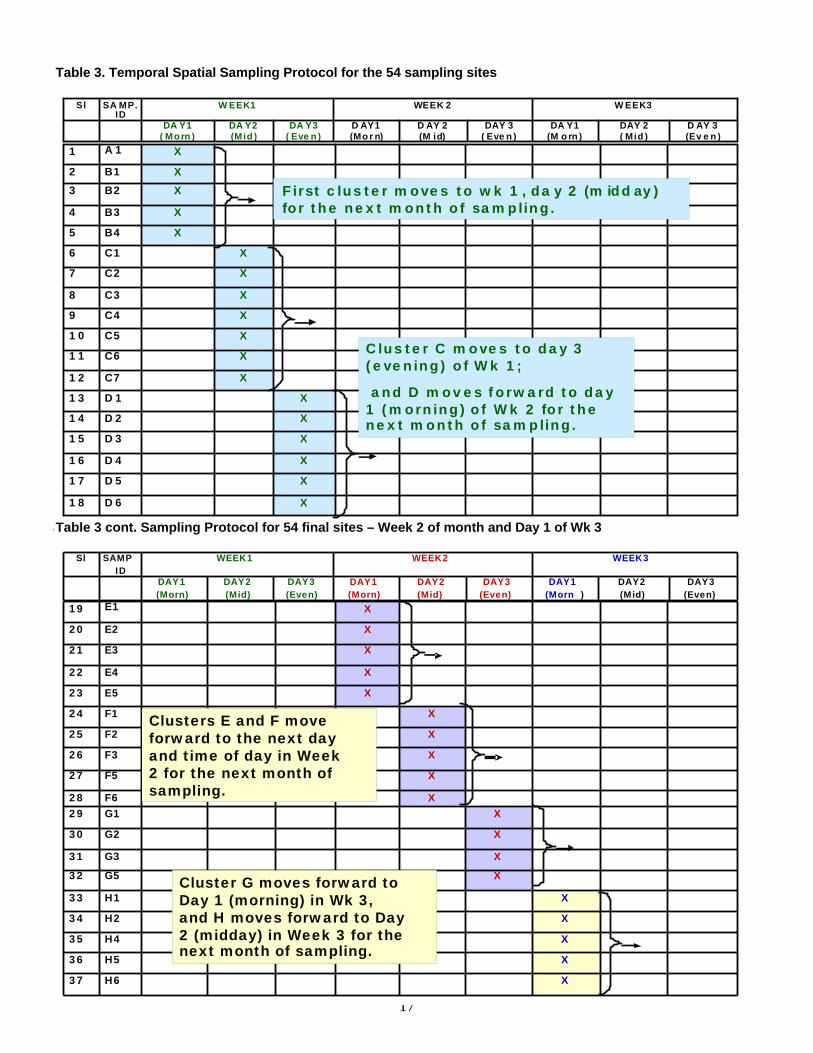
Table 3 has a list of the 54 final sampling sites. The sampling sites start north above the Protection Area 1 at the Labadieville Church in Assumption Parish. They follow the Bayou south mainly on Hwy 1, but there are also some on Hwy 308. They are numbered in clusters of samples (A-J) that are related geographically, and they end outside of Protection Area 2 at the Valentine Bridge. Codes for sampling sites were designated in collaboration with requirements of the LDEQ Project Officers. The temporal and spatial sampling strategy monitoring schedule for the 10 clusters of sites (A-J) with 54 sampling sites within the 10 clusters is found in Table 3 below. At the end of the 3 week sampling period each month, the last set of samples moves temporally from the evening to the morning sampling time, and all of the other clusters of sampling sites move over one to be collected at the next temporal period for 3 weeks of the next month. So for each sampling quarter (3 months), each of the selected sites will have been collected at a morning, noon and evening time period. The 4th week of each month during the project is for data entry and/or for “catch up” sampling in case samples could not be taken during one of the first 3 weeks of that month.
Figure 6. Protection Areas 1 and 2 showing the 10 Site Clusters (A-J) and 54 total sampling sites in those Clusters
17
H
Ta ble 1. Sa mpling Pro tocol for 54 final sites – We ek 1 o f sa mpling month
Sl SA MP. ID
WEEK1 WEEK2 WEEK3
DA Y1 ( Morn)
DA Y2 (Mid)
DA Y3 ( Even)
D AY1 (Morn)
D AY 2 (M id)
DAY 3 ( Even)
DA Y1 (M orn)
DAY 2 ( Mid)
D AY 3 (Even)
1 A 1 X
2 B1 X
3 B2 X
4 B3 X
5 B4 X
6 C1 X
7 C2 X
8 C3 X
9 C4 X
10 C5 X
11 C6 X
12 C7 X
13 D1 X
14 D2 X
15 D3 X
16 D4 X
17 D5 X
18 D6 X
First cluster moves to wk 1 , da y 2 (m idd ay) for the next month of sampling.
Cluster C moves to day 3 (evening) of Wk 1;
and D moves forward to day 1 (morning) of Wk 2 for the next month of sampling.
Table 3. Temporal Spatial Sampling Protocol for the 54 sampling sites
Table 2. Sampling Protocol for 54 final sites– Week 2 of month and Day 1 of Wk 3Sl SAMP
IDWEEK1 WEEK2 WEEK3
DAY1 (Morn)
DAY2 (Mid)
DAY3 (Even)
DAY1 (Morn)
DAY2 (Mid)
DAY3 (Even)
DAY1 (Morn )
DAY2 (Mid)
DAY3 (Even)
19 E1 X
20 E2 X
21 E3 X
22 E4 X
23 E5 X
24 F1 X
25 F2 X
26 F3 X
27 F5 X
28 F6 X29 G1 X
30 G2 X
31 G3 X
32 G5 X
33 H1 X
34 H2 X
35 H4 X
36 H5 X
37 H6 X
Clusters E and F move forward to the next day and time of day in Week2 for the next month of sampling.
Cluster G moves forward toDay 1 (morning) in Wk 3, and H moves forward to Day 2 (midday) in Week 3 for the next month of sampling.
Table 3 cont. Sampling Protocol for 54 final sites – Week 2 of month and Day 1 of Wk 3
18
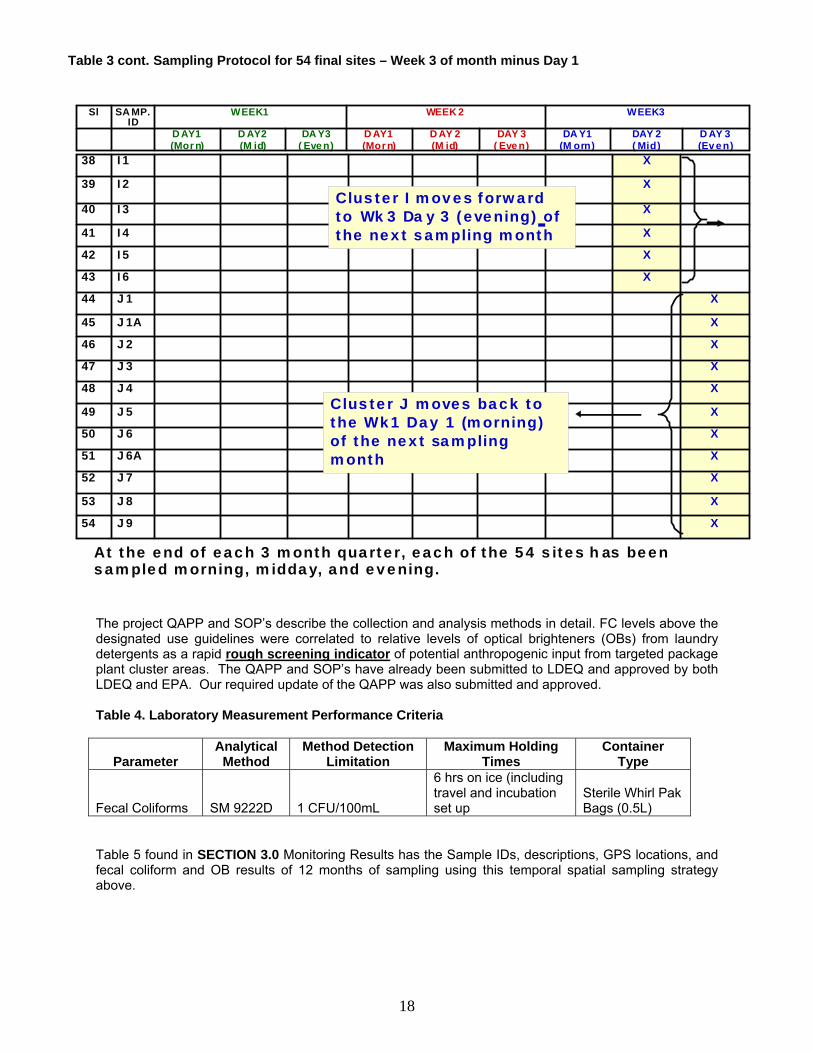
The project QAPP and SOP’s describe the collection and analysis methods in detail. FC levels above the designated use guidelines were correlated to relative levels of optical brighteners (OBs) from laundry detergents as a rapid rough screening indicator of potential anthropogenic input from targeted package plant cluster areas. The QAPP and SOP’s have already been submitted to LDEQ and approved by both LDEQ and EPA. Our required update of the QAPP was also submitted and approved. Table 4. Laboratory Measurement Performance Criteria
Parameter
Analytical Method
Method Detection Limitation
Maximum Holding Times
Container Type
Fecal Coliforms
SM 9222D
1 CFU/100mL
6 hrs on ice (including travel and incubation set up
Sterile Whirl Pak Bags (0.5L)
Table 5 found in SECTION 3.0 Monitoring Results has the Sample IDs, descriptions, GPS locations, and fecal coliform and OB results of 12 months of sampling using this temporal spatial sampling strategy above.
Table 2. Sampling Protocol for 54 final sites – Wk 3 of month (Day 1 not seen here.)
Sl SAMP. ID
WEEK1 WEEK2 WEEK3
DAY1 (Morn)
DAY2 (Mid)
DAY3 (Even)
DAY1 (Morn)
DAY2 (Mid)
DAY3 (Even)
DAY1 (Morn)
DAY2 (Mid)
DAY3 (Even)
38 I1 X
39 I2 X
40 I3 X
41 I4 X
42 I5 X
43 I6 X
44 J1 X
45 J1A X
46 J2 X
47 J3 X
48 J4 X
49 J5 X
50 J6 X
51 J6A X
52 J7 X
53 J8 X
54 J9 X
Cluster J moves back to the Wk1 Day 1 (morning) of the next sampling month
Cluster I moves forward to Wk3 Day 3 (evening) of the next sampling month
At the end of each 3 month quarter, each of the 54 sites has been sampled morning, midday, and evening.
Table 3 cont. Sampling Protocol for 54 final sites – Week 3 of month minus Day 1
19
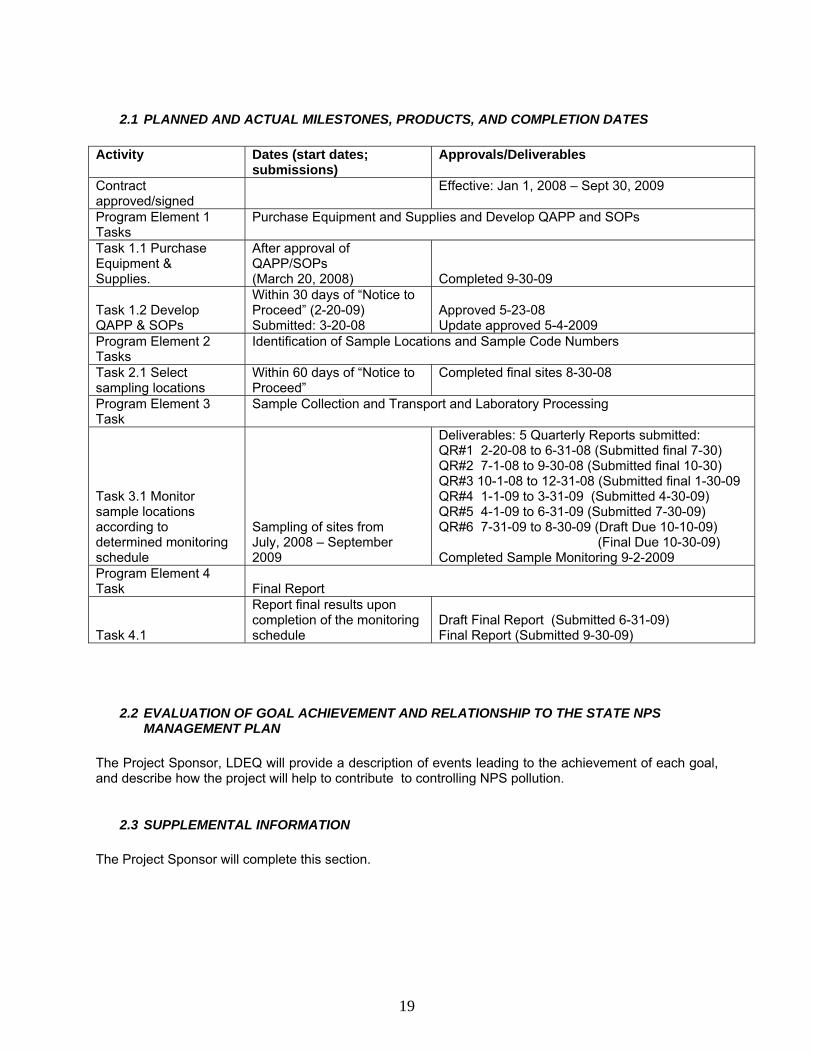
2.1 PLANNED AND ACTUAL MILESTONES, PRODUCTS, AND COMPLETION DATES Activity Dates (start dates;
submissions) Approvals/Deliverables
Contract approved/signed
Effective: Jan 1, 2008 – Sept 30, 2009
Program Element 1 Tasks
Purchase Equipment and Supplies and Develop QAPP and SOPs
Task 1.1 Purchase Equipment & Supplies.
After approval of QAPP/SOPs (March 20, 2008)
Completed 9-30-09
Task 1.2 Develop QAPP & SOPs
Within 30 days of “Notice to Proceed” (2-20-09) Submitted: 3-20-08
Approved 5-23-08 Update approved 5-4-2009
Program Element 2 Tasks
Identification of Sample Locations and Sample Code Numbers
Task 2.1 Select sampling locations
Within 60 days of “Notice to Proceed”
Completed final sites 8-30-08
Program Element 3 Task
Sample Collection and Transport and Laboratory Processing
Task 3.1 Monitor sample locations according to determined monitoring schedule
Sampling of sites from July, 2008 – September 2009
Deliverables: 5 Quarterly Reports submitted: QR#1 2-20-08 to 6-31-08 (Submitted final 7-30) QR#2 7-1-08 to 9-30-08 (Submitted final 10-30) QR#3 10-1-08 to 12-31-08 (Submitted final 1-30-09 QR#4 1-1-09 to 3-31-09 (Submitted 4-30-09) QR#5 4-1-09 to 6-31-09 (Submitted 7-30-09) QR#6 7-31-09 to 8-30-09 (Draft Due 10-10-09) (Final Due 10-30-09) Completed Sample Monitoring 9-2-2009
Program Element 4 Task
Final Report
Task 4.1
Report final results upon completion of the monitoring schedule
Draft Final Report (Submitted 6-31-09) Final Report (Submitted 9-30-09)
2.2 EVALUATION OF GOAL ACHIEVEMENT AND RELATIONSHIP TO THE STATE NPS MANAGEMENT PLAN The Project Sponsor, LDEQ will provide a description of events leading to the achievement of each goal, and describe how the project will help to contribute to controlling NPS pollution.
2.3 SUPPLEMENTAL INFORMATION The Project Sponsor will complete this section.
20
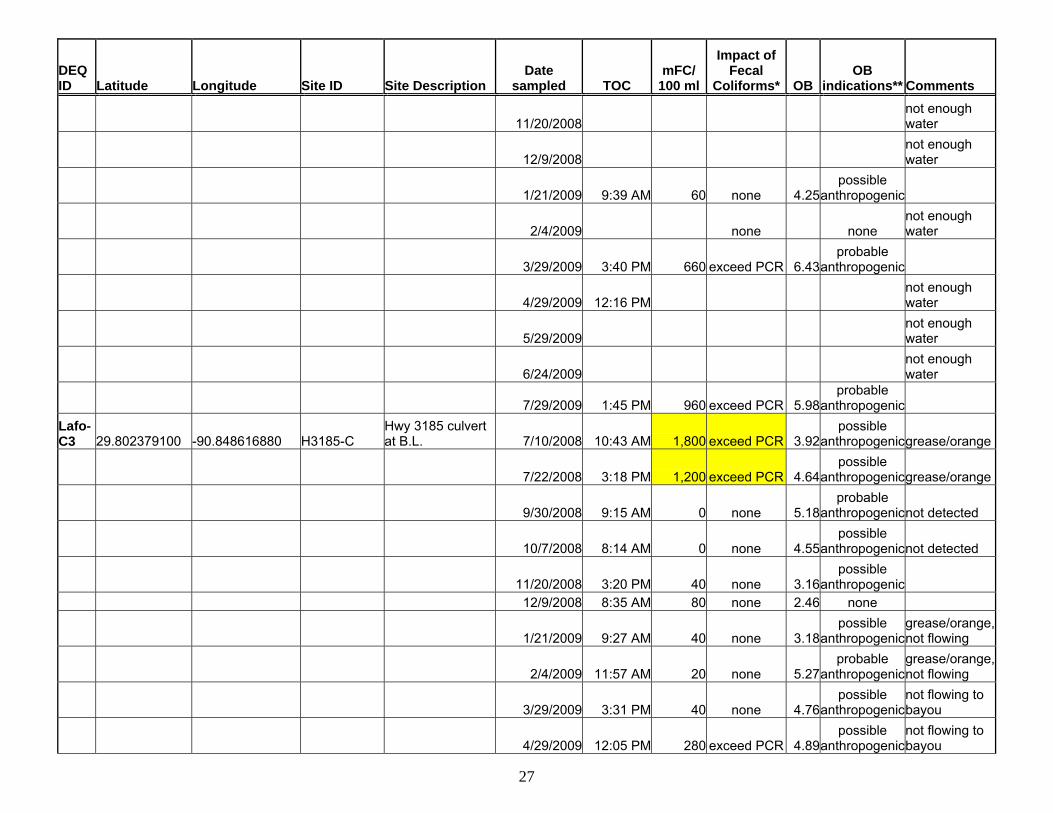
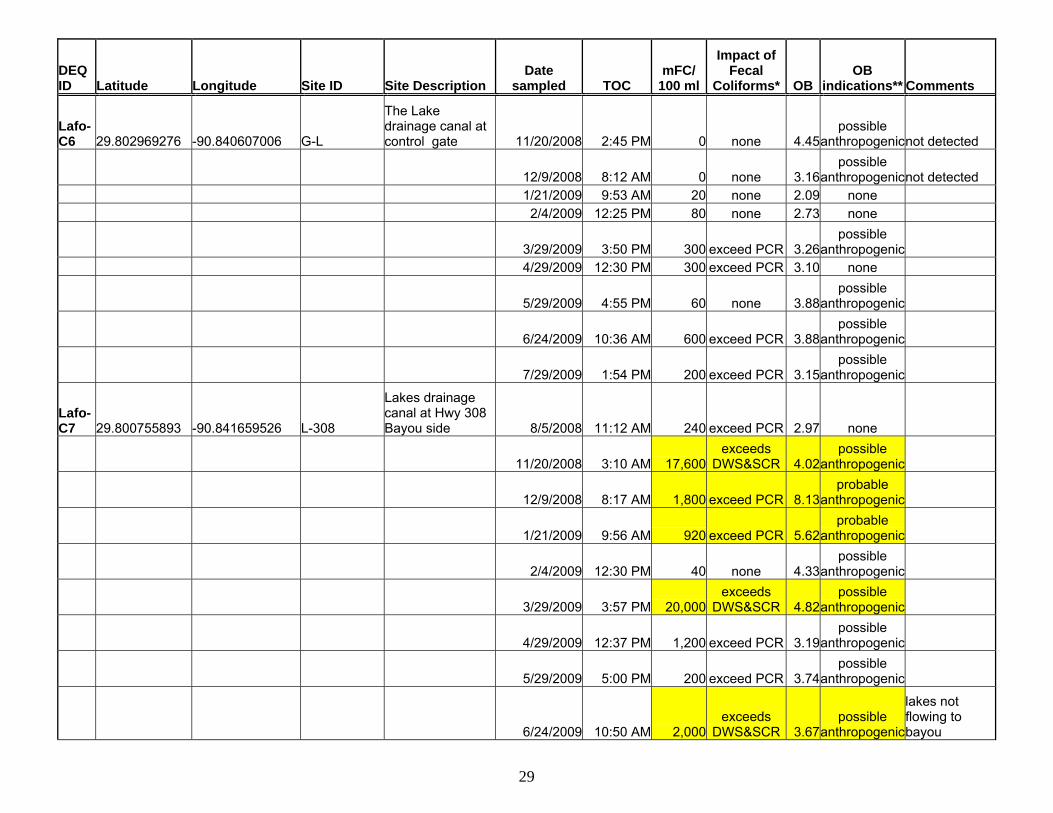
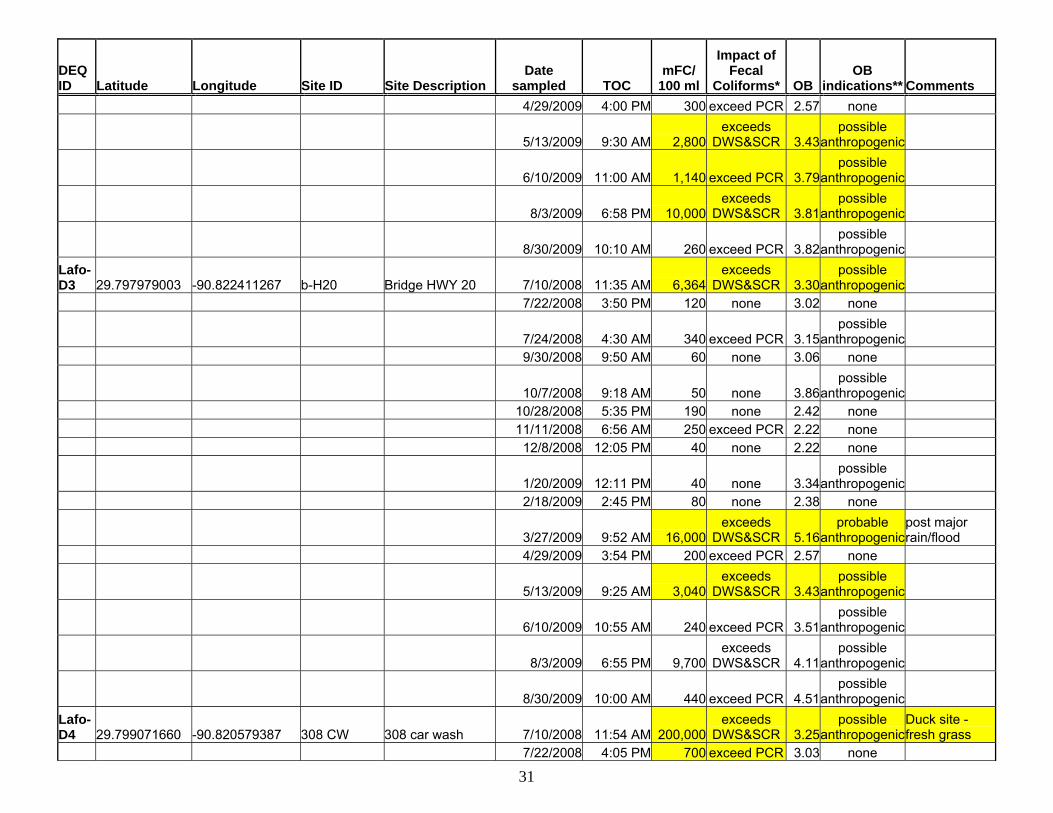
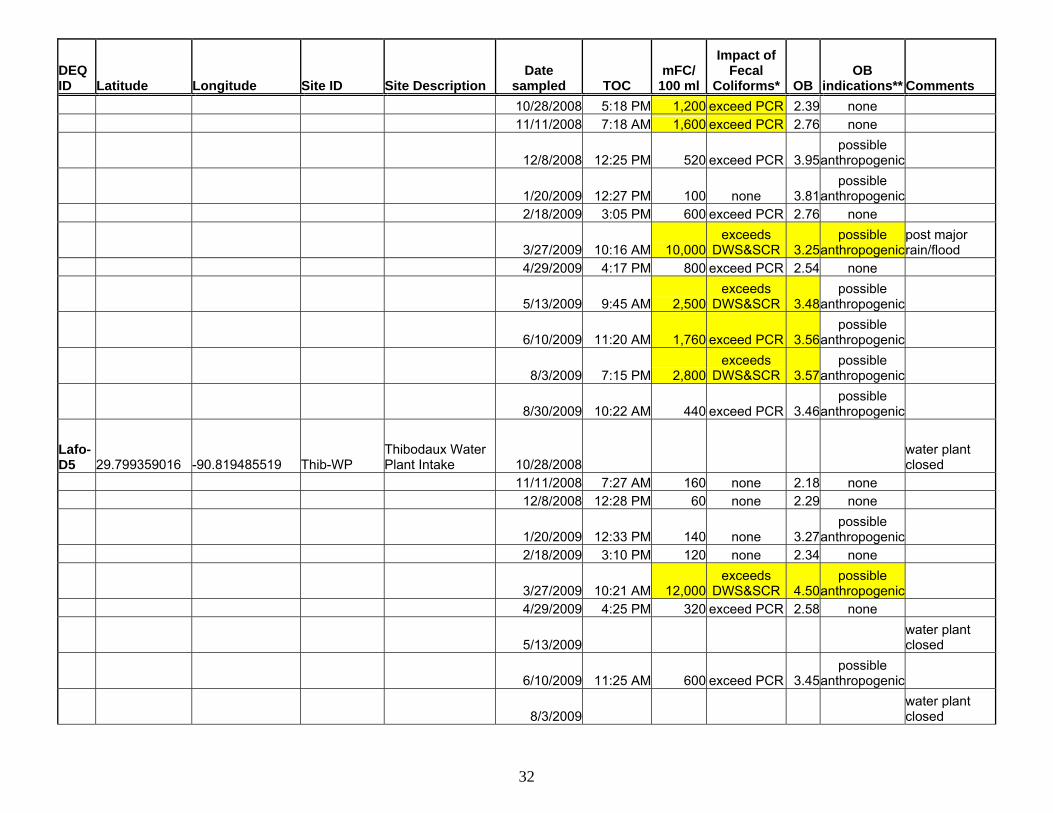
3.0 MONITORING RESULTS The monitoring strategy was described in detail in SECTION 2.0. The temporal and spatial sampling strategy monitoring schedule for the 10 clusters of sites (A-J) with 54 sampling sites within the 10 clusters is found in Table 3 p.16. At the end of the 3 week sampling period each month, the last set of samples moves temporally from the evening to the morning sampling time, and all of the other clusters of sampling sites move over one to be collected at the next temporal period for 3 weeks of the next month. So for each sampling quarter (3 months), each of the selected sites will have been collected at a morning, noon and evening time period. The 4th week of each month during the project is for data entry and/or for “catch up” sampling in case samples could not be taken during one of the first 3 weeks of that month. The sampling and analysis techniques followed the SOPs for sample collection and for fecal coliform laboratory processing, use the fecal coliform number (colony forming units (CFU) per 100 mL) using the membrane filter (MF) single step method (9222 D). A 0.45 µm membrane filter (MF) was used to fully retain organisms to be cultivated and has to be free of extractables which could interfere with their growth as stated in the Federal Register/ Vol. 72, No. 57/ Monday, March 26, 2007/Rules and Regulations. Further referenced in the register is the book Standard Methods, 20th edition (APHA et al. 1998). The NSU Research team handled all sample collection, preservation, holding times, materials and methods in accordance with the LDEQ and EPA approved project QAPP and SOPs which provide descriptions of sample collection and transport in compliance with elements of LAC 33:1 Chapter 53 and the 2003 NELAC Standards. The fecal coliform microbial analysis followed the 20th edition of Standard Methods mFC 9222D, utilizing the membrane filtration (MF) method, and a minimum of 3 dilutions of the samples to get high turbidity drainage samples and Bayou samples through the 0.45 µm membrane filters. As discussed previously in SECTION 2.0 above, initial fecal coliform screening of some of potential sampling locations utilized a Turner Systems handheld field fluorometer to detect optical brighteners in the water samples. If these samples were high in FC and in fluorometer OB readings, human fecal or gray water pollution was indicated. High FC levels and low OB readings indicated animal fecal contamination. Low FC levels and high OB readings indicated areas of “gray water” contamination with detergents or organic compounds from homes or businesses (Hartel et al. 2008). The determination of whether the levels of fecal coliforms in a body of water are too high is based on fecal coliform designated use standards set by the LDEQ (LDEQ 2004). These are in Table 1 on p.7 above. Of primary concern for this project were drinking water source (2,000 cfu FC/100ml), primary recreational contact (400 colony forming units (cfu) FC/100ml) and secondary contact recreation (2,000 cfu FC/100ml). Table 5 below has the results of the fecal coliform monitoring for the entire project. From this table of results, the fecal coliform cfu FC/100ml were correlated with the OB fluorometric unit (FU) readings. Scatter plots for each cluster were developed to easily demonstrate those sites that indicated consistent anthropogenic human fecal coliform input with FC counts of 2,000/100mL or greater - too high for drinking water source (DWS) and secondary contact recreation (SCR). FC counts > 200 cfu FC/100mL are too high for primary contact recreation (PCR). Using the method of Hartel et al. 2006, the handheld field fluorometer was calibrated to 100 FU with a 50μL/liter standard solution of 2X Tide To help identify potential human fecal coliform (FC) sources from sampling sites, relative levels of fluorescence of optical brighteners (OBs) from laundry detergents were correlated to FC levels at that same site. Deionized water (0.0μl /liter of OBs) was used as the negative control, and 50.0μL/liter deionized water 2X Tide liquid detergent (Tide Original Scent 2X, Proctor and Gamble, Cincinnati, OH) was used as a standard source of OBs to calibrate a hand-held Turner Designs field fluorometer to 100 fluorometric units (FU). Although the type and concentrations of OBs in different detergents vary greatly from product to product and are proprietary, this method proved to be very useful in establishing a relative level of OBs compared to a deionized water negative control of 0 μl /liter at each site.

21
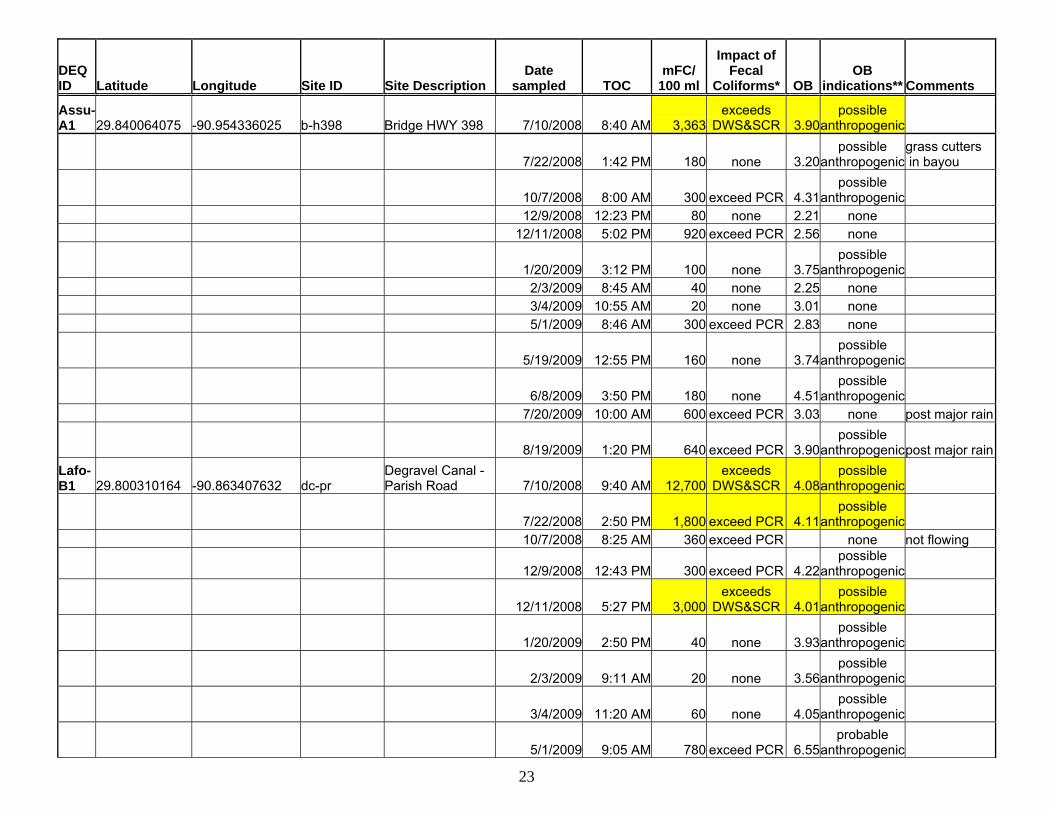
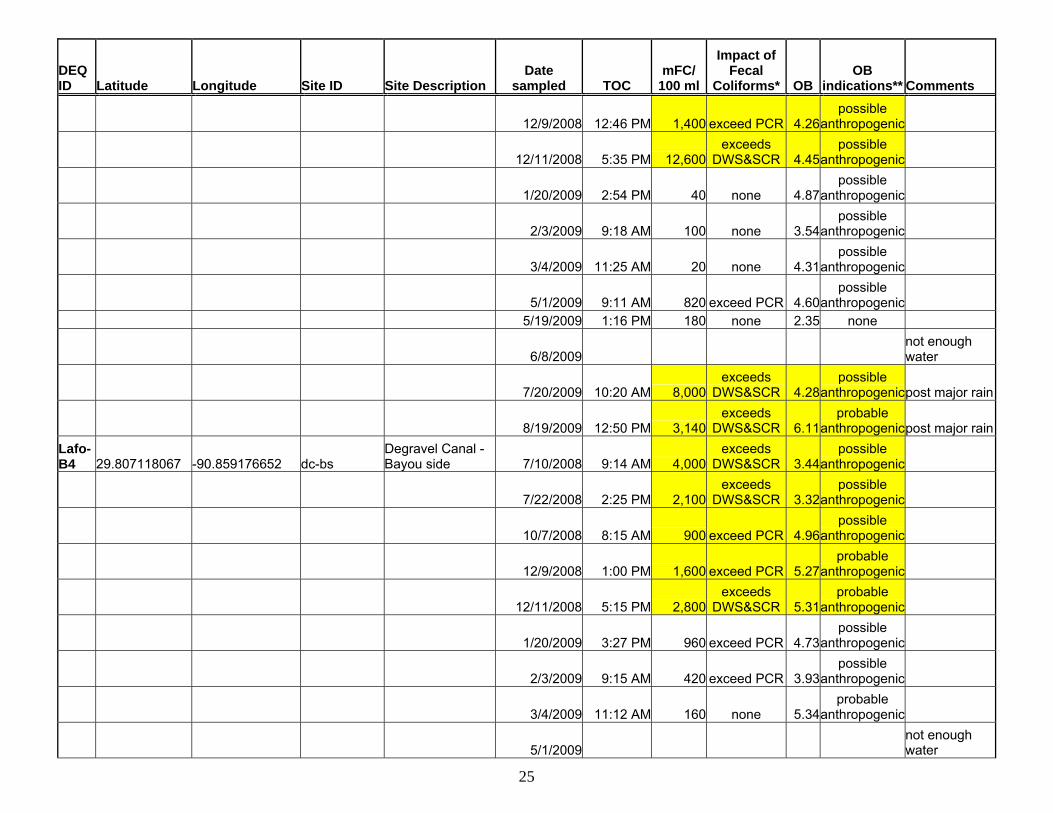
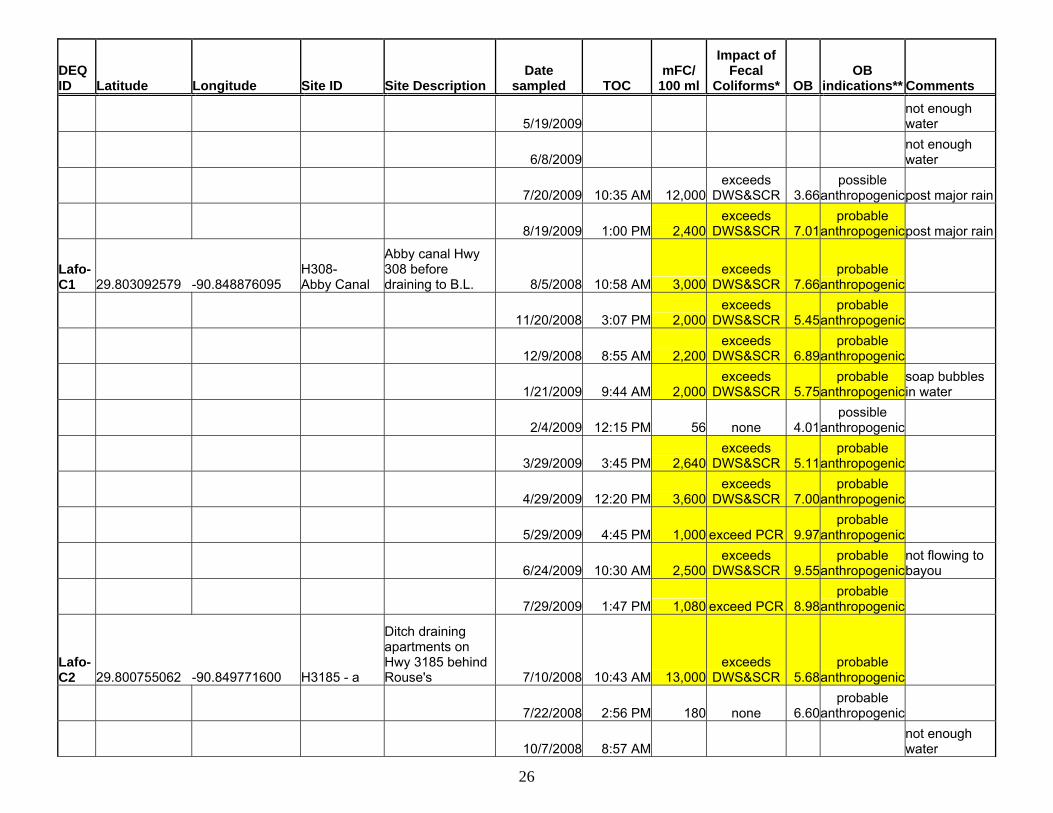
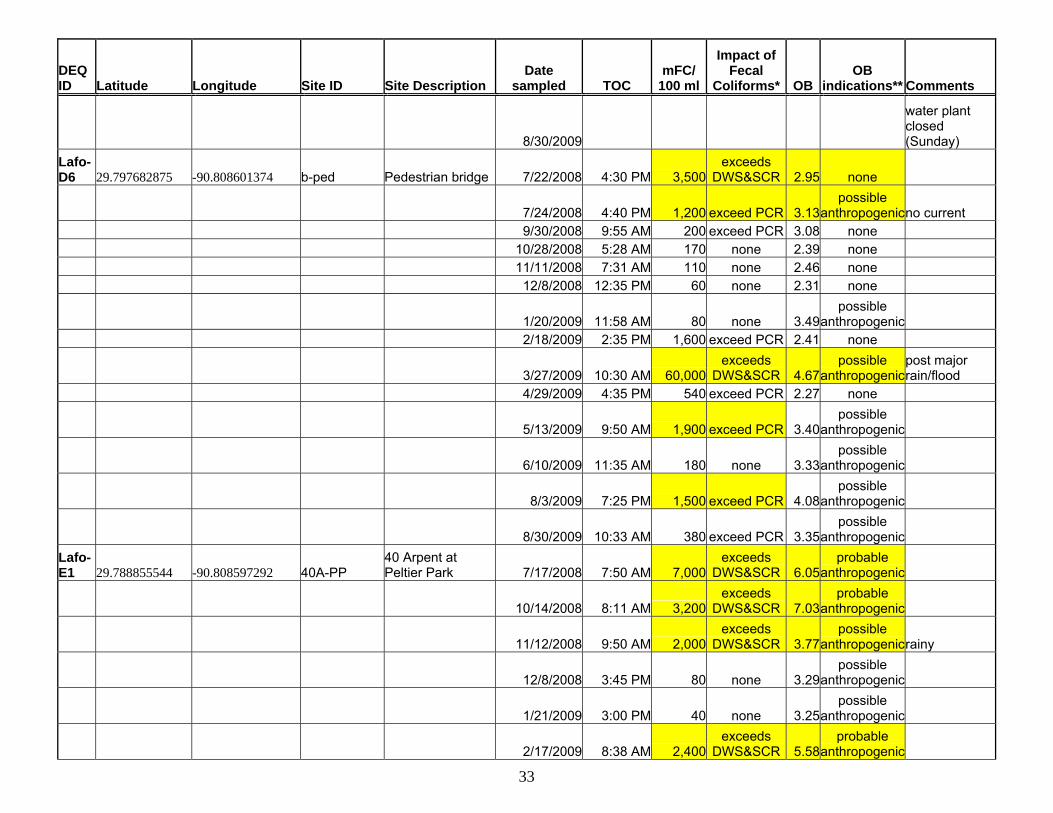
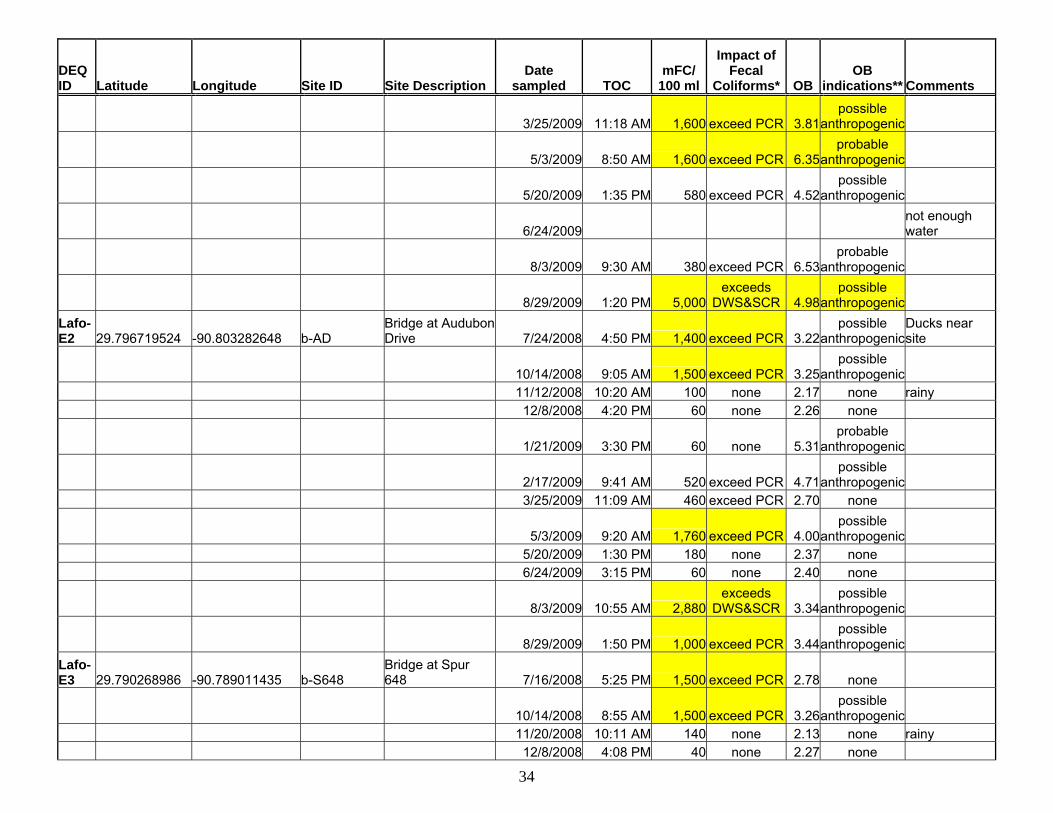
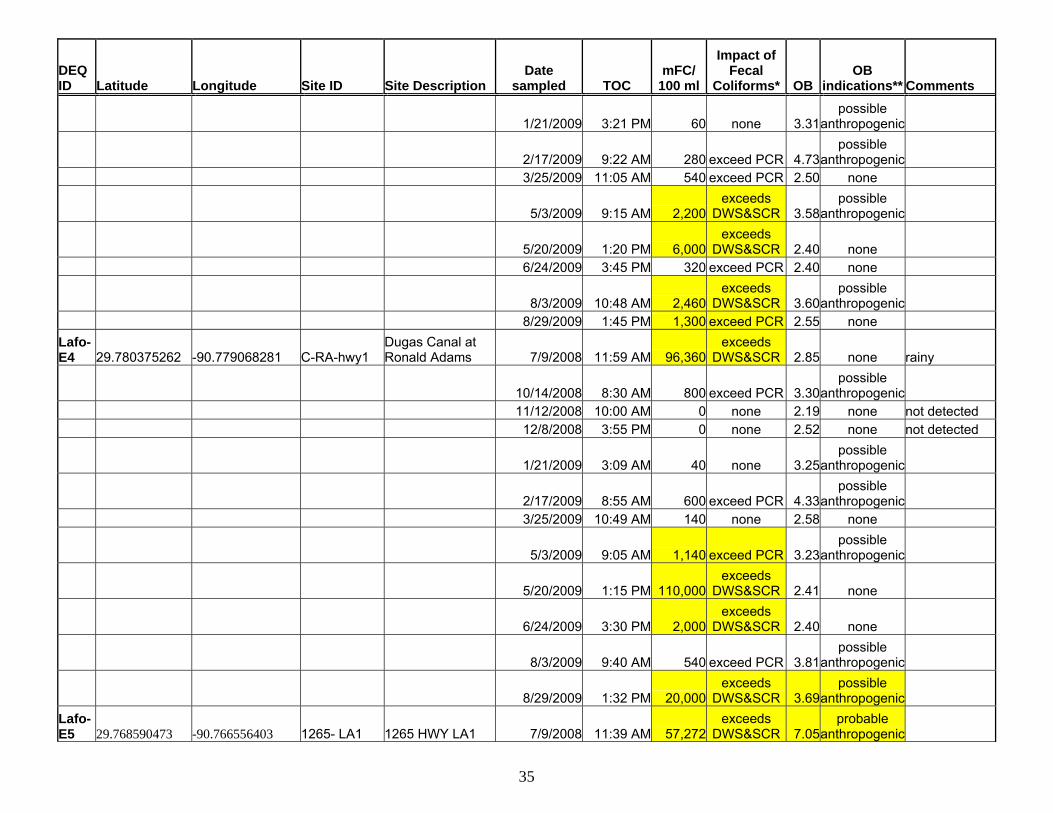
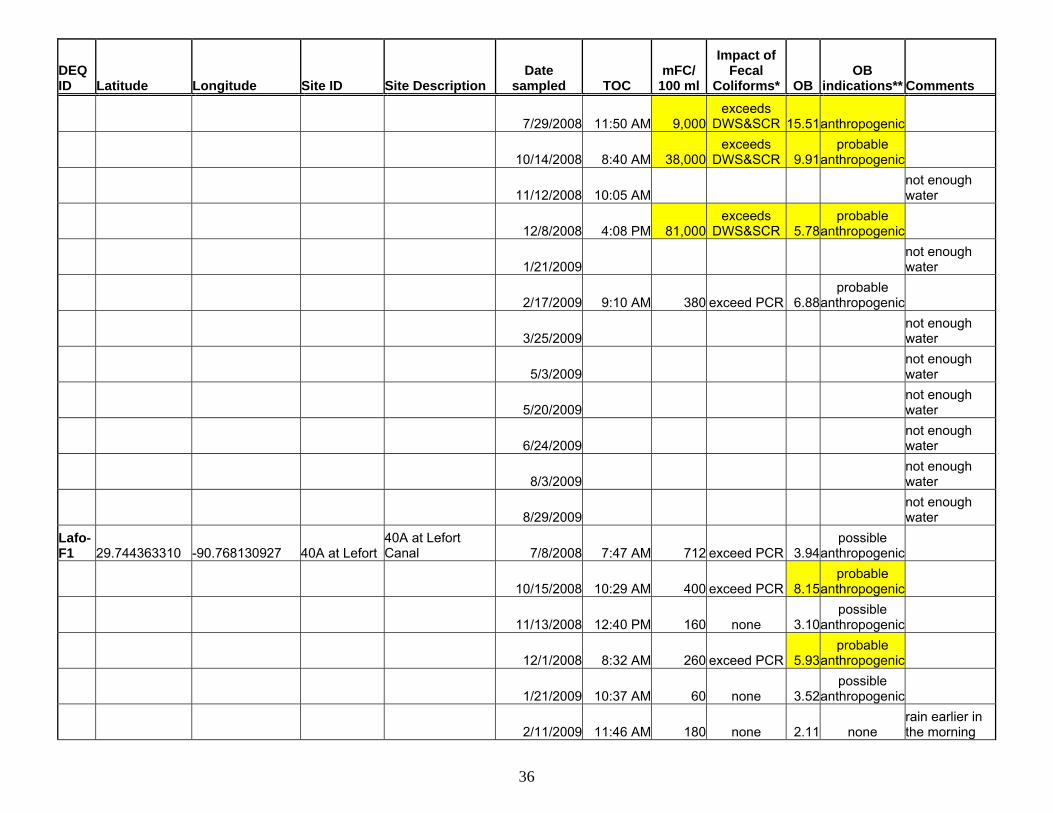
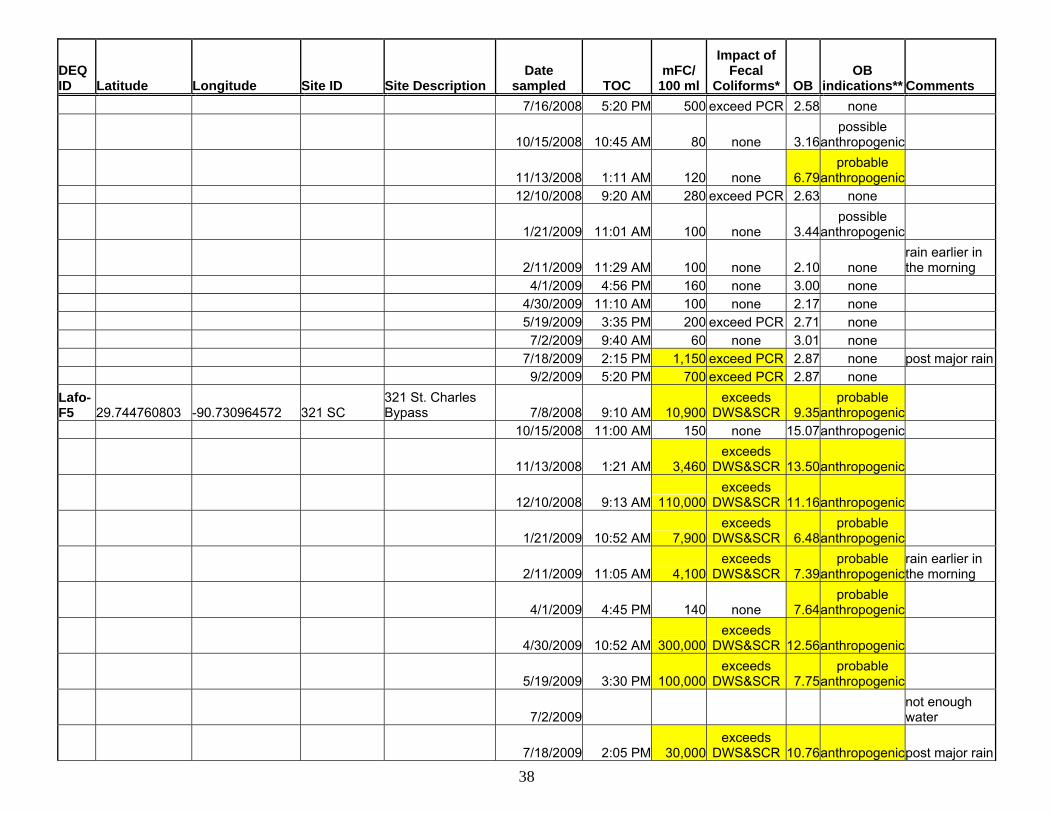
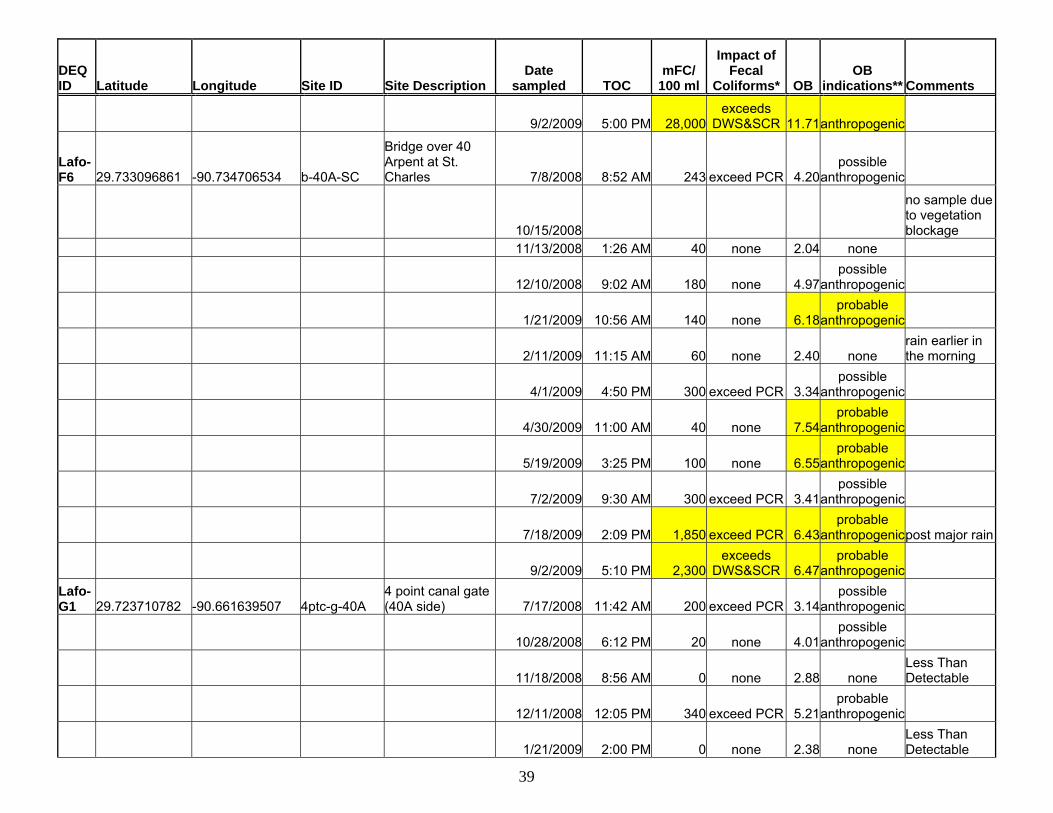
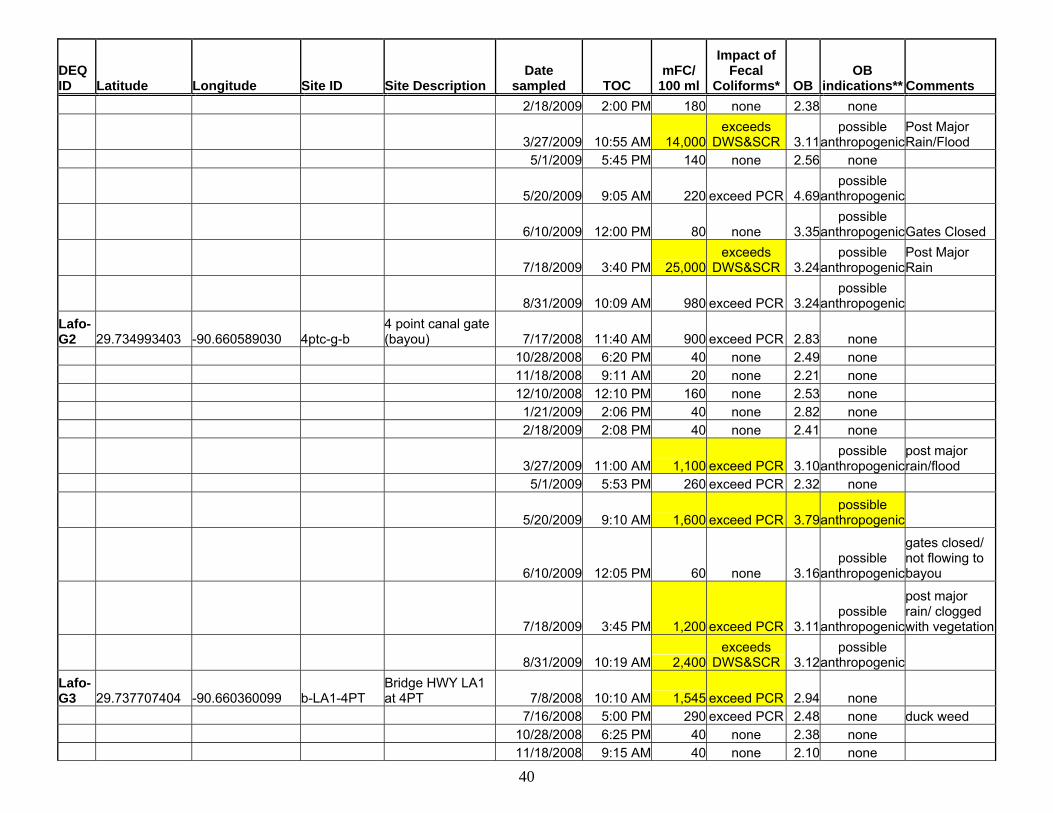
Relative levels of OBs in conjunction with fecal coliform levels are a good screening indicator of anthropogenic input with the following scenarios: 1. High OBs in conjunction with a high fecal coliform (FC) level is a good indication that the FCs are of anthropogenic origin. 2. High FC levels combined with very low OB s at a site indicate that the contamination is probably from animal origin. Several of our sites were impacted by semi-wild ducks living in B. Lafourche at certain sites where people tend to feed them. 3. High OBs in conjunction with low FC numbers can indicate a source of “gray water (wash water) without input from actual human fecal matter from toilets or other facilities that normally empty into a septic tank, package plant, or other source of sewage disposal. (Cao et al, 2009, Hartel P.G. et al. 2008, Saluta et al. 2007, Hartel P.G. 2006). 4. Low FC numbers with low OB FUs are those sites that are considered clean and not impacted by human FC. In this project, we were looking for sources of faulty single dwelling electric sewage package plants. In addition to the Table 5 of results below, each cluster of sampling sites is mapped and a scatter plot showing all sampling sites within each cluster was made of each cluster. These scatter plots have delineating lines that clearly show which of the sites have both high fecal coliforms and high OBs. These are considered “hot spots” of human contamination, and will have first priority to develop BMP’s or other methods of mitigating contamination to the Bayou drainage basin. Table 5. Sampling Results and Designated Use Impacts from Fecal Coliforms and OBs
23
DEQ ID Latitude Longitude Site ID Site Description
Date sampled TOC
mFC/100 ml
Impact of Fecal
Coliforms* OBOB
indications** Comments
Assu-A1 29.840064075 -90.954336025 b-h398 Bridge HWY 398 7/10/2008 8:40 AM 3,363
exceeds DWS&SCR 3.90
possible anthropogenic
7/22/2008 1:42 PM 180 none 3.20possible
anthropogenicgrass cutters in bayou
10/7/2008 8:00 AM 300 exceed PCR 4.31possible
anthropogenic 12/9/2008 12:23 PM 80 none 2.21 none 12/11/2008 5:02 PM 920 exceed PCR 2.56 none
1/20/2009 3:12 PM 100 none 3.75possible
anthropogenic 2/3/2009 8:45 AM 40 none 2.25 none 3/4/2009 10:55 AM 20 none 3.01 none 5/1/2009 8:46 AM 300 exceed PCR 2.83 none
5/19/2009 12:55 PM 160 none 3.74possible
anthropogenic
6/8/2009 3:50 PM 180 none 4.51possible
anthropogenic 7/20/2009 10:00 AM 600 exceed PCR 3.03 none post major rain
8/19/2009 1:20 PM 640 exceed PCR 3.90possible
anthropogenicpost major rain Lafo-B1 29.800310164 -90.863407632 dc-pr
Degravel Canal - Parish Road 7/10/2008 9:40 AM 12,700
exceeds DWS&SCR 4.08
possible anthropogenic
7/22/2008 2:50 PM 1,800 exceed PCR 4.11possible
anthropogenic 10/7/2008 8:25 AM 360 exceed PCR none not flowing
12/9/2008 12:43 PM 300 exceed PCR 4.22possible
anthropogenic
12/11/2008 5:27 PM 3,000exceeds
DWS&SCR 4.01possible
anthropogenic
1/20/2009 2:50 PM 40 none 3.93possible
anthropogenic
2/3/2009 9:11 AM 20 none 3.56possible
anthropogenic
3/4/2009 11:20 AM 60 none 4.05possible
anthropogenic
5/1/2009 9:05 AM 780 exceed PCR 6.55probable
anthropogenic

24
DEQ ID Latitude Longitude Site ID Site Description
Date sampled TOC
mFC/100 ml
Impact of Fecal
Coliforms* OBOB
indications** Comments
5/19/2009 1:11 PM 100 none 4.17possible
anthropogenic
6/8/2009 4:05 PM 1,840 exceed PCR 6.13probable
anthropogenic
7/20/2009 10:15 AM 4,300exceeds
DWS&SCR 3.98possible
anthropogenicpost major rain
8/19/2009 12:45 PM 6,900exceeds
DWS&SCR 7.62probable
anthropogenicpost major rain Lafo-B2 29.807052994 -90.859149239 dc-hwy1
Degravel Canal_ HWY 1 7/10/2008 9:08 AM 10,000
exceeds DWS&SCR 4.22
possible anthropogenic
7/22/2008 2:15 PM 6,200exceeds
DWS&SCR 4.09possible
anthropogenic
10/7/2008 8:13 AM 810 exceed PCR 5.12probable
anthropogenic
12/9/2008 12:55 PM 6,000exceeds
DWS&SCR 5.15probable
anthropogenic
12/11/2008 5:20 PM 2,420exceeds
DWS&SCR 5.33probable
anthropogenic
1/20/2009 3:25 PM 280 exceed PCR 4.81possible
anthropogenic
2/3/2009 9:05 AM 80 none 3.72possible
anthropogenic
3/4/2009 11:10 AM 160 none 5.44probable
anthropogenic
5/1/2009 9:25 AM 1,580 exceed PCR 5.53probable
anthropogenicnot flowing to bayou
5/19/2009 not enough water
6/8/2009 not enough water
7/20/2009 10:30 AM 3,200exceeds
DWS&SCR 4.51possible
anthropogenicpost major rain
8/19/2009 1:00 PM 3,400exceeds
DWS&SCR 6.86probable
anthropogenicpost major rain Lafo-B3 29.803866494 -90.861128039 dc-mid
Degravel Canal- middle point 10/7/2008 8:31 AM 100 none 4.30
possible anthropogenic
25
DEQ ID Latitude Longitude Site ID Site Description
Date sampled TOC
mFC/100 ml
Impact of Fecal
Coliforms* OBOB
indications** Comments
12/9/2008 12:46 PM 1,400 exceed PCR 4.26possible
anthropogenic
12/11/2008 5:35 PM 12,600exceeds
DWS&SCR 4.45possible
anthropogenic
1/20/2009 2:54 PM 40 none 4.87possible
anthropogenic
2/3/2009 9:18 AM 100 none 3.54possible
anthropogenic
3/4/2009 11:25 AM 20 none 4.31possible
anthropogenic
5/1/2009 9:11 AM 820 exceed PCR 4.60possible
anthropogenic 5/19/2009 1:16 PM 180 none 2.35 none
6/8/2009 not enough water
7/20/2009 10:20 AM 8,000exceeds
DWS&SCR 4.28possible
anthropogenicpost major rain
8/19/2009 12:50 PM 3,140exceeds
DWS&SCR 6.11probable
anthropogenicpost major rain Lafo-B4 29.807118067 -90.859176652 dc-bs
Degravel Canal - Bayou side 7/10/2008 9:14 AM 4,000
exceeds DWS&SCR 3.44
possible anthropogenic
7/22/2008 2:25 PM 2,100exceeds
DWS&SCR 3.32possible
anthropogenic
10/7/2008 8:15 AM 900 exceed PCR 4.96possible
anthropogenic
12/9/2008 1:00 PM 1,600 exceed PCR 5.27probable
anthropogenic
12/11/2008 5:15 PM 2,800exceeds
DWS&SCR 5.31probable
anthropogenic
1/20/2009 3:27 PM 960 exceed PCR 4.73possible
anthropogenic
2/3/2009 9:15 AM 420 exceed PCR 3.93possible
anthropogenic
3/4/2009 11:12 AM 160 none 5.34probable
anthropogenic
5/1/2009 not enough water
26
DEQ ID Latitude Longitude Site ID Site Description
Date sampled TOC
mFC/100 ml
Impact of Fecal
Coliforms* OBOB
indications** Comments
5/19/2009 not enough water
6/8/2009 not enough water
7/20/2009 10:35 AM 12,000exceeds
DWS&SCR 3.66possible
anthropogenicpost major rain
8/19/2009 1:00 PM 2,400exceeds
DWS&SCR 7.01probable
anthropogenicpost major rain
Lafo-C1 29.803092579 -90.848876095
H308- Abby Canal
Abby canal Hwy 308 before draining to B.L. 8/5/2008 10:58 AM 3,000
exceeds DWS&SCR 7.66
probable anthropogenic
11/20/2008 3:07 PM 2,000exceeds
DWS&SCR 5.45probable
anthropogenic
12/9/2008 8:55 AM 2,200exceeds
DWS&SCR 6.89probable
anthropogenic
1/21/2009 9:44 AM 2,000exceeds
DWS&SCR 5.75probable
anthropogenicsoap bubbles in water
2/4/2009 12:15 PM 56 none 4.01possible
anthropogenic
3/29/2009 3:45 PM 2,640exceeds
DWS&SCR 5.11probable
anthropogenic
4/29/2009 12:20 PM 3,600exceeds
DWS&SCR 7.00probable
anthropogenic
5/29/2009 4:45 PM 1,000 exceed PCR 9.97probable
anthropogenic
6/24/2009 10:30 AM 2,500exceeds
DWS&SCR 9.55probable
anthropogenicnot flowing to bayou
7/29/2009 1:47 PM 1,080 exceed PCR 8.98probable
anthropogenic
Lafo-C2 29.800755062 -90.849771600 H3185 - a
Ditch draining apartments on Hwy 3185 behind Rouse's 7/10/2008 10:43 AM 13,000
exceeds DWS&SCR 5.68
probable anthropogenic
7/22/2008 2:56 PM 180 none 6.60probable
anthropogenic
10/7/2008 8:57 AM not enough water
27
DEQ ID Latitude Longitude Site ID Site Description
Date sampled TOC
mFC/100 ml
Impact of Fecal
Coliforms* OBOB
indications** Comments
11/20/2008 not enough water
12/9/2008 not enough water
1/21/2009 9:39 AM 60 none 4.25possible
anthropogenic
2/4/2009 none none not enough water
3/29/2009 3:40 PM 660 exceed PCR 6.43probable
anthropogenic
4/29/2009 12:16 PM not enough water
5/29/2009 not enough water
6/24/2009 not enough water
7/29/2009 1:45 PM 960 exceed PCR 5.98probable
anthropogenic Lafo-C3 29.802379100 -90.848616880 H3185-C
Hwy 3185 culvert at B.L. 7/10/2008 10:43 AM 1,800 exceed PCR 3.92
possible anthropogenicgrease/orange
7/22/2008 3:18 PM 1,200 exceed PCR 4.64possible
anthropogenicgrease/orange
9/30/2008 9:15 AM 0 none 5.18probable
anthropogenicnot detected
10/7/2008 8:14 AM 0 none 4.55possible
anthropogenicnot detected
11/20/2008 3:20 PM 40 none 3.16possible
anthropogenic 12/9/2008 8:35 AM 80 none 2.46 none
1/21/2009 9:27 AM 40 none 3.18possible
anthropogenicgrease/orange, not flowing
2/4/2009 11:57 AM 20 none 5.27probable
anthropogenicgrease/orange, not flowing
3/29/2009 3:31 PM 40 none 4.76possible
anthropogenicnot flowing to bayou
4/29/2009 12:05 PM 280 exceed PCR 4.89possible
anthropogenicnot flowing to bayou

28
DEQ ID Latitude Longitude Site ID Site Description
Date sampled TOC
mFC/100 ml
Impact of Fecal
Coliforms* OBOB
indications** Comments
5/29/2009 4:25 PM 20 none 5.92probable
anthropogenicnot flowing to bayou
6/24/2009 10:20 AM 120 none 5.61probable
anthropogenic
7/29/2009 1:35 PM 40 none 4.66possible
anthropogenic
Lafo-C4 29.802348828 -90.848562046 H3185-B
Downstream on Hwy 3185 bridge over B.L. 7/10/2008 10:50 AM 900 exceed PCR 3.61
possible anthropogenic
7/22/2008 3:22 PM 120 none 3.02 none
10/7/2008 10:07 AM 810 exceed PCR 3.76possible
anthropogenic 11/20/2008 3:24 PM 20 none 2.45 none 12/9/2008 8:35 AM 80 none 2.46 none
1/21/2009 9:23 AM 40 none 3.77possible
anthropogenic 2/4/2009 12:00 PM 0 none 2.20 none not detected 3/29/2009 3:37 PM 1,140 exceed PCR 3.00 none 4/29/2009 12:10 PM 780 exceed PCR 2.64 none
5/29/2009 4:30 PM 180 none 3.51possible
anthropogenic
6/24/2009 10:25 AM 1,440 exceed PCR 3.71possible
anthropogenic
7/29/2009 1:40 PM 220 exceed PCR 3.17possible
anthropogenic Lafo-C5 29.802994829 -90.840571591 L-L
Lake in "The Lakes" subdivision 11/20/2008 2:43 PM 0 none 2.24 none not detected
12/9/2008 8:09 AM 0 none 2.16 none not detected 1/21/2009 9:50 AM 60 none 2.69 none 2/4/2009 12:20 PM 0 none 1.87 none not detected 3/29/2009 3:47 PM 40 none 2.55 none 4/29/2009 12:28 PM 60 none 1.47 none 5/29/2009 4:50 PM 120 none 2.68 none
6/24/2009 10:35 AM 1,040 exceed PCR 2.55 none dead fish in the lake
7/29/2009 1:53 PM 40 none 2.53 none
29
DEQ ID Latitude Longitude Site ID Site Description
Date sampled TOC
mFC/100 ml
Impact of Fecal
Coliforms* OBOB
indications** Comments
Lafo-C6 29.802969276 -90.840607006 G-L
The Lake drainage canal at control gate 11/20/2008 2:45 PM 0 none 4.45
possible anthropogenicnot detected
12/9/2008 8:12 AM 0 none 3.16possible
anthropogenicnot detected 1/21/2009 9:53 AM 20 none 2.09 none 2/4/2009 12:25 PM 80 none 2.73 none
3/29/2009 3:50 PM 300 exceed PCR 3.26possible
anthropogenic 4/29/2009 12:30 PM 300 exceed PCR 3.10 none
5/29/2009 4:55 PM 60 none 3.88possible
anthropogenic
6/24/2009 10:36 AM 600 exceed PCR 3.88possible
anthropogenic
7/29/2009 1:54 PM 200 exceed PCR 3.15possible
anthropogenic
Lafo-C7 29.800755893 -90.841659526 L-308
Lakes drainage canal at Hwy 308 Bayou side 8/5/2008 11:12 AM 240 exceed PCR 2.97 none
11/20/2008 3:10 AM 17,600exceeds
DWS&SCR 4.02possible
anthropogenic
12/9/2008 8:17 AM 1,800 exceed PCR 8.13probable
anthropogenic
1/21/2009 9:56 AM 920 exceed PCR 5.62probable
anthropogenic
2/4/2009 12:30 PM 40 none 4.33possible
anthropogenic
3/29/2009 3:57 PM 20,000exceeds
DWS&SCR 4.82possible
anthropogenic
4/29/2009 12:37 PM 1,200 exceed PCR 3.19possible
anthropogenic
5/29/2009 5:00 PM 200 exceed PCR 3.74possible
anthropogenic
6/24/2009 10:50 AM 2,000exceeds
DWS&SCR 3.67possible
anthropogenic
lakes not flowing to bayou

30
DEQ ID Latitude Longitude Site ID Site Description
Date sampled TOC
mFC/100 ml
Impact of Fecal
Coliforms* OBOB
indications** Comments
7/29/2009 2:00 PM 800 exceed PCR 4.14possible
anthropogenic Lafo-D1 29.798034839 -90.834472212 b-td Tiger Drive Bridge 7/10/2008 11:10 AM 1,181 exceed PCR 3.50
possible anthropogenic
7/22/2008 3:32 PM 180 none 3.07 none
10/7/2008 9:02 AM 50 none 3.80possible
anthropogenic 10/28/2008 5:11 PM 50 none 2.59 none 11/11/2008 6:50 AM 100 none 2.24 none 12/8/2008 12:20 PM 60 none 2.37 none
1/20/2009 12:21 AM 20 none 3.55possible
anthropogenic 2/18/2009 2:57 PM 160 none 2.28 none
3/27/2009 10:08 AM 9,600exceeds
DWS&SCR 5.08probable
anthropogenicpost major rain/flood
4/29/2009 4:08 PM 280 exceed PCR 2.47 none
5/13/2009 9:35 AM 260 exceed PCR 3.47possible
anthropogenic
6/10/2009 11:10 AM 160 none 3.54possible
anthropogenic
8/3/2009 7:05 PM 260 exceed PCR 3.46possible
anthropogenic
8/30/2009 10:15 AM 240 exceed PCR 3.38possible
anthropogenic
Lafo-D2 29.796923792 -90.824594641 Hwy1 - Lib
Jean Lafitte Library dock at B. Lafourche 9/30/2008 9:35 AM 40 none 3.06 none Ducks at site
10/7/2008 9:09 AM 40 none 3.92possible
anthropogenic 10/28/2008 5:42 PM 240 exceed PCR 2.38 none 11/11/2008 7:03 AM 380 exceed PCR 2.24 none 12/8/2008 12:10 PM 1,450 exceed PCR 2.51 none
1/20/2009 12:15 PM 160 none 3.75possible
anthropogenic 2/18/2009 2:48 PM 140 none 2.26 none
3/27/2009 10:00 AM 20,000exceeds
DWS&SCR 4.91possible
anthropogenicpost major rain/flood
31
DEQ ID Latitude Longitude Site ID Site Description
Date sampled TOC
mFC/100 ml
Impact of Fecal
Coliforms* OBOB
indications** Comments 4/29/2009 4:00 PM 300 exceed PCR 2.57 none
5/13/2009 9:30 AM 2,800exceeds
DWS&SCR 3.43possible
anthropogenic
6/10/2009 11:00 AM 1,140 exceed PCR 3.79possible
anthropogenic
8/3/2009 6:58 PM 10,000exceeds
DWS&SCR 3.81possible
anthropogenic
8/30/2009 10:10 AM 260 exceed PCR 3.82possible
anthropogenic Lafo-D3 29.797979003 -90.822411267 b-H20 Bridge HWY 20 7/10/2008 11:35 AM 6,364
exceeds DWS&SCR 3.30
possible anthropogenic
7/22/2008 3:50 PM 120 none 3.02 none
7/24/2008 4:30 AM 340 exceed PCR 3.15possible
anthropogenic 9/30/2008 9:50 AM 60 none 3.06 none
10/7/2008 9:18 AM 50 none 3.86possible
anthropogenic 10/28/2008 5:35 PM 190 none 2.42 none 11/11/2008 6:56 AM 250 exceed PCR 2.22 none 12/8/2008 12:05 PM 40 none 2.22 none
1/20/2009 12:11 PM 40 none 3.34possible
anthropogenic 2/18/2009 2:45 PM 80 none 2.38 none
3/27/2009 9:52 AM 16,000exceeds
DWS&SCR 5.16probable
anthropogenicpost major rain/flood
4/29/2009 3:54 PM 200 exceed PCR 2.57 none
5/13/2009 9:25 AM 3,040exceeds
DWS&SCR 3.43possible
anthropogenic
6/10/2009 10:55 AM 240 exceed PCR 3.51possible
anthropogenic
8/3/2009 6:55 PM 9,700exceeds
DWS&SCR 4.11possible
anthropogenic
8/30/2009 10:00 AM 440 exceed PCR 4.51possible
anthropogenic Lafo-D4 29.799071660 -90.820579387 308 CW 308 car wash 7/10/2008 11:54 AM 200,000
exceeds DWS&SCR 3.25
possible anthropogenic
Duck site - fresh grass
7/22/2008 4:05 PM 700 exceed PCR 3.03 none
32
DEQ ID Latitude Longitude Site ID Site Description
Date sampled TOC
mFC/100 ml
Impact of Fecal
Coliforms* OBOB
indications** Comments 10/28/2008 5:18 PM 1,200 exceed PCR 2.39 none 11/11/2008 7:18 AM 1,600 exceed PCR 2.76 none
12/8/2008 12:25 PM 520 exceed PCR 3.95possible
anthropogenic
1/20/2009 12:27 PM 100 none 3.81possible
anthropogenic 2/18/2009 3:05 PM 600 exceed PCR 2.76 none
3/27/2009 10:16 AM 10,000exceeds
DWS&SCR 3.25possible
anthropogenicpost major rain/flood
4/29/2009 4:17 PM 800 exceed PCR 2.54 none
5/13/2009 9:45 AM 2,500exceeds
DWS&SCR 3.48possible
anthropogenic
6/10/2009 11:20 AM 1,760 exceed PCR 3.56possible
anthropogenic
8/3/2009 7:15 PM 2,800exceeds
DWS&SCR 3.57possible
anthropogenic
8/30/2009 10:22 AM 440 exceed PCR 3.46possible
anthropogenic
Lafo-D5 29.799359016 -90.819485519 Thib-WP
Thibodaux Water Plant Intake 10/28/2008
water plant closed
11/11/2008 7:27 AM 160 none 2.18 none 12/8/2008 12:28 PM 60 none 2.29 none
1/20/2009 12:33 PM 140 none 3.27possible
anthropogenic 2/18/2009 3:10 PM 120 none 2.34 none
3/27/2009 10:21 AM 12,000exceeds
DWS&SCR 4.50possible
anthropogenic 4/29/2009 4:25 PM 320 exceed PCR 2.58 none
5/13/2009 water plant closed
6/10/2009 11:25 AM 600 exceed PCR 3.45possible
anthropogenic
8/3/2009 water plant closed
33
DEQ ID Latitude Longitude Site ID Site Description
Date sampled TOC
mFC/100 ml
Impact of Fecal
Coliforms* OBOB
indications** Comments
8/30/2009
water plant closed (Sunday)
Lafo-D6 29.797682875 -90.808601374 b-ped Pedestrian bridge 7/22/2008 4:30 PM 3,500
exceeds DWS&SCR 2.95 none
7/24/2008 4:40 PM 1,200 exceed PCR 3.13possible
anthropogenicno current 9/30/2008 9:55 AM 200 exceed PCR 3.08 none 10/28/2008 5:28 AM 170 none 2.39 none 11/11/2008 7:31 AM 110 none 2.46 none 12/8/2008 12:35 PM 60 none 2.31 none
1/20/2009 11:58 AM 80 none 3.49possible
anthropogenic 2/18/2009 2:35 PM 1,600 exceed PCR 2.41 none
3/27/2009 10:30 AM 60,000exceeds
DWS&SCR 4.67possible
anthropogenicpost major rain/flood
4/29/2009 4:35 PM 540 exceed PCR 2.27 none
5/13/2009 9:50 AM 1,900 exceed PCR 3.40possible
anthropogenic
6/10/2009 11:35 AM 180 none 3.33possible
anthropogenic
8/3/2009 7:25 PM 1,500 exceed PCR 4.08possible
anthropogenic
8/30/2009 10:33 AM 380 exceed PCR 3.35possible
anthropogenic Lafo-E1 29.788855544 -90.808597292 40A-PP
40 Arpent at Peltier Park 7/17/2008 7:50 AM 7,000
exceeds DWS&SCR 6.05
probable anthropogenic
10/14/2008 8:11 AM 3,200exceeds
DWS&SCR 7.03probable
anthropogenic
11/12/2008 9:50 AM 2,000exceeds
DWS&SCR 3.77possible
anthropogenicrainy
12/8/2008 3:45 PM 80 none 3.29possible
anthropogenic
1/21/2009 3:00 PM 40 none 3.25possible
anthropogenic
2/17/2009 8:38 AM 2,400exceeds
DWS&SCR 5.58probable
anthropogenic
34
DEQ ID Latitude Longitude Site ID Site Description
Date sampled TOC
mFC/100 ml
Impact of Fecal
Coliforms* OBOB
indications** Comments
3/25/2009 11:18 AM 1,600 exceed PCR 3.81possible
anthropogenic
5/3/2009 8:50 AM 1,600 exceed PCR 6.35probable
anthropogenic
5/20/2009 1:35 PM 580 exceed PCR 4.52possible
anthropogenic
6/24/2009 not enough water
8/3/2009 9:30 AM 380 exceed PCR 6.53probable
anthropogenic
8/29/2009 1:20 PM 5,000exceeds
DWS&SCR 4.98possible
anthropogenic Lafo-E2 29.796719524 -90.803282648 b-AD
Bridge at Audubon Drive 7/24/2008 4:50 PM 1,400 exceed PCR 3.22
possible anthropogenic
Ducks near site
10/14/2008 9:05 AM 1,500 exceed PCR 3.25possible
anthropogenic 11/12/2008 10:20 AM 100 none 2.17 none rainy 12/8/2008 4:20 PM 60 none 2.26 none
1/21/2009 3:30 PM 60 none 5.31probable
anthropogenic
2/17/2009 9:41 AM 520 exceed PCR 4.71possible
anthropogenic 3/25/2009 11:09 AM 460 exceed PCR 2.70 none
5/3/2009 9:20 AM 1,760 exceed PCR 4.00possible
anthropogenic 5/20/2009 1:30 PM 180 none 2.37 none 6/24/2009 3:15 PM 60 none 2.40 none
8/3/2009 10:55 AM 2,880exceeds
DWS&SCR 3.34possible
anthropogenic
8/29/2009 1:50 PM 1,000 exceed PCR 3.44possible
anthropogenic Lafo-E3 29.790268986 -90.789011435 b-S648
Bridge at Spur 648 7/16/2008 5:25 PM 1,500 exceed PCR 2.78 none
10/14/2008 8:55 AM 1,500 exceed PCR 3.26possible
anthropogenic 11/20/2008 10:11 AM 140 none 2.13 none rainy 12/8/2008 4:08 PM 40 none 2.27 none
35
DEQ ID Latitude Longitude Site ID Site Description
Date sampled TOC
mFC/100 ml
Impact of Fecal
Coliforms* OBOB
indications** Comments
1/21/2009 3:21 PM 60 none 3.31possible
anthropogenic
2/17/2009 9:22 AM 280 exceed PCR 4.73possible
anthropogenic 3/25/2009 11:05 AM 540 exceed PCR 2.50 none
5/3/2009 9:15 AM 2,200exceeds
DWS&SCR 3.58possible
anthropogenic
5/20/2009 1:20 PM 6,000exceeds
DWS&SCR 2.40 none 6/24/2009 3:45 PM 320 exceed PCR 2.40 none
8/3/2009 10:48 AM 2,460exceeds
DWS&SCR 3.60possible
anthropogenic 8/29/2009 1:45 PM 1,300 exceed PCR 2.55 none Lafo-E4 29.780375262 -90.779068281 C-RA-hwy1
Dugas Canal at Ronald Adams 7/9/2008 11:59 AM 96,360
exceeds DWS&SCR 2.85 none rainy
10/14/2008 8:30 AM 800 exceed PCR 3.30possible
anthropogenic 11/12/2008 10:00 AM 0 none 2.19 none not detected 12/8/2008 3:55 PM 0 none 2.52 none not detected
1/21/2009 3:09 AM 40 none 3.25possible
anthropogenic
2/17/2009 8:55 AM 600 exceed PCR 4.33possible
anthropogenic 3/25/2009 10:49 AM 140 none 2.58 none
5/3/2009 9:05 AM 1,140 exceed PCR 3.23possible
anthropogenic
5/20/2009 1:15 PM 110,000exceeds
DWS&SCR 2.41 none
6/24/2009 3:30 PM 2,000exceeds
DWS&SCR 2.40 none
8/3/2009 9:40 AM 540 exceed PCR 3.81possible
anthropogenic
8/29/2009 1:32 PM 20,000exceeds
DWS&SCR 3.69possible
anthropogenic Lafo-E5 29.768590473 -90.766556403 1265- LA1 1265 HWY LA1 7/9/2008 11:39 AM 57,272
exceeds DWS&SCR 7.05
probable anthropogenic
36
DEQ ID Latitude Longitude Site ID Site Description
Date sampled TOC
mFC/100 ml
Impact of Fecal
Coliforms* OBOB
indications** Comments
7/29/2008 11:50 AM 9,000exceeds
DWS&SCR 15.51anthropogenic
10/14/2008 8:40 AM 38,000exceeds
DWS&SCR 9.91probable
anthropogenic
11/12/2008 10:05 AM not enough water
12/8/2008 4:08 PM 81,000exceeds
DWS&SCR 5.78probable
anthropogenic
1/21/2009 not enough water
2/17/2009 9:10 AM 380 exceed PCR 6.88probable
anthropogenic
3/25/2009 not enough water
5/3/2009 not enough water
5/20/2009 not enough water
6/24/2009 not enough water
8/3/2009 not enough water
8/29/2009 not enough water
Lafo-F1 29.744363310 -90.768130927 40A at Lefort
40A at Lefort Canal 7/8/2008 7:47 AM 712 exceed PCR 3.94
possible anthropogenic
10/15/2008 10:29 AM 400 exceed PCR 8.15probable
anthropogenic
11/13/2008 12:40 PM 160 none 3.10possible
anthropogenic
12/1/2008 8:32 AM 260 exceed PCR 5.93probable
anthropogenic
1/21/2009 10:37 AM 60 none 3.52possible
anthropogenic
2/11/2009 11:46 AM 180 none 2.11 none rain earlier in the morning

37
DEQ ID Latitude Longitude Site ID Site Description
Date sampled TOC
mFC/100 ml
Impact of Fecal
Coliforms* OBOB
indications** Comments
4/1/2009 5:06 PM 200 exceed PCR 3.22possible
anthropogenic 4/30/2009 10:30 AM 60 none 2.65 none
5/19/2009 3:05 PM 220 exceed PCR 5.84probable
anthropogenic
7/2/2009 9:10 AM 180 none 3.11possible
anthropogenic
7/18/2009 1:45 PM 500 exceed PCR 3.54possible
anthropogenicpost major rain
9/2/2009 4:45 PM 700 exceed PCR 3.55possible
anthropogenic 7/8/2008 8:17 AM 1,730 exceed PCR 10.46anthropogenic
Lafo-F2 29.742190106 -90.768236778 PS-40A / LR
Pump station at Lefort Rd / 40 Arpent Canal 10/15/2008 10:31 AM 260 exceed PCR 7.01
probable anthropogenic
11/16/2008 12:50 PM 300 exceed PCR 6.56probable
anthropogenic
12/1/2008 8:44 AM 1,320 exceed PCR 7.06probable
anthropogenic
1/21/2009 10:41 AM 180 none 8.28probable
anthropogenic
2/11/2009 11:50 AM 1,080 exceed PCR 6.41probable
anthropogenicrain earlier in the morning
4/1/2009 5:12 PM 780 exceed PCR 7.14probable
anthropogenic
4/30/2009 10:38 AM 40 none 6.38probable
anthropogenic
5/19/2009 3:10 PM 40 none 7.86probable
anthropogenic
7/2/2009 9:15 AM 580 exceed PCR 7.24probable
anthropogenic
7/18/2009 1:50 PM 2,500exceeds
DWS&SCR 7.43probable
anthropogenicpost major rain
9/2/2009 4:52 PM 3,000exceeds
DWS&SCR 7.45probable
anthropogenic Lafo-F3 29.754182821 -90.727999199 b-LA1-SC
Bridge LA1 at St. Charles 7/8/2008 9:32 AM 227 exceed PCR 2.80 none
38
DEQ ID Latitude Longitude Site ID Site Description
Date sampled TOC
mFC/100 ml
Impact of Fecal
Coliforms* OBOB
indications** Comments 7/16/2008 5:20 PM 500 exceed PCR 2.58 none
10/15/2008 10:45 AM 80 none 3.16possible
anthropogenic
11/13/2008 1:11 AM 120 none 6.79probable
anthropogenic 12/10/2008 9:20 AM 280 exceed PCR 2.63 none
1/21/2009 11:01 AM 100 none 3.44possible
anthropogenic
2/11/2009 11:29 AM 100 none 2.10 none rain earlier in the morning
4/1/2009 4:56 PM 160 none 3.00 none 4/30/2009 11:10 AM 100 none 2.17 none 5/19/2009 3:35 PM 200 exceed PCR 2.71 none 7/2/2009 9:40 AM 60 none 3.01 none 7/18/2009 2:15 PM 1,150 exceed PCR 2.87 none post major rain 9/2/2009 5:20 PM 700 exceed PCR 2.87 none Lafo-F5 29.744760803 -90.730964572 321 SC
321 St. Charles Bypass 7/8/2008 9:10 AM 10,900
exceeds DWS&SCR 9.35
probable anthropogenic
10/15/2008 11:00 AM 150 none 15.07anthropogenic
11/13/2008 1:21 AM 3,460exceeds
DWS&SCR 13.50anthropogenic
12/10/2008 9:13 AM 110,000exceeds
DWS&SCR 11.16anthropogenic
1/21/2009 10:52 AM 7,900exceeds
DWS&SCR 6.48probable
anthropogenic
2/11/2009 11:05 AM 4,100exceeds
DWS&SCR 7.39probable
anthropogenicrain earlier in the morning
4/1/2009 4:45 PM 140 none 7.64probable
anthropogenic
4/30/2009 10:52 AM 300,000exceeds
DWS&SCR 12.56anthropogenic
5/19/2009 3:30 PM 100,000exceeds
DWS&SCR 7.75probable
anthropogenic
7/2/2009 not enough water
7/18/2009 2:05 PM 30,000exceeds
DWS&SCR 10.76anthropogenicpost major rain
39
DEQ ID Latitude Longitude Site ID Site Description
Date sampled TOC
mFC/100 ml
Impact of Fecal
Coliforms* OBOB
indications** Comments
9/2/2009 5:00 PM 28,000exceeds
DWS&SCR 11.71anthropogenic
Lafo-F6 29.733096861 -90.734706534 b-40A-SC
Bridge over 40 Arpent at St. Charles 7/8/2008 8:52 AM 243 exceed PCR 4.20
possible anthropogenic
10/15/2008
no sample due to vegetation blockage
11/13/2008 1:26 AM 40 none 2.04 none
12/10/2008 9:02 AM 180 none 4.97possible
anthropogenic
1/21/2009 10:56 AM 140 none 6.18probable
anthropogenic
2/11/2009 11:15 AM 60 none 2.40 none rain earlier in the morning
4/1/2009 4:50 PM 300 exceed PCR 3.34possible
anthropogenic
4/30/2009 11:00 AM 40 none 7.54probable
anthropogenic
5/19/2009 3:25 PM 100 none 6.55probable
anthropogenic
7/2/2009 9:30 AM 300 exceed PCR 3.41possible
anthropogenic
7/18/2009 2:09 PM 1,850 exceed PCR 6.43probable
anthropogenicpost major rain
9/2/2009 5:10 PM 2,300exceeds
DWS&SCR 6.47probable
anthropogenic Lafo-G1 29.723710782 -90.661639507 4ptc-g-40A
4 point canal gate (40A side) 7/17/2008 11:42 AM 200 exceed PCR 3.14
possible anthropogenic
10/28/2008 6:12 PM 20 none 4.01possible
anthropogenic
11/18/2008 8:56 AM 0 none 2.88 none Less Than Detectable
12/11/2008 12:05 PM 340 exceed PCR 5.21probable
anthropogenic
1/21/2009 2:00 PM 0 none 2.38 none Less Than Detectable
40
DEQ ID Latitude Longitude Site ID Site Description
Date sampled TOC
mFC/100 ml
Impact of Fecal
Coliforms* OBOB
indications** Comments 2/18/2009 2:00 PM 180 none 2.38 none
3/27/2009 10:55 AM 14,000exceeds
DWS&SCR 3.11possible
anthropogenicPost Major Rain/Flood
5/1/2009 5:45 PM 140 none 2.56 none
5/20/2009 9:05 AM 220 exceed PCR 4.69possible
anthropogenic
6/10/2009 12:00 PM 80 none 3.35possible
anthropogenicGates Closed
7/18/2009 3:40 PM 25,000exceeds
DWS&SCR 3.24possible
anthropogenicPost Major Rain
8/31/2009 10:09 AM 980 exceed PCR 3.24possible
anthropogenic Lafo-G2 29.734993403 -90.660589030 4ptc-g-b
4 point canal gate (bayou) 7/17/2008 11:40 AM 900 exceed PCR 2.83 none
10/28/2008 6:20 PM 40 none 2.49 none 11/18/2008 9:11 AM 20 none 2.21 none 12/10/2008 12:10 PM 160 none 2.53 none 1/21/2009 2:06 PM 40 none 2.82 none 2/18/2009 2:08 PM 40 none 2.41 none
3/27/2009 11:00 AM 1,100 exceed PCR 3.10possible
anthropogenicpost major rain/flood
5/1/2009 5:53 PM 260 exceed PCR 2.32 none
5/20/2009 9:10 AM 1,600 exceed PCR 3.79possible
anthropogenic
6/10/2009 12:05 PM 60 none 3.16possible
anthropogenic
gates closed/ not flowing to bayou
7/18/2009 3:45 PM 1,200 exceed PCR 3.11possible
anthropogenic
post major rain/ clogged with vegetation
8/31/2009 10:19 AM 2,400exceeds
DWS&SCR 3.12possible
anthropogenic Lafo-G3 29.737707404 -90.660360099 b-LA1-4PT
Bridge HWY LA1 at 4PT 7/8/2008 10:10 AM 1,545 exceed PCR 2.94 none
7/16/2008 5:00 PM 290 exceed PCR 2.48 none duck weed 10/28/2008 6:25 PM 40 none 2.38 none 11/18/2008 9:15 AM 40 none 2.10 none
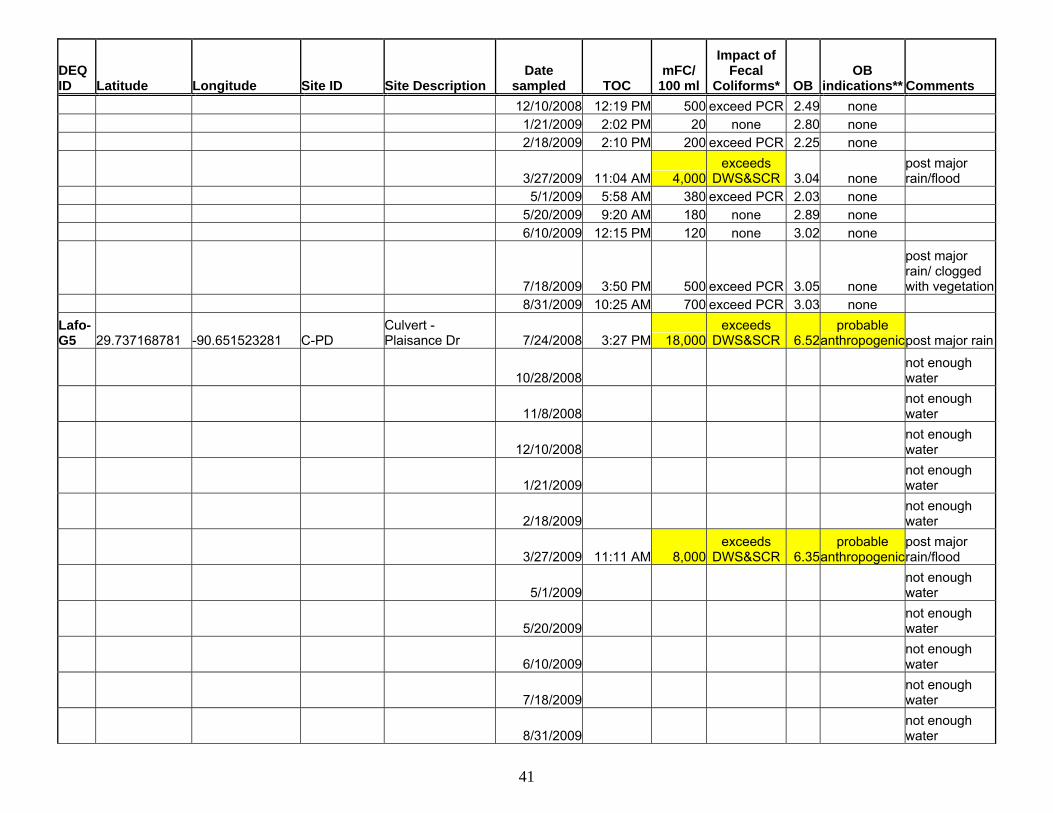
41
DEQ ID Latitude Longitude Site ID Site Description
Date sampled TOC
mFC/100 ml
Impact of Fecal
Coliforms* OBOB
indications** Comments 12/10/2008 12:19 PM 500 exceed PCR 2.49 none 1/21/2009 2:02 PM 20 none 2.80 none 2/18/2009 2:10 PM 200 exceed PCR 2.25 none
3/27/2009 11:04 AM 4,000exceeds
DWS&SCR 3.04 none post major rain/flood
5/1/2009 5:58 AM 380 exceed PCR 2.03 none 5/20/2009 9:20 AM 180 none 2.89 none 6/10/2009 12:15 PM 120 none 3.02 none
7/18/2009 3:50 PM 500 exceed PCR 3.05 none
post major rain/ clogged with vegetation
8/31/2009 10:25 AM 700 exceed PCR 3.03 none Lafo-G5 29.737168781 -90.651523281 C-PD
Culvert - Plaisance Dr 7/24/2008 3:27 PM 18,000
exceeds DWS&SCR 6.52
probable anthropogenicpost major rain
10/28/2008 not enough water
11/8/2008 not enough water
12/10/2008 not enough water
1/21/2009 not enough water
2/18/2009 not enough water
3/27/2009 11:11 AM 8,000exceeds
DWS&SCR 6.35probable
anthropogenicpost major rain/flood
5/1/2009 not enough water
5/20/2009 not enough water
6/10/2009 not enough water
7/18/2009 not enough water
8/31/2009 not enough water
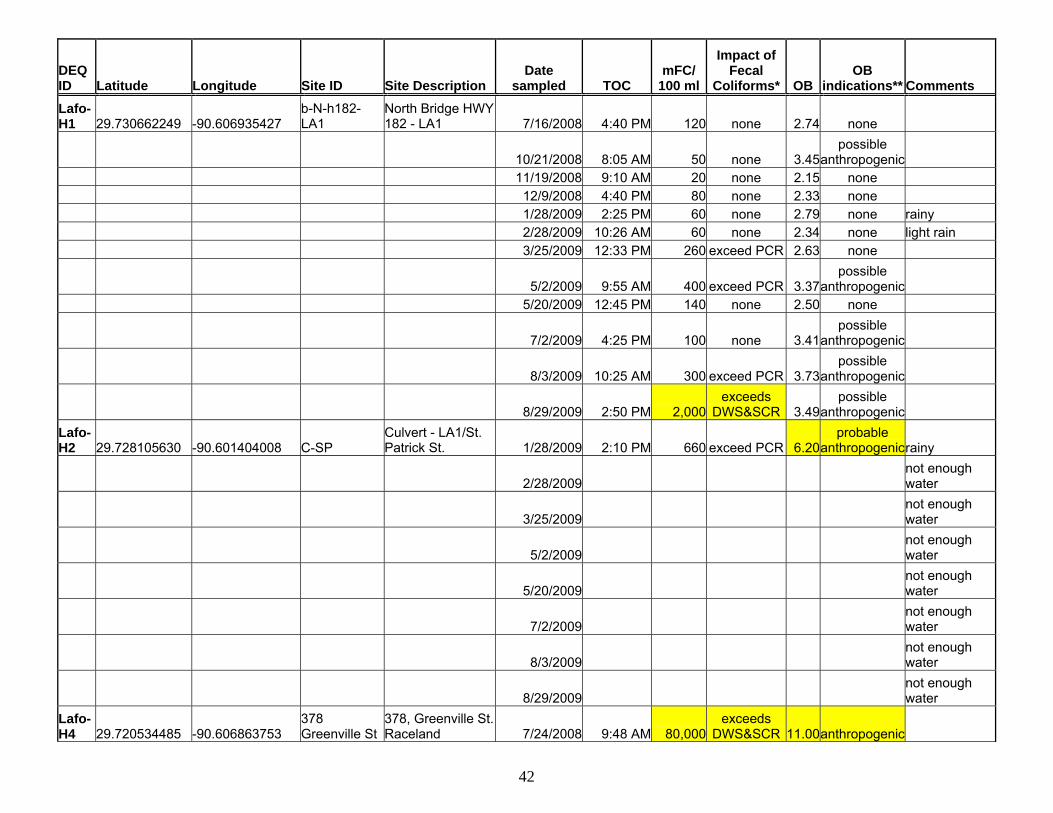
42
DEQ ID Latitude Longitude Site ID Site Description
Date sampled TOC
mFC/100 ml
Impact of Fecal
Coliforms* OBOB
indications** Comments Lafo-H1 29.730662249 -90.606935427
b-N-h182-LA1
North Bridge HWY 182 - LA1 7/16/2008 4:40 PM 120 none 2.74 none
10/21/2008 8:05 AM 50 none 3.45possible
anthropogenic 11/19/2008 9:10 AM 20 none 2.15 none 12/9/2008 4:40 PM 80 none 2.33 none 1/28/2009 2:25 PM 60 none 2.79 none rainy 2/28/2009 10:26 AM 60 none 2.34 none light rain 3/25/2009 12:33 PM 260 exceed PCR 2.63 none
5/2/2009 9:55 AM 400 exceed PCR 3.37possible
anthropogenic 5/20/2009 12:45 PM 140 none 2.50 none
7/2/2009 4:25 PM 100 none 3.41possible
anthropogenic
8/3/2009 10:25 AM 300 exceed PCR 3.73possible
anthropogenic
8/29/2009 2:50 PM 2,000exceeds
DWS&SCR 3.49possible
anthropogenic Lafo-H2 29.728105630 -90.601404008 C-SP
Culvert - LA1/St. Patrick St. 1/28/2009 2:10 PM 660 exceed PCR 6.20
probable anthropogenicrainy
2/28/2009 not enough water
3/25/2009 not enough water
5/2/2009 not enough water
5/20/2009 not enough water
7/2/2009 not enough water
8/3/2009 not enough water
8/29/2009 not enough water
Lafo-H4 29.720534485 -90.606863753
378 Greenville St
378, Greenville St. Raceland 7/24/2008 9:48 AM 80,000
exceeds DWS&SCR 11.00anthropogenic
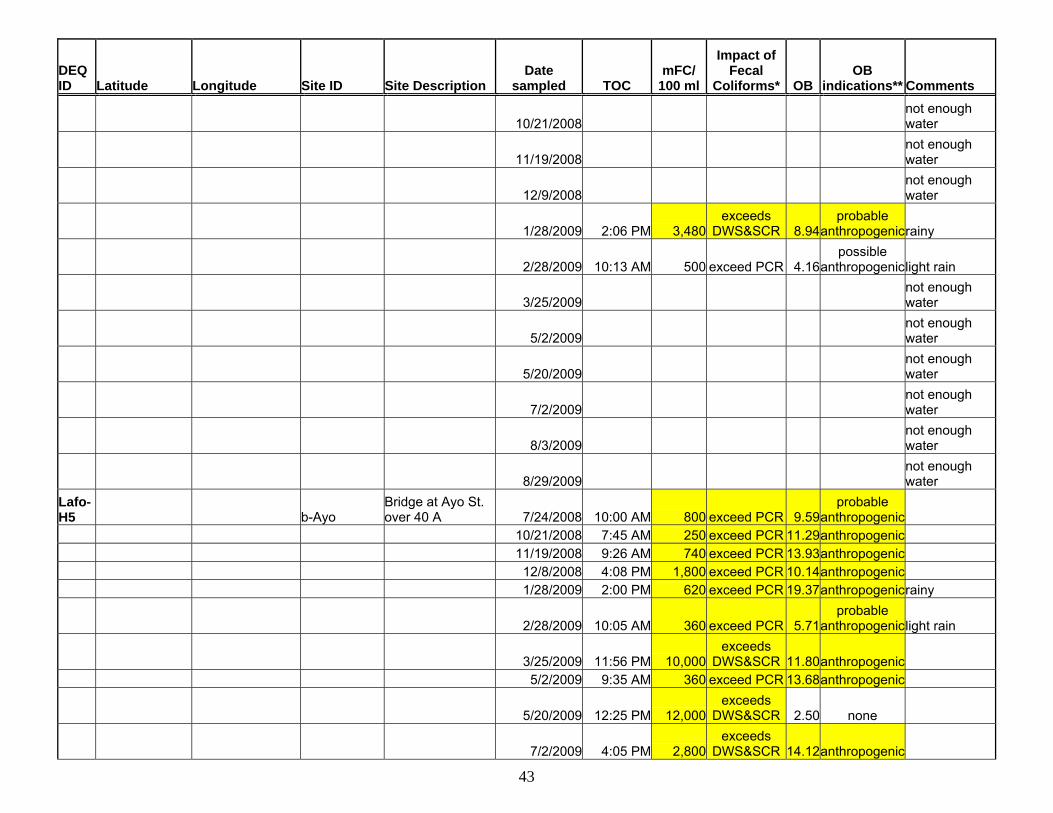
43
DEQ ID Latitude Longitude Site ID Site Description
Date sampled TOC
mFC/100 ml
Impact of Fecal
Coliforms* OBOB
indications** Comments
10/21/2008 not enough water
11/19/2008 not enough water
12/9/2008 not enough water
1/28/2009 2:06 PM 3,480exceeds
DWS&SCR 8.94probable
anthropogenicrainy
2/28/2009 10:13 AM 500 exceed PCR 4.16possible
anthropogeniclight rain
3/25/2009 not enough water
5/2/2009 not enough water
5/20/2009 not enough water
7/2/2009 not enough water
8/3/2009 not enough water
8/29/2009 not enough water
Lafo-H5 b-Ayo
Bridge at Ayo St. over 40 A 7/24/2008 10:00 AM 800 exceed PCR 9.59
probable anthropogenic
10/21/2008 7:45 AM 250 exceed PCR 11.29anthropogenic 11/19/2008 9:26 AM 740 exceed PCR 13.93anthropogenic 12/8/2008 4:08 PM 1,800 exceed PCR 10.14anthropogenic 1/28/2009 2:00 PM 620 exceed PCR 19.37anthropogenicrainy
2/28/2009 10:05 AM 360 exceed PCR 5.71probable
anthropogeniclight rain
3/25/2009 11:56 PM 10,000exceeds
DWS&SCR 11.80anthropogenic 5/2/2009 9:35 AM 360 exceed PCR 13.68anthropogenic
5/20/2009 12:25 PM 12,000exceeds
DWS&SCR 2.50 none
7/2/2009 4:05 PM 2,800exceeds
DWS&SCR 14.12anthropogenic

44
DEQ ID Latitude Longitude Site ID Site Description
Date sampled TOC
mFC/100 ml
Impact of Fecal
Coliforms* OBOB
indications** Comments
8/3/2009 10:05 AM 2,500exceeds
DWS&SCR 13.87anthropogenic
8/29/2009 2:30 PM 18,000exceeds
DWS&SCR 11.91anthropogenic Lafo-H6 29.727713031 -90.598681322 b-h182-LA1
Bridge HWY 182 and LA1 7/9/2008 10:53 AM 345 exceed PCR 2.81 none
7/16/2008 4:25 PM 130 none 2.79 none
water movement and duck weed
10/21/2008 7:35 AM 30 none 3.17possible
anthropogenic 11/19/2008 9:45 AM 120 none 2.08 none 12/9/2008 4:30 PM 40 none 2.29 none 1/28/2009 2:20 AM 140 none 2.93 none rainy 2/28/2009 10:20 AM 100 none 2.34 none light rain 3/25/2009 12:25 PM 180 none 2.44 none
5/2/2009 9:45 AM 540 exceed PCR 3.31possible
anthropogenic
5/20/2009 12:40 PM 0 none 4.63possible
anthropogenic
7/2/2009 4:18 PM 200 exceed PCR 3.21possible
anthropogenic
8/3/2009 10:20 AM 200 exceed PCR 4.37possible
anthropogenic
8/29/2009 2:45 PM 3,400exceeds
DWS&SCR 2.33 none
Lafo-I1 29.687689632 -90.580203965 40A - SLCC
40A Canal at Sugarland Country Club 8/11/2008 10:40 AM 2,800
exceeds DWS&SCR 8.84
probable anthropogenic
10/22/2008 10:45 AM 3,200exceeds
DWS&SCR
too much debris in sample no OB available
12/10/2008 2:56 PM 3,000exceeds
DWS&SCR 8.38probable
anthropogenic
1/7/2009 10:25 AM 3,500exceeds
DWS&SCR 8.42probable
anthropogenic
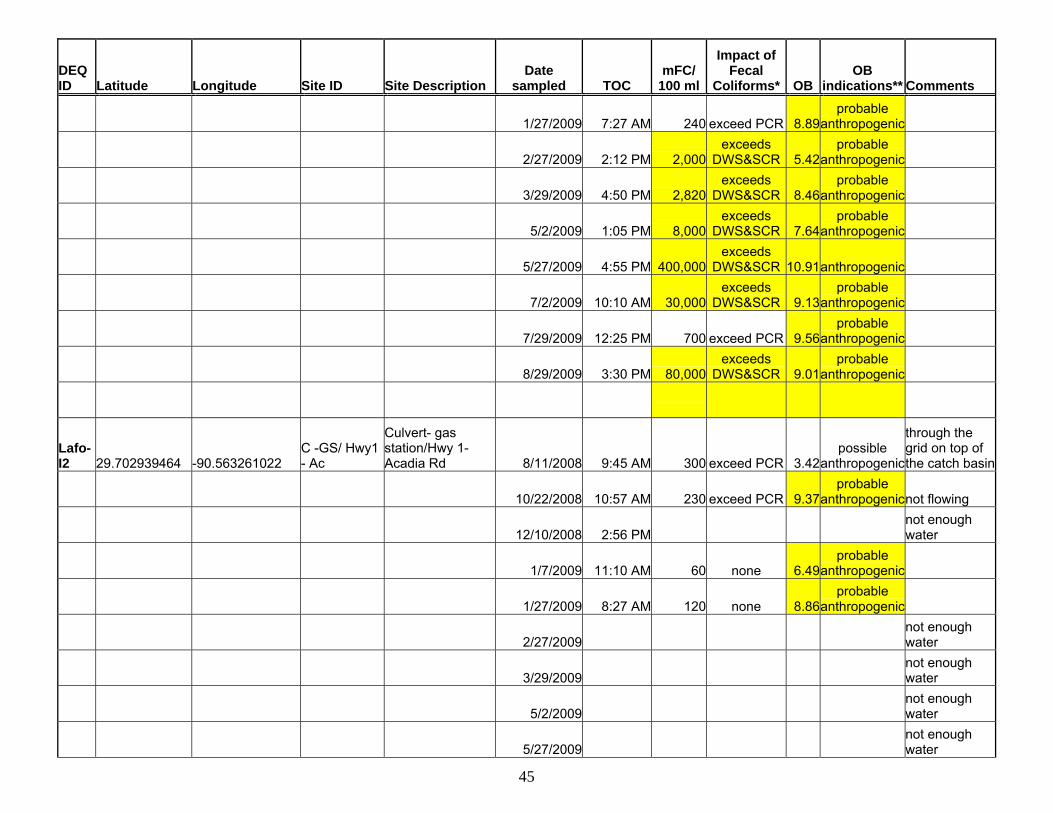
45
DEQ ID Latitude Longitude Site ID Site Description
Date sampled TOC
mFC/100 ml
Impact of Fecal
Coliforms* OBOB
indications** Comments
1/27/2009 7:27 AM 240 exceed PCR 8.89probable
anthropogenic
2/27/2009 2:12 PM 2,000exceeds
DWS&SCR 5.42probable
anthropogenic
3/29/2009 4:50 PM 2,820exceeds
DWS&SCR 8.46probable
anthropogenic
5/2/2009 1:05 PM 8,000exceeds
DWS&SCR 7.64probable
anthropogenic
5/27/2009 4:55 PM 400,000exceeds
DWS&SCR 10.91anthropogenic
7/2/2009 10:10 AM 30,000exceeds
DWS&SCR 9.13probable
anthropogenic
7/29/2009 12:25 PM 700 exceed PCR 9.56probable
anthropogenic
8/29/2009 3:30 PM 80,000exceeds
DWS&SCR 9.01probable
anthropogenic
Lafo-I2 29.702939464 -90.563261022
C -GS/ Hwy1 - Ac
Culvert- gas station/Hwy 1- Acadia Rd 8/11/2008 9:45 AM 300 exceed PCR 3.42
possible anthropogenic
through the grid on top of the catch basin
10/22/2008 10:57 AM 230 exceed PCR 9.37probable
anthropogenicnot flowing
12/10/2008 2:56 PM not enough water
1/7/2009 11:10 AM 60 none 6.49probable
anthropogenic
1/27/2009 8:27 AM 120 none 8.86probable
anthropogenic
2/27/2009 not enough water
3/29/2009 not enough water
5/2/2009 not enough water
5/27/2009 not enough water

46
DEQ ID Latitude Longitude Site ID Site Description
Date sampled TOC
mFC/100 ml
Impact of Fecal
Coliforms* OBOB
indications** Comments
7/2/2009 not enough water
7/29/2009 not enough water
8/29/2009 not enough water
Lafo-I3 29.702907359 -90.563512541
C-Hwy1 - Ac Rd
Culvert Hwy 1- Acadia Rd Bank 8/11/2008 10:08 AM 1,000 exceed PCR 6.34
probable anthropogenic
through the grid on top of the catch basin
10/22/2008 not enough water
12/10/2008 not enough water
1/7/2009 10:45 AM 200 exceed PCR 5.31probable
anthropogenic
1/27/2009 7:48 AM 1,220 exceed PCR 6.48probable
anthropogenic
through the grid on top of the catch basin
2/27/2009 not enough water
3/29/2009 5:00 PM 1,780 exceed PCR 5.98probable
anthropogenic
5/2/2009 not enough water
5/27/2009 not enough water
7/2/2009 not enough water
7/29/2009 not enough water
8/29/2009 not enough water
Lafo-I4 29.701787886 -90.564125753 D-AR-R
Ditch (Acadia Rd/ Raceland) 10/22/2008
not enough water
12/10/2008 not enough water
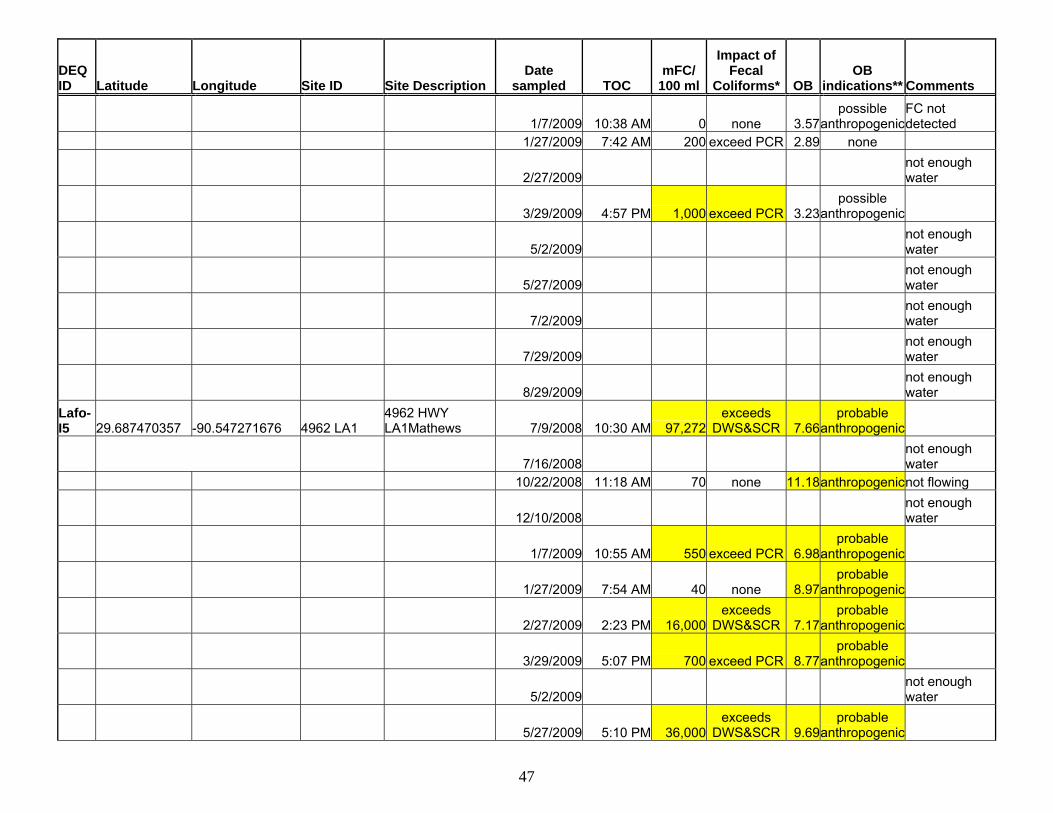
47
DEQ ID Latitude Longitude Site ID Site Description
Date sampled TOC
mFC/100 ml
Impact of Fecal
Coliforms* OBOB
indications** Comments
1/7/2009 10:38 AM 0 none 3.57possible
anthropogenicFC not detected
1/27/2009 7:42 AM 200 exceed PCR 2.89 none
2/27/2009 not enough water
3/29/2009 4:57 PM 1,000 exceed PCR 3.23possible
anthropogenic
5/2/2009 not enough water
5/27/2009 not enough water
7/2/2009 not enough water
7/29/2009 not enough water
8/29/2009 not enough water
Lafo-I5 29.687470357 -90.547271676 4962 LA1
4962 HWY LA1Mathews 7/9/2008 10:30 AM 97,272
exceeds DWS&SCR 7.66
probable anthropogenic
7/16/2008 not enough water
10/22/2008 11:18 AM 70 none 11.18anthropogenicnot flowing
12/10/2008 not enough water
1/7/2009 10:55 AM 550 exceed PCR 6.98probable
anthropogenic
1/27/2009 7:54 AM 40 none 8.97probable
anthropogenic
2/27/2009 2:23 PM 16,000exceeds
DWS&SCR 7.17probable
anthropogenic
3/29/2009 5:07 PM 700 exceed PCR 8.77probable
anthropogenic
5/2/2009 not enough water
5/27/2009 5:10 PM 36,000exceeds
DWS&SCR 9.69probable
anthropogenic
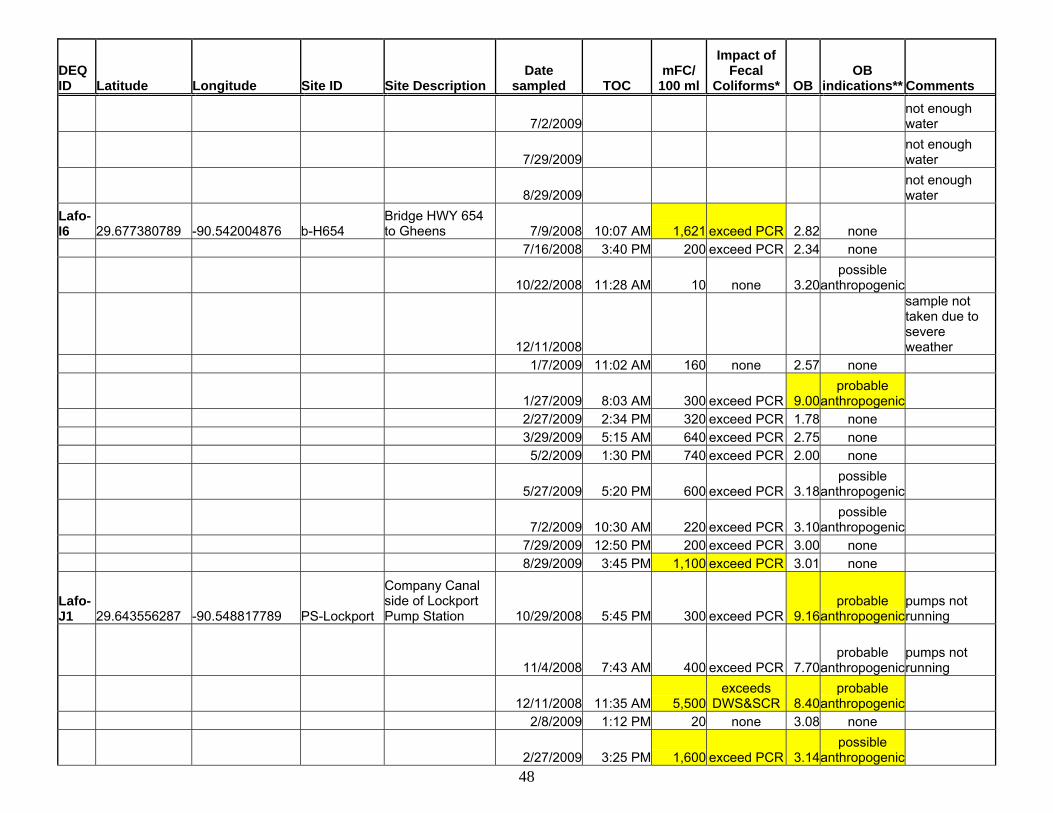
48
DEQ ID Latitude Longitude Site ID Site Description
Date sampled TOC
mFC/100 ml
Impact of Fecal
Coliforms* OBOB
indications** Comments
7/2/2009 not enough water
7/29/2009 not enough water
8/29/2009 not enough water
Lafo-I6 29.677380789 -90.542004876 b-H654
Bridge HWY 654 to Gheens 7/9/2008 10:07 AM 1,621 exceed PCR 2.82 none
7/16/2008 3:40 PM 200 exceed PCR 2.34 none
10/22/2008 11:28 AM 10 none 3.20possible
anthropogenic
12/11/2008
sample not taken due to severe weather
1/7/2009 11:02 AM 160 none 2.57 none
1/27/2009 8:03 AM 300 exceed PCR 9.00probable
anthropogenic 2/27/2009 2:34 PM 320 exceed PCR 1.78 none 3/29/2009 5:15 AM 640 exceed PCR 2.75 none 5/2/2009 1:30 PM 740 exceed PCR 2.00 none
5/27/2009 5:20 PM 600 exceed PCR 3.18possible
anthropogenic
7/2/2009 10:30 AM 220 exceed PCR 3.10possible
anthropogenic 7/29/2009 12:50 PM 200 exceed PCR 3.00 none 8/29/2009 3:45 PM 1,100 exceed PCR 3.01 none
Lafo-J1 29.643556287 -90.548817789 PS-Lockport
Company Canal side of Lockport Pump Station 10/29/2008 5:45 PM 300 exceed PCR 9.16
probable anthropogenic
pumps not running
11/4/2008 7:43 AM 400 exceed PCR 7.70probable
anthropogenicpumps not running
12/11/2008 11:35 AM 5,500exceeds
DWS&SCR 8.40probable
anthropogenic 2/8/2009 1:12 PM 20 none 3.08 none
2/27/2009 3:25 PM 1,600 exceed PCR 3.14possible
anthropogenic
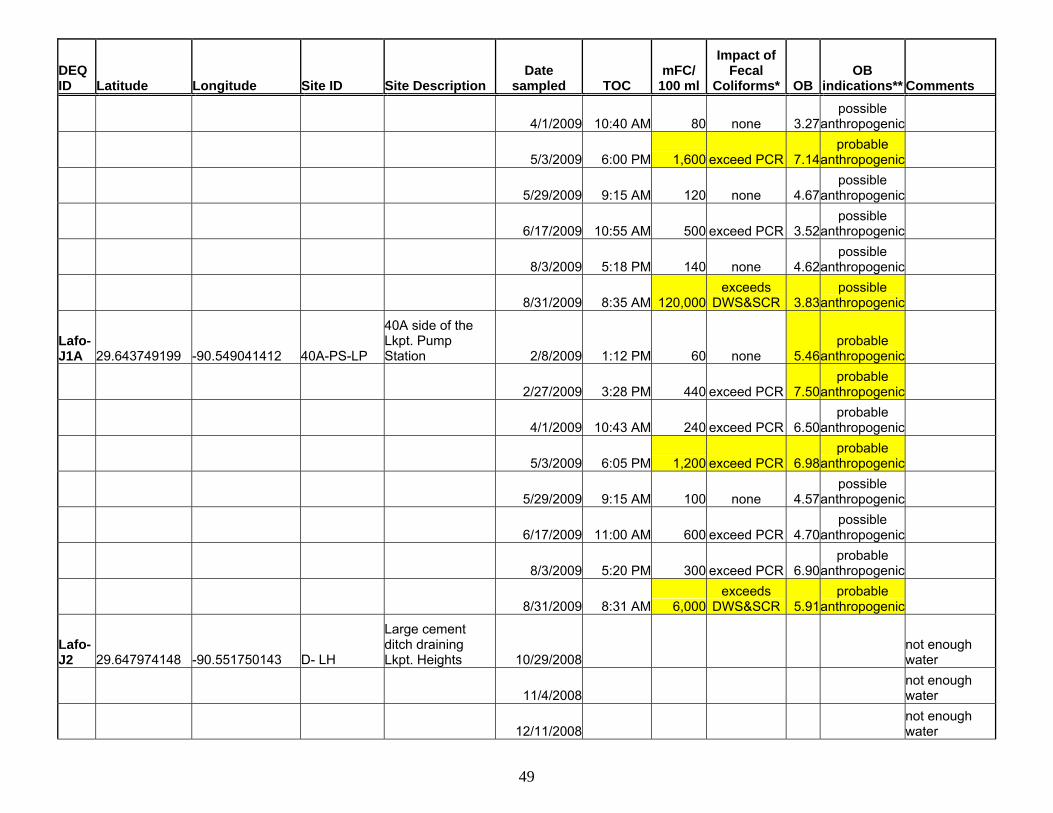
49
DEQ ID Latitude Longitude Site ID Site Description
Date sampled TOC
mFC/100 ml
Impact of Fecal
Coliforms* OBOB
indications** Comments
4/1/2009 10:40 AM 80 none 3.27possible
anthropogenic
5/3/2009 6:00 PM 1,600 exceed PCR 7.14probable
anthropogenic
5/29/2009 9:15 AM 120 none 4.67possible
anthropogenic
6/17/2009 10:55 AM 500 exceed PCR 3.52possible
anthropogenic
8/3/2009 5:18 PM 140 none 4.62possible
anthropogenic
8/31/2009 8:35 AM 120,000exceeds
DWS&SCR 3.83possible
anthropogenic
Lafo-J1A 29.643749199 -90.549041412 40A-PS-LP
40A side of the Lkpt. Pump Station 2/8/2009 1:12 PM 60 none 5.46
probable anthropogenic
2/27/2009 3:28 PM 440 exceed PCR 7.50probable
anthropogenic
4/1/2009 10:43 AM 240 exceed PCR 6.50probable
anthropogenic
5/3/2009 6:05 PM 1,200 exceed PCR 6.98probable
anthropogenic
5/29/2009 9:15 AM 100 none 4.57possible
anthropogenic
6/17/2009 11:00 AM 600 exceed PCR 4.70possible
anthropogenic
8/3/2009 5:20 PM 300 exceed PCR 6.90probable
anthropogenic
8/31/2009 8:31 AM 6,000exceeds
DWS&SCR 5.91probable
anthropogenic
Lafo-J2 29.647974148 -90.551750143 D- LH
Large cement ditch draining Lkpt. Heights 10/29/2008
not enough water
11/4/2008 not enough water
12/11/2008 not enough water
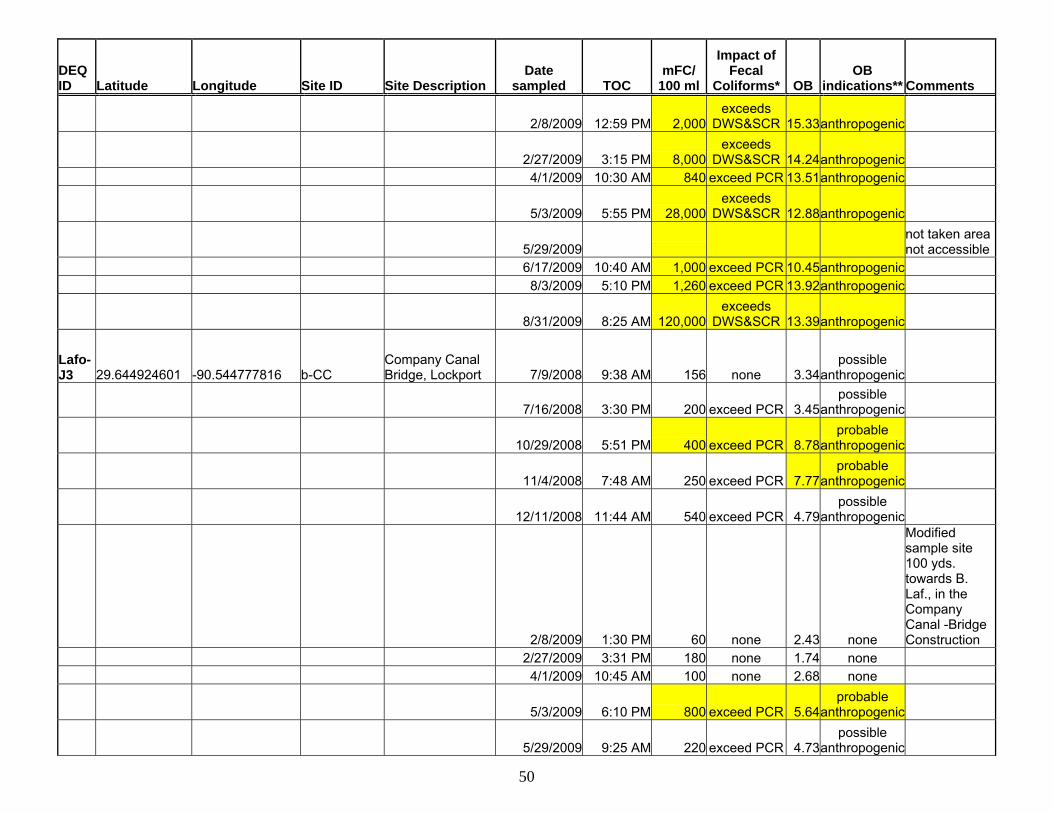
50
DEQ ID Latitude Longitude Site ID Site Description
Date sampled TOC
mFC/100 ml
Impact of Fecal
Coliforms* OBOB
indications** Comments
2/8/2009 12:59 PM 2,000exceeds
DWS&SCR 15.33anthropogenic
2/27/2009 3:15 PM 8,000exceeds
DWS&SCR 14.24anthropogenic 4/1/2009 10:30 AM 840 exceed PCR 13.51anthropogenic
5/3/2009 5:55 PM 28,000exceeds
DWS&SCR 12.88anthropogenic
5/29/2009 not taken area not accessible
6/17/2009 10:40 AM 1,000 exceed PCR 10.45anthropogenic 8/3/2009 5:10 PM 1,260 exceed PCR 13.92anthropogenic
8/31/2009 8:25 AM 120,000exceeds
DWS&SCR 13.39anthropogenic
Lafo-J3 29.644924601 -90.544777816 b-CC
Company Canal Bridge, Lockport 7/9/2008 9:38 AM 156 none 3.34
possible anthropogenic
7/16/2008 3:30 PM 200 exceed PCR 3.45possible
anthropogenic
10/29/2008 5:51 PM 400 exceed PCR 8.78probable
anthropogenic
11/4/2008 7:48 AM 250 exceed PCR 7.77probable
anthropogenic
12/11/2008 11:44 AM 540 exceed PCR 4.79possible
anthropogenic
2/8/2009 1:30 PM 60 none 2.43 none
Modified sample site 100 yds. towards B. Laf., in the Company Canal -Bridge Construction
2/27/2009 3:31 PM 180 none 1.74 none 4/1/2009 10:45 AM 100 none 2.68 none
5/3/2009 6:10 PM 800 exceed PCR 5.64probable
anthropogenic
5/29/2009 9:25 AM 220 exceed PCR 4.73possible
anthropogenic
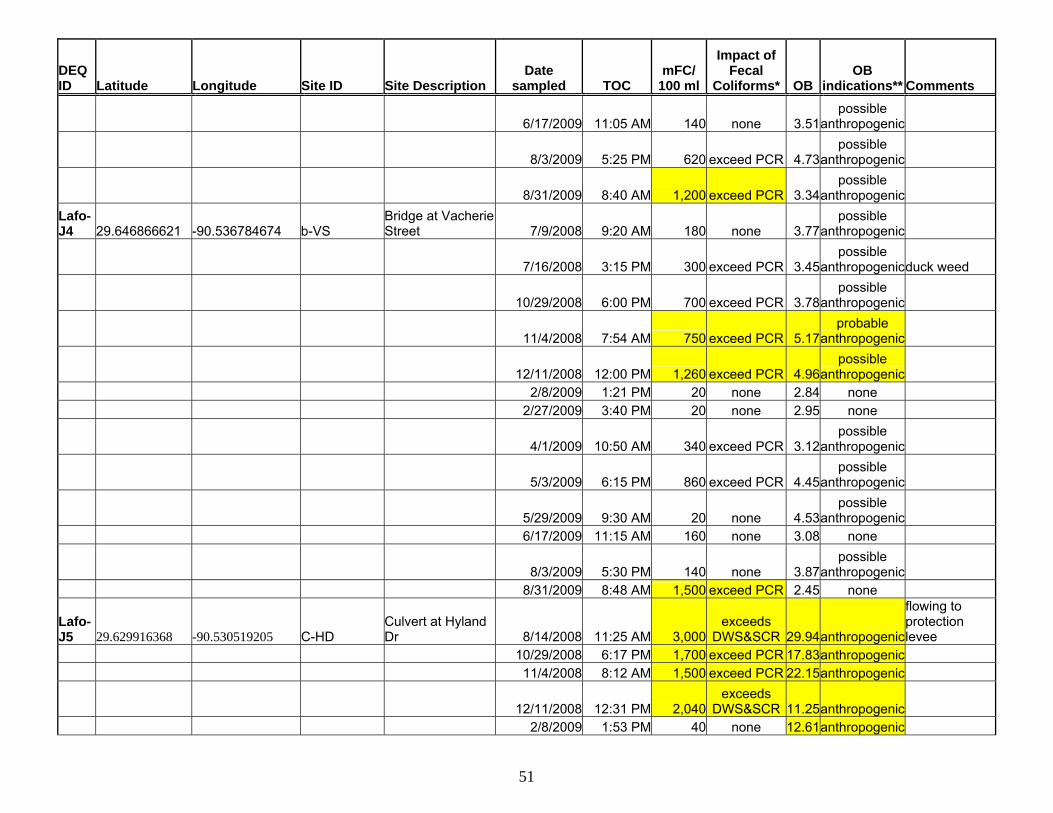
51
DEQ ID Latitude Longitude Site ID Site Description
Date sampled TOC
mFC/100 ml
Impact of Fecal
Coliforms* OBOB
indications** Comments
6/17/2009 11:05 AM 140 none 3.51possible
anthropogenic
8/3/2009 5:25 PM 620 exceed PCR 4.73possible
anthropogenic
8/31/2009 8:40 AM 1,200 exceed PCR 3.34possible
anthropogenic Lafo-J4 29.646866621 -90.536784674 b-VS
Bridge at VacherieStreet 7/9/2008 9:20 AM 180 none 3.77
possible anthropogenic
7/16/2008 3:15 PM 300 exceed PCR 3.45possible
anthropogenicduck weed
10/29/2008 6:00 PM 700 exceed PCR 3.78possible
anthropogenic
11/4/2008 7:54 AM 750 exceed PCR 5.17probable
anthropogenic
12/11/2008 12:00 PM 1,260 exceed PCR 4.96possible
anthropogenic 2/8/2009 1:21 PM 20 none 2.84 none 2/27/2009 3:40 PM 20 none 2.95 none
4/1/2009 10:50 AM 340 exceed PCR 3.12possible
anthropogenic
5/3/2009 6:15 PM 860 exceed PCR 4.45possible
anthropogenic
5/29/2009 9:30 AM 20 none 4.53possible
anthropogenic 6/17/2009 11:15 AM 160 none 3.08 none
8/3/2009 5:30 PM 140 none 3.87possible
anthropogenic 8/31/2009 8:48 AM 1,500 exceed PCR 2.45 none
Lafo-J5 29.629916368 -90.530519205 C-HD
Culvert at Hyland Dr 8/14/2008 11:25 AM 3,000
exceeds DWS&SCR 29.94anthropogenic
flowing to protection levee
10/29/2008 6:17 PM 1,700 exceed PCR 17.83anthropogenic 11/4/2008 8:12 AM 1,500 exceed PCR 22.15anthropogenic
12/11/2008 12:31 PM 2,040exceeds
DWS&SCR 11.25anthropogenic 2/8/2009 1:53 PM 40 none 12.61anthropogenic
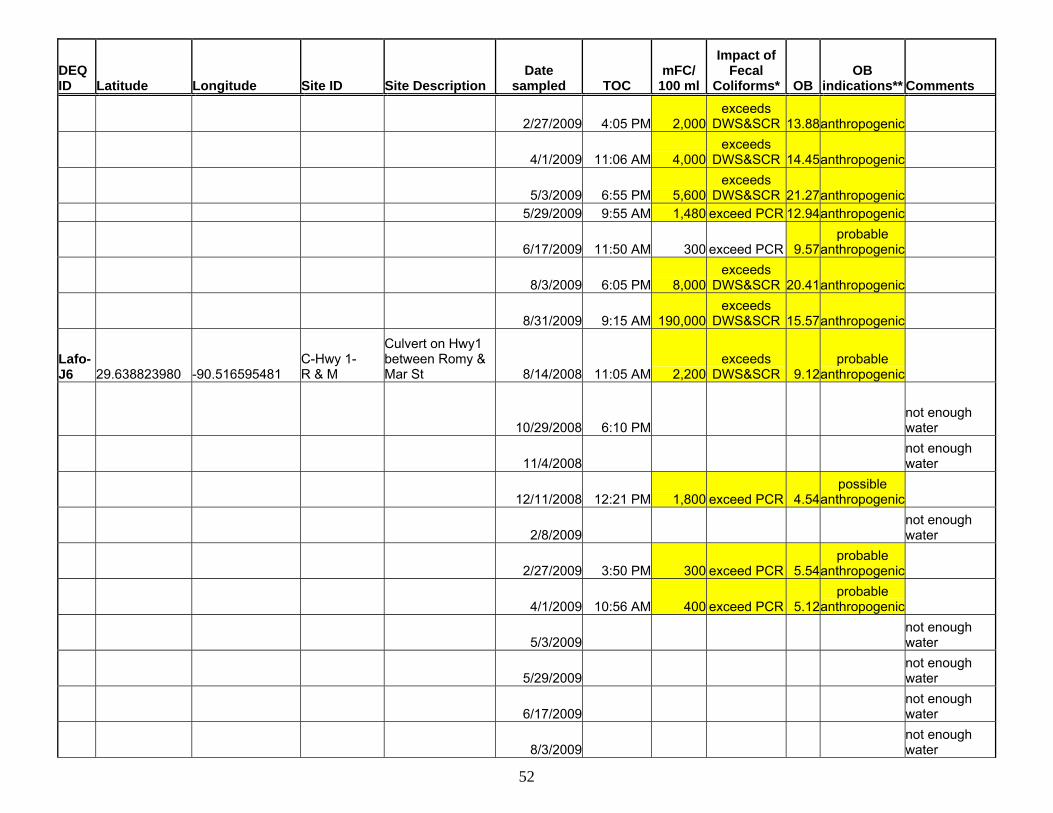
52
DEQ ID Latitude Longitude Site ID Site Description
Date sampled TOC
mFC/100 ml
Impact of Fecal
Coliforms* OBOB
indications** Comments
2/27/2009 4:05 PM 2,000exceeds
DWS&SCR 13.88anthropogenic
4/1/2009 11:06 AM 4,000exceeds
DWS&SCR 14.45anthropogenic
5/3/2009 6:55 PM 5,600exceeds
DWS&SCR 21.27anthropogenic 5/29/2009 9:55 AM 1,480 exceed PCR 12.94anthropogenic
6/17/2009 11:50 AM 300 exceed PCR 9.57probable
anthropogenic
8/3/2009 6:05 PM 8,000exceeds
DWS&SCR 20.41anthropogenic
8/31/2009 9:15 AM 190,000exceeds
DWS&SCR 15.57anthropogenic
Lafo-J6 29.638823980 -90.516595481
C-Hwy 1- R & M
Culvert on Hwy1 between Romy & Mar St 8/14/2008 11:05 AM 2,200
exceeds DWS&SCR 9.12
probable anthropogenic
10/29/2008 6:10 PM not enough water
11/4/2008 not enough water
12/11/2008 12:21 PM 1,800 exceed PCR 4.54possible
anthropogenic
2/8/2009 not enough water
2/27/2009 3:50 PM 300 exceed PCR 5.54probable
anthropogenic
4/1/2009 10:56 AM 400 exceed PCR 5.12probable
anthropogenic
5/3/2009 not enough water
5/29/2009 not enough water
6/17/2009 not enough water
8/3/2009 not enough water

53
DEQ ID Latitude Longitude Site ID Site Description
Date sampled TOC
mFC/100 ml
Impact of Fecal
Coliforms* OBOB
indications** Comments
8/31/2009 not enough water
Lafo-J6A 29.624809816 -90.534468123 40A-R
40A Canal- end of Romy St 2/8/2009 1:46 PM 20 none 28.49anthropogenic
FC very low for OB reading
2/27/2009 3:55 PM 1,000 exceed PCR 19.24anthropogenic 4/1/2009 11:00 AM 1,280 exceed PCR 23.42anthropogenic 5/3/2009 6:45 PM 1,200 exceed PCR 25.60anthropogenic 5/29/2009 9:45 AM 960 exceed PCR 15.04anthropogenic
6/17/2009 11:40 AM 140 none 8.71probable
anthropogenic
8/3/2009 5:58 PM 40,000exceeds
DWS&SCR 14.56anthropogenic
8/31/2009 9:05 AM 130,000exceeds
DWS&SCR 8.25probable
anthropogenic Lafo-J7 29.640279797 -90.518277395 C-Hwy1-FS
Culvert Hwy 1 at Franks Store 8/14/2008 11:55 AM 14,800
exceeds DWS&SCR 6.48
probable anthropogenic
10/29/2008 6:22 PM 1,700 exceed PCR 12.20anthropogenic
11/4/2008 not enough water
12/11/2008 12:12 PM 2,400exceeds
DWS&SCR 4.35possible
anthropogenic
2/8/2009 1:35 PM 2,200exceeds
DWS&SCR 4.88possible
anthropogenic
2/27/2009 3:45 PM 280,000exceeds
DWS&SCR 6.07probable
anthropogenic
4/1/2009 10:54 AM 40 none 5.17probable
anthropogenic
5/3/2009 not enough water
5/29/2009 not enough water
6/17/2009 not enough water
8/3/2009 6:10 PM 100,000exceeds
DWS&SCR 9.41probable
anthropogenicblack/gray color water
8/31/2009 8:55 AM 240,000exceeds
DWS&SCR 3.69possible
anthropogenic
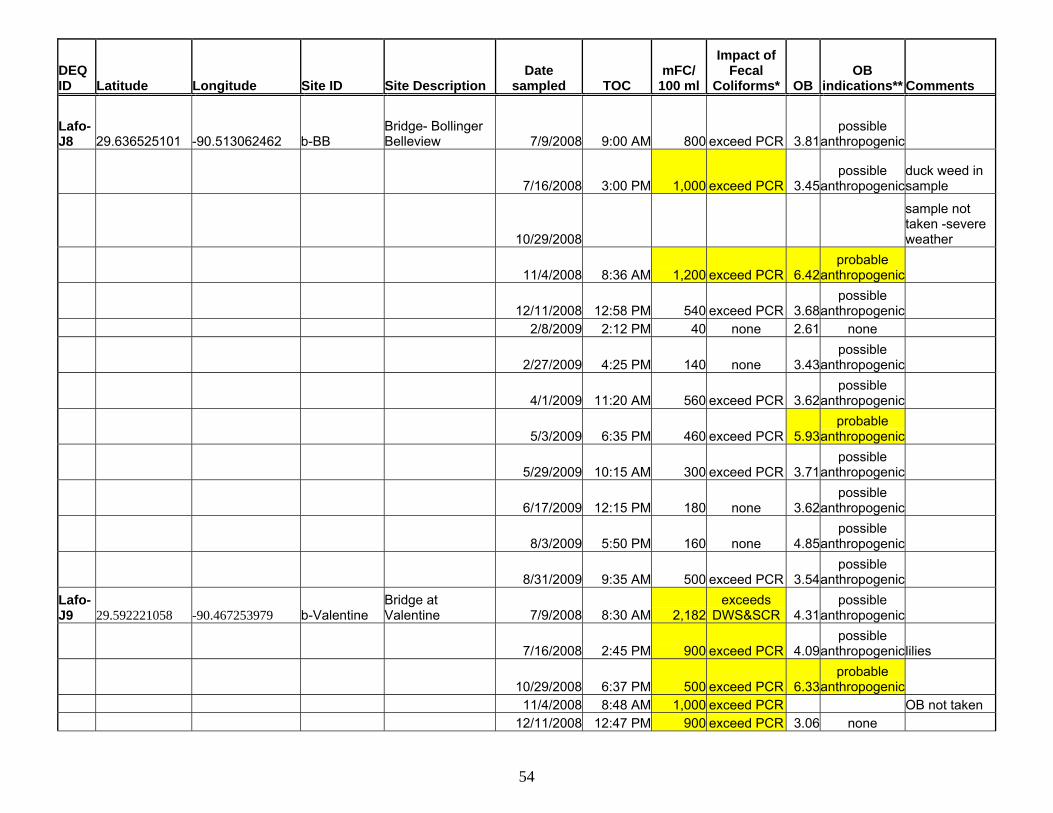
54
DEQ ID Latitude Longitude Site ID Site Description
Date sampled TOC
mFC/100 ml
Impact of Fecal
Coliforms* OBOB
indications** Comments
Lafo-J8 29.636525101 -90.513062462 b-BB
Bridge- Bollinger Belleview 7/9/2008 9:00 AM 800 exceed PCR 3.81
possible anthropogenic
7/16/2008 3:00 PM 1,000 exceed PCR 3.45possible
anthropogenicduck weed in sample
10/29/2008
sample not taken -severe weather
11/4/2008 8:36 AM 1,200 exceed PCR 6.42probable
anthropogenic
12/11/2008 12:58 PM 540 exceed PCR 3.68possible
anthropogenic 2/8/2009 2:12 PM 40 none 2.61 none
2/27/2009 4:25 PM 140 none 3.43possible
anthropogenic
4/1/2009 11:20 AM 560 exceed PCR 3.62possible
anthropogenic
5/3/2009 6:35 PM 460 exceed PCR 5.93probable
anthropogenic
5/29/2009 10:15 AM 300 exceed PCR 3.71possible
anthropogenic
6/17/2009 12:15 PM 180 none 3.62possible
anthropogenic
8/3/2009 5:50 PM 160 none 4.85possible
anthropogenic
8/31/2009 9:35 AM 500 exceed PCR 3.54possible
anthropogenic Lafo-J9 29.592221058 -90.467253979 b-Valentine
Bridge at Valentine 7/9/2008 8:30 AM 2,182
exceeds DWS&SCR 4.31
possible anthropogenic
7/16/2008 2:45 PM 900 exceed PCR 4.09possible
anthropogeniclilies
10/29/2008 6:37 PM 500 exceed PCR 6.33probable
anthropogenic 11/4/2008 8:48 AM 1,000 exceed PCR OB not taken 12/11/2008 12:47 PM 900 exceed PCR 3.06 none
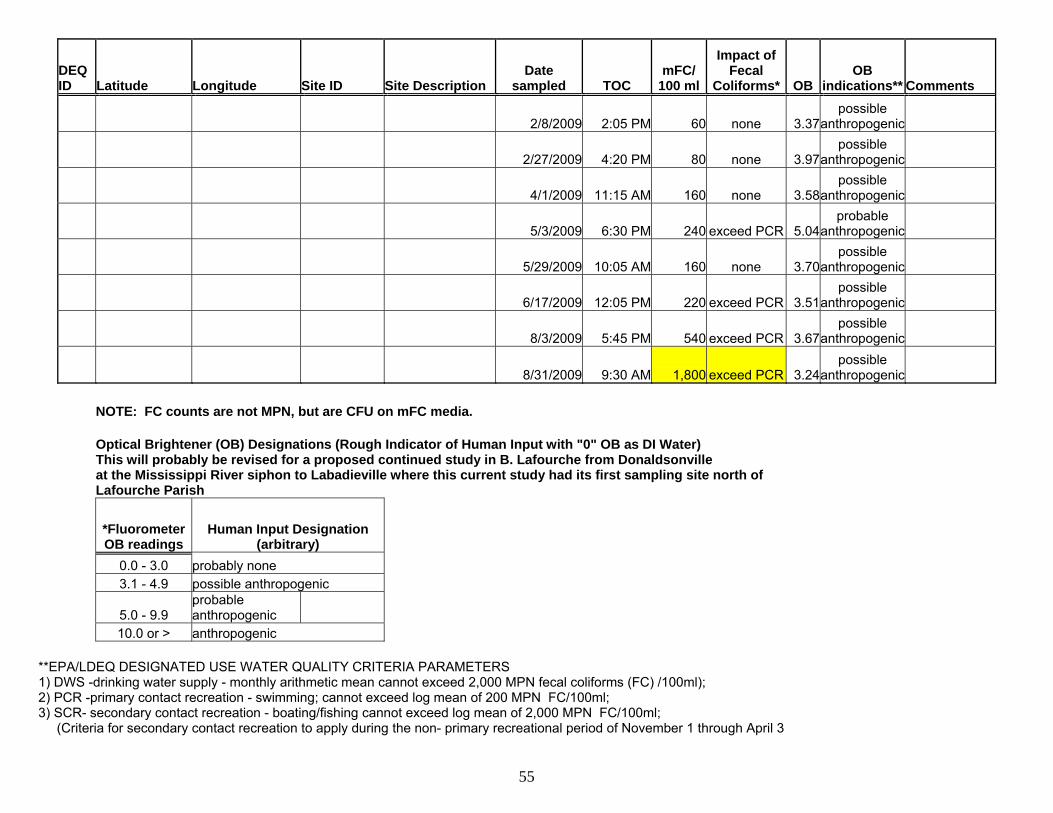
55
DEQ ID Latitude Longitude Site ID Site Description
Date sampled TOC
mFC/100 ml
Impact of Fecal
Coliforms* OBOB
indications** Comments
2/8/2009 2:05 PM 60 none 3.37possible
anthropogenic
2/27/2009 4:20 PM 80 none 3.97possible
anthropogenic
4/1/2009 11:15 AM 160 none 3.58possible
anthropogenic
5/3/2009 6:30 PM 240 exceed PCR 5.04probable
anthropogenic
5/29/2009 10:05 AM 160 none 3.70possible
anthropogenic
6/17/2009 12:05 PM 220 exceed PCR 3.51possible
anthropogenic
8/3/2009 5:45 PM 540 exceed PCR 3.67possible
anthropogenic
8/31/2009 9:30 AM 1,800 exceed PCR 3.24possible
anthropogenic NOTE: FC counts are not MPN, but are CFU on mFC media.
Optical Brightener (OB) Designations (Rough Indicator of Human Input with "0" OB as DI Water) This will probably be revised for a proposed continued study in B. Lafourche from Donaldsonville at the Mississippi River siphon to Labadieville where this current study had its first sampling site north of Lafourche Parish
*Fluorometer OB readings
Human Input Designation (arbitrary)
0.0 - 3.0 probably none 3.1 - 4.9 possible anthropogenic
5.0 - 9.9 probable anthropogenic
10.0 or > anthropogenic
**EPA/LDEQ DESIGNATED USE WATER QUALITY CRITERIA PARAMETERS 1) DWS -drinking water supply - monthly arithmetic mean cannot exceed 2,000 MPN fecal coliforms (FC) /100ml); 2) PCR -primary contact recreation - swimming; cannot exceed log mean of 200 MPN FC/100ml; 3) SCR- secondary contact recreation - boating/fishing cannot exceed log mean of 2,000 MPN FC/100ml; (Criteria for secondary contact recreation to apply during the non- primary recreational period of November 1 through April 3
56
3.1 Maps and Discussion of the 10 Cluster of Sites and New GIS Aerial Maps with Clusters and the sampling locations within the Clusters. The pictures below are compilations of GIS database maps, digital photographs of the individual sites and some Microsoft Virtual Earth “Birdseye” images of the 54 sites within their 10 Clusters. Figures 5 and 6 from pp. 16 and 17 were divided into 10 Figures with close-up GIS map files of the sampling clusters. Figures 7, 8, 9, 10, 11, 12, 13, 14, 15 and 16 show specified maps of each of the 10 sampling clusters in the required geodatabase map files. Additionally, each GIS Figure of a cluster map includes separate digital images to LDEQ specs of each sampling site in that cluster.

57
A1 – Bayou Lafourche Bridge at Hwy 398, Labadieville
Virtual Earth Image of Site A1 bridge
Figure 7. The A Site Cluster – A1, Bayou Lafourche bridge at HWY 398 Labadieville (Assumption Parish)
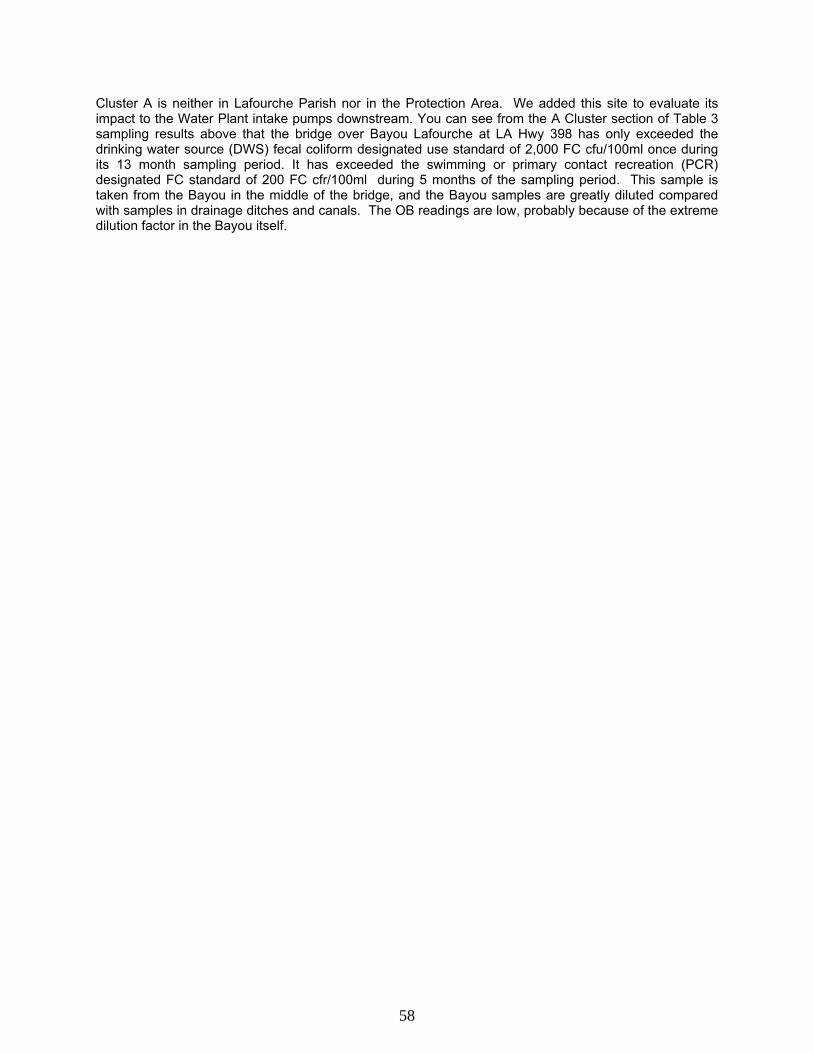
58
Cluster A is neither in Lafourche Parish nor in the Protection Area. We added this site to evaluate its impact to the Water Plant intake pumps downstream. You can see from the A Cluster section of Table 3 sampling results above that the bridge over Bayou Lafourche at LA Hwy 398 has only exceeded the drinking water source (DWS) fecal coliform designated use standard of 2,000 FC cfu/100ml once during its 13 month sampling period. It has exceeded the swimming or primary contact recreation (PCR) designated FC standard of 200 FC cfr/100ml during 5 months of the sampling period. This sample is taken from the Bayou in the middle of the bridge, and the Bayou samples are greatly diluted compared with samples in drainage ditches and canals. The OB readings are low, probably because of the extreme dilution factor in the Bayou itself.
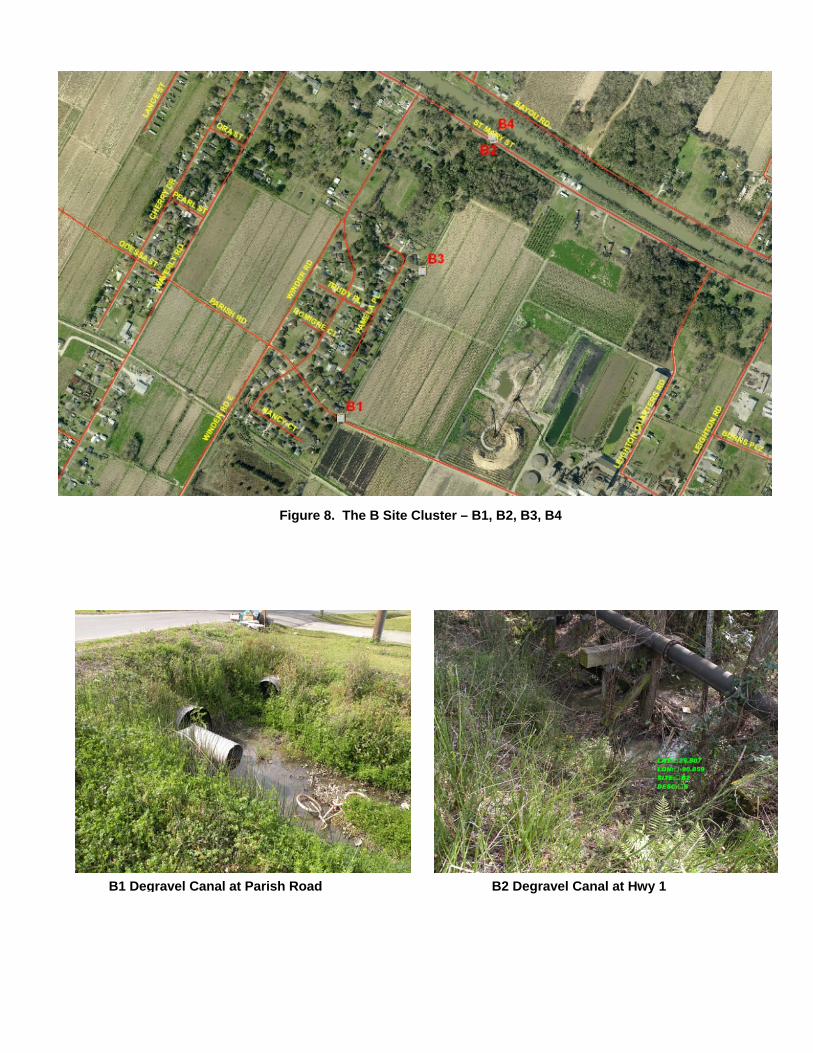
B1 Degravel Canal at Parish Road B2 Degravel Canal at Hwy 1
Figure 8. The B Site Cluster – B1, B2, B3, B4

60
Parish Rd.
Figure 5. The B Site Cluster – B1, B2, B3, B4
Degravel Canal
B3 Degravel Canal mid-point to B. Lafourche B4 Degravel Canal at B. Lafourche
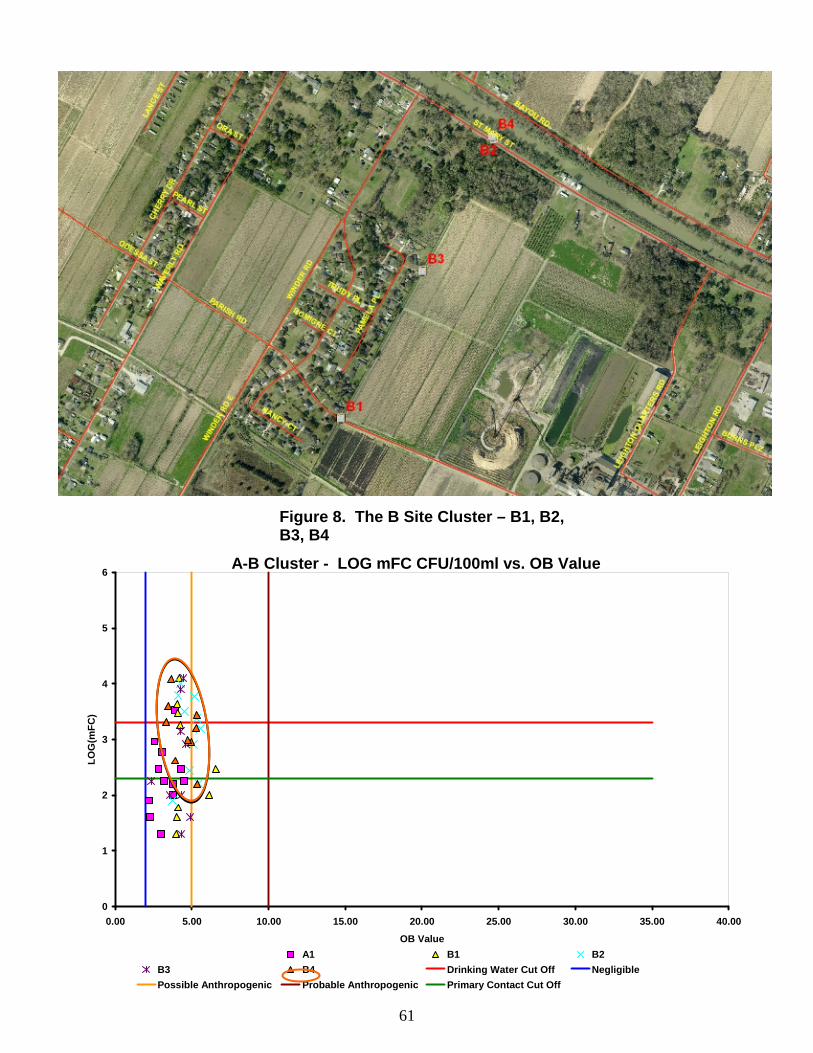
61
Figure 8. The B Site Cluster – B1, B2, B3, B4
A-B Cluster - LOG mFC CFU/100ml vs. OB Value
0
1
2
3
4
5
6
0.00 5.00 10.00 15.00 20.00 25.00 30.00 35.00 40.00
OB Value
LOG
(mFC
)
A1 B1 B2B3 B4 Drinking Water Cut Off NegligiblePossible Anthropogenic Probable Anthropogenic Primary Contact Cut Off
62
The B Cluster in north Thibodaux was selected early in the project because it drained two subdivisions from Waverly Road and Winder Road toward the Degravel Canal which drains directly into Bayou Lafourche. Table 5 above has the FC and OB results for this Cluster B and its 4 sampling sites (B1 – B4) on pp. 23-25. It was originally deemed that sites B2 and B4 would be the most significant in this cluster because B4 is the culvert from the Degravel Canal which drains directly into B. Lafourche. exceeded the DWS designed use FC standard (2,000 FC cfu/100mL) five times in the 13 months of sampling. The sample on July 20, 2009 post major rain was 12,000 mF FC cfu/100ml. This makes this site B4 a significant source of FC directly to the Bayou. However, you can see from the scatter plot above and the map of the B cluster that despite the fact that this site has had consistently high FC counts, it has medium OB values, the highest being 7.01 with a 2,400 FC count. Although B3 in the actual canal have package plant pipes clear visible draining directly into the canal, the canal has a thick population of water weeds and foliage that probably removes much of the nutrients before they reach the Bayou. Site B2. which is the Degravel Canal right before it goes under Hwy 1 to the culvert draining into the Bayou at B4, exceeded the DWS FC designated levels 6 times in the 13 samplings. The OB values were medium and none were 10 or greater.
Parish Rd.
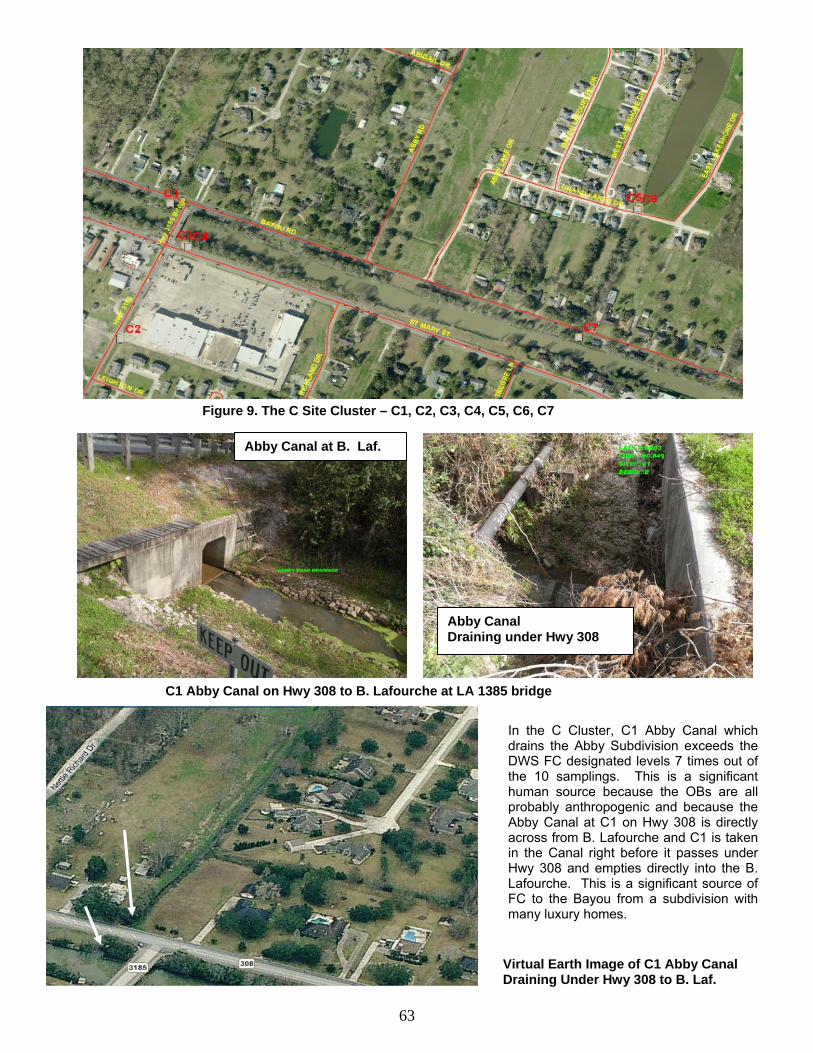
63
Figure 9. The C Site Cluster – C1, C2, C3, C4, C5, C6, C7
Virtual Earth Image of C1 Abby Canal Draining Under Hwy 308 to B. Laf.
Abby Canal at B. Laf.
C1 Abby Canal on Hwy 308 to B. Lafourche at LA 1385 bridge
In the C Cluster, C1 Abby Canal which drains the Abby Subdivision exceeds the DWS FC designated levels 7 times out of the 10 samplings. This is a significant human source because the OBs are all probably anthropogenic and because the Abby Canal at C1 on Hwy 308 is directly across from B. Lafourche and C1 is taken in the Canal right before it passes under Hwy 308 and empties directly into the B. Lafourche. This is a significant source of FC to the Bayou from a subdivision with many luxury homes.
Abby Canal Draining under Hwy 308
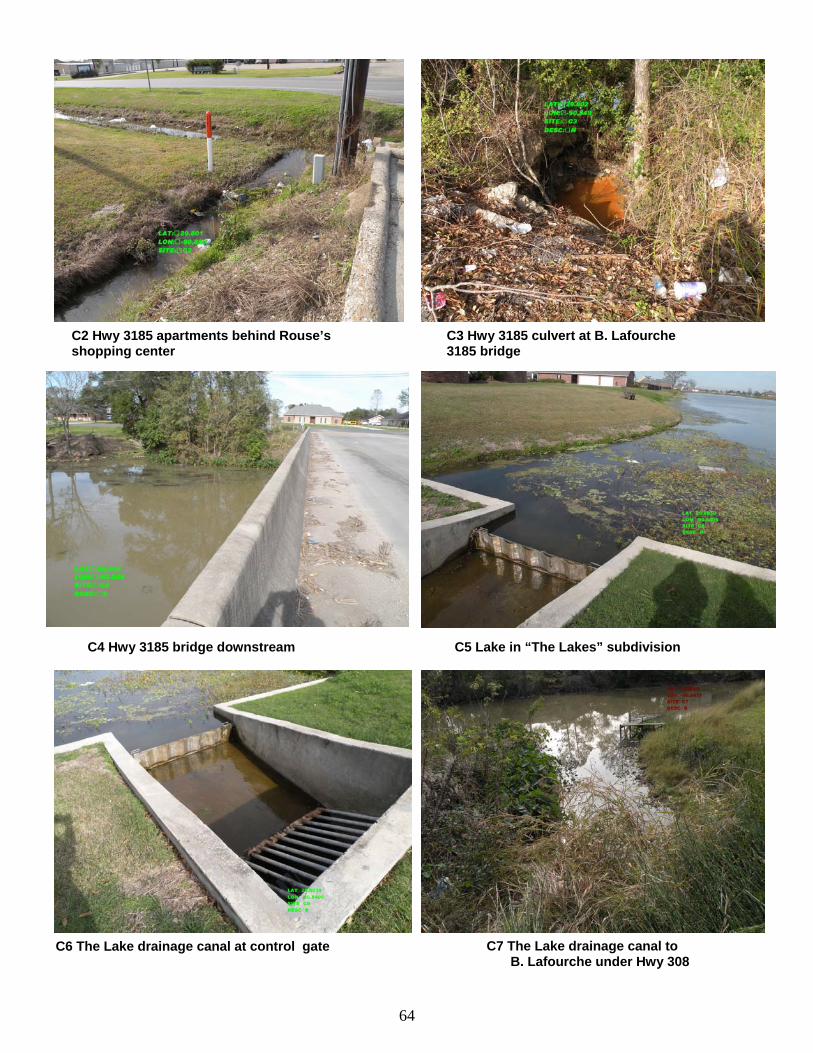
64
C2 Hwy 3185 apartments behind Rouse’s shopping center
C3 Hwy 3185 culvert at B. Lafourche 3185 bridge
C4 Hwy 3185 bridge downstream C5 Lake in “The Lakes” subdivision
C6 The Lake drainage canal at control gate C7 The Lake drainage canal to B. Lafourche under Hwy 308
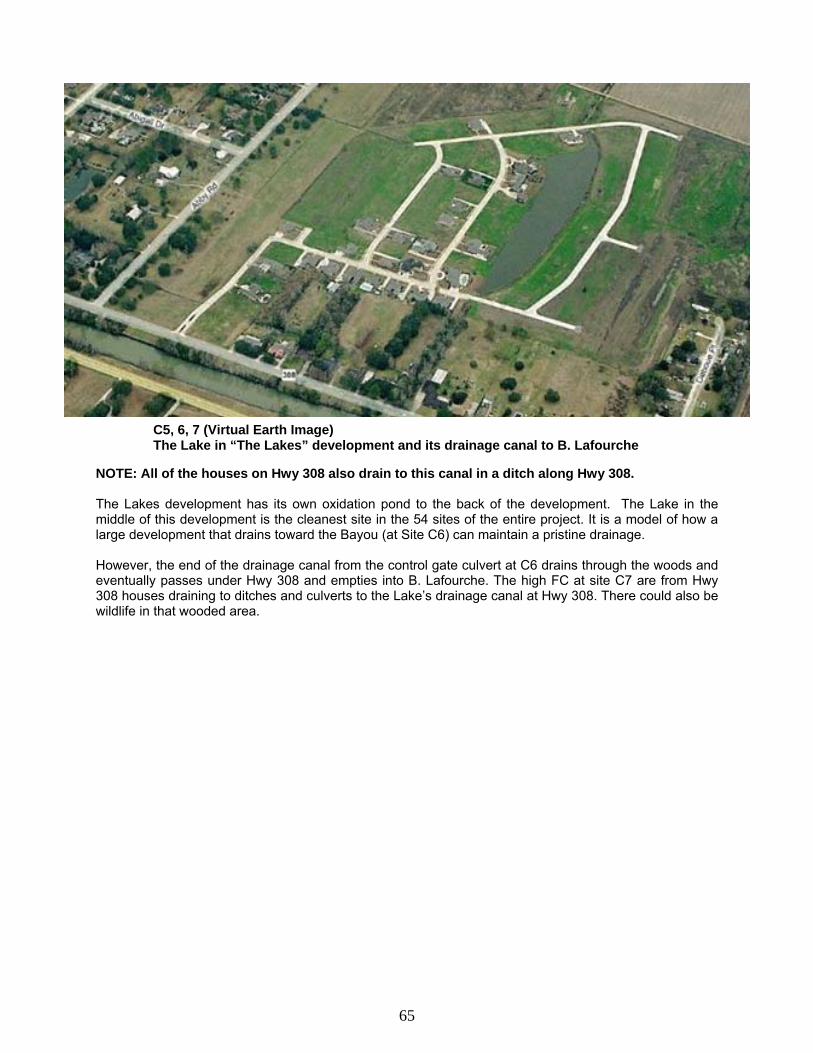
65
C5, 6, 7 (Virtual Earth Image) The Lake in “The Lakes” development and its drainage canal to B. Lafourche
NOTE: All of the houses on Hwy 308 also drain to this canal in a ditch along Hwy 308. The Lakes development has its own oxidation pond to the back of the development. The Lake in the middle of this development is the cleanest site in the 54 sites of the entire project. It is a model of how a large development that drains toward the Bayou (at Site C6) can maintain a pristine drainage. However, the end of the drainage canal from the control gate culvert at C6 drains through the woods and eventually passes under Hwy 308 and empties into B. Lafourche. The high FC at site C7 are from Hwy 308 houses draining to ditches and culverts to the Lake’s drainage canal at Hwy 308. There could also be wildlife in that wooded area.
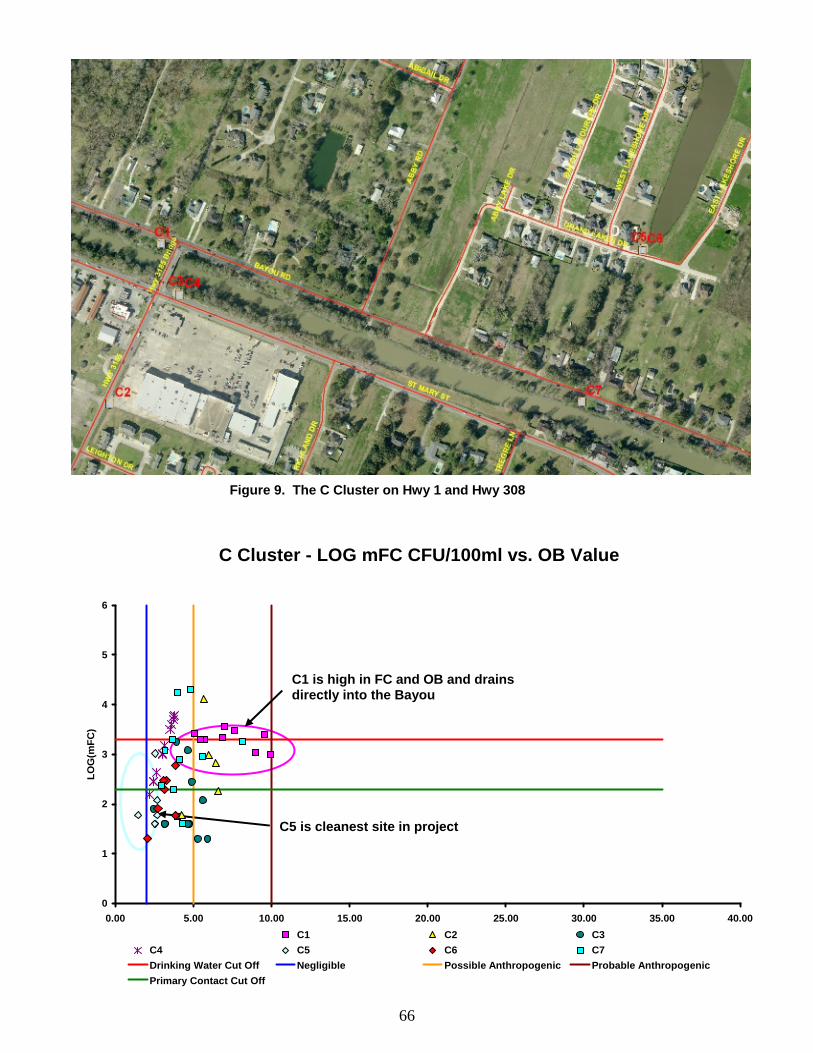
66
C5 is cleanest site in project
C Cluster - LOG mFC CFU/100ml vs. OB Value
0
1
2
3
4
5
6
0.00 5.00 10.00 15.00 20.00 25.00 30.00 35.00 40.00
OB Value
LOG
(mFC
)
C1 C2 C3C4 C5 C6 C7Drinking Water Cut Off Negligible Possible Anthropogenic Probable Anthropogenic Primary Contact Cut Off
Figure 9. The C Cluster on Hwy 1 and Hwy 308
C1 is high in FC and OB and drains directly into the Bayou
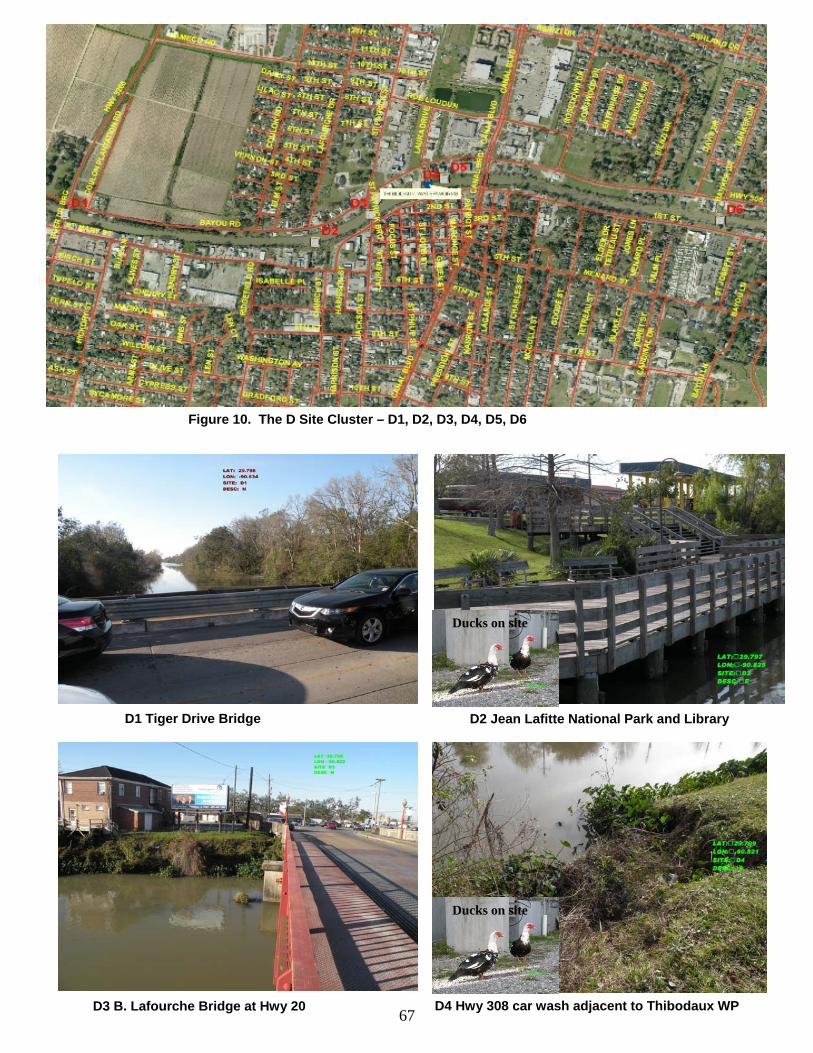
67
Figure 10. The D Site Cluster – D1, D2, D3, D4, D5, D6
D1 Tiger Drive Bridge D2 Jean Lafitte National Park and Library
D3 B. Lafourche Bridge at Hwy 20 D4 Hwy 308 car wash adjacent to Thibodaux WP
Ducks on site
Ducks on site
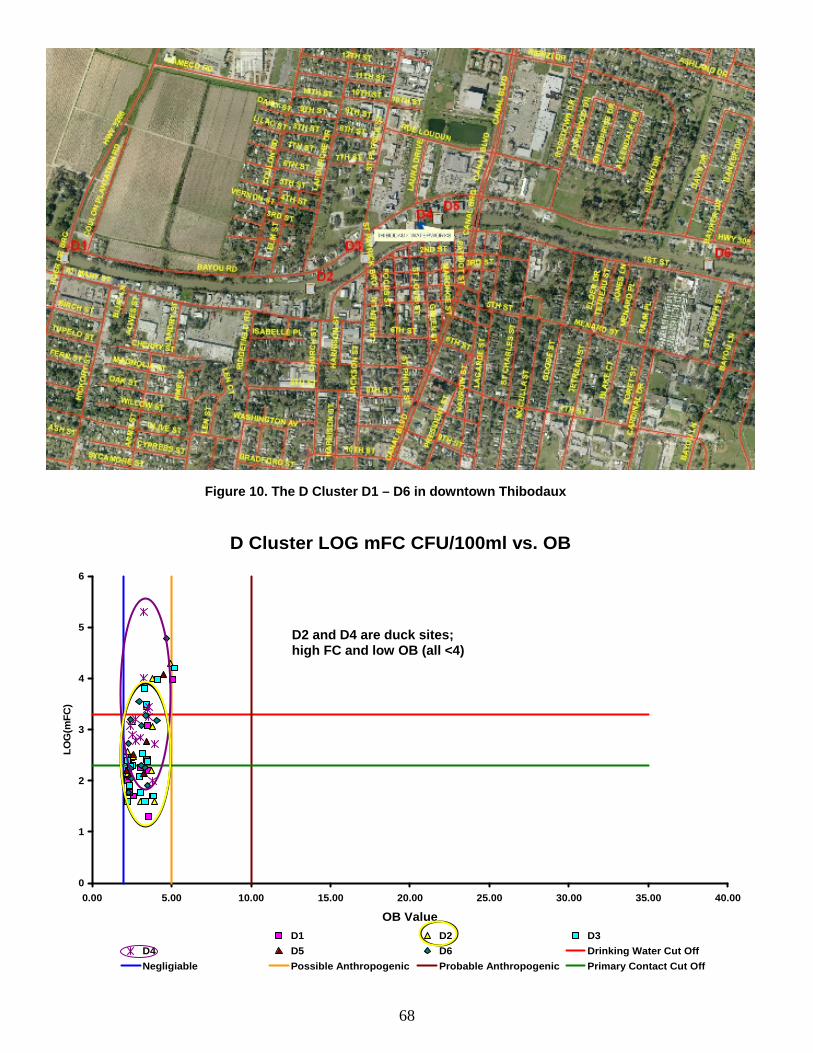
68
Figure 10. The D Cluster D1 – D6 in downtown Thibodaux
D Cluster LOG mFC CFU/100ml vs. OB
0
1
2
3
4
5
6
0.00 5.00 10.00 15.00 20.00 25.00 30.00 35.00 40.00
OB Value
LOG
(mFC
)
D1 D2 D3D4 D5 D6 Drinking Water Cut OffNegligiable Possible Anthropogenic Probable Anthropogenic Primary Contact Cut Off
D2 and D4 are duck sites; high FC and low OB (all <4)
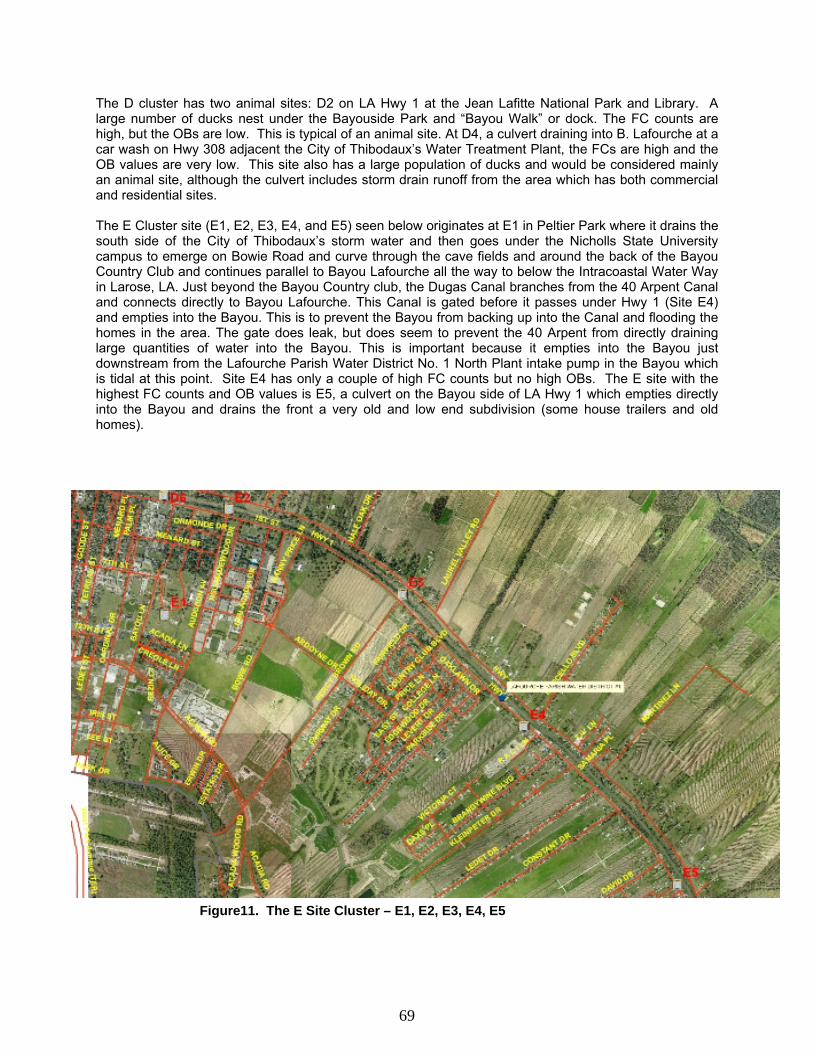
69
The D cluster has two animal sites: D2 on LA Hwy 1 at the Jean Lafitte National Park and Library. A large number of ducks nest under the Bayouside Park and “Bayou Walk” or dock. The FC counts are high, but the OBs are low. This is typical of an animal site. At D4, a culvert draining into B. Lafourche at a car wash on Hwy 308 adjacent the City of Thibodaux’s Water Treatment Plant, the FCs are high and the OB values are very low. This site also has a large population of ducks and would be considered mainly an animal site, although the culvert includes storm drain runoff from the area which has both commercial and residential sites. The E Cluster site (E1, E2, E3, E4, and E5) seen below originates at E1 in Peltier Park where it drains the south side of the City of Thibodaux’s storm water and then goes under the Nicholls State University campus to emerge on Bowie Road and curve through the cave fields and around the back of the Bayou Country Club and continues parallel to Bayou Lafourche all the way to below the Intracoastal Water Way in Larose, LA. Just beyond the Bayou Country club, the Dugas Canal branches from the 40 Arpent Canal and connects directly to Bayou Lafourche. This Canal is gated before it passes under Hwy 1 (Site E4) and empties into the Bayou. This is to prevent the Bayou from backing up into the Canal and flooding the homes in the area. The gate does leak, but does seem to prevent the 40 Arpent from directly draining large quantities of water into the Bayou. This is important because it empties into the Bayou just downstream from the Lafourche Parish Water District No. 1 North Plant intake pump in the Bayou which is tidal at this point. Site E4 has only a couple of high FC counts but no high OBs. The E site with the highest FC counts and OB values is E5, a culvert on the Bayou side of LA Hwy 1 which empties directly into the Bayou and drains the front a very old and low end subdivision (some house trailers and old homes).
Figure11. The E Site Cluster – E1, E2, E3, E4, E5
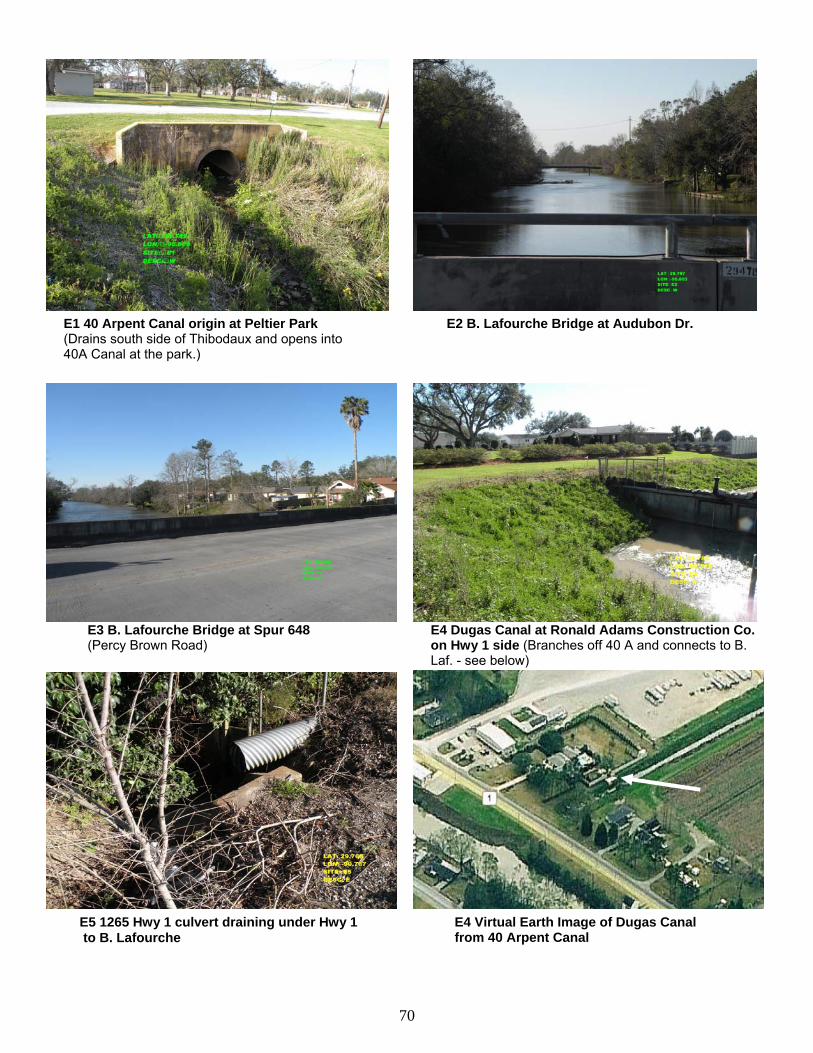
70
E2 B. Lafourche Bridge at Audubon Dr. E1 40 Arpent Canal origin at Peltier Park (Drains south side of Thibodaux and opens into 40A Canal at the park.)
E3 B. Lafourche Bridge at Spur 648 (Percy Brown Road)
E4 Dugas Canal at Ronald Adams Construction Co. on Hwy 1 side (Branches off 40 A and connects to B. Laf. - see below)
E4 Virtual Earth Image of Dugas Canal from 40 Arpent Canal
E5 1265 Hwy 1 culvert draining under Hwy 1 to B. Lafourche
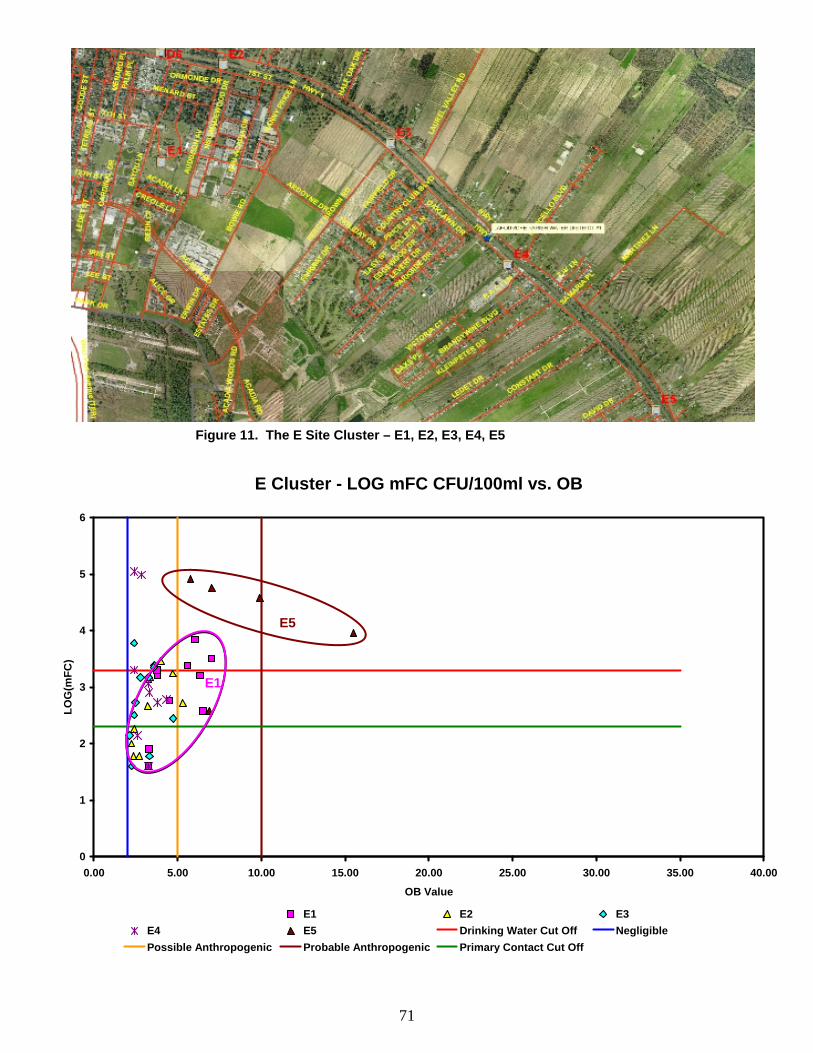
71
Figure 11. The E Site Cluster – E1, E2, E3, E4, E5
E Cluster - LOG mFC CFU/100ml vs. OB
0
1
2
3
4
5
6
0.00 5.00 10.00 15.00 20.00 25.00 30.00 35.00 40.00
OB Value
LOG
(mFC
)
E1 E2 E3E4 E5 Drinking Water Cut Off Negligible Possible Anthropogenic Probable Anthropogenic Primary Contact Cut Off
E5
E1

72
F Cluster - LOG mFC CFU/100ml vs. OB
0
1
2
3
4
5
6
0.00 5.00 10.00 15.00 20.00 25.00 30.00 35.00 40.00
OB Value
LOG
(mFC
)
Possible Anthropogenic Negligible Probable AnthropogenicPrimary Contact Cut Off F1 F2 F3F5 F6 Drinking Water Cut Off
Figure 12. Cluster F, Sites F1, F2, F3, F5, and F6 (F4 eliminated)
F5

73
40A Canal
Lefort Canal DWS pump for Terrebonne P i h
F1
Hollywood Canal
F1 40A at Lefort Canal (Terrebonne Parish DWS) (Turns into Hollywood Canal after crossing 40A)
Virtual Earth Image of Lefort Canal and 40A
F2 Pump station from drainage ditch on Lefort Rd to 40A Canal
F3 B. Lafourche Bridge at St. Charles
F6 Bridge 40 A on St. Charles Bypass Rd. F5 321 St Charles Bypass (F4 for ditch near Hwy 1 not located)

74
F5 is a site on the St. Charles Bypass Road from the package plant effluent pipe that drains directly into an open ditch in the front yard. When it has water, the FC counts are exceeding DWS and the OB values are higher than any other F sites. However, it does not impact B. Lafourche directly. It only drains back to the 40 Arpent Canal. However, that Canal does impact the Bayou through the Company Canal in Lockport. The other sites in this cluster are not consistently high.
Figure 13. The G Site Cluster –G1, G2, G3, G5 (G4 eliminated; no culverts or ditches on Hwy 1)
G Cluster - LOG mFC CFU/100ml vs. OB Value
0
1
2
3
4
5
6
0.00 5.00 10.00 15.00 20.00 25.00 30.00 35.00 40.00OB Value
LOG
(mFC
)
G1 G2 G3G5 Drinking Water Cut Off Negligible Possible AnthropogenicProbable Anthropogenic Primary Contact Cut Off

75
The G cluster is not in the protection area, but the Four Point Canal does connect the 40 A Canal with Bayou Lafourche. There is a gate in the Four Point Canal (which is the drainage ditch for the Four Point subdivision) to prevent B. Lafourche from backing up into the drainage ditch for the canal. This area is under pump to the 40 A Canal. G5 is a culvert which does drain under LA Hwy 1 to the Bayou Lafourche. However in 12 sampling trips it only had water twice, but the FC counts were very high and OB was medium.
G3 Bridge at Hwy 1 over Four Point Canal G5 Culvert at Plaisance Dr., N. Raceland (Culvert runs under LA Hwy1 to Bayou)
G1 Four point Canal gate on 40A side G2 Four Point Canal gate on B. Lafourche side
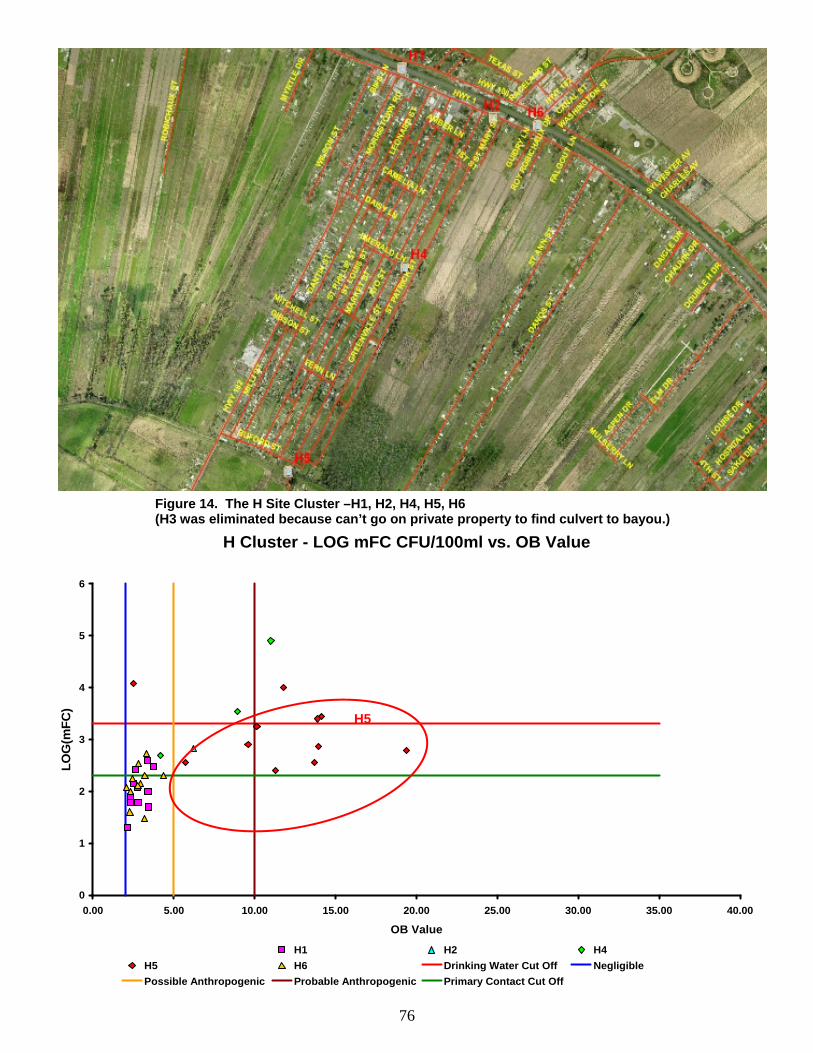
76
H Cluster - LOG mFC CFU/100ml vs. OB Value
0
1
2
3
4
5
6
0.00 5.00 10.00 15.00 20.00 25.00 30.00 35.00 40.00
OB Value
LOG
(mFC
)
H1 H2 H4H5 H6 Drinking Water Cut Off NegligiblePossible Anthropogenic Probable Anthropogenic Primary Contact Cut Off
Figure 14. The H Site Cluster –H1, H2, H4, H5, H6 (H3 was eliminated because can’t go on private property to find culvert to bayou.)
H5
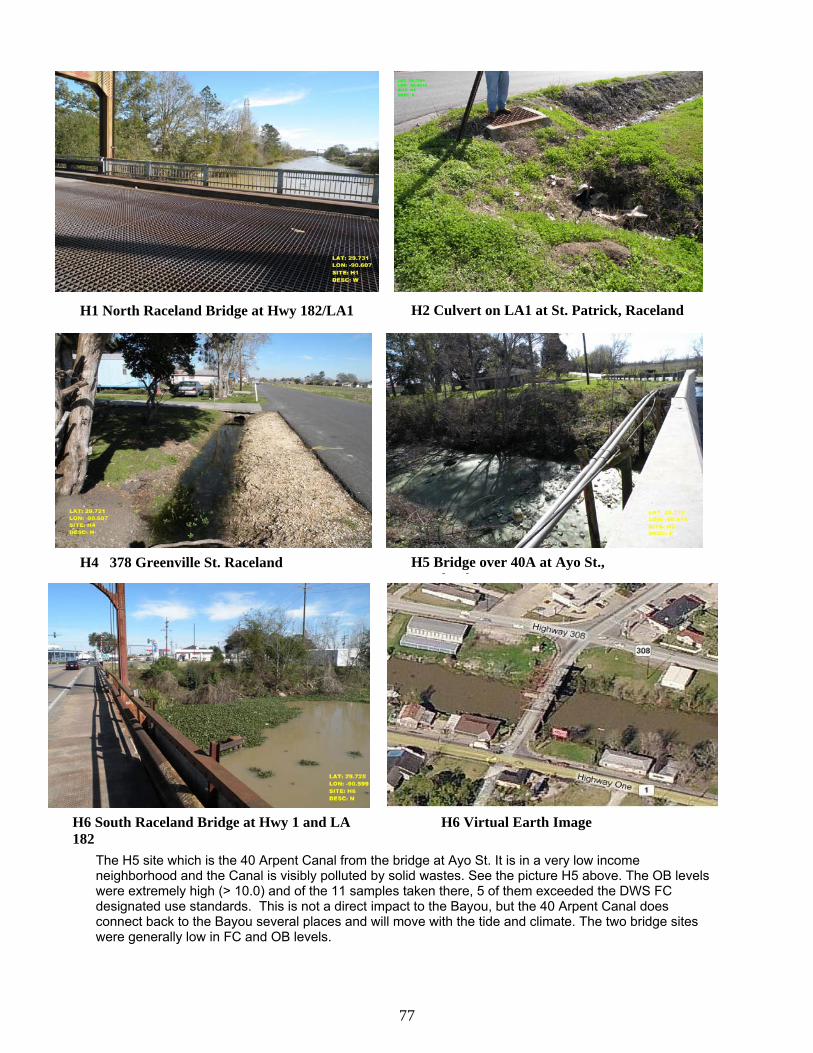
77
The H5 site which is the 40 Arpent Canal from the bridge at Ayo St. It is in a very low income neighborhood and the Canal is visibly polluted by solid wastes. See the picture H5 above. The OB levels were extremely high (> 10.0) and of the 11 samples taken there, 5 of them exceeded the DWS FC designated use standards. This is not a direct impact to the Bayou, but the 40 Arpent Canal does connect back to the Bayou several places and will move with the tide and climate. The two bridge sites were generally low in FC and OB levels.
H6 South Raceland Bridge at Hwy 1 and LA 182
H6 Virtual Earth Image
H4 378 Greenville St. Raceland H5 Bridge over 40A at Ayo St., R l d
H1 North Raceland Bridge at Hwy 182/LA1 H2 Culvert on LA1 at St. Patrick, Raceland
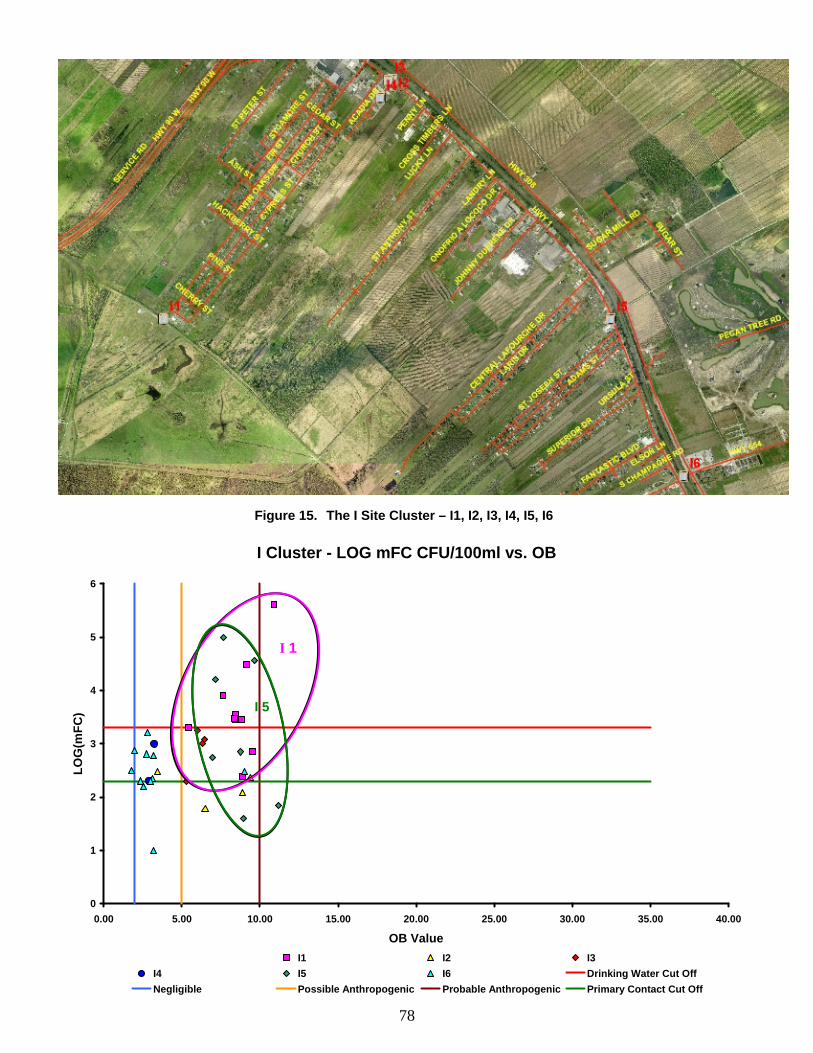
78
Figure 15. The I Site Cluster – I1, I2, I3, I4, I5, I6
I Cluster - LOG mFC CFU/100ml vs. OB
0
1
2
3
4
5
6
0.00 5.00 10.00 15.00 20.00 25.00 30.00 35.00 40.00
OB Value
LOG
(mFC
)
I1 I2 I3I4 I5 I6 Drinking Water Cut OffNegligible Possible Anthropogenic Probable Anthropogenic Primary Contact Cut Off
I 1
I 5

79
I2 Catch Basin on Hwy 1 at Acadia Road Bank I3 Catch Basin on Hwy 1 at Acadia Road bayou side in gas station lot
Virtual Earth Image of I2, I3, and I4 at Hwy 1 and Acadia Road in Raceland
I2
I3
I4

80
Of the 12 samples taken at I1 the 40 Arpent Canal bridge at the Sugarland Country Club, 10 had FC levels that exceeded the DWS designated use levels. The OB levels for these samples were also high. When collecting at this site, it was observed that containers used to spray the golf course were being washed out with detergent and drained into the 40 Arpent Canal there. It is not known if this is a common practice. Also, with the exception of the first 1 or 2 blocks in the subdivision that surrounds the St. Ann hospital the rest of the subdivision drains back to the 40 Arpent Canal. The I5 culvert at 4926 in Mathews drained all of the buildings along LA Hwy 1 and always extremely high FC and OB levels when there was water in the culvert. Package plant effluent pipes were seen draining directly into the ditch also. This drainage ditch probably drains into the Bayou, but it could not be tracked through private bayouside property. None of the other I sites in this Cluster had consistently high levels of FCs and OBs.
I5 Culvert at 4926 LA Hwy 1, Mathews I6 Bridge at Hwy 654 to Gheens (in Mathews)
I4 Culvert on Acadia Drive in Raceland I1 -40A Canal at Sugarland Country Club
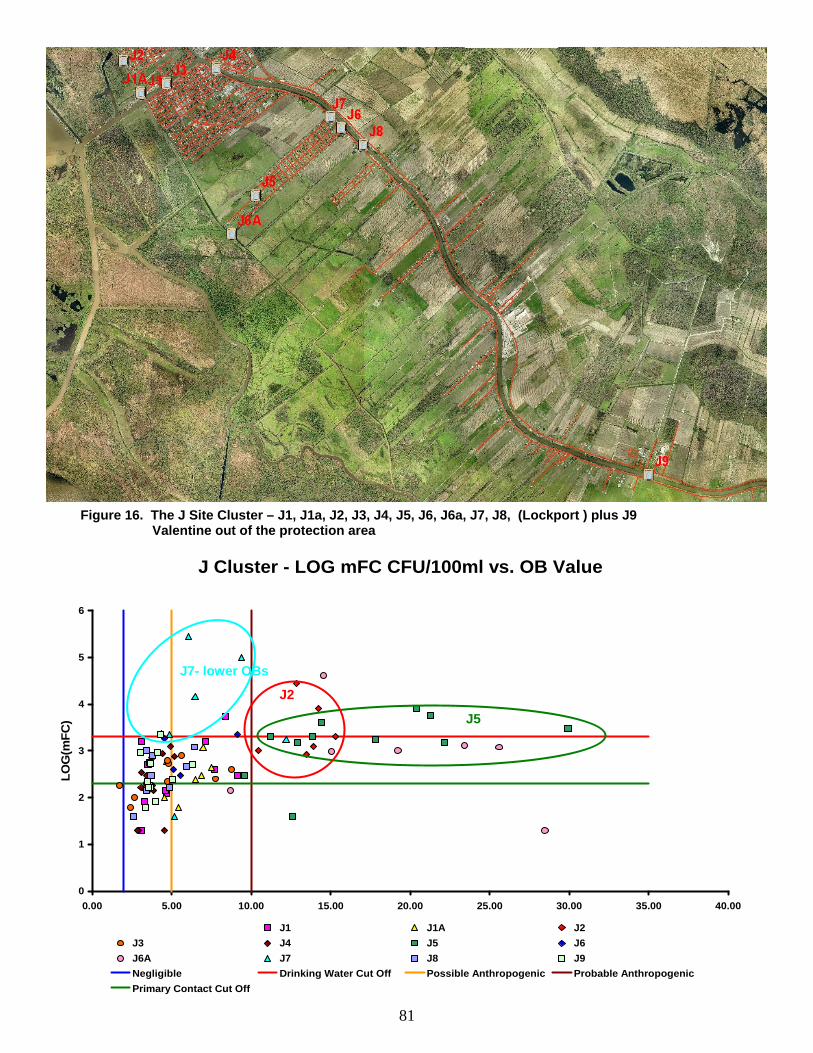
81
J5
Figure 16. The J Site Cluster – J1, J1a, J2, J3, J4, J5, J6, J6a, J7, J8, (Lockport ) plus J9 Valentine out of the protection area
J Cluster - LOG mFC CFU/100ml vs. OB Value
0
1
2
3
4
5
6
0.00 5.00 10.00 15.00 20.00 25.00 30.00 35.00 40.00
OB Value
LOG
(mFC
)
J1 J1A J2J3 J4 J5 J6J6A J7 J8 J9Negligible Drinking Water Cut Off Possible Anthropogenic Probable AnthropogenicPrimary Contact Cut Off
J7- lower OBs
J2
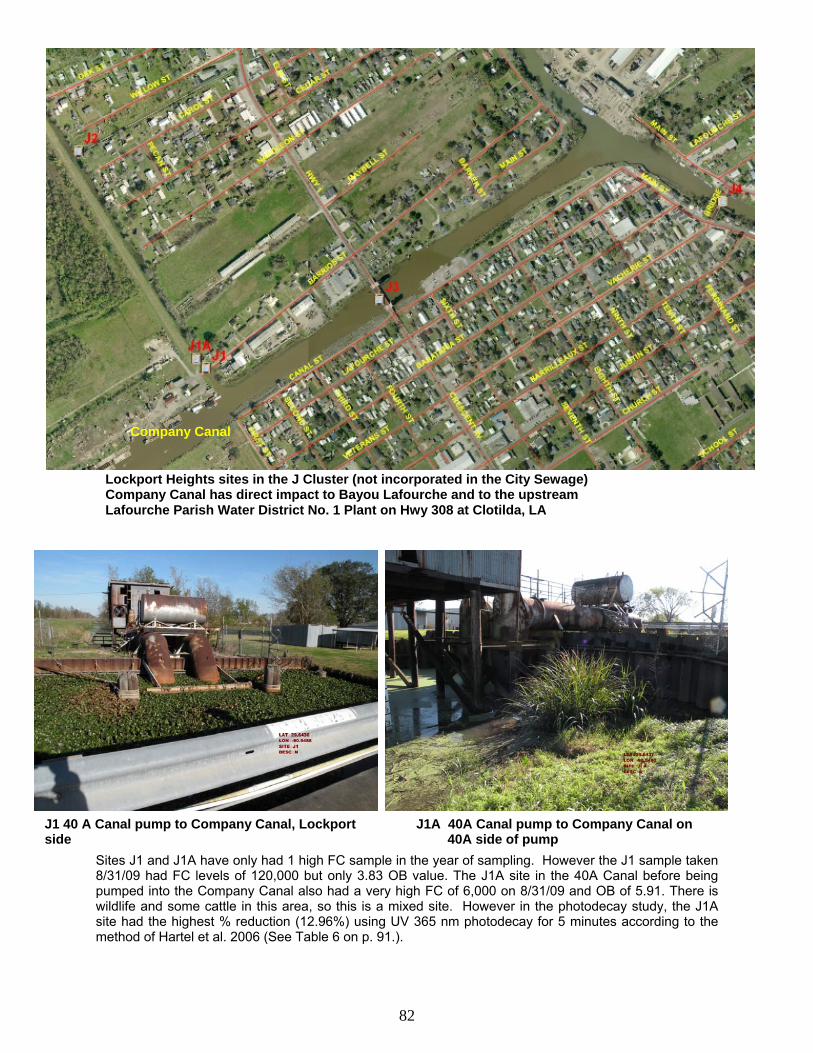
82
Sites J1 and J1A have only had 1 high FC sample in the year of sampling. However the J1 sample taken 8/31/09 had FC levels of 120,000 but only 3.83 OB value. The J1A site in the 40A Canal before being pumped into the Company Canal also had a very high FC of 6,000 on 8/31/09 and OB of 5.91. There is wildlife and some cattle in this area, so this is a mixed site. However in the photodecay study, the J1A site had the highest % reduction (12.96%) using UV 365 nm photodecay for 5 minutes according to the method of Hartel et al. 2006 (See Table 6 on p. 91.).
J1A 40A Canal pump to Company Canal on 40A side of pump
J1 40 A Canal pump to Company Canal, Lockport side
Company Canal
Lockport Heights sites in the J Cluster (not incorporated in the City Sewage) Company Canal has direct impact to Bayou Lafourche and to the upstream Lafourche Parish Water District No. 1 Plant on Hwy 308 at Clotilda, LA
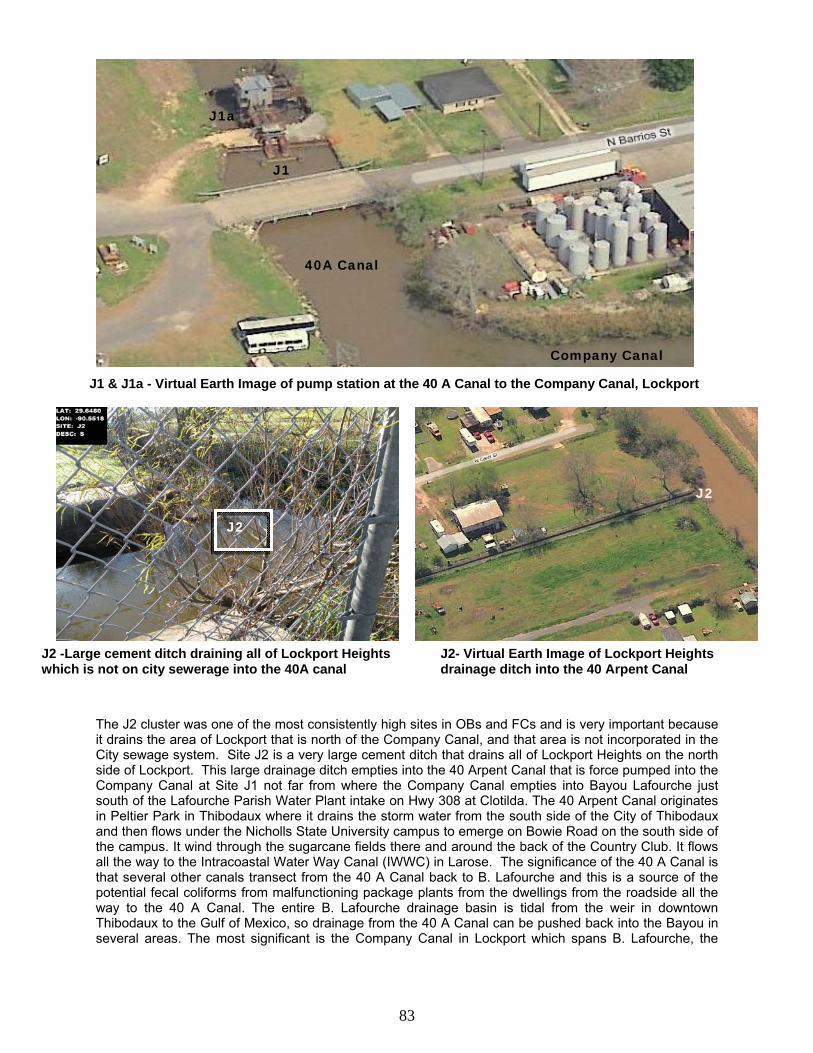
83
The J2 cluster was one of the most consistently high sites in OBs and FCs and is very important because it drains the area of Lockport that is north of the Company Canal, and that area is not incorporated in the City sewage system. Site J2 is a very large cement ditch that drains all of Lockport Heights on the north side of Lockport. This large drainage ditch empties into the 40 Arpent Canal that is force pumped into the Company Canal at Site J1 not far from where the Company Canal empties into Bayou Lafourche just south of the Lafourche Parish Water Plant intake on Hwy 308 at Clotilda. The 40 Arpent Canal originates in Peltier Park in Thibodaux where it drains the storm water from the south side of the City of Thibodaux and then flows under the Nicholls State University campus to emerge on Bowie Road on the south side of the campus. It wind through the sugarcane fields there and around the back of the Country Club. It flows all the way to the Intracoastal Water Way Canal (IWWC) in Larose. The significance of the 40 A Canal is that several other canals transect from the 40 A Canal back to B. Lafourche and this is a source of the potential fecal coliforms from malfunctioning package plants from the dwellings from the roadside all the way to the 40 A Canal. The entire B. Lafourche drainage basin is tidal from the weir in downtown Thibodaux to the Gulf of Mexico, so drainage from the 40 A Canal can be pushed back into the Bayou in several areas. The most significant is the Company Canal in Lockport which spans B. Lafourche, the
J1
J1a
40A Canal
Company Canal
J1 & J1a - Virtual Earth Image of pump station at the 40 A Canal to the Company Canal, Lockport
J2
J2 -Large cement ditch draining all of Lockport Heights which is not on city sewerage into the 40A canal
J2- Virtual Earth Image of Lockport Heights drainage ditch into the 40 Arpent Canal
J2
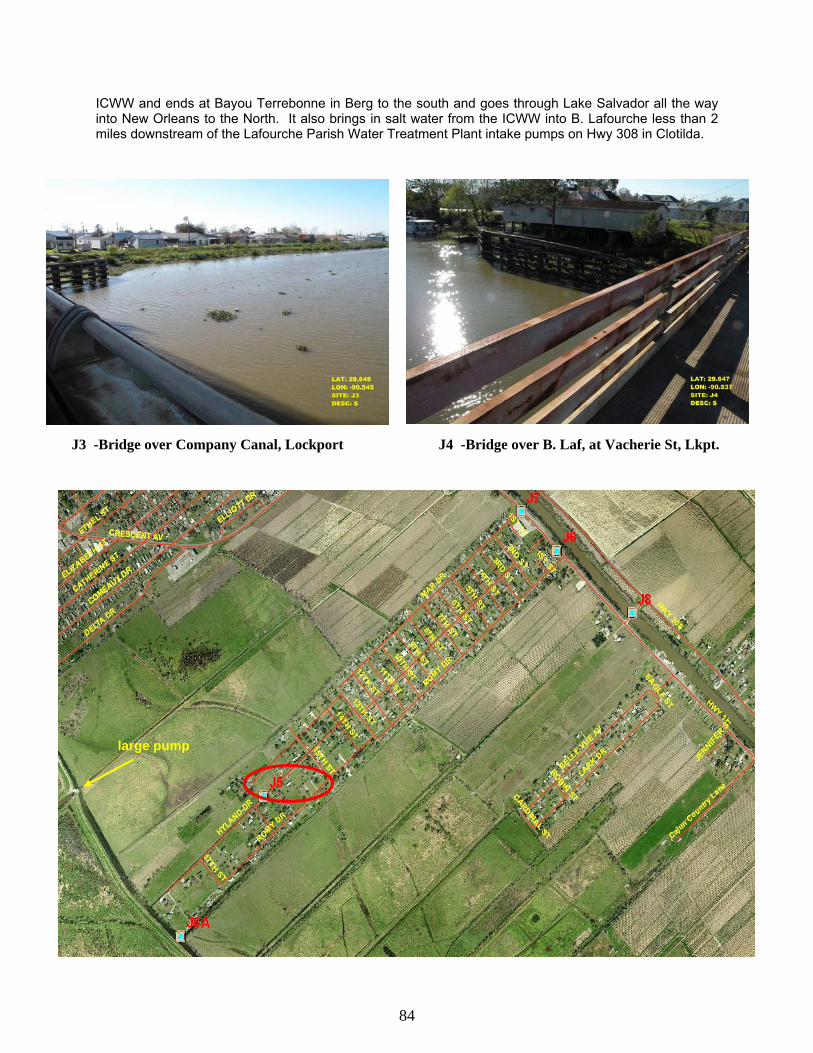
84
ICWW and ends at Bayou Terrebonne in Berg to the south and goes through Lake Salvador all the way into New Orleans to the North. It also brings in salt water from the ICWW into B. Lafourche less than 2 miles downstream of the Lafourche Parish Water Treatment Plant intake pumps on Hwy 308 in Clotilda. .
large pump
J3 -Bridge over Company Canal, Lockport J4 -Bridge over B. Laf, at Vacherie St, Lkpt.

85
Site J5 has consistent highest FC and OB.
OB Values
2000 cfu E. coli /100ml
200 cfu E. coli /100ml
Sam Wise and Angela Corbin
Fig. 8
PCR
DWS & SCR
J Cluster LOG(mFC CFU FC/100 ml) vs. OB
0
1
2
3
4
5
6
0.00 5.00 10.00 15.00 20.00 25.00 30.00 35.00 40.00
OB Value
LOG
(mFC
)
J1 J1A J2J3 J4 J5 J6J6A J7 J8 J9Negligible Drinking Water Cut Off Possible Anthropogenic Probable AnthropogenicPrimary Contact Cut Off Data Set Trend Line
FC
FC
Sam Wise and Angela Corbin
*Highest Human Input Site
J6 Culvert between Romy & Mar, Hwy 1, south Lockport J5 Culvert under Hyland Drive drainage canal flows back toward the 40A Canal
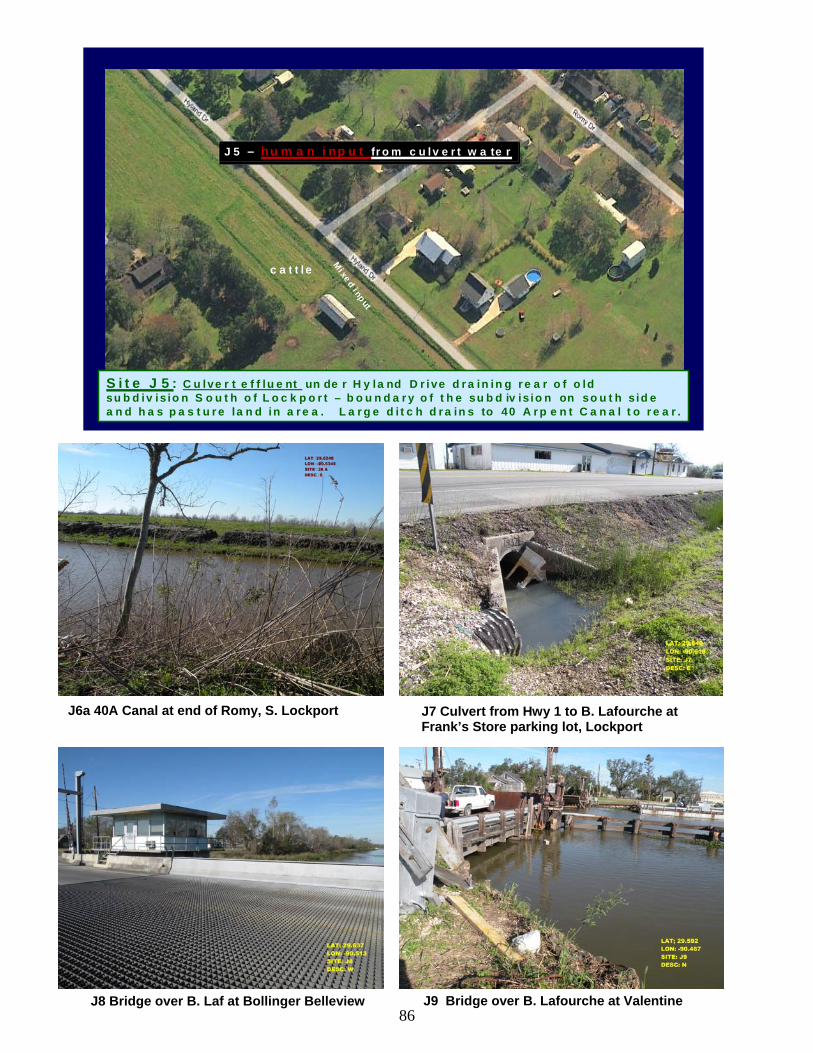
86J8 Bridge over B. Laf at Bollinger Belleview J9 Bridge over B. Lafourche at Valentine
J6a 40A Canal at end of Romy, S. Lockport J7 Culvert from Hwy 1 to B. Lafourche at Frank’s Store parking lot, Lockport
J5 – h um a n inp u t from culv ert wa terJ5 – hu m a n inp u t from culv ert wa te r
S ite J 5: C ulver t e f f luent un de r Hy land D rive d ra in ing rear o f o ld subdiv ision S outh o f Lockport – boundary o f the subd iv ision on south side and has pas ture land in area . Large d itch dra ins to 40 A rp ent C anal to rear.
cattle
Mixed input

87
Pump station from 40A into canal that can drain back to the Company Canal and eventually to B. Lafourche south of the Mathews South Water District No. 1 Plant on Hwy 308.
Unsewered cluster of Mar, Hyland and Romney, S. Lkpt
40A Canal Canal that connects back to the Lockport Company Canal
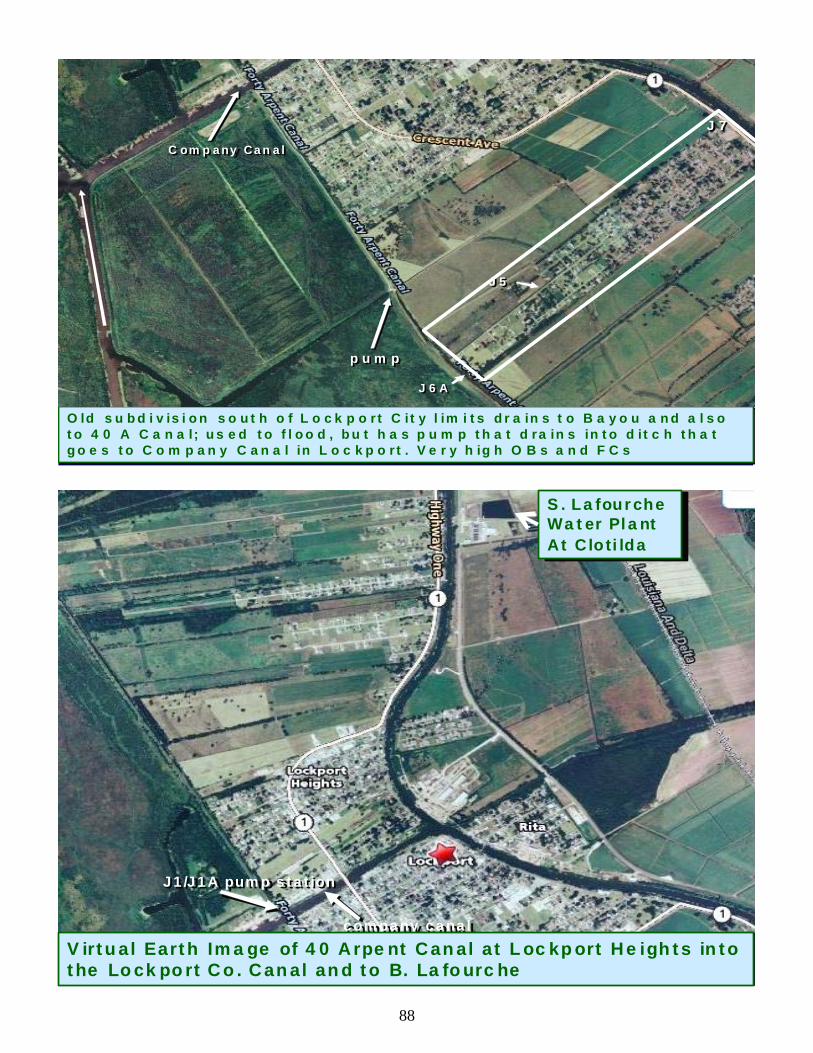
88
S. Lafourche Water PlantAt Clotilda
S. Lafourche Water PlantAt Clotilda
J1/J1A pump stationJ1/J1A pump station
company cana lcompany canal
Virtual Earth Image of 40 Arpent Canal at Lockport Heights into the Lockport Co. Canal and to B. Lafourche
Virtual Earth Image of 40 Arpent Canal at Lockport Heights into the Lockport Co. Canal and to B. Lafourche
O l d su b di v is io n so u th o f L o c kp o rt C it y l im i ts d ra in s to B a yo u a n d al so to 40 A C an a l; u se d to f l o od , b ut h a s p u m p t ha t d ra i ns in to di tc h t ha t g o es to Co m p a n y C a na l i n Lo c k po r t. V er y hi gh O B s an d F C s
O ld su bd i v is i on so ut h o f L o ck p o rt C it y l im i ts dr a in s t o B a yo u a nd a l so to 4 0 A C a n a l; us ed to f l oo d , bu t h a s p u m p th a t d ra in s in to d it c h th a t go e s to C o m p an y C an a l in L o c kp o rt . Ve r y h ig h O B s a n d F C s
p u m pp u m p
J 5J 5
J 6 AJ 6 A
J 7J 7
C om p a n y Ca n a lC om p a ny Ca n a l
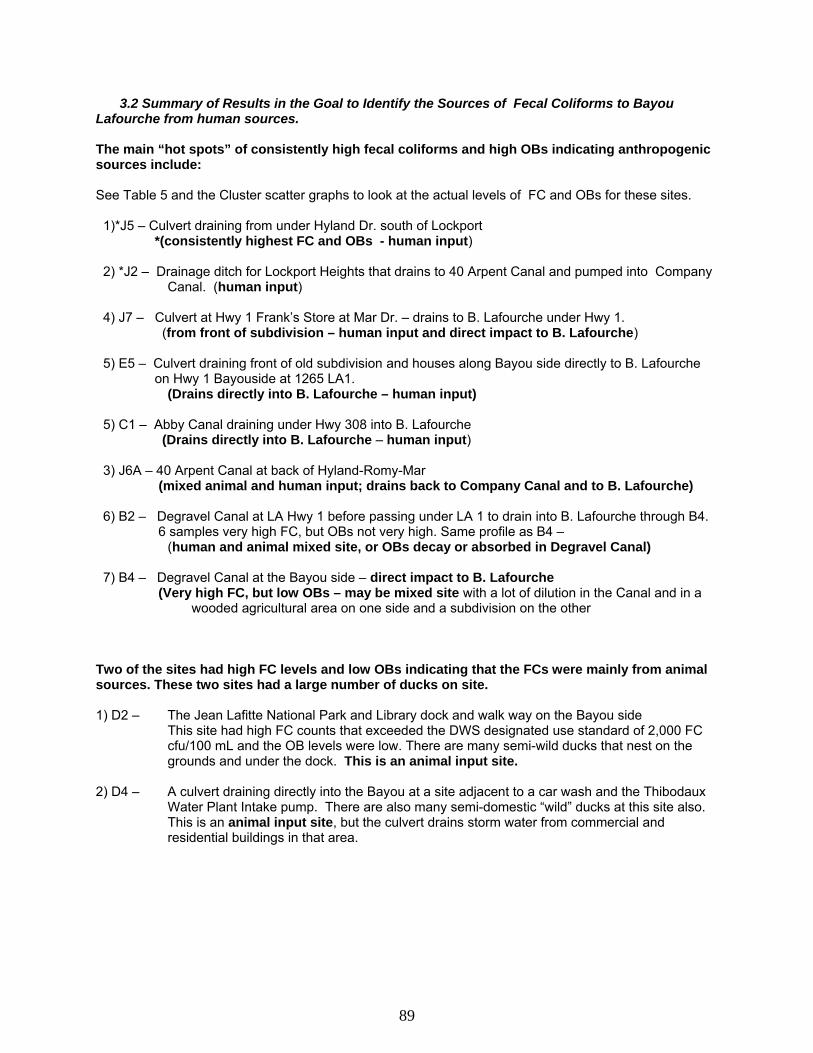
89
3.2 Summary of Results in the Goal to Identify the Sources of Fecal Coliforms to Bayou Lafourche from human sources. The main “hot spots” of consistently high fecal coliforms and high OBs indicating anthropogenic sources include: See Table 5 and the Cluster scatter graphs to look at the actual levels of FC and OBs for these sites. 1)*J5 – Culvert draining from under Hyland Dr. south of Lockport *(consistently highest FC and OBs - human input) 2) *J2 – Drainage ditch for Lockport Heights that drains to 40 Arpent Canal and pumped into Company Canal. (human input) 4) J7 – Culvert at Hwy 1 Frank’s Store at Mar Dr. – drains to B. Lafourche under Hwy 1. (from front of subdivision – human input and direct impact to B. Lafourche) 5) E5 – Culvert draining front of old subdivision and houses along Bayou side directly to B. Lafourche on Hwy 1 Bayouside at 1265 LA1. (Drains directly into B. Lafourche – human input) 5) C1 – Abby Canal draining under Hwy 308 into B. Lafourche (Drains directly into B. Lafourche – human input) 3) J6A – 40 Arpent Canal at back of Hyland-Romy-Mar (mixed animal and human input; drains back to Company Canal and to B. Lafourche) 6) B2 – Degravel Canal at LA Hwy 1 before passing under LA 1 to drain into B. Lafourche through B4. 6 samples very high FC, but OBs not very high. Same profile as B4 – (human and animal mixed site, or OBs decay or absorbed in Degravel Canal) 7) B4 – Degravel Canal at the Bayou side – direct impact to B. Lafourche (Very high FC, but low OBs – may be mixed site with a lot of dilution in the Canal and in a wooded agricultural area on one side and a subdivision on the other Two of the sites had high FC levels and low OBs indicating that the FCs were mainly from animal sources. These two sites had a large number of ducks on site. 1) D2 – The Jean Lafitte National Park and Library dock and walk way on the Bayou side This site had high FC counts that exceeded the DWS designated use standard of 2,000 FC cfu/100 mL and the OB levels were low. There are many semi-wild ducks that nest on the grounds and under the dock. This is an animal input site. 2) D4 – A culvert draining directly into the Bayou at a site adjacent to a car wash and the Thibodaux Water Plant Intake pump. There are also many semi-domestic “wild” ducks at this site also. This is an animal input site, but the culvert drains storm water from commercial and residential buildings in that area.

90
The cleanest site was the site with very low (non-detectable) FC levels and OB values that did not indicate any OB input. 1) C5 - The lake in “The Lakes” new luxury home development on LA Hwy 308 next to the Abby Road subdivision which is also mainly a luxury home site, yet is contributing high FC and OB to B. Lafourche in its main drainage canal. The Lakes development has an oxidation pond which is apparently very effective. The lake is extremely pristine thus far. This is the site with consistently low FCs and low OBs: (Best scenario – cleanest sites) 2) C6 - The drainage canal at the control gate of the lake in “The Lakes” development also has very low FC counts and OB values. NOTE: Since it was not part of the QAPP or SOPs, the use of a handheld Turner fluorometer to get optical brightener readings was only for the purpose of obtaining a rough indicator of anthropogenic input. This study was not designed or funded at a level to include major photo inactivation studies on the significance of fluorometer OB readings at different sites. However, we did use the method of Hartel et al., 2006 to produce our Standard OB solution of 50mL/L 2X liquid Tide Detergent (Fresh Spring) and set the fluorometer to 100 fluorescent units. We did a small photo inactivation study on our J cluster because it consistently had the highest fecal coliform numbers and some of the sites within the J cluster had consistently high OB readings (10 or >). Hartel did photo inactivation studies with natural organic matter from the Suwannee River and the Nordic Reservoir using 5 minutes of inactivation with a 365 nm ultra violet (UV) Black-Ray. His highest % reduction using the handheld Turner fluorometer was 13.6%. We got comparable % reductions using this method with our J cluster. The three sites that had the highest levels of FCs and OBs had average (mean of duplicates) 12.9 % reduction (Lafo-J9A), 11.44 % reduction (Lafo-J2), and 10.69% reduction (Lafo-J5). Overall, those sites that were deemed human sites by sanitary survey of sources generally had the higher OB readings (10 or more). Those sites that had animal impact with high FCs had generally low OB readings (under 4). Some sites had mixed input (Site Lafo-J6A). For our proposed second study in Bayou Lafourche, we will have funding to evaluate the photodecay at all of the sites. We will have to consider the work of Gao et al. 2009, who just published a study recommending a different protocol than Hartel et al. 2006. Table 6. below shows the results of some of the J cluster samples results from our preliminary study on photodecay of environmental water samples with fecal coliform input. However it is very important to remember that there is no standard method of quantitatively evaluating levels of OBs from anthropogenic sources because there are too many detergents with varying and unknown amounts of OBs. It was only used as a rough indicator as correlated to fecal coliform numbers.

91
Table 6. Preliminary Optical Brightener UV Degradation Study of the J Cluster site
Preliminary Optical Brightener UV Degradation Study (Sam Wise) OB STANDARD =50μL/L in DI of 2X Tide liquid Fresh Spring -originally set to 100 calibration (degraded) 5 min UV with BLACKRAY (336nm) on plate spreading wheel (polymethacrylate cuvettes)
% Reduction in OBs after 5 min. UV w Black Ray 336nm
Sample ID PRE 1 PRE 2 POST 1 POST 2 1.00 2.00 AVG DI water control 0.00 0.00 0.00 0.00 *OB STANDARD 77.13 76.89 51.73 50.34 32.93 34.53 33.73J1 3.829 3.794 3.52 3.506 8.07 7.59 7.83 J1A (40A Canal- end of Romy St) 5.914 5.891 5.153 5.122 12.87 13.05 12.96*J2 (Large cement ditch draining Lkpt. Heights) 13.39 13.27 11.83 11.78 11.65 11.23 11.44J3 3.343 3.282 3.084 3.071 7.75 6.43 7.09J4 2.453 2.451 2.247 2.226 8.40 9.18 8.79*J5 (Culvert at Hyland Dr) 15.57 15.48 13.9 13.83 10.73 10.66 10.69J6A 14.24 14.5 14.08 13.9 1.12 4.14 2.64*J7 (Culvert Hwy 1 at Franks Store) 8.25 8.25 8.211 7.407 7.38 10.22 8.80J8 3.693 3.711 3.414 3.602 7.55 2.94 5.24J9 3.544 3.617 3.311 3.481 6.57 3.76 5.15G1 3.243 3.251 3.041 3.023 6.23 7.01 6.62G2 3.116 3.221 3.001 2.981 3.69 7.45 5.60G3 3.029 3.011 3.000 2.871 0.96 4.65 2.80 Method: Hartel et al., 2006
*With the exception of J1A these sites were selected as having both high FC and OB before this OB photodecay preliminary study was done. The % reduction of OB readings before and after UV treatment are consistent with the work of Hartel et al. 2006. NOTE: The only FC sample count for J1 that was above the DWS designated use standard (2,000 FC cfu/100 mL) was the one for this study. The FC cfu/100mL was 6,000, but the OB was only 5.91. Despite this medium range of OB levels, this sample showed the greatest % reduction after UV treatment, which indicated that it had OB. It was also a site chosen as a mixed human and animal site because the drainage canals to this site are adjacent to cattle pastures on both sides. Overall the project plan and method of using a combination of GIS cluster maps, digital images of each sampling site, virtual earth or MapQuest aerial views of sites, and a fluorometer to detect the possible presence of optical brighteners (OBs) as a rough indicator for human sewage or gray water input into the drainage systems to Bayou Lafourche in Lafourche Parish worked well. The summer months were expected to have the highest levels of FC’s and we did observe that in some sites where there was a constant supply of water or rainfall. However, with the heat, there was also a drought and some of our sampling ditches and storm drains were dry in the sampling period (See Table 2 below). Site fecal coliform results that are above the EPA/LDEQ designated use water quality parameters for fecal coliforms for primary contact recreation (PCR), secondary contact recreation (SCR) and drinking
92
water source (DWS) are highlighted in yellow. Sites with an OB reading of 5.00 or greater are also highlighted in yellow as probable anthropogenic or anthropogenic (10.00 or more OB). Sites with both anthropogenic OB levels and FC levels that exceed the designated use levels for PCR (200 MPN/100ml), SCR (2,000 MPN/100ml) and DWS (2,000 MPN/100ml) will be targeted for possible BMP’s or other remediation to eliminate release of poorly treated or untreated sewage into the drainage basin of Bayou Lafourche. The QAPP and SOPs included detailed protocols for sampling and analysis of fecal coliforms according to the Standard Methods (APHA et al, 1998). Graduate students and P.I.s were trained by our QA/QC officer, Angela Corbin to use the SOPs and QAPP and to make certain that all documenting paper work was prepared each sampling trip. Recommendations and Use of Project The LDEQ can use the results of the potential sources of anthropogenic fecal or sewage input into the Bayou Lafourche drainage basin to better address the problem of meeting the EPA TMDL for Bayou Lafourche. Possible solutions may be the implementation of Best Management Practices (BMP’s) and the passage of local ordinances to address the faulty treatment systems. The P.I. will assist the LDEQ officials in implementing these recommendations.
4.0 PUBLIC INVOLVEMENT AND COORDINATION
4.1 STATE AGENCIES 1) The Louisiana Department of Environmental Quality Our main cooperating state agency was the Louisiana Department of Environmental Quality (LDEQ) and our Project Officers: Geologist Supervisor-AEPS, Howard Fielding; Project Manager, Jesse Means; and QA Representative, Micaela Coner. They provided us with maps, shapefiles of our protection areas and GPS coordinates for some potential drainage sources to B. Lafourche. They were also always available for support and help. Additionally, our Project Director made quarterly visits and gave helpful information and input. Additionally individual package plants (6,966 in Lafourche Parish), drinking water plant intake pump GPS coordinates (6 Drinking water plant intake pumps), and drainage pump stations (91) were obtained from LDEQ. After meeting with the LDEQ officials to obtain an overview of the proposed project and expected deliverables, the contractors began to meet with state, parish, local officials, and even private environmental company sources to gather as much existing information as possible to help in determining the best sampling locations within the protection areas. 2) The Louisiana Department of Health and Hospitals
Subdivision package plant GPS coordinates (284) were obtained from the Louisiana Department of Health and Hospitals from Teda Boudreaux.
93
4.2 FEDERAL AGENCIES
The U.S. Environmental Protection Agency had to approve our Contract, QAPP and SOPs.
4.3 LOCAL GOVERNMENTS, INDUSTRY, ENVIRONMENTAL AND OTHER GROUPS, PUBLIC- AT- LARGE
The P.I.’s met with David Poinceau and Steve Folse, former Public Works employees with the Lafourche Parish Government to get all information, maps, data, etc. that they had concerning the drainage in the Parish. We also got our recent post Hurricane Gustov new GIS aerial maps from Lafourche Parish.
The P.I.’S met with the City of Thibodaux Director of Public Works, Kermit Kraemer to discuss the city sewage boundaries, and storm sewer drainage into Bayou Lafourche within the city limits.
We also met with the Director of the Bayou Lafourche Fresh Water District, Archie Chaisson to get as much input as possible on possible sources of fecal coliforms to the Bayou.
GPS coordinates for all drainage culverts to the Bayou Lafourche study area were obtained from an environmental company report. (Note: Many of these culverts do not connect directly to open drainage ditches in subdivisions).
The P.I. taught a graduate workshop course, “Environmental Regulation, Law and Policy Workshop” in the Fall of 2008. The Environmental Issue for this Course was the Bayou Lafourche and the reintroduction of the Mississippi River. Invited speakers and participants were very helpful in providing a tremendous amount of information to the students that was very useful for this project. Speakers included:
1) Simone Maloz, Executive Director of “Restore or Retreat” (NPO) Title: "Recognizing the Importance of Bayou Lafourche: Now and Then." 2) Ted Falgout, Executive Director, Port Fourchon Title: "Bayou Lafourche, a unique and significant corridor to the Gulf" 3) Windell Curol, General Manager, South Lafourche Levee Board Association Title: “Water Rights and Water Wrongs” 4) Hugh Caffrey, President, Valentine Chemicals Title: "Industrial Water Users of Bayou Lafourche" 5) Kermit J. Kraemer, Jr., Director of Public Works, City of Thibodaux Title: “MS4 Regulations in the City of Thibodaux”
6) Archie Chaisson, Executive Director, Bayou Lafourche Fresh Water Division
7) Robert Routon, PE, Bayou Lafourche Reintroduction Project, Louisiana Department of Natural Resources
8) Susan Bergeron, Bayou Lafourche Program Coordinator for the Barataria Terrebone National Estuary Program
9) Michelle Robert, Chief Engineer, CH2MH, M.R. Project Title: Reintroduction to Bayou Lafourche, Project Design
94
9) Dan Duplantis, Executive V.P. and General Manager Raceland Raw Sugar Corp Activity: Class Trip to Raceland Sugar Mill
10) Jesse Means, Louisiana Department of Environmental Quality, Drinking Water Source Program and Non-Point Source Program.
4.4 OTHER SOURCES OF FUNDS This contract did not require match, but Sam Wise, the P.I.’s graduate student did the monthly sampling and fecal coliform analysis. He also constructed all of the scatter graphs for this report. He was paid as a graduate Teaching Assistant and was trained by the P.I.’s to do this work according to the QAPP and the SOPs. The work will be used for a part of his graduate research to complete his M.S. degree.
5.0 ASPECTS OF THE PROJECT THAT DID NOT WORK WELL The main problems we encountered were when we had to deal with the University shutdown for some time after Hurricane Gustov. It caused us to lose the month of September 2008 for sampling.
6.0 FUTURE ACTIVITY RECOMMENDATIONS The P.I.’s have submitted another proposal to continue identifying the sources of fecal coliforms to the Bayou from Labadieville to Donaldsonville, LA. This proposed project will be a more comprehensive effort that is a continuation of the current project between Nicholls State University and the Louisiana Department of Environmental Quality (LDEQ) that will end September 30, 2009. This first project developed the approach and methods to identify “hot spots” of human contamination from faulty home sewage package plants in the LDEQ designated “protection areas” 1 and 2 of Bayou Lafourche from the Labadieville Bridge on Hwy 398 in Assumption Parish to the old Valentine Bridge below Lockport at the old Valentine Sugar Mill (closed) and the Valentine Chemical Plant. This second proposed project will identify the input of fecal coliform human sewage indicators from single dwelling on-sight single home sewage package plant effluents to structures (culverts, ditches, canals) in Ascension and Assumption Parishes (from the siphon structure at the Mississippi River in Donaldsonville to the Lafourche Parish line) that can potentially drain into Bayou Lafourche and impair the microbial water quality standards for its designated uses – particularly drinking water source, and in some areas primary and secondary contact recreation, and the dissolved oxygen (D.O.) for a freshwater aquatic habitat. The QAPP (EPA 2000) will include the protocols for maintaining and calibrating all equipment used in this proposed contract work. The research environmental and public health microbiological laboratory at Nicholls State University is in 208 Gouaux Hall and is fully equipped for fecal coliform and E. coli CFU/100ml membrane filtration or MPN/100 ml isolation and enumeration methods from the 20th Ed of Standard Methods for the Examination of Water and Wastewater, APHA, AWWA, WEF, 1998 for both 9222 D, Fecal Coliform membrane filter procedure and 9222G MF E. coli methods. Basic nutrients including nitrate using HACH NitraVer 5 (EPA standard method 8039), orthophosphate - HACH PhosVer 3 (EPA standard method 8048) and total organic carbon using HACH COD Reagent 0-15,000 ppm High Range+ (HR+) in a Hach COD Reactor Model 45600 will be included in the proposed analyses.
95
Equipment in the environmental and public health microbiology research laboratory includes autoclaves, fecal coliform waterbaths, incubators, pH meters, field equipment to take all physicochemical parameters at the selected sites (pH, temperature, D.O., turbidity, salinity, and optical brighteners), a multiple filtration apparatus in the laboratory allowing 12 water samples to be filtered at the same time, and expertise in these microbiological methods. The Department of Applied Sciences includes the only B.S. program in the State of Louisiana in Geomatics. Dr. Balaji Ramachandran has a Ph.D. in Geomatics and is a member of the scientific team in charge of all GIS and GPS equipment related deliverables. The Nicholls State University research team developed a successful QAPP and SOPs for our Project 1 – Bayou Lafourche Fecal Coliform Sources from Labadieville to Valentine. Angela Corbin is the QAPP Research Team Leader and will be responsible for development of the QAPP and SOPs for this continuing second proposed project. Ms. Corbin has extensive experience with SOPs and QAPP design and implementation.
7.0 BIBLIOGRAPHY: APHA, AWWWA, WEF. 1998. Standard Methods for the Evaluation of Water and Wastewater. 20th Ed. Section 9222 D Fecal coliform membrane filter procedure. pp. 9-63-9-65; and Section 9222 G MF E. coli procedures, pp 9-67-9-68. BTNEP 1995. Barataria-Terrebonne National Estuary Program Characterization Report. BTNEP, Baton Rouge. pp 8-22. EPA, Region VI Watershed Management Section. 2004. “TMDL for Fecal Coliform for Bayou Lafourche, LA” Task Order # 0009, May 21, 2004. Cao, Y., F.F. Griffith and S. B. Weisberg. 2009. Evaluation of optical brightener photodecay characteristics for the detection of human fecal contamination. Water Research, 43(8):2273-2279. Hartel, P.G., K. Rodgers, G.L. Moody, S.N.F. Hemmings, F.A. Fisher, and J.L. McDonald. 2008. Combining targeted sampling and fluorometry to identify human fecal contamination in a freshwater creek. Journal of Water and Health. 6(1):105-116. Hartel, P.G. 2006. Targeted Sampling and Bacterial Source Tracking to Identify Sources of Fecal Contamination Responsible for Beach Advisories on the Georgia Coast. Final Report to the EPA. EPD Grant Number 751-60049, 42pp. Kilgen, M.B., J. Gann, M. Hemard, A. Corbin, D. Luke, V. Cheramie, S. Rabalais and D. Duet. 1995. Fecal coliform monitoring, identification, and assessment within the Barataria-Terrebonne estuarine complex. BTNEP Publ. No. 18, Barataria-Terrebonne National Estuary Program, Thibodaux, LA. 87 pp. LDEQ. 2004. “State of Louisiana Water Quality Management Plan Water Quality Inventory Integrated Report (Section 305(b) 2004 Report)” http://www.deq.louisiana.gov/portal/tabid/2201/Default.aspx Saluta, M. A., C. Hagedorn, A. Hassall, J. W. Dickerson, Jr. and T. R. Wade. 2007. Fluorometric Detection of Optical Brighteners in Detergents as a Human-Specific Marker in Microbial Source Tracking. Abstract No. Q 314. Presented at the 107th General Meeting of the American Society for Microbiology, May 21-25, 2007. Toronto, Canada.