SOONERCARE PAIN MGMT PROGRAM INDEPENDENT EVALUATION
38
SOONERCARE PAIN MGMT PROGRAM INDEPENDENT EVALUATION THE PACIFIC HEALTH POLICY GROUP DECEMBER 2018
Transcript of SOONERCARE PAIN MGMT PROGRAM INDEPENDENT EVALUATION
SOONERCARE PAIN MGMT PROGRAMINDEPENDENT EVALUATION
THE PACIFIC HEALTH POLICY GROUPDECEMBER 2018

2
PHPG is conducting an evaluation of the SoonerCare HMP Pain Management Program, as part of our larger HMP evaluation activities
This presentation contains interim evaluation findings
Evaluation activities are continuing and will be reported going forward as part of the larger SoonerCare HMP annual evaluation released in the Spring
Pain Mgmt Program Evaluation - Dec 2018
INTRODUCTION

3
1. Practices that undergo pain management practice facilitation will become more effective in treating patients with alternatives to opioids and/or benzodiazepines to transition to safer treatment alternatives
2. Patients at these practices who are dependent on opioids and/or benzodiazepines will reduce their use of the drugs post-facilitation, both in absolute terms and compared to patients of practices that have not undergone facilitation
3. Patients at these practices who are dependent on opioids and/or benzodiazepines will experience lower ED and inpatient hospital utilization rates, and overall health expenditures
4. The pain management program will be cost-effective, taking into consideration its impact on patient utilization and program administration costs (Spring 2019 component)
Pain Mgmt Program Evaluation - Dec 2018
EVALUATION HYPOTHESES
4
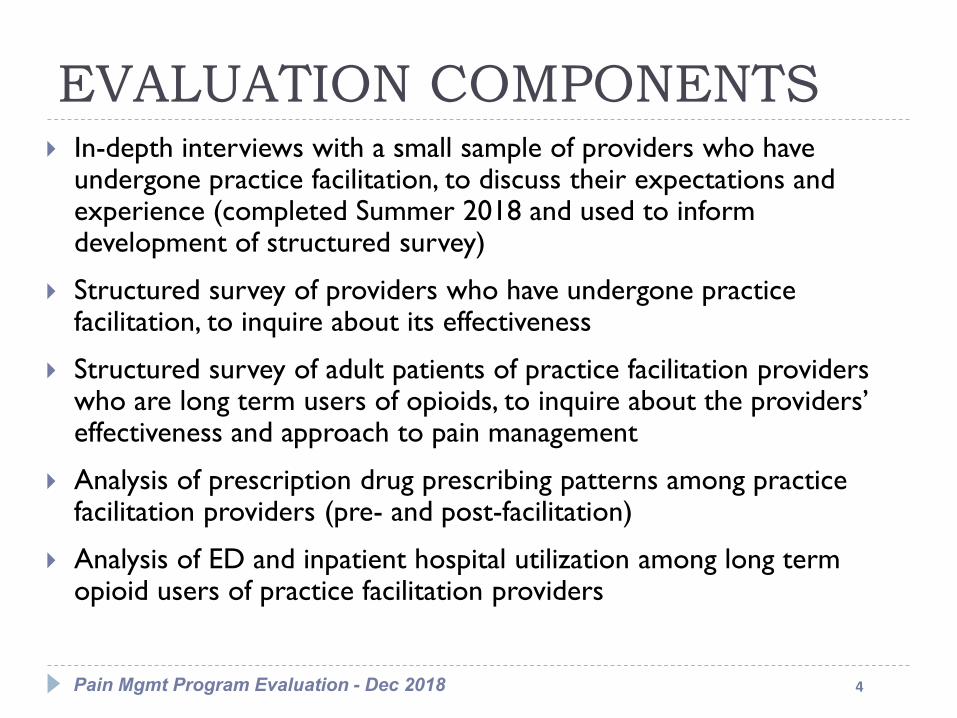
In-depth interviews with a small sample of providers who have undergone practice facilitation, to discuss their expectations and experience (completed Summer 2018 and used to inform development of structured survey)
Structured survey of providers who have undergone practice facilitation, to inquire about its effectiveness
Structured survey of adult patients of practice facilitation providers who are long term users of opioids, to inquire about the providers’ effectiveness and approach to pain management
Analysis of prescription drug prescribing patterns among practice facilitation providers (pre- and post-facilitation)
Analysis of ED and inpatient hospital utilization among long term opioid users of practice facilitation providers
Pain Mgmt Program Evaluation - Dec 2018
EVALUATION COMPONENTS

5
PHPG conducted 24 interviews in October – November 2018
Respondents included 22 Family/General Practice physicians, one internist and one office manager
Respondents were long-time Medicaid providers, with 21 of 24 reporting that they have participated in Medicaid for more than five years
Medicaid, on average, accounted for approximately 25% of the providers’ caseloads
The greatest percentage of respondents reported learning of the program from Telligen (44%), followed by the OHCA (33%), another provider (11%) or attendance at a meeting (11%)
Pain Mgmt Program Evaluation - Dec 2018
PROVIDER SURVEY

6
What were your reasons for deciding to participate? (Multiple reasons allowed)
Pain Mgmt Program Evaluation - Dec 2018
PROVIDER SURVEY
Reason Percent
Improve care management/education of patients with chronic pain 89%
Improve monitoring of patient prescription pain medicine use 83%
Obtain information on alternative pain management techniques 44%
Receive assistance in referring patients for behavioral health services/counseling 44%
Receive assistance in referring patients for pain management services 39%
Other 6%

7
How important are these pain management practice facilitation activities? (Percent saying “very important”)
Pain Mgmt Program Evaluation - Dec 2018
PROVIDER SURVEY
Activity Percent
Receiving baseline assessment of how well have been managing 79%
Receiving training on conducting initial patient pain assessments 71%
Receiving training on methods for monitoring medication use 70%
Receiving training on monitoring pain/functional status 67%
Receiving ongoing education and assistance after onsite 63%
Receiving copies of pain/substance use risk assessment tools 58%
Receiving information on alternative pain management techniques 58%
Receiving assistance in referring to pain management resources 58%
Having a practice facilitation nurse onsite 50%
Receiving training on motivational interviewing 46%

8
How helpful were each of these activities in improving management of patients with chronic pain? (Percent saying “very helpful”)
Pain Mgmt Program Evaluation - Dec 2018
PROVIDER SURVEY
Activity Percent
Receiving baseline assessment of how well have been managing 78%
Receiving training on conducting initial patient pain assessments 48%
Receiving training on methods for monitoring medication use 52%
Receiving training on monitoring pain/functional status 52%
Receiving ongoing education and assistance after onsite 70%
Receiving copies of pain/substance use risk assessment tools 52%
Receiving information on alternative pain management techniques 39%
Receiving assistance in referring to pain management resources 30%
Having a practice facilitation nurse onsite 43%
Receiving training on motivational interviewing 35%
9
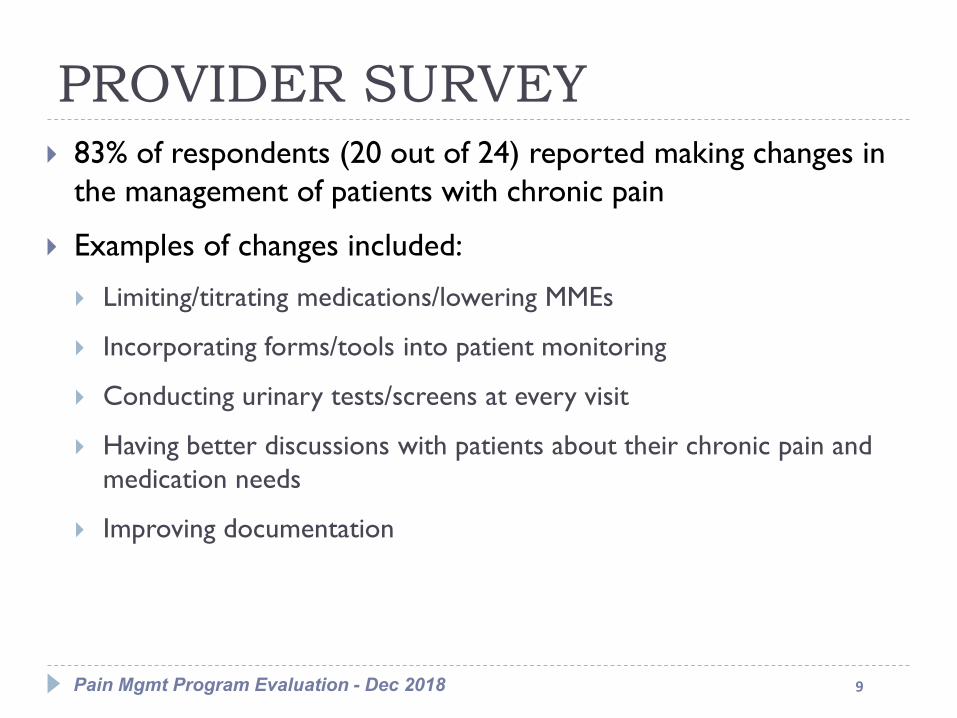
83% of respondents (20 out of 24) reported making changes in the management of patients with chronic pain
Examples of changes included:
Limiting/titrating medications/lowering MMEs
Incorporating forms/tools into patient monitoring
Conducting urinary tests/screens at every visit
Having better discussions with patients about their chronic pain and medication needs
Improving documentation
Pain Mgmt Program Evaluation - Dec 2018
PROVIDER SURVEY

10
88% of respondents reported attempting to make a referral to a pain management provider
Respondents reported some difficulty in making referrals, with 24% describing it as “very difficult”, 67% as “somewhat difficult” and only 10% as “not at all difficult”
Respondents who have experienced difficulty cited multiple causes (providers could give more than one reason)
Pain Mgmt Program Evaluation - Dec 2018
PROVIDER SURVEY
Referral Difficulty Reason Percent
Lack of providers willing to take Medicaid 95%
Providers require patients not to use any prescription opioids 32%
Providers rely too heavily on prescription opioids 5%
Other 37%
“Other” included: lack of providers in rural community; referral facility is full; lack of success when referred in the past

11
Respondents were generally satisfied with their experience:
52% reported being “very satisfied”, 44% were “somewhat satisfied” and only 4% were “somewhat dissatisfied” (one provider)
91% would recommend the program to colleagues
Six respondents also had an embedded Telligen health coach; five of six said it would be “very helpful” to integrate pain management into the health coach’s duties (one said “somewhat helpful”)
Respondents did have suggestions for improving the program:
Shorten meeting times and do more via email
Bring their own computer
Provide examples of office policies
Routine follow-up after completion of the onsite portion
More training on all of the alternative treatment techniques
Pain Mgmt Program Evaluation - Dec 2018
PROVIDER SURVEY

12
PHPG created a survey universe of patients who were treated at practice facilitation sites
Patients were long-term users of prescribed opioids
The survey universe was stratified by number of prescriptions filled; PHPG targeted patients with highest counts
Patients were notified by mail in advance of being contacted
The survey was structured to ask about their experience with the provider and not explicitly about their opioid use
PHPG conducted 103 interviews in November 2018
Pain Mgmt Program Evaluation - Dec 2018
PATIENT SURVEY

13
Respondents were asked to name the conditions for which they were receiving treatment (multiple answers allowed)
Pain Mgmt Program Evaluation - Dec 2018
PATIENT SURVEY
Note: Most common “other” included other joints (e.g., hip, shoulder) and nerve pain

14
Respondents were asked how long they had been receiving treatment for pain – 77% said three or more years
Respondents were asked if their provider has worked with them to develop a pain treatment plan to reduce their pain – 67% said “yes”
Respondents were next asked whether their doctor had discussed one or more techniques for helping patients with pain to feel better (see next slide)
Pain Mgmt Program Evaluation - Dec 2018
PATIENT SURVEY

15
Pain management techniques discussed with provider (percent saying “yes”)
Pain Mgmt Program Evaluation - Dec 2018
PATIENT SURVEY

16
Among those who said “yes”, respondents were asked if they tried the technique and if it helped
Pain Mgmt Program Evaluation - Dec 2018
PATIENT SURVEY

17
90% of respondents stated that their provider was currently treating their pain with medication
63% stated that their provider had made a change since treatment first started
Pain Mgmt Program Evaluation - Dec 2018
PATIENT SURVEY
Change Made Percent
Stopped taking prescription pain medication 24%
Changed at least one old medication to a new (different) one 24%
Reduced number of pills or dosage taken 21%
Stopped taking at least one medication but continue with others 11%
Take same medication but prescription is for fewer days 8%
Take old medication along with new medication 6%
Stopped at least one but take other(s) at a higher dosage 5%

18
Respondents also were asked if they discussed – and tried – any of several potential lifestyle changes to reduce pain; if so, did the change help?
Pain Mgmt Program Evaluation - Dec 2018
PATIENT SURVEY

19
Respondents were generally very satisfied with their provider 93% stated their provider listens carefully to them when
discussing pain treatment 92% stated their provider explains options for treating pain in a
way that is easy to understand 82% stated they were “very satisfied” overall with how their
provider has helped them manage pain
Respondents fell into three equal categories in terms of changes in pain level since treatment began: 33% have “more pain” 33% have “the same amount of pain” 25% have “somewhat less pain” and 7% have “very little pain”
Pain Mgmt Program Evaluation - Dec 2018
PATIENT SURVEY

20
Identified Practice Facilitation sites with start dates between January 1, 2016 and July 31, 2017
Reviewed claims volume by provider to ensure the adequacy of data
Analysis based on 40 Practice Facilitation providers
Identified opioid, benzodiazepine and buprenorphine prescriptions based on NDC listing published by Center for Disease Control (CDC) in September 2018
Created an “anchor date” for each member based on Practice Facilitation Start Date plus 60 days
Categorized pharmacy and medical claims based on Dates of Service in the twelve months prior to the modified PF Start Date and twelve months following the modified PF Start Date
Data includes individuals with a diagnosis of cancer
Morphine Milligram Equivalent Conversion Factors obtained from CDC NDC listing
Pain Mgmt Program Evaluation - Dec 2018
CLAIMS ANALYSIS

21Pain Mgmt Program Evaluation - Dec 2018
CLAIMS ANALYSISBaseline Summary (Twelve Months Preceding Practice Facilitation)
Benzodiazepines Buprenorphine Opioids Total
Providers 40 11 40 40
Prescriptions 14,553 592 30,047 45,192
Average Prescriptions per Provider 363.8 53.8 751.2 1,129.8
Patients 2,641 89 4,778 5,600
Average Patients Per Provider 66.0 8.1 119.5 140.0
Pharmacy Expenditures $ 89,899 $ 220,699 $ 1,292,474 $ 1,603,072
Average Prescription Expenditures per Provider $ 2,247 $ 20,064 $ 32,312 $ 40,077
Average Paid per Prescription $ 6.18 $ 372.80 $ 43.02 $ 35.47
Average Paid per Patient $ 34 $ 2,480 $ 271 $ 286

22Pain Mgmt Program Evaluation - Dec 2018
CLAIMS ANALYSISSummary of Benzodiazepine Drugs
Name Paid Amount Percent of TotalAlprazolam $ 36,557 40.7%Clonazepam $ 15,779 17.6%Diazepam $ 15,604 17.4%Lorazepam $ 5,119 5.7%Temazepam $ 4,950 5.5%Diazepam; lubricant $ 3,371 3.8%Triazolam $ 3,050 3.4%Clorazepate Dipotassium $ 2,687 3.0%Amitriptyline Hydrochloride/Chlordiazepoxide $ 1,322 1.5%Oxazepam $ 985 1.1%Flurazepam Hydrochloride $ 311 0.3%Chlordiazepoxide Hydrochloride $ 164 0.2%Total $ 89,899 100%

23Pain Mgmt Program Evaluation - Dec 2018
CLAIMS ANALYSISSummary of Buprenorphine Drugs
Name Paid Amount Percent of Total
Buprenorphine/naloxone $ 193,502 87.7%
Buprenorphine $ 25,817 11.7%
Buprenorphine Hydrochloride $ 1,380 0.6%
Total $ 220,699 100%

24Pain Mgmt Program Evaluation - Dec 2018
CLAIMS ANALYSISSummary of Opioid Drugs
Name Paid Amount Percent of TotalOxycodone Hydrochloride $ 451,482 34.9%Acetaminophen/hydrocodone Bitartrate $ 367,476 28.4%Acetaminophen/oxycodone Hydrochloride $ 185,538 14.4%Morphine Sulfate $ 59,370 4.6%Fentanyl $ 38,701 3.0%Acetaminophen/codeine Phosphate $ 34,537 2.7%Hydrocodone Bitartrate/ibuprofen $ 28,668 2.2%Oxymorphone Hydrochloride $ 25,670 2.0%Hydromorphone Hydrochloride $ 24,307 1.9%Tramadol Hydrochloride $ 23,023 1.8%Hydrocodone Bitartrate $ 18,876 1.5%Naloxone Hydrochloride/pentazocine Hydrochloride $ 8,914 0.7%Butorphanol Tartrate $ 7,330 0.6%Aspirin/butalbital/caffeine/codeine Phosphate $ 7,060 0.5%Apap/butalbital/caff/codeine Phos $ 5,431 0.4%Methadone Hydrochloride $ 5,018 0.4%Meperidine Hydrochloride $ 758 0.06%Aspirin/oxycodone Hydrochloride $ 176 0.01%Acetaminophen/tramadol Hydrochloride $ 84 0.01%Codeine Sulfate $ 55 0.004%Total $ 1,292,474 100%

25Pain Mgmt Program Evaluation - Dec 2018
CLAIMS ANALYSISSummary of Opioid Utilization: Number of Prescriptions
Number of Prescriptions
Number of Patients
Change Percentage ChangeTwelve Months Prior to Practice Facilitation
Twelve Months Following Practice Facilitation
1 1,272 1,088 (184) -14.5%
2 539 447 (92) -17.1%
3 323 263 (60) -18.6%
4 288 219 (69) -24.0%
5 228 210 (18) -7.9%
6 222 192 (30) -13.5%
7 180 175 (5) -2.8%
8 185 168 (17) -9.2%
9 191 143 (48) -25.1%
10 or More 1,350 1,154 (196) -14.5%
Total 4,778 4,059 (719) -15.0%

26Pain Mgmt Program Evaluation - Dec 2018
CLAIMS ANALYSISSummary of Opioid Utilization: Total Prescribed Days Supply
Total Days Supply
Number of Patients
Change Percentage ChangeTwelve Months Prior to Practice Facilitation
Twelve Months Following Practice Facilitation
15 or Less 727 658 (69) -9.5%
16 to 30 705 575 (130) -18.4%
31 to 60 491 394 (97) -19.8%
61 to 90 311 250 (61) -19.6%
91 to 180 751 628 (123) -16.4%
180 or More 1,793 1,554 (239) -13.3%
Total 4,778 4,059 (719) -15.0%

27Pain Mgmt Program Evaluation - Dec 2018
CLAIMS ANALYSIS
Summary of Opioid Utilization: Episodic "New Patients"
Prescriptions
Number of Patients
Change Percentage ChangeTwelve Months Prior to Practice Facilitation
(No Prescriptions Post-PF)
Twelve Months Following Practice Facilitation
(No Prescriptions Pre-PF)
1 1,036 855 (181) -17.5%
2 368 246 (122) -33.2%
3 198 126 (72) -36.4%
Total 1,602 1,227 (375) -23.4%

28Pain Mgmt Program Evaluation - Dec 2018
CLAIMS ANALYSISSummary of Opioid Utilization: Patients with Opioid Prescriptions Before and After Practice Facilitation
Number of Prescriptions Prior to Practice Facilitation
Total Patients
Reduction in Number of Prescriptions Same Number of Prescriptions Increase in Number of
Prescriptions
Number of Patients
Percentage of Total
Number of Patients
Percentage of Total
Number of Patients
Percentage of Total
1 236 - 0.0% 80 33.9% 156 66.1%
2 171 44 25.7% 26 15.2% 101 59.1%
3 125 38 30.4% 9 7.2% 78 62.4%
4 117 42 35.9% 7 6.0% 68 58.1%
5 121 44 36.4% 14 11.6% 63 52.1%
6 122 47 38.5% 12 9.8% 63 51.6%
7 96 41 42.7% 6 6.3% 49 51.0%
8 109 55 50.5% 9 8.3% 45 41.3%
9 120 75 62.5% 7 5.8% 38 31.7%
10 or More 1,198 702 58.6% 225 18.8% 271 22.6%
Total 2,415 1,088 45.1% 395 16.4% 932 38.6%

29Pain Mgmt Program Evaluation - Dec 2018
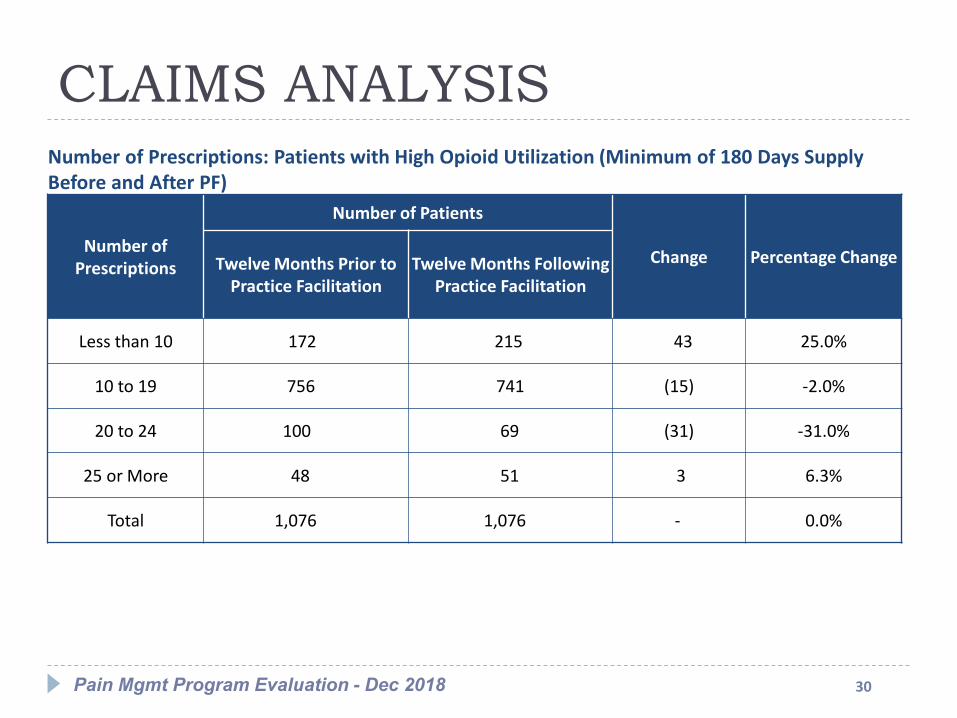
CLAIMS ANALYSISBaseline Summary: Patients with High Opioid Utilization (Minimum of 180 Days Supply Before and After PF)
Prior to PF After PF Change Percentage Change
Patients 1076 1076 0 0.0%
Prescriptions 14,202 13,761 (441) -3.1%
Pharmacy Expenditures $ 695,089 $ 596,321 $ (98,767.81) -14.2%
Average Prescriptions per Patient 13.2 12.8 (0.4) -3.1%
Average Paid per Prescription $48.94 $43.33 $ (5.61) -11.5%
Average Paid per Patient $646 $554 $ (91.79) -14.2%
30Pain Mgmt Program Evaluation - Dec 2018
CLAIMS ANALYSISNumber of Prescriptions: Patients with High Opioid Utilization (Minimum of 180 Days Supply Before and After PF)
Number of Prescriptions
Number of Patients
Change Percentage ChangeTwelve Months Prior to Practice Facilitation
Twelve Months Following Practice Facilitation
Less than 10 172 215 43 25.0%
10 to 19 756 741 (15) -2.0%
20 to 24 100 69 (31) -31.0%
25 or More 48 51 3 6.3%
Total 1,076 1,076 - 0.0%

31Pain Mgmt Program Evaluation - Dec 2018
CLAIMS ANALYSISMME: Patients with High Opioid Utilization (Minimum of 180 Days Supply Before and After PF)
Average Morphine Milligram Equivalent
(MME) per Patient (Prior to Practice
Facilitation)
Total Patients
Reduction in MME Same MME Increase in MME
Number of Patients
Percentage of Total
Number of Patients
Percentage of Total
Number of Patients
Percentage of Total
Less than 30 272 72 26.5% 60 22.1% 140 51.5%
30 to 50 514 189 36.8% 160 31.1% 165 32.1%
51 to 90 140 62 44.3% 15 10.7% 63 45.0%
91 to 150 82 50 61.0% 7 8.5% 25 30.5%
Over 150 68 43 63.2% 6 8.8% 19 27.9%
Total 1,076 416 38.7% 248 23.0% 412 38.3%

32Pain Mgmt Program Evaluation - Dec 2018
CLAIMS ANALYSISSummary of Opioid Drug Screens: Procedure Code 80305
Twelve Months Prior to Practice
Facilitation
Twelve Months Following Practice
FacilitationChange Percent Change
Patients 69 341 272 394%
Providers 2 18 16 800%
Number of Tests 105 452 347 330%
33Pain Mgmt Program Evaluation - Dec 2018
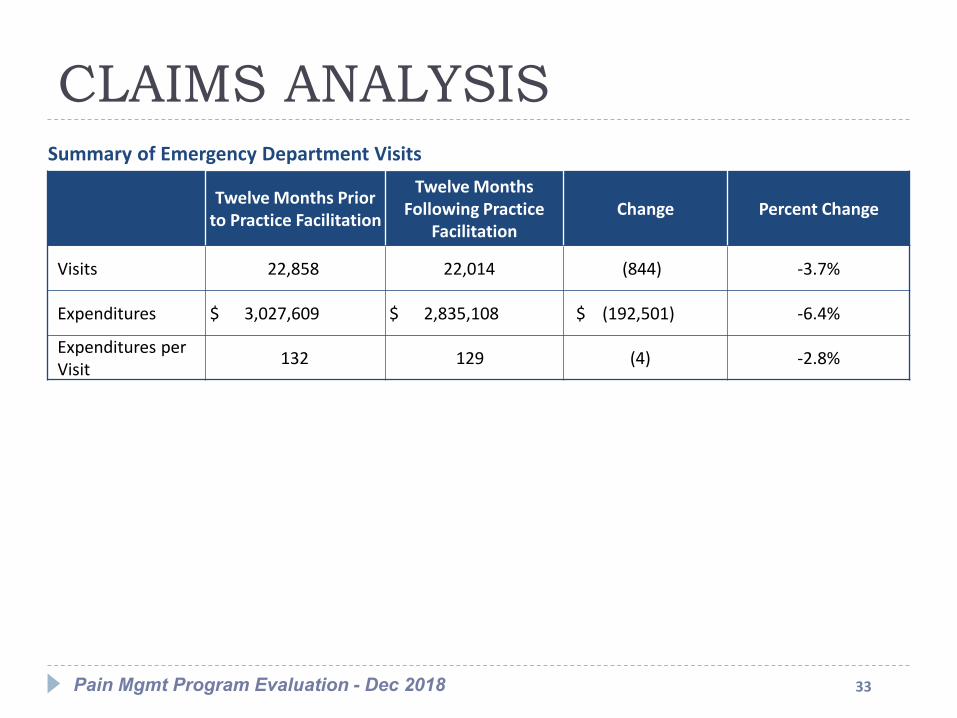
CLAIMS ANALYSISSummary of Emergency Department Visits
Twelve Months Prior to Practice Facilitation
Twelve Months Following Practice
FacilitationChange Percent Change
Visits 22,858 22,014 (844) -3.7%
Expenditures $ 3,027,609 $ 2,835,108 $ (192,501) -6.4%
Expenditures per Visit 132 129 (4) -2.8%
34Pain Mgmt Program Evaluation - Dec 2018
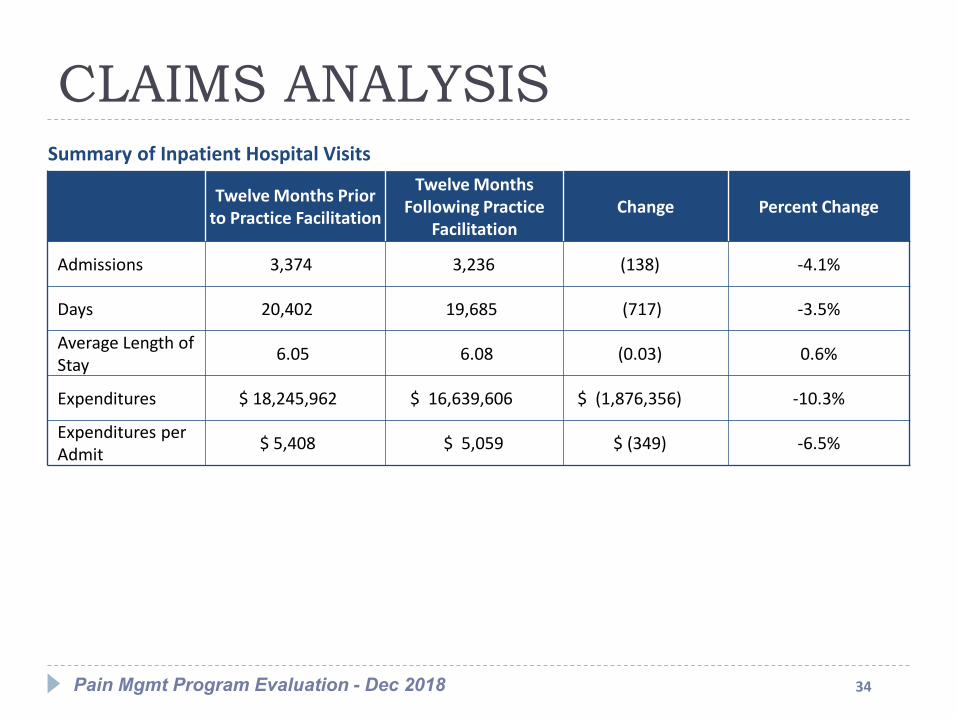
CLAIMS ANALYSISSummary of Inpatient Hospital Visits
Twelve Months Prior to Practice Facilitation
Twelve Months Following Practice
FacilitationChange Percent Change
Admissions 3,374 3,236 (138) -4.1%
Days 20,402 19,685 (717) -3.5%
Average Length of Stay 6.05 6.08 (0.03) 0.6%
Expenditures $ 18,245,962 $ 16,639,606 $ (1,876,356) -10.3%
Expenditures per Admit $ 5,408 $ 5,059 $ (349) -6.5%
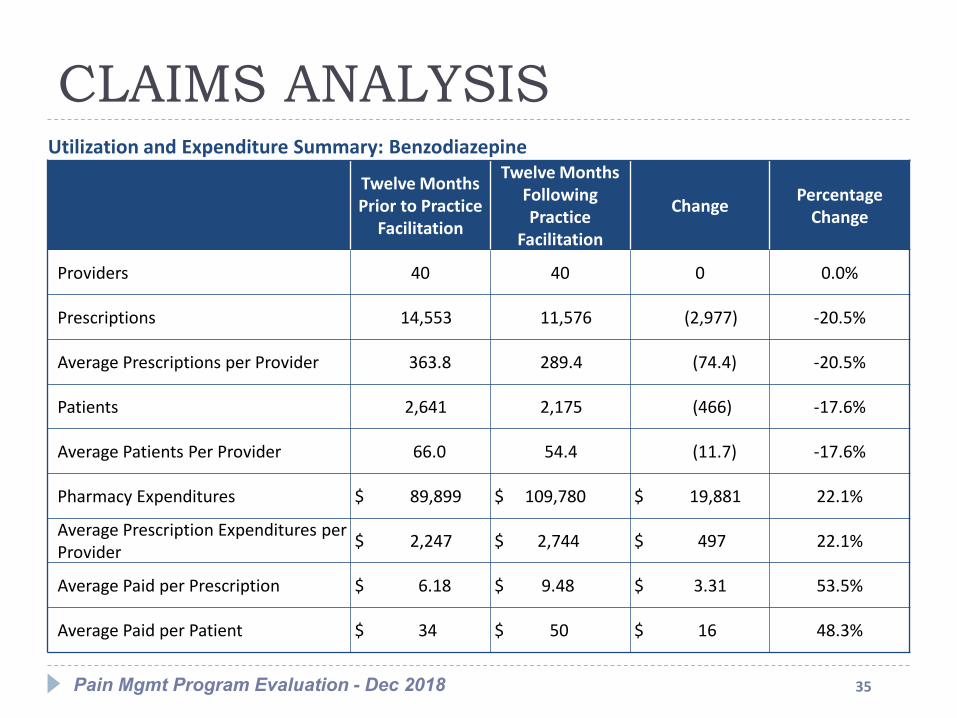
35Pain Mgmt Program Evaluation - Dec 2018
CLAIMS ANALYSISUtilization and Expenditure Summary: Benzodiazepine
Twelve Months Prior to Practice
Facilitation
Twelve Months Following Practice
Facilitation
Change Percentage Change
Providers 40 40 0 0.0%
Prescriptions 14,553 11,576 (2,977) -20.5%
Average Prescriptions per Provider 363.8 289.4 (74.4) -20.5%
Patients 2,641 2,175 (466) -17.6%
Average Patients Per Provider 66.0 54.4 (11.7) -17.6%
Pharmacy Expenditures $ 89,899 $ 109,780 $ 19,881 22.1%
Average Prescription Expenditures per Provider $ 2,247 $ 2,744 $ 497 22.1%
Average Paid per Prescription $ 6.18 $ 9.48 $ 3.31 53.5%
Average Paid per Patient $ 34 $ 50 $ 16 48.3%

36Pain Mgmt Program Evaluation - Dec 2018
CLAIMS ANALYSISUtilization and Expenditure Summary: Buprenorphine
Twelve Months Prior to Practice
Facilitation
Twelve Months Following Practice
Facilitation
Change Percentage Change
Providers 11 12 1 9.1%
Prescriptions 592 683 91 15.4%
Average Prescriptions per Provider 53.8 56.9 3.1 5.8%
Patients 89 96 7 7.9%
Average Patients Per Provider 8.1 8.0 (0.1) -1.1%
Pharmacy Expenditures $ 220,699 $ 265,331 $ 44,633 20.2%
Average Prescription Expenditures per Provider $ 20,064 $ 22,111 $ 2,047 10.2%
Average Paid per Prescription $ 372.80 $ 388.48 $ 15.68 4.2%
Average Paid per Patient $ 2,480 $ 2,764 $ 284 11.5%
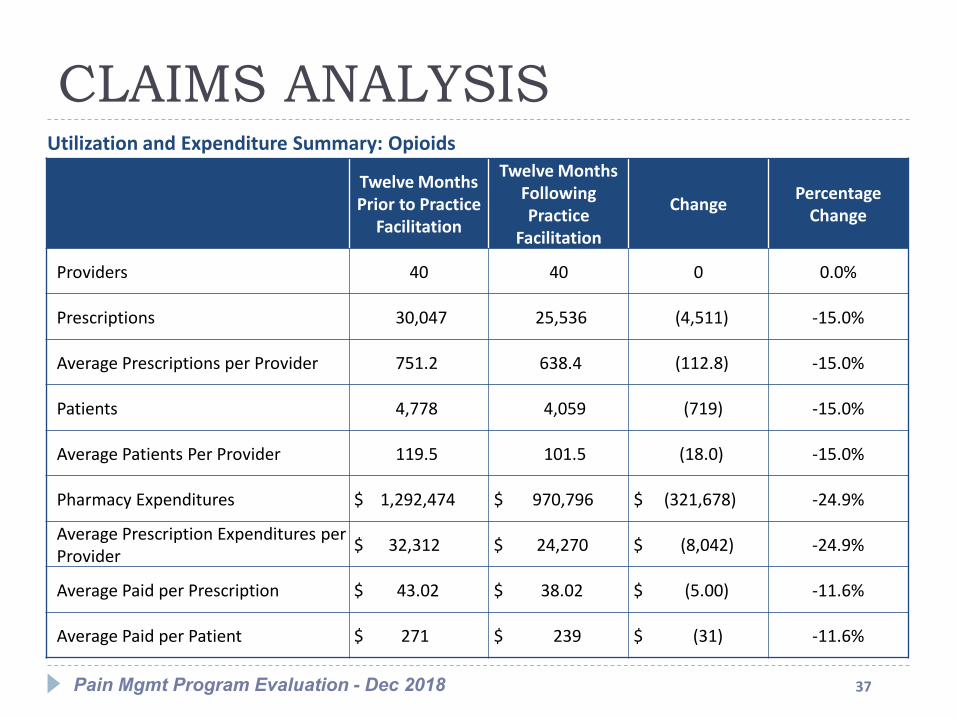
37Pain Mgmt Program Evaluation - Dec 2018
CLAIMS ANALYSISUtilization and Expenditure Summary: Opioids
Twelve Months Prior to Practice
Facilitation
Twelve Months Following Practice
Facilitation
Change Percentage Change
Providers 40 40 0 0.0%
Prescriptions 30,047 25,536 (4,511) -15.0%
Average Prescriptions per Provider 751.2 638.4 (112.8) -15.0%
Patients 4,778 4,059 (719) -15.0%
Average Patients Per Provider 119.5 101.5 (18.0) -15.0%
Pharmacy Expenditures $ 1,292,474 $ 970,796 $ (321,678) -24.9%
Average Prescription Expenditures per Provider $ 32,312 $ 24,270 $ (8,042) -24.9%
Average Paid per Prescription $ 43.02 $ 38.02 $ (5.00) -11.6%
Average Paid per Patient $ 271 $ 239 $ (31) -11.6%

38Pain Mgmt Program Evaluation - Dec 2018
CLAIMS ANALYSISUtilization and Expenditure Summary: All Three Drug Types
Twelve Months Prior to Practice
Facilitation
Twelve Months Following Practice
Facilitation
Change Percentage Change
Providers 40 40 0 0.0%
Prescriptions 45,192 37,795 (7,397) -16.4%
Average Prescriptions per Provider 1,129.8 944.9 (184.9) -16.4%
Patients 5,600 4,794 (806) -14.4%
Average Patients Per Provider 140.0 119.9 (20.2) -14.4%
Pharmacy Expenditures $ 1,603,072 $ 1,345,908 $ (257,164) -16.0%
Average Prescription Expenditures per Provider $ 40,077 $ 33,648 $ (6,429) -16.0%
Average Paid per Prescription $ 35.47 $ 35.61 $ 0.14 0.4%
Average Paid per Patient $ 286 $ 281 $ (6) -1.9%