SOM-based Data Visualization Methods Author:Juha Vesanto Advisor:Dr. Hsu Graduate:ZenJohn Huang IDSL...
25
SOM-based Data Visualization Methods Author: Juha Vesanto Advisor: Dr. Hsu Graduate: ZenJohn Huang IDSL seminar 2002/01/24
-
Upload
ernest-wells -
Category
Documents
-
view
217 -
download
1
Transcript of SOM-based Data Visualization Methods Author:Juha Vesanto Advisor:Dr. Hsu Graduate:ZenJohn Huang IDSL...
SOM-based Data Visualization Methods
Author: Juha Vesanto
Advisor: Dr. Hsu
Graduate: ZenJohn Huang
IDSL seminar 2002/01/24

2002/1/24 IDS Lab seminar 2
Outline
MotivationObjectiveIntroductionMethodsSOM visualizationConclusions

2002/1/24 IDS Lab seminar 3
Motivation
Data miningComplexity or amount of data is prohibitively large for human observation aloneAn interactive process

2002/1/24 IDS Lab seminar 4
Objective
To give an ideaWhat kind of information can be acquired from different presentations How the SOM can best be utilized in exploratory data visualization

2002/1/24 IDS Lab seminar 5
SOM(self-organizing map)A neural network algorithm based on unsupervised learningA valuable tool in data mining and KDD Applications in
• Full-text• Financial data analysis• Pattern recognition• Image analysis• Process monitoring• Fault diagnosis
Introduction

2002/1/24 IDS Lab seminar 6
SOM
Grid1- or 2-dimensionHexagonal or rectangular
2002/1/24 IDS Lab seminar 7
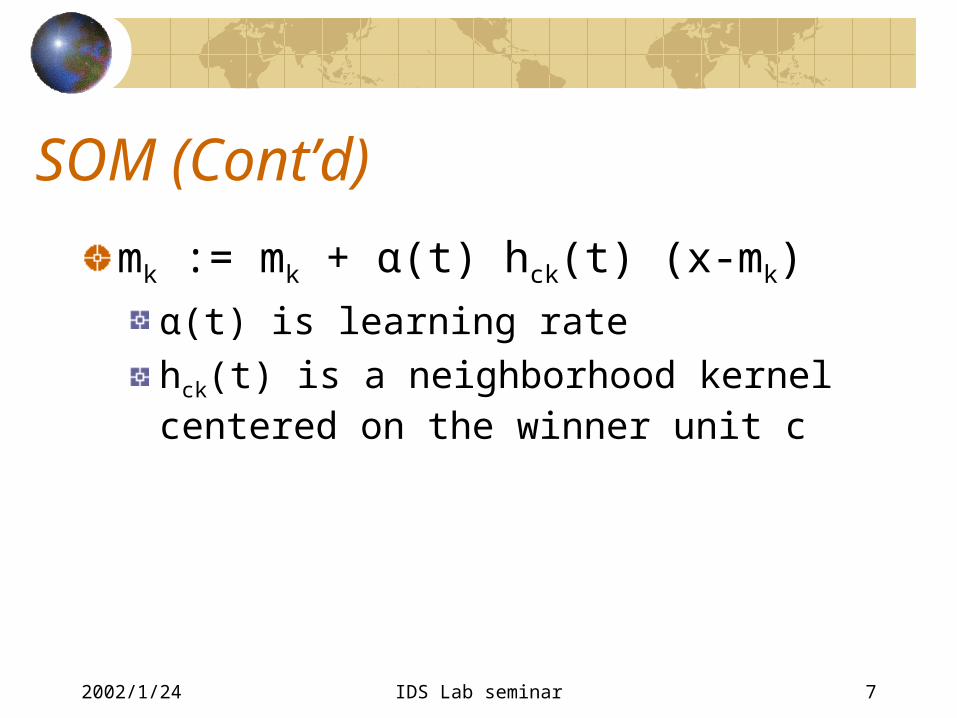
SOM (Cont’d)
mk := mk + α(t) hck(t) (x-mk)
α(t) is learning ratehck(t) is a neighborhood kernel centered on the winner unit c

2002/1/24 IDS Lab seminar 8
Some Vector quantization Algorithms
2002/1/24 IDS Lab seminar 9
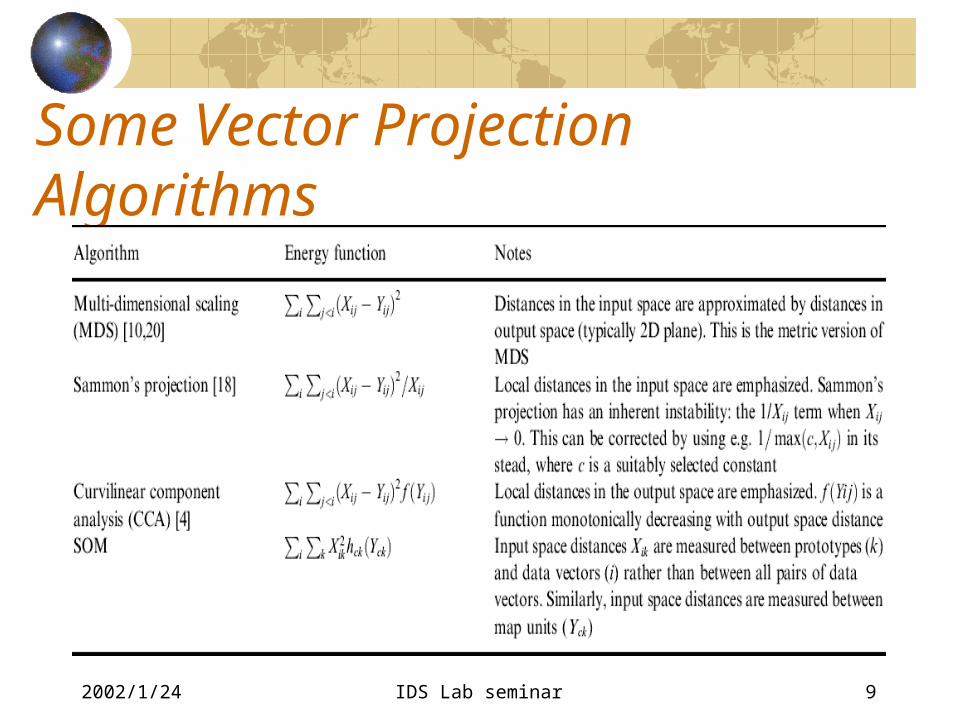
Some Vector Projection Algorithms

2002/1/24 IDS Lab seminar 10
Different Between SOM and Other Methods
Be not serial combinationSOM has a regularly shaped projection grid

2002/1/24 IDS Lab seminar 11
Disadvantages of the Rigid Grid
The grid guides the vector quantization processThe axes of the map grid rarely have any clear interpretationThe projection implemented by the SOM alone if very crude

2002/1/24 IDS Lab seminar 12
Projecting Prototype Vectors to a Low Dimension

2002/1/24 IDS Lab seminar 13
Cluster Structure of the SOM

2002/1/24 IDS Lab seminar 14
Component Planes and Histograms

2002/1/24 IDS Lab seminar 15
Cluster Properties
|mik – mjk| / ||mi – mj||
k: componenti, j: two neighboring map unitsmi: a prototype vector

2002/1/24 IDS Lab seminar 16
Contribution of News Paper
2002/1/24 IDS Lab seminar 17
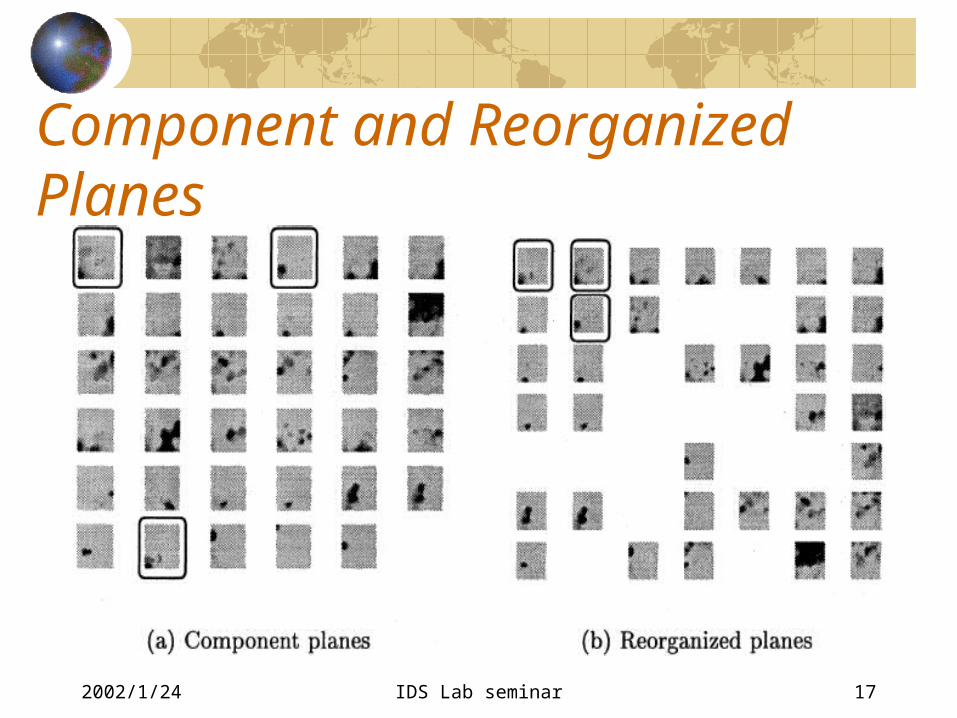
Component and Reorganized Planes

2002/1/24 IDS Lab seminar 18
Scatter Plot and Color Map
2002/1/24 IDS Lab seminar 19
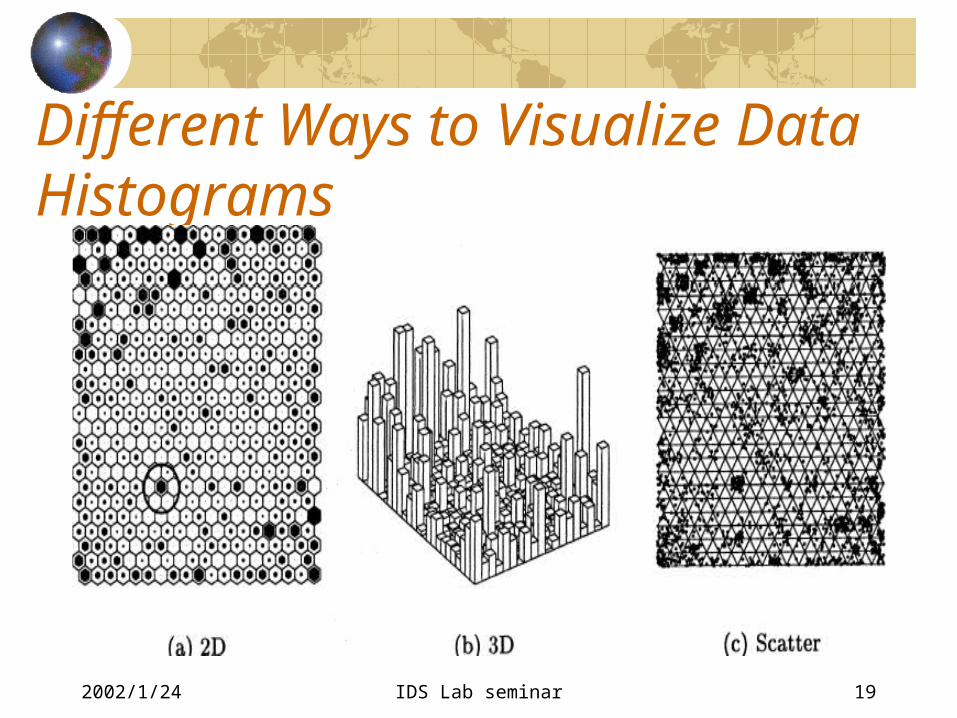
Different Ways to Visualize Data Histograms

2002/1/24 IDS Lab seminar 20
All and Scandinavian Mills

2002/1/24 IDS Lab seminar 21
Response Surfaces
)1/(1)( 2kk qqg

2002/1/24 IDS Lab seminar 22
Quantization Error Plots

2002/1/24 IDS Lab seminar 23
CCA-like Projection Algorithm
||dx'|| AND maxsteps steps
'1.0':'
)')(1||'||/||||(' ''
3,2,1
while
dxxx
mxmxmxdx
repeat
kkkk

2002/1/24 IDS Lab seminar 24
Conclusions
Bringing the many visualization methods for SOM togetherUsing the software package for Matlab 5 computing environment by Mathworks

2002/1/24 IDS Lab seminar 25
Future Work
Some areas may be discarded as outliersPostprocessing