SOLVING GALVANIC CELL ' PROBLEM · report no. structures and materials research uc sesm 71.14...
67
REPORT NO. STRUCTURES AND MATERIALS RESEARCH UC SESM 71.14 DEPARTMENT OF CIVIL ENGINEERING ~ SOLVING THE GALVANIC CELL ' PROBLEM IN FERRO-CEMENT by KENNETH A. CHRI1TENSEN and ROBERT BRADY WILLIAMSON f r ...- .. .... ' B f-, -- [ 2 f This ressarch was sponsored by ~ m the OMfi-e if Naval Research under CantoctNO~l-69-A-0200-107 Contract N 00014-6.-00.007. ,. PojWct NR 032 522. This i TECFN!CAL REPORT NO. 2 JULY 197,1 cTRUi.TlIRAL ENGINEERING LABORATORY UNIVERSITY CF CALIFORNIA BERKELEY CALIFOR,,IIA NATIONAL TI~iCHNICAL INFORMAIOIN SiR/klý.E ,. 1i.
Transcript of SOLVING GALVANIC CELL ' PROBLEM · report no. structures and materials research uc sesm 71.14...

REPORT NO. STRUCTURES AND MATERIALS RESEARCHUC SESM 71.14 DEPARTMENT OF CIVIL ENGINEERING
~ SOLVING THE GALVANIC CELL
' PROBLEM IN FERRO-CEMENT
by
KENNETH A. CHRI1TENSENand
ROBERT BRADY WILLIAMSON f
r ...- .. .... ' B f-, --[2f
This ressarch was sponsored by ~ mthe OMfi-e if Naval Research under
CantoctNO~l-69-A-0200-107Contract N 00014-6.-00.007. ,.
PojWct NR 032 522.
This i TECFN!CAL REPORT NO. 2
JULY 197,1 cTRUi.TlIRAL ENGINEERING LABORATORY
UNIVERSITY CF CALIFORNIA
BERKELEY CALIFOR,,IIA
NATIONAL TI~iCHNICAL
INFORMAIOIN SiR/klý.E,. 1i.

Structures and Materials ResearchDepartment of Civil Engineering
Report No. UCSESM 71-14
SOLVING THE GALVANIC CELL PROBLEM
IN FERRO-CEMENT
by
Kenneth A. Christensen
and
Robert Brady Williamson
t Ai:
This research was sponsored by the Office of Naval Researchunder Contract N 00014-69-A-0200-1007, Project NR 032 522.This is TECHNICAL REPORT NO. 2.
Reproduction is permittedfor any purpose of the
United States Government
Structural Engineering LaboratoryUniversity of California
Berkeley, California
July 1971

,InclassifiedSecurity! C1 saffication
DOCUMENT CONTROL DATA - R & 0f•eawitlv dIq ipa~iitl of til.. bt .d, of abetrict at•d indeorinl annotation mout be entered when the overall import is claaassied)
1. -"RIINATING ACT Vl Y !Po"ratt *uthnt) 2.. REPOhT SrECURITY CLASSIFICATION
Department of Civil Engineering U.nclassified"University of California, Berkeley_erke'ley, California 94720 none
S. REPORT TIYLE
THE GALVANIC CELL PROBLEM IN FERRO-CEMENT
4. DESCRIPTIVE NOTES (T ype of report and Inclusive data.s)
Interim technical reportS. AUTHOR(S) (Pita n8014, middle initial. lnt name)
Kenneth A. Christensen and Robert Brady Williamson
S. REPORT DATE a TA NO. OF PAGES NO. OF REFS
July 1971 56 16611 CONTRACT OR GRANT NO. 9,. ORIGINATOR'S REPORT NUMBER(S)
il00014-69-A-0200-1007b. PROJECT NO. Technical Report No. 2
.!P C32 522 9b. OTHER REPORT NOWS) (Any other numbers that .ay )e ass•gnedC. this report)
UCSESM 71-14d.
10. DISTRIBUTION STATEMENT
Reproduction in whole or in part is permitted for any purpose of the UnitedStates Government.
11. SUPPLEMENTARY NOTES 12. SPONSORING MILITARY ACTIVITY
Office of Naval Research
I3. ABSTRACT
The nature and constitution of ferro-cement is reviewed with special reference tothe structure of cement paste. The microstructure of low water-to-cement ratiopastes is presented in schematic illustrations to show that a thin paste layer canbe used to protect steel reinforcing material from a marine environment. A galvaniccell between the plain steel reinforcing bar and the galvanized steel mesh ordinarilyused in ferro-cement is identified. This galvanic cell gives off hydrogen gas atthe plain steel reinforcing bar which leads to poor bonding. Possible solutionsto this oroblem are presented and one, the use of chromium trioxide (Cr0 3 ) in themix water, is shown to solve the problem most effectively. This leads to improvedmechanical properties as well as a sounder barrier to corrosion of the reinforcement.
DD - OV 'I 1 4 7 3 Unclassi fiedSacwaety Classification

UnclassifiedSecurity Classification
14LINK A L114K B LiNK C
KEY LORCS •tLE WT ROLr. WT ROLE W T
Ferro-cement
Galvanic Cell
Galvan-:id Reinforcing Steel
Chromium Trioxide
Passivation
tI
UnclassifiedSecturit y ('10-01 a (I•mt ,ion

ABSTRACT
The nature and constitution of ferro-cement is reviewed with
special reference to the structure of cement paste. The microstructure
of low water-to-cement ratio pastes is presented in schematic illus-
trations to show that a thin paste layer can be used to protect steel
reinforcing material from a marine environment. A galvanic cell between
the plain steel reinforcing bar and the galvanized steel mesh ordinarily
used in ferro-cement is identified. This galvanic cell gives off
hydrogen gas at the plain steel reinforcing bar which leads to poor
bonding. Possible solutions to this problem are presented and one,
the use of chromium trioxide (CrO3 ) in the mix water, is shown to
solve the problem most effectively. This leads to improved mechanical
properties as well as a sounder b~arrier to corrosion of the reinforcement.
i ii
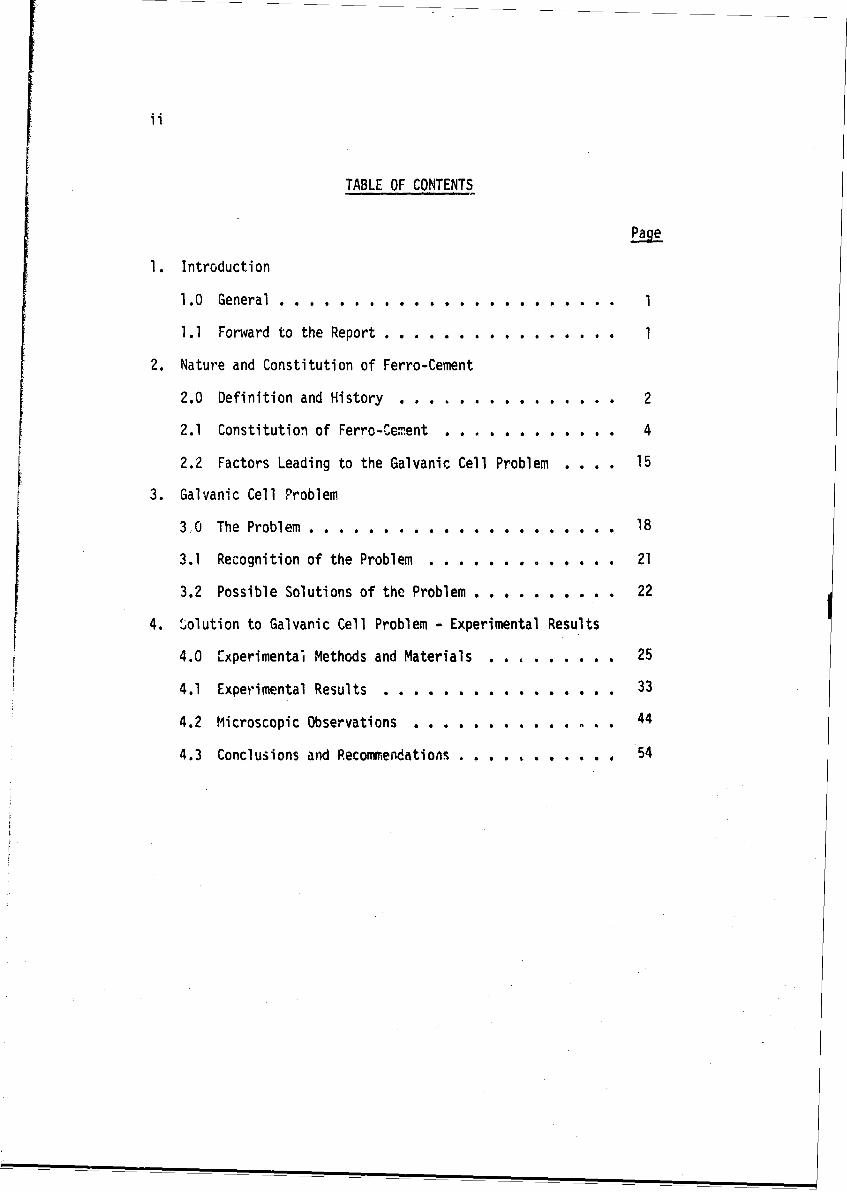
TABLE OF CONTENTS
Page
1. Introduction
1.0 General . . . . . . . . . . . . . . . . . . . . . . . I
1.1 Forward to the Report . . . . . . . . . . . . . . . . 1
2. Nature and Constitution of Ferro-Cement
2.0 Definition and History . . . . . . . .. . . . ... 2
2.1 Constitution of Ferro-Cement . . . . . . . . . . . . 4
2.2 Factors Leading to the Galvanic Cell Problem . . . . 15
3. Galvanic Cell Problem
3.0 The Problem . . . . . . . . . . . . . . . . . . . .. 18
3.1 Recognition of the Problem . . . . . . . . . . . . . 21
3.2 Possible Solutions of the Problem . . . . . . . . . . 22
4. Solution to Galvanic Cell Problem - Experimental Results
4.0 [xperimental Methods and Materials ..... . . . . 25
4.1 Experimental Results . . . . . . . . . . . . . . . . 33
4.2 Microscopic Observations . . . . . . . . . . . . 44
4.3 Conclusions and Reconmendations. . . . . . . . . . 54

4 iii
LIST OF FIGURES
Figure Eae
2.1 Graph cal representation of relative volume of
hydration products . . . . . . . . . . . . .... 8
2.2 Inner and outer hydration products . . . . . . . . . . 9
2.3 Schematic hydration of cement paste (W/C%.5) . . . . . 10
2.4 Schematic hydration of cement paste of low
water-to-cement ratio . . . . . . . . . . . ... . 11
3.1 The nature of the zinc-iron galvanic cell . . . . . . 18
3.2 Galvanic cell between galvanized mesh and plain
steel reinforring bar . . . . . . . . . . . . . . . 19.
4.1 Cross section, 4-in ferro-cement test specimen .... 31
4.4 Cross section, 1-in ferro-cement test specimen . ... 31
4.3 Ferro-cement panels with Cr0 3 one hour
after casting . . . . . . . . . . . . . . . . .. . 34
4.4 Ferro-cement panels without Cr0 3 showing bubbles
frozen on top surface ... .. . . ... . . . .. . 37
4.5 Surface of mortar in contact with the reinforcement
steel - both with and without Cr03 ......... 39
4.6 Flexure test experiment of ferro-cement . . . . . . . 40
4.7 Load deflection curves of flexure tests showing
increased strengths of Cr0 3 treated -pecimens ..... 42
4.8 Mortarlreinforcing bar surface with all galvanized,
"dll black steel, and epoxy coated steel .. . . . . . 45

iv
Figure Pg
4.9 Rough mortar/steel sLrface without Cr0 3 shown
by scanning electron micrographs ...... .......... 47
4.10 Higher magnification views of an area marked
in Figure 4.9 .... ...................... .. 48
4.11 Smooth mortar/steel surface with Cr0 3 shown by
scanning electron micrographs ......... ...... ... 50
4.12 A sequence of higher magnification micrographs of
mortar surface with Cr0 3 of an area marked in
Figure 4.11 ....... ...................... 52

IvV
ACKNOWLEDGEMENTS
We would like to express our gratitude to the many colleagues
who assisted us in this study. We wish to convey special th•aks to
Professor derome Raphael who gave us such strong support and encourage-
mpnt. We would like to express our deepest appreciation tu Tim Snyder,
George Hayler, and all the others who helped in special ways to make
this study possible. Fir.ally, we would like to thank Profc-s-)rs Boris
Bresler and Israel Cornet who had already solwvd our problem before we
found it, and then shared their experiences to help us optimize the
treatment.

1. INTROUCTION
1.0 General
The practical application of laboratory research projects is
often very difficult to accomplish. All too often the research
engineer or scientist is not aware of the practical problems, and
thus even if he learns the answer to a particular question, he does
not recognize it since he did not know the question in the first
place. On the other hand a problem develops in the practice of
engineering and a solution is found empirically without the deeper
understanding of the research-oriented worker. This report is one
in a series on the applied scienc'2 of cementitious materials.
1.1 Forward to the Report
This is the second technical report of a research project on
"*The Relationship between Microstructure and Mechanical Properties
of Cementitious Materials" which is being performed in the Division
of Structural Engineering and Structural Mechanics, Department of
Civil Engineering, University of California at Berkeley.
This report is the first of several reports on specific aspects
of 3ferro-cement," Ferro-cement is a combination of reinforcing
wire and cement mortar that can be used in thin shell construction.
It is highly adaptable for boat hulls and other marine unplications,
and it is in this application that it has gained its widest acceptance.

2
2. NATURE AND CONSTITUTION OF FERRO-CEMENT
2.0 Definition and History
A working definition of ferro-cement is that it is a thin shell
of highly reinforced Portland cement mortar. Generally, the shellst are in the range of 1-in to 1½-in thickness, and the relnforce,,•nt
is in the form of as many layers of steel mesh as possible for a given
thickness with or without steel reinforcing bars sandwiched midwaybetween the layers of mesh. The resulting shell or patiel is impreg-
nated with a very rich portland cement mortar. It might be thougit
that this is simply the well-known engineering material reinforced
concrete. This is not the case. It has been thoroughly demonstrated
that ferro-cement behaves in a manner so d'fferent from concrete
reinforced with steel that it has to be considered as an entirely
different material, (1,2). Because the mesh is so finely and evenly
distributed and subdivided throughout the entire cross section of the
shell, there is a synergistic effect. Shah (1) observed that the
fracture strength of ferro-cement primarily is dependent on the load
carrying capacity of the mesh reinforcement. Shah notes that the modulus
of elasticity of ferro-cement can be estimated from the wire mesh alone,
however for strain and cracking he finds a significant interaction
between matrix and reinforcement. Shah found the specific surface
of reinforcement, thus the total bonding area between mortar and
steel, to be the most sensitive parameter as far as strain and cracking
were concerned. The specific surface of reinforcement is considerably
higher for ferro-cement than for reinforced concrete, and this is

3
one of the factors that distinguishes one from the other.
Ferro-cement is used in thin wall (shell) applications where
strength and rigidity are developed Lhruuyh form or shape. It has
the distinct advantage of being moldable and of one piece construction.
Other major advantages are its low cost and its nonflammable and low
corrosive characteristics. The use ini tilin shells is possible because
ferro-.cement has relatively high teosile strength and essentially a
homogeneous, crack-free behavior.
The colorful history of ferro-cement has been .vMowed in
several places (3,4) and it has many interesting sagas. Although
its history goes back over 50 years, there is general agreement that
the first serious research and development efforts were undertaken
by the Italian Naval Administration in the spring of 1943. Several
motor-driven cargo vessels of 400 tons capacity were started by the
firm of Nervi and Bartoli. Their construction was interrupted by
the war, but there was renewed interest following the war. Snme of
the original vessels were finished, and several new ones were con-
structed. The operational experience of these vessels over a period
of 10-20 years was judged highly successful.
Following his original investigations for the Italian Navy,
Pier Luigi Nervi successfully used ferro-cement for buildings and
other civil engineering structures (5). They have become landmarks
of modern design. There are many potential uses of ferro-cement that
could be developed in the future as more is learned about the material.
The durability of ferro-cement is particularly well-illustrated
in the following passage from the Russian engineer, I. Ya Glan:

4
"The first reinforced concrete (read ferro-cement) yacht 'Opyt'(Experience) in late autumn 1957 was torn from anchor duringa severe storm and was thrown onto the rocks on the oppositeshore. We were unable to remove the yacht because of the icejam which had started. The entire autumn, the hull of the yachit;.was on the rocks, and during the winter it froze into the ice.In the spring, at first glance the hull of the yacht had a sadappearanCe. The sides were crumpled, but never'theless thereinforced gratings proved to be undamaged. All that was requiredwas the work of four men, a bag of cement and several bucketsof river sand in order for the yacht hull to be repaired in oneday" (ref 4, p 6).
2.1. Constitution of Ferro-Cement
The combination in ferro-cement of steel mesh and portland cement
mortar means that the design engineer must know about each material
separately and their interactions. The solidification or hardening
of portland cement is the basic reaction in the fabrication of ferro-
cement. The solidification cf portland cement has been extensively
discussed in the first technical report or, this project (6), but it
will be reviewed briefly here.
The reactior of portland cement and water is the basic chemical
reaction associated with the hardening of cement paste. The subsequent
carbonation of the hydration products is not necessary for them to
gain strength, and this often is a-sociated with the deterioration of
cement. Anhydrous portland cement contains four principal compounds:
tricalcium silicate, s-dicalcium silicate, tricalcium aluminate, and
a solid solution series which until recently was generally believed
to have the fixed composition of tetracalcium alumino ferrite. The
composition of cement compounds are often represented as the sum of
oxides, the formulae of which are abbreviated:
C = CaO, S = SiO2, A= Al'O 3 , F Fe203 , HI H20;

ai
5
thus, for example, tricalcium silicate, Ca3SiO 5 is represented by
3CaO.SiO2 and shortened to just C3S. This system is used in cement
chemistry interchangeably with ordinary chemical notation. The typical
composition of the four standard types of portland cement used in the
United States are given in Table 2.1 with the abbreviated forms shown
in addition to the chemical names. Small amounts of MgO, CaO and
alkali sulphates also occur in many cements. The types of cements
shown in Table 2.1 are characterized by particular properties as
noted. Type II is usually recommended for ferro-ce:l-ent since it has
high resistance to attack by sea water. This resistance to sea water
Table 2.1. Proportions of Major Compounds in Four Basic Typesof Portl~ad Cement Made in the U.S.A.
I II III IVGeneral Moderate High Low Heat
Use Heat of Early ofHardening Strength Hardening
TRICALCIUM SILICATE 53 47 58 26C3S
B-DICALCIUM SILICATE 24 32 16 548-C2S
TRICALCIUM ALUMINATE 8 3 8 2C3A
CALCIUM ALUMINATE 8 12 8 12FERRITESOLID SOLUTIONBetween C2F and C6A 2 F
Total 93 94 90 94
These are average percentages obtained by X-ray diffraction analysisof several cements. The remaining 6-7% consists of 2-3% CaS0 4 ,0.2-0.8% free CaO, and trace amounts of moisture, insoluble residueand alkali oxides combined in various ways (6).

6
attack is usually associated with lower concentrations of tricalcium
aluminate. There is also a Type V cement which has special controls
to assure even better sea water resistance. The fractions shown in
Table 2.1 are typical values determined by X-ray diffraction and do
not represent the legal limits for each type of cement.
Each of the phases of portland cement react with water to give
solid products that form the structure of portland cement paste. These
reactions are shown in Table 2.2. Note that both tricalcium silicate
and •-dicalcium silicate yield the same reaction products', a calcium
silicate hydrate (C-S-H) and calcium hydroxide. The C-S-H material
Table 2.2. Principal Reactions of PortlandCement with Water
2(3CaO.SiO ) + 5.5H20 =3CaO.2SiO2 .2.5H20 + 3Ca(OH) 2 m(TRICALCIUBi (CALCIUM SILICATE (PORTL.ANDITE)SILICATE) HYDRATE) f L
2(2CaOoSiO02) + 3.5H20 =3CaO.2SiO2 .2.SH20 + Ca(OH) 2(DICALCIUM ( CALCIUM SILICATE (PORTLANDITE)SILICATE) HYDRATE)
4CaO.Al 203 .Fe2 03 + lOH2O + 2Ca(OH) 2 = 6CaO.Al•O 3 .Fe2 03 .12H2 0("TETRACALCIUM (CALCIUM ALUMINOFERRITEALUMI NOFERROTE") HYDRATE)
3CaO.A1203 + 12H•O + Ca(OH) 2 =4CaO.Al 203 .13H2 O(TRICALCIUM (TETRACALCIUM ALUMINATEALUMI NATE HYDRATE)
3CaO.A1203 + lOHO + CaSO,'2H20 = 3CaO.A 20 3.CaSO,.12H20" (GYPSUM) (CALCIUM MONOSUL FO-
ALUMINATE)

7
has drawn particular attention over the past twenty years, and its
nature and properties are the subject of considerable discussion in
the literature (6). The calcium hydroxide Ca(OH) 2 constitutes an
important constituent that has not received as much attention as the
C-S-H. The calcium hydroxide is also known by its mineralogical name,
portlandite, and this will be used in general.
The reactions of tricalcium aluminate and the iron bearing solid
solution (labeled C4AF) are shown in Table 2.2, but for the most part
these reactions do not greatly affect the properties of the hardened
cement. Two reactions are shown in Table 2.2 for tricalcium aluminate,
one with and one without gypsum, CaSO4.2H 20. The gypsum is added to
most portland cement as it is ground, a process called intergrinding,
in order to prever' a premature setting of the paste.
In its simplest terms, the hydration of cement is a reaction in
which a solid of low solubility reacts with water to form solid prod-
ucts of even lower solubility. The chemical reactions shown in
Table 2.2 can be thought of in this simplified framework. A graphical
representation shown in Figure 2.1 can be used to describe the sequence
of events as the cement minerals react with water. This reaction
produced the continuous solid matrix in the space that was originally
occupied by discrete particles dispersed in the water. In Figure 2.1
the relative volume of water and cement are represented by a bar graph
labeled "Fresh Paste" for the case of 0.5 water-to-cement ratio. The
specific gravity of the cement has been taken at 3.15, and thus there
is 1.55 cubic centimeters of wate. for one cubic centimeter of cemtnt.
The hydration reaction is then-represented at 33%, 67%, and 100"

8
C C Co o o
4- 43 - 0•0e-. %2'"• O ..
60 C) >
E W . . x WX
U)
'4--0
E
0>/
InnerUnreocted * HydrationCement Products
Outer CapillaryHydration WaterProducts
Figure 2.1. Graphical representation of the relalive volumesof hydration products of portland cement at three stages ofhydration: 33%, 67%, and 100% completion. The initial water-to-cement ratio is 0.5, and one unit volume of cement is shownto produce two unit volumes of hydration products.
completion on the basis that one half unit of cement yields one unit
volume of hydration products. The nomenclature of inner and outer
hydration products has beei introduced into Figure 2.1 in order to
discriminate between the products laid down within the boundaries of
the original cement grains and the products laid down in the originally
water-filled space.
The spatial relationship of the hydration products with respect
to the original cement grain can be determined by microscopic investi-
gation. The partial hydration of one grain of cement is schematically
represented in Figure 2.2. There are nmny details in this process that
'I.

9
'- / • \/")/InnerHydration
Groin / -OriginalSoundry
N of CementGrain
Outer ProductDendritic Columnar ZonePortlonditeCrystals
Figure 2.2. The hydration products formed inside andoutside the cement grain are schematically represented.The multiple nature of the cement grain is neglected andis assumed to be a single phase that shows two types ofhydration products.
are not yet understood (6), but there is sufficient information avail-
able to allow a consistent mental picture to be constructed. This is
one of the principal objectives of Williamson's descriptions of the
solidification of portland cement.
The hydration of a number of cement grains is schematically
represented in Figure 2.3 at different degrees of hydration. The
fresh paste (i.e., the initial combination of water and cement grains)
is drawn to approximately represent the 0.5 water-to-cement ratio
shown in Figure 2.1. In this case there are not sufficient hydration
products to fill the originally water-filled space and a capillary
porosity remains in the final microstructure. The measure of this

10
FRESH PASTE()V- -
I
t77
33% HYDRATED (b)
Figure 2.3. A schematic representation of the hydration of cement basedon the relative volumes shown in Figure 2.1. The multiphase nature of thecement grains has been neglected so this is like the hydration of tri-calcium silicate alone. ?a) Fresh paste of wata-to-cement ratio of 0.5is shown with unhydrated cement represented by W and the originally water-filled space clear. (b) After 33% hydration the .er hydration productsare represented by and the outer products by , The primary port-landite is labeled P~and the columnar zone is sho-wn around each grain.
Aj

67 % HYDRATED (C)
IOO % HYDRATED (d)
Figure 2.3. (Continued from opposite page)... (c) After 67% hydration theunhydrated cores are clearly surrounded by thick "rims" of inner hydrationproducts and the columnar zone of outer products is growing on the outer sur-face of each grain. The primary portlandite, P1, is shown with the dendriticmorphology reported in the optical study of Berger and McGregor (6 ). (d)At 100% hydration the unhydrated cement has been consumed but the shape ofthe original cement grains can be distinguished if the inner product differsfrom the columnar zone of outer products. The intergrowth of the columnarzones from two different grains is only shown at one place, marked A, butthis would be more conumi at lower water-to-cement ratios.

12X
FRESH PASTE (a)
P,
33% HYDRATED (b)
Figure 2.4. A schematic representation of the hydration of cement exactlythe same as the previous figure except thet the grains of cement have beenmoved closer together in order to represent a lower water-to-cement ratio(approximately 0.3). (a) Fresh paste is shown with unhydrated cementrepresented by 0 and the criginally water-filled space clear.. (b) After331 hydration th• inner hydration products are represented ty 0 and theouter products by iTý. The primary portlandite is labeled P1 and thecolumnar zone is shown around each grain.

13
\I
67% HYDRATED (C)
IP
100% HYDRATED (d)
Figure 2.4. (continued from opposite page)... (c) After 67% hydration theunhydrated cores are clearly surrounded by thick "rims" of inner hydrationproducts and the columnar zone of the outer products is growing on theouter surface of each grain just as in the previous figure. (d) At 100%hydration the microstructure appears almost the same as the higher water-to-cement ratio, except that there is much more intergrowth of thecolumnar zones of adjacent grains.

14
Table 2.3. Comparison of Permeabillties ofRocks and Cement Pastes
PermeabilityKind of rock of rock Water-cement ratio*
(darcys)
Dense trap 2.57 x lO-9 0.38Quartz diorite 8.56 x 1O-9 0.42
Marble 2.49 x 10⁻⁸ 0.48
Marble 6.00 x 10⁻⁷ 0.66
Granite 5.57 x 10- 0.70
Sandstone 1.28 x 10- 0.71
Granite 1.62 x lO5 0.71
Water-cement ratio of mature paste having same permeability as rock.
capillary porosity leads to a more permeable solid. By choosing a lower
water-to-cement ratio the permeability may be decreased to very small
values. 1A cement paste with a water-to-cement ratio of approximately 0.3
is schematically shown in Figure 2.4 and it is readily apparent that
this paste is less porous than that in Figure 2.3. Powers (7) reports
the coefficient of permeability of a paste with zero capillary porosity
has been measured to be about 7 x 10⁻¹ darcys.* The design of low
permeability cement paste is generally dependent on choosing a low
water-to-cement ratio. To apply this to ferro-cement the sand used for
the mortar must be free from porosity, and the water-to-cement ratio
* A flow rate of I cm3 per second through an area of 1 cm2 undera pressure gradient of I atm per cm with a fluid having a viscosityequal to 1 centipoise equals 1 darcy.

15
must be as low as possible. Powers (7) has compared the permeabilities
of rocks and cement pastes and he produced Table 2.3, which shows that
the permeability of the pastes can be less than most natural rocks.
The sand grains used in ferro-cement mortars would usually have less
permeability than t4e values for natural rocks given in Table 2.3
since much of that permeability is probably due to micro cracking and
other imperfections in larger samples of material.
2.2 Factors Leading to the Galvanic Cell Problem
One of the primary roles of the mortar in ferro-cement is to
cover and protect the reinforcing steel from ccrrosion and other envi-
ronmental effects. Portland cement mortar will protect reinforcing
steel if the mortar cover is thick, the permeability of the mortar is
low, and the mortar-steel interface is free of discontinuities and
voids. As discussed above the permeability of the mortar can be
controlled, but the thin layers of mortar may not be sufficient to
give protection in all cases.
In an aggressive environment, such as that encountered by ferro-
cement in its highly corrosive marine application, the mortar protection
of the steel may be t~o low to prevent excessive corrosion. The danger
of corrosion is highly enhanced in ferro-cement by the extremely thin
protective cover of mortar over the steel reinforcement. Also, it is
known that the alternating conditions of wetti:ig and drying of marine
structures through sea spray and marine fo5 creates additional exposure
hazards (8).
In order to minimize absorption, the exterior of a ferro-cement

16
hull can be covered with a rather impermeable film of epoxy paint.
However, this coating is subject to abrasion, deterioration, porosity,
etc., and cannot be considered to be 100% effective. Any uncoated
area will be subject to intensified local corrosion. Absorption or
penetration will also occur from the interior of a hull structure
from an accumulation of bilge water or other collected pools of water.
This water will not only contribute directly to the corrosion of the
steel but also indirectly by leaching out the natural protective
constituents of mortar when the water is either high in sulfates (sea
water) or when the water is soft (rain water).
From tthe preceding discussion there are four main reasons for
using galvanized wire or mesh in ferro-cement.
1. When the reinforcing is exposed to the elements for lengthy
periods before the rmortar is placed, galvanized wire will
resist corrosion better than ordinary steel. f2. Field experiences and experiments at the University of
California have shown that concrete with galvanized reinforcement
resists an aggressive environment better and longer than concrete
reinforced with black steel (9).
3. Once corrosion is initiated in ferro-cement, the zinc w411
corrode preferentially and will furnish cathodic protection
to the steel. Work of Ishikawa, Cornet, and Bresler has shown
that galvanized steel is anodic to black steel in concrete by
about 0.5 volts and furnishes galvanic protection to steel in
concrete in riuch the same way as it does in the atmosphere
(10). F',Atherniore, corrosion may be slower in starting with

17
galvanized steel, because zinc is somewhat more tolerant of
chlorides than iron in the alkaline concrete environment.
4. Since the protective mortar /.over is very thin (about !-in)
in ferro-cement, the p3ssibility of corrosion is very high.
Therefore, black steel is very vulnerable, especially if any
part of the steel reinf.orc..t. b÷rs Or inh I lIft
unprotected at the surface, for they would become focal
points for the initiation of corrosion.
These are good reasons to use galvanized steel mesh in ferro-
cement, and the authors of this report recowm•.nd its use. The problems
discussed below are not solved by just removing the galvanized coating
on the steel mesh.
i
IF

18
3. GALVANIC CELL PROBLEM
3.0 The Problem
In all the literature surveyed, there has never been any mention
of the severe effects in ferro-cement caused by the presence of the
dissimilar metals employed with fresn portland cement mortar (practical
applications do not reveal the problem). The two dissimilar metals
are the zinc coating of the galvanized mesh and the iron in the
ungalvanized steel bars. These metals in the presence of an electro-
lyte, in the form of portland cement mortar, create an electrochemical
(or galvanic) cell, as represented in Figure 3.1. Electron current
flows from the zinc anode to the iron cathode with the electrolyte
completing the circuit.
Metallic Cornection
\ Ca (OM "
H H20 H +
•, H+4
Chemicol Reaction Zn +2H2 0 Zn (OH) 2 + H2
Figure 3.1. Schematic representation of a zinc--;ron galvanic cell.
i-
i

19
This galvanic cell action is present in hardened and fully cured
mortar, but in this case it does not necessarily pose a problem because
very low electron currents are Dresent. As a matter of fact, the use
of zinc has the benefit of providing cathodic protection to the steel
as explained above. However, a very severe problem does e,,ist when
the mortar is fresh. Up until the time the mortar sets, very large
electron currents flow from the zinc anode to the iron cathode, where
hydrogen ions acquire electrons and form hydrogen atoms. The hydrogen
atoms combine to form molecules of hydrogen gas (H2 ), which i s liberated
along the surface of the black steel cathode as schematically represented
in Figure 3.2.
The generat'in of this gas causes an expansive pressure on the
mortar surrounding the bars and creates a gas filled void along the
0---
__ ",H e Zn Anode
"3 A CodSCathode (galvanized mesh)
(block steel) H+
H __-R -
Electrolyte(cement Doste)
Figure 3.2. A cross section of ferro-cement schematically showi~ig thegalvanic cell between galvanized mesh and black steel reinforcing bar.
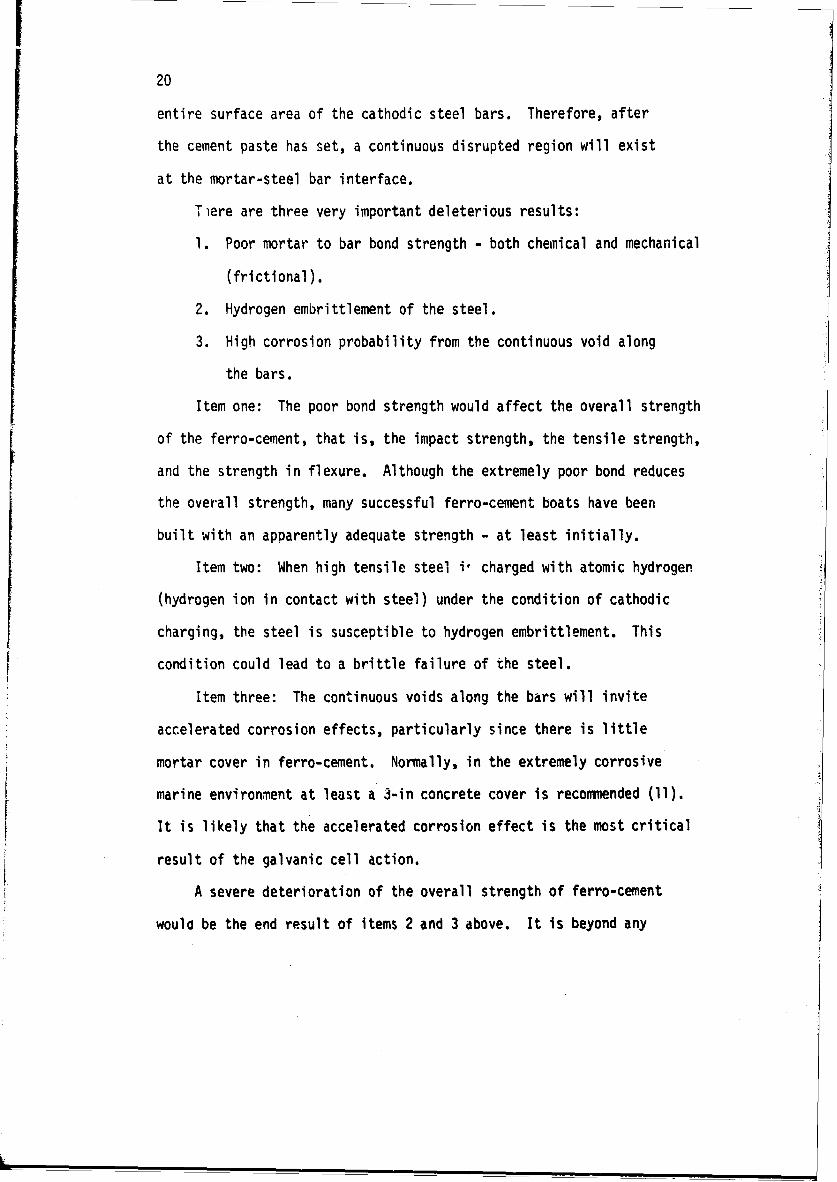
F20
entire surface area of the cathodic steel bars. Therefore, after
the cement paste has set, a continuous disrupted region will exist
at the mortar-steel bar interface.
Tlere are three very important deleterious results:
1. Poor mortar to bar bond strength - both chemical and mechanical
(frictional).
2. Hydrogen embrittlement of the steel.
3. High corrosion probability from the continuous void along
the bars.
Item one: The poor bond strength would affect the overall strength
of the ferro-cement, that is, the impact strength, the tensile strength,
and the strength in flexure. Although the extremely poor bond reduces
the overall strength, many successful ferro-cement boats have been
built with an apparently adequate strength - at least initially.
Item two: When high tensile steel i, charged with atomic hydrogen
(hydrogen ion in contact with steel) under the condition of cathodic
charging, the steel is susceptible to hydrogen embrittlement. This
condition could lead to a brittle failure of the steel.
Item three: The continuous voids along the bars will invite
accelerated corrosion effects, particularly since there is little
mortar cover in ferro-cement. Normally, in the extremely corrosive
marine environment at least a 3-in concrete cover is recommended (11).
It is likely that the accelerated corrosion effect is the most critical
result of the galvanic cell action.
A severe deterioration of the overall strength of ferro-cement
would be the end result of items 2 and 3 above. It is beyond any
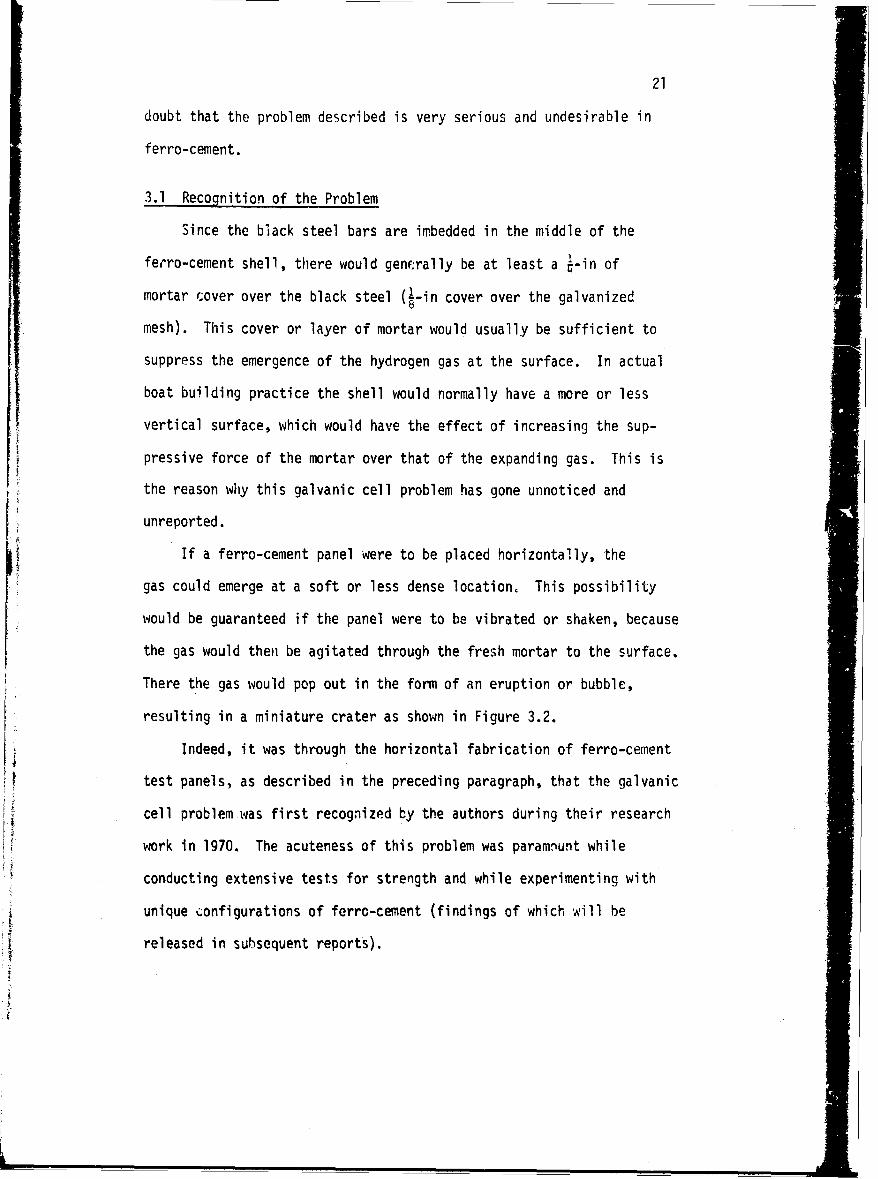
21
doubt that the problem described is very serious and undesirable in
ferro-cement.
3.1 Recognition of the Problem
Since the black steel bars are imbedded in the middle of the
ferro-cement shell, there would generally be at least a '-in of
mortar cover over the black steel (L-in cover over the galvanized
mesh). This cover or layer of mortar would usually be sufficient to
suppress the emergence of the hydrogen gas at the surface. In actual
boat building practice the shell would normally have a more or less
vertical surface, which would have the effect of increasing the sup-
pressive force of the mortar over that of the expanding gas. This is
the reason why this galvanic cell problem has gone unnoticed and
unreported.
If a ferro-cement panel were to be placed horizontally, the
gas could emerge at a soft or less dense location, This possibility
would be guaranteed if the panel were to be vibrated or shaken, because
the gas would then be agitated through the fresh mortar to the surface.
There the gas would pop out in the form of an eruption or bubble,
resulting in a miniature crater as shown in Figure 3.2.
Indeed, it was through the horizontal fabrication of ferro-cement
test panels, as described in the preceding paragraph, that the galvanic
cell problem was first recognized by the authors during their research
work in 1970. The acuteness of this problem was paramount while
conducting extensive tests for strength and while experimenting with
unique configurations of ferrc-cement (findings of which will be
released in subsequent reports).

22
During this period, test panels ½-in to 1½-in were fabricated
with various layers of galvanized mesh and with 9-in black steel bars,
sandwiched midway between the mesh on 2-in centers. Vibration of the
panels allowed some of the generated gas to escape at various sites
of low overhead resistance. At these sites vents formed, and on
further vibration they collapsed and then new vents developed. Because
the generation of gas is continuous as long as the cement paste has
high conductivity, it was found that no amount of vibration at any
frequency or amplitude will drive out all the trapped gas.
The surface of the mortar in contact with the reinforcing bars
was observed to be highly pitted, but description of these conditions
will be delayed until after the solution is described.
3.2 Possible Solutions of the Problem
There arta,, number of possible solutions to the galvanic cell
problem described above:
1. Eliminate dissimilar metals
a) Use black steel (ungalvanized) reinforcing bars with
ungalvanized mesh.
b) Use galvanized reinforcing bars with galvanized mesh.
2. Insulate the black steel bars with a protective coating.
3. Chemically passivate or inhibit the galvanic cell action.
The first solution, the most obvious, seemed to offer a good
remedy, however, using all ungalvanized steel is not deemed to be
desirable, because of the severe threat of corrosion in the highly
corrosive marine environment. Marine applications call for a minimum

23
of three inches of concrete cover over the reinforcement for adequate
protection, whereas ferro-cement has only 1-in to L-in cover. The
use of galvanized bars and mesh was deemed to be a practical solution
at a minimal cost, but subsequent tests have indicated that some
dissimilar metal characteristics remained because of the different
purities of the zinc used in galvanizing or other factors. Care has
to be exercised in applying a protective coating to bare spots caused
by chipping or cutting of the bars. It should be realized that only
mild steel reinforcing bars should be galvanized. However, today's
most commonly used reinforcing bars in ferro-cement boat construction
are not mild steel, but low carbon, cold drawn steel that is hard
(springy) and or high strength (usually over 75,000 psi yield point).
Galvanizing this steel will "stress relieve" the steel and cause it
to become softer and weaker, therefore, galvanizing of other than
mild steel bars is undesirable.
The second se'ution of insulating the black steel bars could be
accomplished with a zinc rich paint or epoxy paint in order to prevent
the galvanic currents. Care would have to be exercised in cleaning
and preparing the bars for the coating in order to assure a good bond.
During fabrication special care would have to be used in order not to
scratch or otherwise damage the coating. This would be a tedious and
somewhat uncertain method.
The third solution, a chemical cure, was considered to be the
most expedient and dependable method if a chemical additive could be
found that would eliminate or inhibit the electrochernical cell action.
Bresler and Cornet (12) have used chromium ions in solution as a means
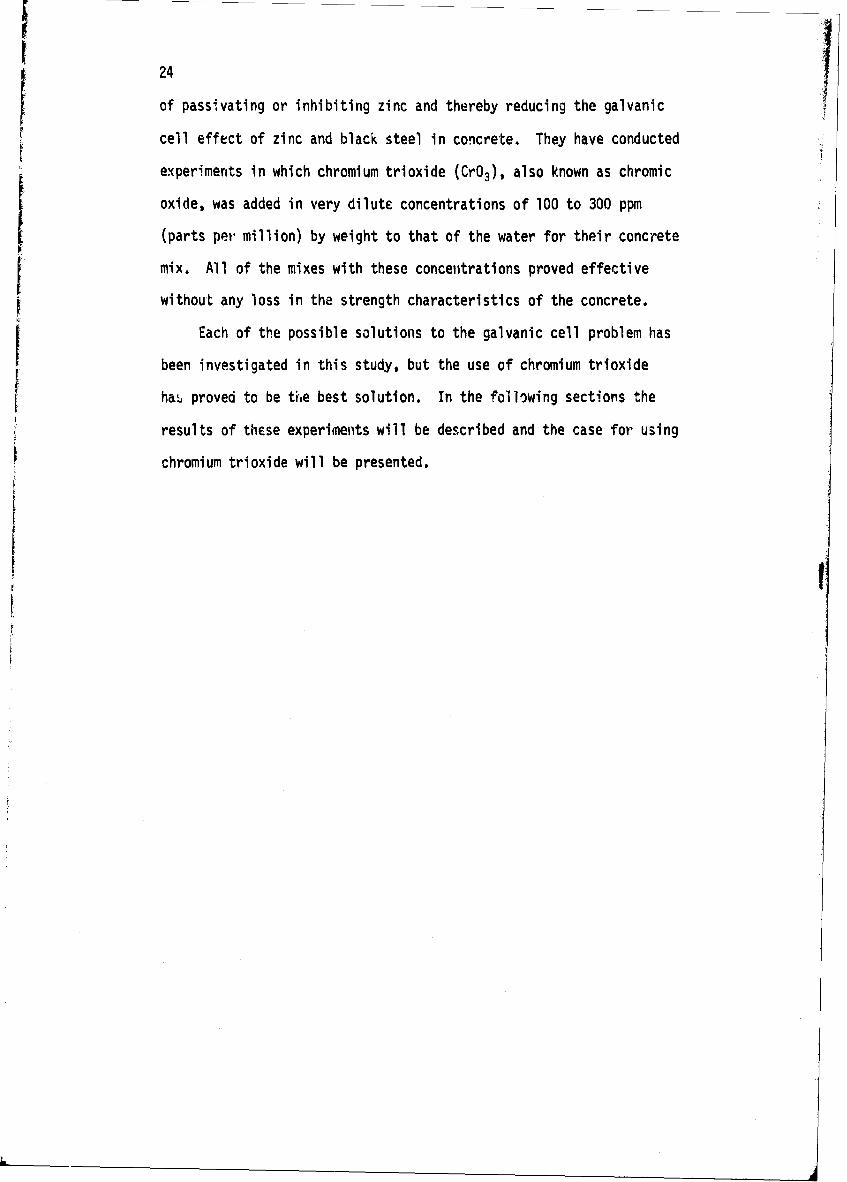
of passivating or inhibiting zinc and thereby reducing the galvanic
cell effect of zinc and black steel in concrete. They have conducted
experiments in which chromium trioxide (Cr0 3), also known as chromic
oxide, was added in very dilute concentrations of 100 to 300 ppm
(parts pet- million) by weight to that of the water for their concrete
f mix. All of the mixes with these concetntrations proved effective
without any loss in the strength characteristics of the concrete.
Each of the possible solutions to the galvanic cell problem has
been investigated in this study, but the use of chromium trioxide
ha. proved to be tVie best solution. In the following sections the
results of these experiments will be described and the case for using
chromium trioxide will be presented.
f

25
4. SOLUTION TO GALVANIC CELL PROBLEM -
EXPERIMENTAL RESULTS
4.0 Experimental Methods and Materials
A series of ferro-cement specimens was prepared to investigate
the possible solutions to the galvanic cell action described above
to take place between L <al.vanized steel mesh and black ki.e.,
ungalvanized) steel reinforcing bars. Two types of tests, a visual
inspection test and a bending strength test, were designed to determine
if the addition of chromium trioxide (Cr0 3 ) to the mix of fresh mortar
would reduce or eliminate the undesirable effects of the galvanic
cell. In addition the use of an all galvanized system, an all black
iron system, and an epoxy coated black iron approach were investigated
in the same way.
The visual inspection test consisted of two phases. The first
phase was the fresh mortar test. Observations were made as to the
apparent electrochemical action taking place in freshly cast ferro-
cement specimens, with and without the Cr0 3 admixture in the mortar,
up until the final setting of the paste. The same test was made for
the other treatments as well.
The second phase was the ferro-cement post cure test. This
phase of inspection consisted of cutting open the fully cured ferro-
cement specimens, casted in phase one, by use of a diamond saw, and
then criticaily examining their internal structure. This test was
made for all of the possible solutions to the problem.

26
Following the visual inspection tests the mechanical properties
were investigated using a standard four point bending test (also called
a flexure test) to determine what effect the galvanic cell problem has
on engineering performance. A limited number of impact studies were
also mado, tut these will be described in a later report.
The materials used in this study were as follows:
1. Mortar
A rich mortar of portland cement and clean, hard, and durable
sand was used. A type II portland cement was utilized because
it is of a type that can generally be recommended for ferro-cement
applications. It is readily available, has fairly slow setting
time and has good sulfate resistance.
Mortar Specifications
Cement: Portland Type II
Sand: Olympia No. 1
Fineness modulus: 2.05
i00% passing No. 8 sieve
15% passing No. 100 sieve
Cement/sand ratio: 0.67
Water/cement ratio: 0.40
Weight of mortar: 142 lb/ft 3 (see calculation below)
Slump: 4-in
Admixture: Chromium trioxide (as described below)
Chromium trioxide (Cr0 3 ), also called chromic oxide, was added
to the water of the mortar mix (in some of the specimens) in the

27
concentration of 300 ppm (parts per million) to that of the mix
water. A uniform distribution of the chromium ions in the mortar
mix was achieved by adding a carefully measured quantity (by
weight) of the chromium trioxide crystals to the water weighed
out for the mortar batch. Since many engineers involved with
ferro-cement are not familiar with cement and concrete it would
be useful to present the calculations for batching the chromium
trioxide into the mortar.
Sample Calculation to Determine
Batch Weight of Cr03
1. Determine the weight of mix water per ft 3 of mortar.
Using the mortar specifications from above and knowing that
the specific gravity of cement is approximately 3.15 and
that of our aggregate is 2.7, the density of the mortar can
be determined.
Weight (lb) % Volume (ft 3) %
Aggregate 300 51.8 1.78 43.5
Cement 200 34.4 1.02 25.0
Water 80 13.8 1.28 31.5
Totals 580 4.08
.Density of mortar = 142 lb/ft 3.
[Aside: This gives 14 sacks (US) cement per yd 3 - a
rather rich mix.]
The weight of mix water per ft 3 of mortar is just 13.8% x
142 lb 19.6 lb/ft 3 .

28
2. Cr0 3 is to be added in concentration of 300 ppm to mix
water and thus:
For I ft 3 19.6 =0.0058 lb -266 J• )Mortar: Cr03 = 300 ppm x - = 0.88 l .
For 1 yd 3 Cr03 = 27 ft 3 0.00588 lb = 0.169 lb (= 71.8 gm)Mortar: CyrT -y ft3 (= yd3 '
The desired concentration can be obtained by adding a
carefully measured amount (by weight) of the Cr0 3 crystals
into a small amount of distilled water in order to form a
solution. Then a measured amount of this CrO3 solution is
added to the mix water of each batch. An example will serve
to illustrate the point.
Example
A total of 3 yd 3 of mortar is to be used on a job.
Batches of 4 ft 3 are to be mixed at one time.
1. Total amount of CrO3 needed:
3 yd 3 x 71.8 grams/yd 3 = 215.4 grams
2. A solution of Cr0 3 is made by adding 215.4 grams of
CrO3 to 500 ml of distilled water.
3. Number of milliliters of CrO3 solution needed per
4 ft 3 batch:ft3/batch 4
Cr0 Solution total ft- x 500 = x 500 =
Therefore, in this example 24.7 ml of CrO3 solution are
added to the mix water needed for a batch of 4 ft 3 of mortar.
The use of mixed units of the metric and english systems was
chosen because the smaller volume and weight scales are often
in the metric system.
29
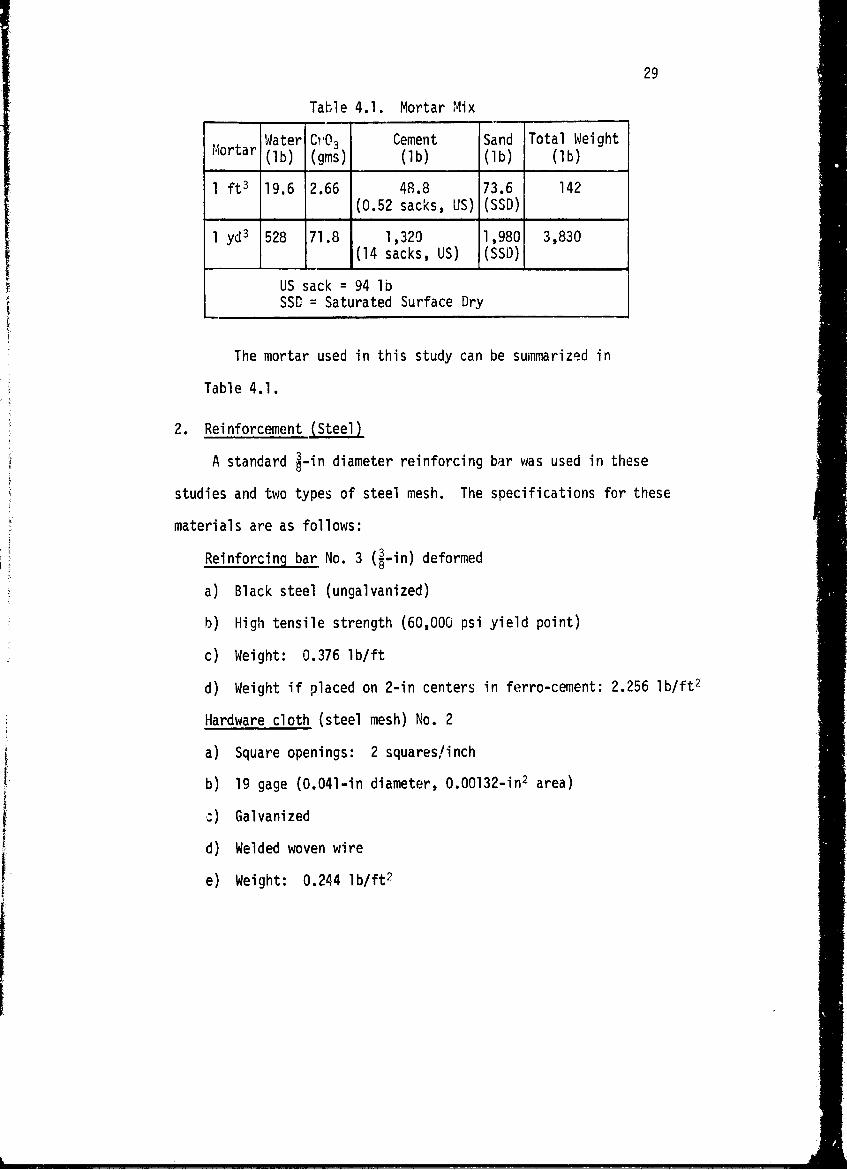
Table 4.1. Mortar Mix
Water C"03 Cement Sand Total WeightMiortar (Ib) (gms) (lb) (Ib) (Ib)
1 ft 3 19.6 2.66 48.8 73.6 142(0.52 sacks, US) (SSD)
1 yd 3 528 71.8 1,320 1,980 3,830
(14 sacks, US) (SSD)
US sack =94 lbSSD = Saturated Surface Dry
The mortar used in this study can be summarized in
Table 4.1.
2. Reinforcement (Steel)
A standard 3-in diameter reinforcing bar was used in these
studies and two types of steel mesh. The specifications for these
materials are as follows:
Reinforcing bar No. 3 (L-in) deformed
a) Black steel (ungalvanized)
b) High tensile strength (60,000 psi yield point)
c) Weight: 0.376 lb/ft
d) Weight if placed on 2-in centers in ferro-cement: 2.256 lb/ft 2
Hardware cloth (steel mesh) No. 2
a) Square openings: 2 squares/inch
b) 19 gage (0.041-in diameter, 0.00132-in 2 area)
:) Galvanized
d) Welded woven wire
e) Weight: 0.244 lb/ft 2

30
Chicken wire (aviary netting) L-in
a) Hexagonal openings: 2 openings/in
b) 22 gage (0.0286-in diameter, 0.000642-in 2 area)
c) Galvanized
d) Welded twisted wire
e) Weight: 0.124 lb/ft 2
3. Specimens
The visual inspection test specimens were 18-in x 18-in and
consisted of two thicknesses with different laminations. One
thickness of a normally employed ferro-cement cross section, L-in,
and a smaller thickness, 2-in, were tested.
The reduced cover of mortar on the ½-in thick ferro-cement
specimen caused a reduction of constrictive preseure over the
sites of the generated hydrogen gas (at the mesh-bar interface).
This allowed more visible indication of the effect of the liberation
of the gas within the specimen.
The visua•l inspection specimens were fabricated as follows:
Plywood molds were used in the fabrication in order to achieve
a uniform thickness, the sides of the molds being of the correct
height. The steel mesh and bars were wired tightly together
through holes drilled in the bottom of the molds.
The mortar was impregnated into this tight mesh by force of
a trowel and by vibration of the molds on.a vibrating table.
Vibration (approximately 60 cps, variable amplitude) of the
specimens lasted approximately 20 seconds. The specimens were
then troweled smooth and left undisturbed.

31
"1. Specimen with Lin laminate (shown in Figure 4.1)
a) 2-in x 18-in x 18-in
b) 6 layers of No. 2 hardware cloth
c) 8 ea. No. 3 steel bars on 2-in centers
3/8" diam. Reinforcing Bor
"0 0 0l0 3 Loyers Steel Mesh
Figure 4.1. Lin ferro-cement visual inspection specimen (cross section),scale 1:1.
2. Specimen with !-in laminate (shown in Figure 4.2)
2
a) !-in x 18-in x 18-in
b) 4 layers of No. 2 hardware cloth
c) 8 ea. No. 3 steel bars on 2-in centers
3/8" diorn. Reinforcing Bor
._' -- - I Loyer S tee l M esh
C= __ 3 Loyers Steel Mesh
Figure 4.2. L-in ferro-cement visual inspection specimen (cross section),scale 1:1.

32
The two sets of specimens (with and without the Cr0 3 admix-
ture) were cast one after the other in separate batches of mortar.
The batch with Cr0 3 followed the mixing and casting of the batch
without Cr0 3 by just a few minutes. Except for the addition of
the Cr03 admixture, the batches, the ..ixing, and the casting were
identical for both sets of specimens. The other specimens employing
epoxy seal, etc., were prepared in the same fashion but at a later
time.
The curing was accomplished in two steps:
1. Air cure at approximately 75 degrees Fahrenheit until
the mortar set - approximately 2 hours, then
2. Wet cure, 73 degrees Fahrenheit at 100% relative humidity
for 28 days (molds stripped on second day).
This curing was chosen in order to most closely represent the
curing employed in the field.
The bending test specimens were 6-in x 24-in with a nominal
1-in thickness. Two types of reinforcing laminates were employed.4
One laminate had 6 layers of hardware cloth, and the other had 8
layers of chicken wire. More layers of chicken wire were needed
than layers of hardware cloth for the same q-in thickness because
of the different gages of wire (see paragraph above for specifi-
cations of the reinforcements).
1. Specimen with hardware cloth
a) ý-in x 6-in x 24-in
b) 6 layers of No. 2 hardware cloth
c) 3 ea. No. 3 steel bars

33
2. Specimen with chicken wire
a) 3-in x 6-in x 24-in
b) 8 layers of h-in chicken wire
c) 3 ea. No. 3 steel bars
The same fabrication and curing techniques were followed for
both specimens.
4.1 Experimental Results
The visual observations recorded during the first hour after the
preparation of four test panels are shown in Table 4.2. Two panels
Taole 4.2. Visual Observations of Galvanic Cell Activity on FreshFerro-Cement Panels both with and without Cr0 3.
Time Ferro-Cement SpecimensAfter Without Cr03 With Cr0 3
'Casting -in -- in Lin n-in
10-15 Bubbles formed rapid- Sputtering No bubbles Ho bubblesmin ly in the mortar over eruptions (4 or or
the length of each, to 5) with eruptions eruptionsreinforcing bar. Bub- vents approxbles approx ½-in dia. 8 .- -in dia.
133 Bubbles were continu- Vents well No bubbles No bubblesmin ous, approx 0 to 1-in formed (9 to or or
apart along the en- 10 ea) at eruptions eruptionstire length of each random sitesbar. Only a few of over athese bubbles would rcinforcingburst and then bubble bay.up again. Bubblesalso formed over theblack steel tie wiresholding the meshtogether.
60 No new bubbles. Many Vents well No bubbles No bubblesmin of the bubbles had formed (11 or or
flattened and had ea) up to eruptions eruptionscracks in their h-in dia.tops, allowing thegas to escape. See Figure See Figure Sce Figure
See Figure 4.3 (a) 4.3 (b) 4.3 (c) 4.6 (d)

34
ý'7!I
(a)
i t.t
(b)
)VI
Figure 4.3. Ferro-cement n•nels one hour after casting showinq theeffects of Cr0 3 in suppressing the galvanic cell activity, (a)' -inthick specimen showing rows of bubbles along the reinforcing ba'scaused by the evolution of hydrogen, (b) J-in thick specimens showingthe rather large vents randomly distributed over the surface.

35
r AA~
00
mo,
Figure 4.3. (continued from opposite page)... (c) 7-in thick specimen
wihC0 sosn bubblns like those shw n() d -nthick~
specmenwithCr0 shos io vntslikethoe in(b)
36
contained Cr0 3 and showed no bubbling or eruptions on the surface at
all. This contrasted with the two panels without Cr0 3 which exhibited
active bubbling or spurting. The four panels are shown in Figures
4.3 (a b c d), and it is clear that the addition of Cr03 has reduced
the galvanic cell sufficiently to prevert the hydrogen bubbles from
breaking through to the surface. This is particularly evident if "he
two panels with only one layer of mesh are compared, Figure 4.3 (a)
and (c). There is little resistance for the bubbles to break through
and yet the specimen with Cr03 showed no bubbling at all. Note that
the bubbles are clearly visible on the test panel without Cr0 3 shown in
Figure 4.1 after the complete curing process; this is the same panel
shown in Figure 4.3 (a) one hour after being cast. The test panels
were cured, as described above, for 28 days at 100% tulative humidity.
The fully cured ferro-cement specimens were cut with an 18-in
diamond saw, both at a right angle and longitudinally to the reinforcing
bars, in order -, observe the bonding characteristics of the mortar
to the steel reinforcing bars. The longitudinal cuts were made top
and bottom to the bars down to the surface of the bars, thereby allowing
th 'rro-cE'nent to be "opened up" along the length of the bars. This
allowed individu'l bars to be removed from the specinins.
The specimens witho:.t Cr0 3 exhibited a continuous void along the
entire length and circumference of the bars. There was evidence of
very little contact between the mortar and steel. The surface of the
mortar surrounding the bars was pocked, 9iving a spongy appearance as
Thuwn in Figure 4.5. Few smooth areas could he found that would indicate
that cor~tact or bond had been made by the mortar to the bars. Entrapped

37
6$6
* 4 L4
-- 1
V'
NO EPODCIBL
Fig u e 4 4 . h e r ws f b bbl e al ng ei nf rci g b rs s own i n ig ur 4 . ( a
are~~~~ ~ ~ ~ ~ reandi h ialcrdpnlatr 8dy os ue
38
hydrogen gas had completely encircled the bars and forced the mortar
back from the surface of the bars.
The specimens with the Cr0 3 admixture revealed a perfect impression
of the deformed steel bars in the mortar. An excellent, void free bond
existed along the entire length of each bar inspected. This is graphi-
cally illustrated in Figure 4.5 where the pocked surface of the mortar
without Cr0 3 is shown alongside that with Cr0 3.
The flexure tests were conducted on four ferro-cement panel specimens
as described above. Two of the specimens contained CrO3 and two did
not. A Baldwin Universal Testing Machine of 60,000 pounds capacity was
used with a linear differential transformer placed at mid-span to measure
the deflection. A typical flexure test is shown in Figure 4.6 (a b)
with a '-in thick ferro-cement specimen in place. The specimen shown
in Figure 4.6 (b) has a deflection of 1.5-in and the stress in the
outer fiber is 4,816 psi. That specimen was made with only mesh and fno reinforcing bars. The spacing of the loading points is 7-in on
centers with load transmitted to the specimen through four L-in x 2-in
x 6-in steel bearing plates set ;n place with a quick-drying, high
strength gypsum plaster (hydrostone). The deflection was recorded
continuously with an electronic x-y recoyder and the loading rate was
240 lb/min until ultimate failure.
The load deflection curves for the flexure tests of the specimens
with and without Cr03 are shown in Figure 4.7 and it is apparent that
the presence of CrO3 makes a difference in the mechanical behavior of
these panels. Both the apparent modulus and the ultimate strength are
increased by using CrO3. The numerical values for these quantities
1.I

39
m0
.o-Jell
00
- E..
0
x 'I., 0. m
40
0 0.-
• 4-- *r-O
t-4J
- .,-.... . 4..
-4-
A 0 0*)
"• . . . .. "" .)
au 3:Ai
._ -,.: .• .,v2
4. c *~4. u)
IN
S....,4==•:' "O u
-pop

40
(a)
(b)
Figure 4.6. A typical flexure test is shown where the load is appliedto third points of the specimen and the strain is measured at mid-span.(a) No load is applied to the j-in thick ferro-cement specimen. (b) AcOflection of 1.5 inches is shown for the same specitner under testwhere the stress was 4,816 psi in the outer fiber.

41
Table 4.3. Flexure Test Results for Ferro-Cementwith and without Cr0 3.
ApparentModulus Ultimate Strength
ofFerro-Cement Specimen Elasticity
3-in x 6-in x 24-in (determined Stressat 50% ulti- Deflec- Load (psi)
mate load) tion (0b) (outer(psi) (in) fiber)
With CrO3 3.65 x 10⁶ 0.975 2,460 15,300Hardware cloth___________reinforcement
Without Cr0 3 2.2 x 10⁶ 1.0 1,550 9,650
With CrO3 3.88 x '10 0.775 2,116 13,200Chicken wirereinforcement
Without Cr03 1.94 x 10⁶ 0.950 1,485 9,250
are given in Table 4.3 and a direct comparison can be made. The apparent
modulus of the hardware cloth sample was increased by 1.6 from 2.2 x 10c
psi to 3.65 x 10⁶ psi and that of the chicken wire was increased by a
factor of 2 from 1.94 x 10⁶ psi to 3.88 x 10⁶ psi by the addition of
Cr0 3 . The ultimate strength was also greatly increased by the addition
of Cr0 3 .
It is intere ting to noLe that the spe:imen with 6 iayers of hard-
ware cloth compared almost identically to the specimen with 8 layers of
chicken wire for the specimens without Cr0 3, see Figure 4.7. The ultimate
stress of these specimens, over 9,0uO psi, wcre at the very top of the ulti-
mate stress range for ferro-cement (approximately 5,000 - 9,000 psi) as
reported by previous investigators.
The ferro-cement specimens *,t:: Cr0 3 exhibited 59% and 437 greater

42
2800
2460 LBI24003
2400-- •"~~ H.w. (with Cr 03)/'K 40L
'•X2116 L B
2000 - C.W. (with Cr 03 )
3"
1600 H.W.without Cr 03)0X 1550 LB
n ,•,•"-'-•X 1485 LB
0
1200 -- •'CAW. (without Cr 0 3 )
800
NOTE: H.W.: Hordwore ClothC.W.= Chicken Wire
400
00 0.25 0.50 0.75 1.0 1.25
DEFLECTION . nchesFigure 4.7. The load-deflection curve for the flexure tests ofspecimens with and without Cr0 3. The specimens with Cr0 3 showsubstantially greater stiffness as well as ultimate strength.

43
strengths in flexure respectively for the hardware cloth and for the
chicken wire reinforcements than for their counterparts without Cr0 3.
These strengths corresponded to stresses of 15,300 psi and 13,200 psi
respectively. Subsequent tests with welded wire fabric show even
better strengths using Cr0 3 and these will be reported later.
The results of the visual tests showed that the chemical bond
and the mechanical friction between the steel bars and the concrete
was very low for ferro-cement without CrO3. This fact vas confirmed
by the bending tests. Therefore, the bond strength (composite strength)
between the bars and the concrete was considerably lower for ferro-
cement not treated with CrO0 and greatly reduced the fluctural strength.
It is probable that if plain bars (non-deformed) would be used,
those bars would most likely exhibit an even greater tendency to be
pulled through the concrete, and failure would occur at even lower
loads for mortar without the Cr0 3 admixture. This is important for
ferro-cement since smooth bar is often used.
The other possible solutions* to the galvanic cell problem were
investigated by visual observations on the freshly cast test panels
and by cutting the panels open after a full cure cycle. There was
little bubbling observed with any of the other systems and it is
interesting that the galvanic cell activity observed without CrO3
present is confirmed to be due to the combination of galvanized steel
mesh and ungalvanized steel reinforcing bars. This was true for the
external examination of the freshly cast panels, but a study of the
* All galvanized system, all black iron system, and an epoxycoated black iron.

44
internal state of the cured specimens showed that both the all galvanized
and all black iron samples had poor mortar/reinforcing-bar surfaces.
A photograph of these specimens is shown in Figure 4.8 and it is cv.'ident
that there has been some activity at the reinforcing bar surface which
has made a rough surface. It is probable that this is due to a
galvanic cell caused by small differences in the material. Recent
tests with welded wire fabric showed that hydrogen gas was evolving
from each of the junctions where a weld had been made. Both the all
galvanized or a11 black iron system would be sensitive to ý,-a'l differences
in material, and one would never be completely sure that some cells were
not established by an unforeseen combination of materials. The Cr03
solution appears to be the best solution available. The epox- coating
appeared to work rather well, except that it filled in some of the
deformation• on the reinforcing bar which would decrease its inter-
locking with the hardened mortar.
4.2. Microscopic Observations
It is apparent from Figure 4.5 that the use of Cr0 3 gives a much
smoother surface of mortar in contact with the reinforcing bars in
ferro-cement. Mortar samples from thi ferro-cement panels shown in
Figure 4.5 were removed and observed in the scanning electron microscope.
Thii type of microscope has been used extensively in previous studies of
cement samples (6), and it is particularly useful for these studies
because it has a large depth of field and magnification from as low
as 25x to as much as 200,OOOx with a resolution of approximately 250
The ro,ign surface of the sample without CrO0 is shown in a mosaic

45
Oro>- 0 S 4J
4. -, UY r- ..
0. ro
4- '0n
0) 0)q~) (A-
0-Ov
4=) a) .0
4-)010 ea
0 0 C
(A -r-
40')
t4.
40
10 4-'4)
LLJ Q) J ALI0
U* 4- 4.!C
c0
. C L .
4 - 1
C, o rdt
Zm r- 4u 113

46
of micrographs in Figure 4.9. There are so many bubbles near the sur-
face of the reinforcing bar that it is difficult to find zones that
were in contact with the steel. There is one contact zone in the fore-
ground of Figure 4.9 that is marked A, but it is small and interrupted
by a bubble in the center. A region just to the left of the arrow in
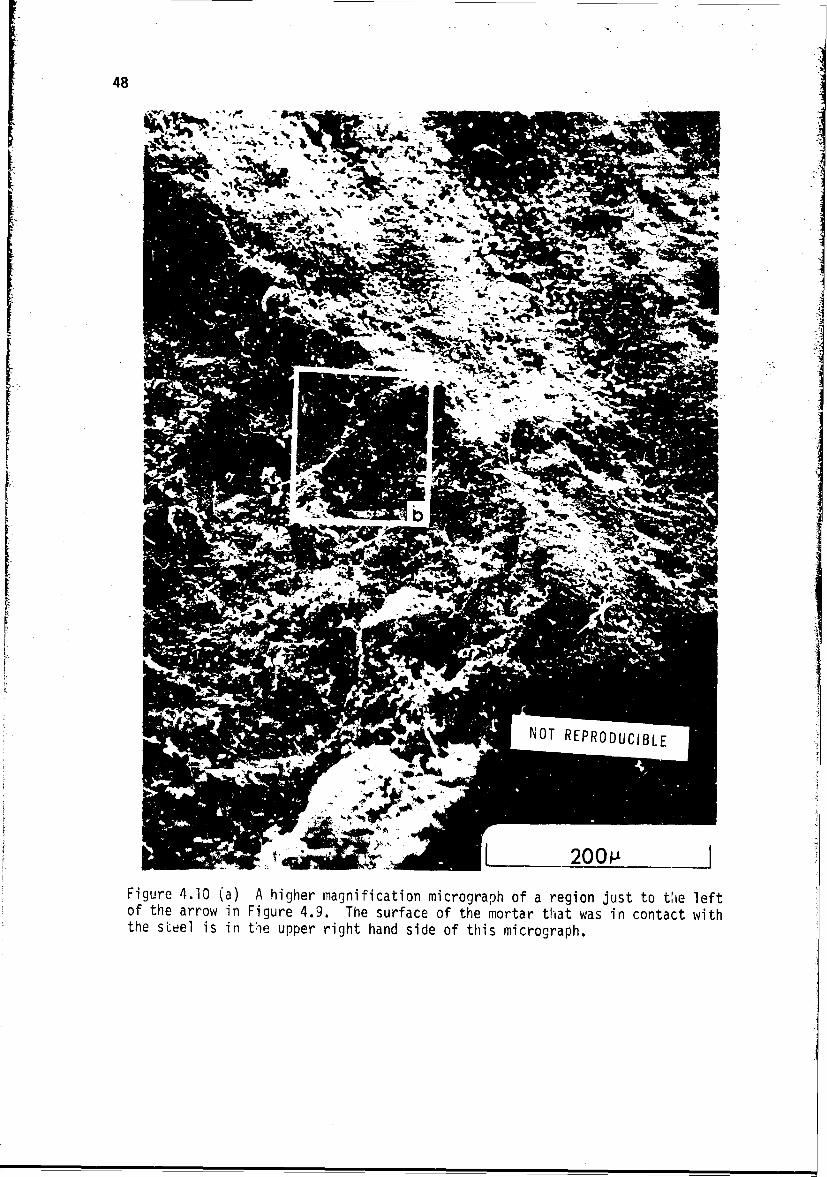
Figure 4.9 is shown at higher magnification in Figure 4.10 (a). The
surface of the mortar that was in contact with the reinforcing steel
is in the upper right hand corner of that figure and it appears relatively
smooth. The region to the left in Figure 4.10 (a) is a fracture surface
that was created when a piece was chipped out of the sample. This
fractured area is visible in Figure 4.9 and probably occurred when the
specimen was prepared for the scanning electron microscope. A portion
of this fracture surface is shown at higher magnification in Figure
4.10 (b) with broken sand grains visible at several places on the surface.
The presence of the broken sand grains means that the cement paste
surrounding them is sound and probably unaftected by the evolution of
hydrogen at the surface of the reinforcing stael.
A specimen remcved from the panel treated with CrO3 is shown at
low magnification in Figure 4.11 (a) with the surface of the mortar
which had been in contact witn the reinforcing bar visible in the upper
portion of the micrograph. A fracture surface through the mortar is
shown in the lower foreground of that figure, and it is free from pares
or bubbles. A mosaic of micrographs showing the same region is shown
in Figure 4.11 (b) in order to illustrate the smoothness of the inter.-
face between the mortar and the reinforcing bar when Cr0 3 is used. A
small region marked in the center of Figure 4.11 (b) is shown in

47
4-1 0
u0=
0- 4'ý (L) 0
-P 4J )
a ) "o93.D
US-C r~
E2 -A0 5- -
0~. r-
u - -
CADC cf (U .C
(0 U 4jius.-P 0
0 > 4-) G)LAJ 04 ) (A~
0 4-)
*di 5 Q) .4-A- $- to -
48
II
i ~~NOT REPRODU IBE:
' • ,, [200P,]
Figure 4.10 (a) A higher magnification micrograph of a region just to the leftof the arrow in Figure 4.9. The surface of the mortar that was in contact withthe steel is in the upper right hand side of this micrograph.

49
k NOT REPRODUCIBLE
Figure 4.10 (continued from opposite page)... (b) A micrograph of anarea marked in (a) which shows the frdcture surface of several sandgrains. The presence of the broken sand grains means that the cementpaste is sound. (Please note that 11 corresponds to 10" cm orapproximately 4 x 10" in.)

IMI
Figure 4.11 (a) 1, olow lagni fcati or, -licrograph showi ng the surface of theirortar 3 i s s~oooth and unnmarked by hubbl Es. Notice that there are :),tany ý-uhLMes or- the -1racturc-ý surface through the mortar ir the fereground.

51
NOT REPRODUCIBLE
xili
4ý
Figuie 4.11 (continued from opposite paae),,. (b) A mosaic of micrographs
showing approximately the same region as in (a) but with more detail.Notice the smoothness of the mortar with CrO 3 .

NO0T REPRODO-CIBLE
IY
(a)
aw
1 -1
~ ~tq
(b)ý
textue of h~ suprce

NOT REFRODUCI8LE53
(c)
(C)
Figure 4.12 (,continued from opposite r~g) . (c) A roigher niagnificatiolnview fjf ar area -,ia-ked in (L.) ii'ich swxcws t'l~r morphologiy of Lhe crystalsmakinn up thle surfa:ý. (d) A very high magnificat-ion mnicrograph of a.-.area. inarl~ed ir; (c) ,.m.i.wing theu dndrid~c nature of tiie crystals in tCi
surface of the mlortCar.

64
increasing steps of magnification in Figure 4.12 (a b c d) in order to
illustrate the surface texture of the mortar in contact with the re-
inforcing steel. The utility of the scanning electron microscope isevident in this sequence of micrographs where individual dendritic
crystallites are visible in Figure 4.12 (d). It is probable that these
are outer hydration products 4hich nucleated and grew on the surface
of the reinforcing steel to form the smooth interface between mortar
and steel. This process can be imagined from the schematic illustra-
tions in Figures 2.3 and 2.4. It is likely that the round flat crystals
visible in Figure 4.12 (a b c) remained in contact with the steel and
those in Figure 4.12 (d) shrunk back a few microns from the steel
surface. The exact identity of the dendritic crystals visible in
Figure 4.12 (d) cannot be made at this time since there is little
experience on observations on this type of surface. There are several
crystals visible in Figure 4.12 (c d) which have the sheaf of wheat
morphology observed by Williamson (15) in transmission microscopy of
tricalcium silicate (C3S) outer hydration products. It is also possible
that this may be a carbonated layer on the free surface after the
sample was cut open. In the latter case the morphology of the crystal-
lites may be that of the original hydration prod•:cts and retained as
pseudomorphs in the carbonation layer; or it may be that of the car-
bonation products themselves.
4.3. Conclusions and Recommendations
The galvanic cell between the plain steel and galvanized steel in
ferro-cement is a problem which until this time appears to have been
unknown. This cell has probably been active in most ferro-cement projects

with tie resulting loner strength and durability. The inspection and
licensing aitherities should be aware of the galvanic cell problem in
ferro-cement, and all projects constructed in the past should be viewed
as weakened by the cvolution of hydrogen at the ungalvanized reinforcing
bar. One of the riost effective inspection procedures would be to remove
specimens from the structure and look at the interface between the
mortar and the plain steel.
For all future ferro-cement construction, we recommend that Cr0 3
be added to the mixinc water. Again the inspection and licc,,sin,-
authorities could require t!-t CrC 3 be used during construction and
that its use be noted in the permanent records of the vessel or
structure.
The testing and inspection of ferro-cement vessels is a relatively
new field and we recognize that the discovery of the galvanic ceil
problem has complicated the inspection of existant vessels and struc-
tures. Further experiments should be performed to determine how the
durability of these vessels or structures is affected by the poor
bond between reinforcing steel and tne mortar. A non-destructive
test method should be developed to help the surveyor determine the
extent of bubble fornation in an existing panel of ferro-cement. As
it stands at this time we can only recomrend that test panels ,e cut
from the vessel or structure and the interface inspected visually.
In the final analysis it is only in new construction that the
nalvanic cell probler, can really be solved, and we believe that thI
addition of CrO Is the best possible solution. 14e must go along
witI" the quotation of A. L. Edge, "It's almost impossible to distinlquisý

56 1between a good or poor quality ferro-cement hull after it his been
finished," '(16). A ferro-cement vessel or structure must be made
correctly the -irst time because it is almost impossible to go back
and fix it later.
I
if'I
iii

57
REFERENCES
1. S. P. Shah, "Ferro-Cemnent as a New Engineering 11aterial, Univ. ofIllinois at Chicago Circle Report No. 70-11, November 1970, pre-sented at the Canadian Capital Section of American ConcreteInstitute, Ottawa, December 1970.
2. 'J. F. Collins and J. S. Claman, "Ferro-Cement for IMarine Applications-An Engineering Evaluation," Department of Naval Architecture andMarine Engineering, 11assachusetts Institute of Technolocgy, Cambridge,Nass. , March 1969.
3. G. W. Jackson and W. 11. Sutherland, CoceeBabulig tTechnique and Its Future, John DeGraff Inc., N.W.(1969).
4. V. F. Bezukladov, K. K. Amel Vanovich, et al., "Ship Hulls Madeof Reinforced Concrete," (Korpusa Sujov Iz Amotsementa), transl.from Russian, Navships Trans. M'o. 1148, November 1968.
5. P. L. Nerii, "Ferro-Cement: Its Characteristics and PotentialitCies,"L'Ingegnere (lS5l) or C.A.C.A. London Library, Translation 60 (19,65).
6. R. B. Williamson, Solidification of Portland Cement, Rept. No.UCSES!1 70-23, Dece-mber 1970.
7, T. C. Powers, "Structure and Pliysical Properties of HardenedPortland Cemient Paste,' J. Am. Cer. Soc. 41 (1958) 1-6.
8. B. Bresler and I. Cornet, "Corrosion Protection of Steel Reinforcementin Concrete and Tentative Recoriiienda'.ions for Use of GalvanizedSteel Reinforcement," Report to Intrxrnational Ledd Zinc ResearchOrganization, Inc., New York, N.Y.. October 1969.
9. 1. Cornet arid B. Bresler, "Corrosion of Steel and Galvanized Steelin Con--rete," M~aterials Protection, 5, 69-722, April 1966.
10. T. Ishikawa, 1. Cornet, and B. Bre~ler, "Electrochemical Study ofthe Corrosion Behavior of Galvanized Steel in Concrete," Dept. ofCivil Engineering, 11niversity of Califnrrnia. Berkeiey.
11. 1. Cornet and R. Bresler, "Some R~ecent [Ievelopment,ý in the Ilse ofGalvanizeu Steel Reinforcement in 'Concrete,'" InternationaleVerzinkertagung. Duesseldorf, December 6, 197T
12. B. 8-esler and I. Ccrnet, private commuunication.

13. K. A. Christensen, "The impact Resistance of Laminated Steel Mesh iImpregnated with Portland Cement 'eortar (Ferro-Cement)," GraduateResearch Project, Department of Civil Engineering, University ofCalifornia, Berkeley, Spring 1970.
14. Charles Darwin Canby, "Ferro-Cement with Particular Reference toMarine Applications," Dept. of '{val Architecture and MarineEngineering, University of Micnigan, October 1968.
15. R. B. Williamson, "Constitutional Supersaturation in PortlandCement Solidified by Hydration," J. Crystal Growth, 3, 4, (1968),787-794.
16 J. R. Whitener, Ferro-Cement Boat Construction, Cornell MaritimePress, Inc., Cambridge, Md., 1971, p. 109. 3