Solid Earth Discuss., doi:10.5194/se-2016-105, 2016 ... · physical weathering influences the...
22
1 5 Geochemical mass-balance, weathering and evolution of soils formed on a Quaternary- age basaltic toposequences Hüseyin ŞENOL 1* , Tülay TUNÇAY 2 , Orhan DENGİZ 3 1 Suleyman Demirel University, Faculty of Agriculture, Department of Soil Science and Plant Nutrition, Isparta, Turkey. 2 Soil Fertilizer and Water Resources Central Research Institute, Ankara, Turkey. 3 Ondokuz Mayıs University, Faculty of Agriculture, Department of Soil Science and Plant Nutrition, Samsun, Turkey. Correspondence to: Huseyin Senol ([email protected] ) Abstract. The purpose of this research is to assess the geochemical mass-balance and weathering intensity of Typic Haplustert and Lithic Ustorthent soils represented by four profiles that developed in a Quaternary-age basaltic toposequence under semi-humid conditions in the central Black Sea region of Turkey. The researchers employed mass-balance analysis with a view to measuring elemental gains and losses along with alterations concerning the soils formed on the basaltic parent material. For this end, geochemical properties, elemental mass-balance changes and certain physicochemical features were identified to benchmark the weathering levels of the profiles. Lithic Ustorthents are distinguished by having a rough texture along with a low organic substance ingredient, whereas Typic Haplusterts have a high clay texture with low bulk density and slickenside features. X-ray diffraction showed that smectites were the prevailing minerals inside the Typic Haplusterts, while a significant amount of kaolinite and illite was observed in the Lithic Ustorthents. Mass-balance computations indicated that massive mineral weathering resulted in substantial Si losses through leaching as well as an exchange of cations, such as Na + , K + , Ca 2+ and Mg 2+ , particularly from the upper horizons. The study also took into account other features such as the pedogenic evolution of soils using weathering indices such as CIA, CIW, bases/R2O3, WIP, P and PIA. According to the results, CIA, CIW, PIA, P, WIP and bases/R2O3 index values of all soils varied between 42.33 to 73.83, 44.46 to 80.43, 37.53 to 65.63, 75.39 to 84.31 and 0.45 to 1.27 respectively, to solum depth. This result indicated that soils classified as Entisol and Vertisol have similar pedochemical properties. In spite of similar weathering rates, the soils were classified under different groups as a result of erosion. This showed that the conditions for soil development in the studied area had a far more impact on weathering and elemental loss than the parent material on the site. 10 15 20 25 30 Key Words: soil formation, mass-balance, toposequences, weathering indices, clay minerals 1. Introductıon Solid Earth Discuss., doi:10.5194/se-2016-105, 2016 Manuscript under review for journal Solid Earth Published: 23 August 2016 c Author(s) 2016. CC-BY 3.0 License.
Transcript of Solid Earth Discuss., doi:10.5194/se-2016-105, 2016 ... · physical weathering influences the...

1
5
Geochemical mass-balance, weathering and evolution of soils formed on a Quaternary-age basaltic toposequences
Hüseyin ŞENOL1*, Tülay TUNÇAY2, Orhan DENGİZ3
1Suleyman Demirel University, Faculty of Agriculture, Department of Soil Science and Plant Nutrition, Isparta, Turkey. 2Soil Fertilizer and Water Resources Central Research Institute, Ankara, Turkey. 3Ondokuz Mayıs University, Faculty of Agriculture, Department of Soil Science and Plant Nutrition, Samsun, Turkey.
Correspondence to: Huseyin Senol ([email protected])
Abstract. The purpose of this research is to assess the geochemical mass-balance and weathering intensity of Typic
Haplustert and Lithic Ustorthent soils represented by four profiles that developed in a Quaternary-age basaltic toposequence
under semi-humid conditions in the central Black Sea region of Turkey. The researchers employed mass-balance analysis
with a view to measuring elemental gains and losses along with alterations concerning the soils formed on the basaltic parent
material. For this end, geochemical properties, elemental mass-balance changes and certain physicochemical features were
identified to benchmark the weathering levels of the profiles. Lithic Ustorthents are distinguished by having a rough texture
along with a low organic substance ingredient, whereas Typic Haplusterts have a high clay texture with low bulk density and
slickenside features. X-ray diffraction showed that smectites were the prevailing minerals inside the Typic Haplusterts, while
a significant amount of kaolinite and illite was observed in the Lithic Ustorthents. Mass-balance computations indicated that
massive mineral weathering resulted in substantial Si losses through leaching as well as an exchange of cations, such as Na+,
K+ , Ca2+ and Mg2+, particularly from the upper horizons. The study also took into account other features such as the
pedogenic evolution of soils using weathering indices such as CIA, CIW, bases/R2O3, WIP, P and PIA. According to the
results, CIA, CIW, PIA, P, WIP and bases/R2O3 index values of all soils varied between 42.33 to 73.83, 44.46 to 80.43,
37.53 to 65.63, 75.39 to 84.31 and 0.45 to 1.27 respectively, to solum depth. This result indicated that soils classified as
Entisol and Vertisol have similar pedochemical properties. In spite of similar weathering rates, the soils were classified
under different groups as a result of erosion. This showed that the conditions for soil development in the studied area had a
far more impact on weathering and elemental loss than the parent material on the site.
10
15
20
25
30
Key Words: soil formation, mass-balance, toposequences, weathering indices, clay minerals
1. Introductıon
Solid Earth Discuss., doi:10.5194/se-2016-105, 2016Manuscript under review for journal Solid EarthPublished: 23 August 2016c© Author(s) 2016. CC-BY 3.0 License.

2
5
10
15
20
25
Soil is viewed as an open system with additions and removals of materials to and from the profile, and translocation and
transformation within the profile. Pedogenesis can be progressive or regressive. Progressive pedogenesis includes processes
that promote differentiated profiles leading to horizontal separation, leaching, developmental upbuilding and soil deepening.
In this area particularly, soil toposequences are frequently utilized to indicate the relative soil development degree within
changing durations of soil formation, taking the fact that the other soil formation factors resemble each other into account.
During weathering, the elements are moved and re-delivered in different ways as there are many pedogenic processes that
influence different elements and produce different results. These processes include dissolution of primary minerals,
formation of secondary minerals, redox processes, transport of material and ion exchange (Middleburg et al., 1988, Dengiz
et al., 2013). It is therefore important to understand how a soil is formed from bedrock and to examine how chemical or
physical weathering influences the geochemical evolution of soils. According to Birkeland (1999, it is both possible to re-
deliver down-slope elements by weathering as a function of their mobility under steady ongoing changes in the geochemical
environments along the slope. Soil development, in the chemical sense, is also roughly synonymous with weathering (Bohn
et al., 1985). Therefore, weathering rates, or element depletion rates or accumulation in the catchment area or soil profile
scale, are often acquired by mass-balance studies (input–output budgets) and provide important indications concerning the
reactivity of a relevant soil or catchment area (Dahms et al., 2012). Moreover, regressive pedogenesis (Minasny et al., 2008;
Sommer et al., 2008) includes steps that promote rejuvenation processes, retardant upbuilding (soil impedance produced by
surface-accreted materials) and surface removals (erosion). In this case, the slope position has a key role in soil formation,
and the significance of the effects of the slope gradient on the soil’s physicochemical and mineralogical properties has been
widely reported (Jong et al., 2000, Dengiz, 2007). Soil formation is therefore considered as a net change in mass-balance of
the soil compartment.
The researcher developed certain mass-balance equations taking these properties into account. These equations aimed to
determine soil deformation (strain), and open chemical system gains and losses in the soil, in relation to the parent material.
It is also possible to conduct a soil mineralogy examination to determine whether it is pedogenesis or differences in parent
materials that lead to chemical differences. Volumetric and mass changes during soil formation were assessed by
administering a mass conservation equation (Brimhall and Dietrich, 1987; Brimhall et al., 1988, 1991; Chadwick et al.,
1990).
This study mainly aimed to describe an empirical method with a view to modeling this open system contribution in
accordance with the compositional change analysis within soil profiles. This is done by determining the weathering rates and
mass-balance of soils developed on a catena with respect to the soil-forming factor topography, and using some weathering
indices based on geochemical information in semi-humid environments with similar geological patterns and climate. The 30
mass-balance, and certain weathering indices with other features – such as the mineralogy and some of the analytical
characteristics of soils formed over a toposequence and Quaternary-age basaltic parent materials – are indicated here to
discuss their use in quantifying the phases of maturity and the duration of soil formation.
Solid Earth Discuss., doi:10.5194/se-2016-105, 2016Manuscript under review for journal Solid EarthPublished: 23 August 2016c© Author(s) 2016. CC-BY 3.0 License.

2. Materıals and Methods
2.1. Site Description
3
5
This study was carried out along a transverse section between the Bafra Plain and the Canik mountain, and located
approximately 20 km west of the Samsun province in the central Black Sea Region of Turkey (Figure 1). The study area is
situated between the coordinates 4597065 N –253437 E and 4595005 N – 251693 E (UTM/WGS 84 m).
Figure 1. Location map of the study area
Solid Earth Discuss., doi:10.5194/se-2016-105, 2016Manuscript under review for journal Solid EarthPublished: 23 August 2016c© Author(s) 2016. CC-BY 3.0 License.

The study area ranges from 10 m to 300 m and includes four landscape features (foot slope, back slope, lowland plateau and
shoulder) representing changes in geomorphology, topographic gradient, parent material and soil characteristics. The
underlying bedrock consists primarily of Quaternary-age basaltic, colluvial deposits on the foot slope, lowland plateau, and
Mesozoic-age basalt and marl-limestone on the back slope and highland plateau. Today, the region has a semi-humid 5
climate. Summers are warmer than winters (Avg. Temperatures: July, 22.2 oC; January, 6.9 oC). The average annual
temperature, rainfall and evaporation are 13.6 ºC, 764.3 mm and 726.7 mm, respectively. Soil temperature and water
moisture regimes at the study site were classified in accordance with the Soil Survey Staff (Soil Taxonomy, 1999) as mesic
and ustic, respectively. Physiographically, the area comprises four main units. The study area is covered predominantly by
pasture and forest land. A minority of the site consists of a slightly sloped (0.0 to 2.0%) low plateau, while other sections are
hilly and moderately to severely sloped (3 to 20%). Only a small part of the foot slope and lowland plateau is agricultural
land.
10
15
2.2. Soil Sampling and Analysis
Based on the hypothesis that topography, parent material and climate–vegetation cover might be the main controlling factors
for mass-balance in soil development, soils have been studied along a transverse section (diagonally in the southwestern to
northwestern direction) using four representative profiles (Figure 2). The morphological features of these four profiles from
the field were identified and sampled by genetic horizons and classified in accordance with Soil Survey Staff (1993, 1999).
Twelve disturbed and undisturbed the samples of soil were taken to the laboratory to search for their physical, chemical and
mineralogical features. The soil samples were first air-dried and then passed through a 2 mm sieve to be ready for laboratory
analysis. 20
Shoulder
Backslope
Low land plateau Footslope
Land PIII
PII
PI
PIV Lithic Ustorthent
Typic Haplustert Lithic
Ustorthent
Typic Haplustert
Figure 2. Transect of the four different soil profiles on the same parent material but different topographic positions. 25
4
Solid Earth Discuss., doi:10.5194/se-2016-105, 2016Manuscript under review for journal Solid EarthPublished: 23 August 2016c© Author(s) 2016. CC-BY 3.0 License.

2.3. Physical, Chemical and Mineralogical Analysis After the soil samples were air-dried and passed through a 2 mm sieve, their particle size distribution was designated by the
hydrometer method (Bouyoucos, 1951), following the removal of organic matter with 30% H2O2, the removal of sulfates by 5
leaching the salts with distilled water, the removal of carbonates with 1 M NaOAC at pH 5, and sample dispersion by
agitating it in 10 ml of 40% sodium hexametaphosphate (Calgon) (Gee and Bauder, 1986). Bulk density (Blacke and Hartge,
1986) was determined from the undisturbed samples. Organic matter and total nitrogen content were determined in the air-
dried samples employing the Walkley-Black wet digestion method (Nelson and Sommers, 1982). The pH and EC-electrical
conductivity (of the saturated sample) were determined by using a Soil Survey Laboratory method (2004). The lime content 10
was determined by a Scheibler calcimeter (Soil Survey Staff, 1993). Exchangeable cations and cation exchange capacities
(CEC) were measured utilizing a 1 N NH4OAC (pH 7) method (Soil Survey Laboratory, 2004).
The clay fraction (< 2 μm) was acquired from the soil, after destruction of organic matter with dilute and Na-acetate-buffered
H2O2 (pH 5), by dispersion with Calgon and sedimentation in water. Prepared specimens on glass slides were analyzed by X-
ray diffraction using Cu Kα radiation from 2° to 30° 2θ with steps of 0.02° 2θ at 2 s step–1. The following treatments were 15
carried out: Mg saturation, ethylene glycol solvation (EG) and K saturation, followed by heating for 2 h at 550 °C. Minerals
and their relative abundance were determined by their diagnostic XRD spacing and assessed using their XRD relative peak
intensities from the XRD scheme (Whittig and Allardice, 1986).
2.4. Mass-Balance 20
Mass-balance models provide a means to account for the fate of elements during soil evolution by measuring the gains,
losses and transformations that emerge over time (Brimhall and Dietrich, 1987). Long-term weathering rates of soils were
obtained from the calculations of the enrichment/depletion factors determined by utilizing immobile element content such as
Ti, Zr or V (Egli et al., 2008). In this study, Ti was used as an immobile element. Volumetric changes that emerge during
pedogenesis were determined by adopting the classical definition of strain, εi, w (C) (Brimhall and Dietrich, 1987). 25
(1)
where Δzw is the weathered equivalent height (m), Δz is the columnar height (m), a positive value indicating enrichment and
a negative value indicating depletion. The calculation of the open-system mass transport function (T), (Chadwick et al.,
1990) is shown below:
5
Solid Earth Discuss., doi:10.5194/se-2016-105, 2016Manuscript under review for journal Solid EarthPublished: 23 August 2016c© Author(s) 2016. CC-BY 3.0 License.

(2)
τj,w is the calculation of the open-system mass transport function; ρw is the bulk density of the weathered soil, Cj,w is the
concentration of element in the weathered product, Cj,p is the concentration of the element in the protolith (e.g. the
unweathered parent material or bedrock) (kg.t−1) and ρp is the bulk density of the protolith (t. m−3) (Egli and Fitze, 2000).
(3) 5
mj,flux(zw), with n soil layers is the calculation of changes in the mass of element j and is given by (Egli and Fitze, 2000)
(g.cm−2). Positive values indicate additions to the system, whereas negative values indicate losses from the system.
3. Results and Discussion 3.1 Soil morphological properties and soil classification 10 Some morphological properties of the soil and soil classifications for the soil profiles are shown in Table 1. The four
different soil profiles have the same parent material, but at different topographic positions on the transverse section of the
study area and showed changes in terms of their depth, color, structure and textural distribution. Many researchers indicated
that different morphological, physical and chemical features of soils can be related to various topographic positions or 15
specific landforms associated with accumulation, erosion and runoff processes during soil formation, due to the effects of
adding water and energy, and taking them away from, the soil (Birkeland, 1999; Yair, 1990; Dahlgren et al., 1997; Canton,
2003; Dengiz, 2010). Soil texture is a major property of soil, and it may be influenced by geological processes such as
erosion. The pedological differences along the transverse section are also shown in Figure 2. Clay percentages of the profiles
affected by slope gradient showed variations from 32% to 68% with increasing elevation This result, to some extent,
concurred with the result of Kreznor et al., (1989), Rezaei and Gilkes (2005) Dengiz et al., (2013). It was found that particle
size depended on landscape attributes, including slope degree or gradient. This change also has an effect on the structural
20
development of soils along the transverse section. The soils formed on the lowland plateau and foot slope have a clay
texture, while the soils formed on a high degree of slope have a clay loam texture. These differences represent the obvious
effects of erosion, whereby surface soils have been carried from the back slope to the foot slope and lowland plateau, their 25
accumulation leading to progressively darker, deeper and finer-textured soils with decreases in elevation. The clay fraction,
particularly, tended to increase with depth in all profiles up to the Bss horizon in profiles PII and PIV. This case also
encourages developing soil structure, and Bss horizons were characterized by a strong blocky and prismatic structure with
slickenside formation. As for the PI and PIII profiles, the slope degree played an significant role in supervising the soil
6
Solid Earth Discuss., doi:10.5194/se-2016-105, 2016Manuscript under review for journal Solid EarthPublished: 23 August 2016c© Author(s) 2016. CC-BY 3.0 License.

7
formation and development. Due to movement of fine earth and organic matter, structural growth of the back slope and
shoulder position soils on the surface horizon is weak and also moderate, fine and granular (1fgr-2mgr).
The Soil Taxonomy (Soil Survey Staff, 1999) and the FAO/UNESCO soil map of the world legend (FAO/ISRIC, 2006) was
used to classify the soils investigated. The classification was based on the results of the morphological, physical and
chemical characteristics of the soils. The soils located on the foot slope and lowland plateau were formed from a basalt
parent material and contained more than 40% clay, as indicated by surface cracks ranging from 1 to 5 cm in width, as well as
intersecting slickensides and shiny pressure faces in the subsurface horizon (Bss) This also reflects a shrinking and swelling
of the soil. Accordingly, profiles PII and PIV were classified as Typic Haplustert. These profiles were also classified as
Haplic Vertisol by taking the FAO/ISRIC (2006) classification system into consideration.
5
10
Table 1. Morphological properties and classification (Soil Taxonomy, 1999 and FAO/ISRIC, 2006) of profiles
Horizon Depth (cm) Color
(dry)
Color
(moisture) Structure Boundary
Special
features
PI / Shoulder (Lithic Ustorthent / Eutric Regosol )
A 0-16 2.5 Y 5/2 2.5 Y 3/2 2fgr cs -
Cr 16+ 2.5 Y 3/3 2.5 Y 5/2 sg - -
PII / Low land plateau (Typic Haplustert / Haplic Vertisol)
A 0-12 10 YR 5/3 10 YR 3/4 3mgr cs cracks
Bss1 12-48 10 YR 5/3 10 YR 4/3 2msbk cw slickenside
Bss2 48-89 10 YR 5/3 10 YR 3/2 3mpr cw slickenside
C 89+ 10 YR 4/3 10 YR 3/2 mas - -
PIII / Backslope (Lithic Ustorthent / Eutric Regosol)
Ap 0-24 2.5 Y 5/3 10 YR 3/2 2mgr as -
Cr 24+ 2.5 Y 4/3 2.5 Y 4/3 sg - -
PIV / Footslope (Typic Haplustert / Haplic Vertisol)
Ap 0-23 2.5 Y 5/2 2.5 Y 3/3 3mgr as cracks
Bss1 23-65 2.5 Y 5/3 2.5 Y 3/2 3mpr cw slickenside
Bss2 65-106 2.5 Y 5/2 2.5 Y 4/1 3cpr cw slickenside
C 106+ 10 YR 6/1 10 YR 4/2 mas - - Abbreviations: Boundary: a = abrupt; c = clear; g = gradual; d = diffuse; s = smooth; w = wavy; i = irregular Structure: 1 = weak; 2 = moderate; 3= strong; sg = single grain; mas = massive; vf = very fine; f = fine; m =medium; c = coarse; gr = granular; pr = prismatic; abk = angular blocky; sbk = subangular blocky 15 Profiles PI and PIII were classified as Lithic Ustorthent. The slope was one of the most significant factors controlling the
pedogenic process in this pedon, which is located on a high back slope. Slope brings greater runoff, as well as to greater
Solid Earth Discuss., doi:10.5194/se-2016-105, 2016Manuscript under review for journal Solid EarthPublished: 23 August 2016c© Author(s) 2016. CC-BY 3.0 License.

8
5
translocation of surface materials down-slope through surface erosion and soil movement. The horizon orders of the PI and
PIII profiles were defined as A-Cr horizons. This means that these profiles had no diagnostic subsurface horizons and
included a lithic layer within 50 cm of soil depth. Therefore, this soil is classified as a young soil due to low pedogenetic
development. According to the FAO/ISRIC (2006) classification system, these profiles were classified as Eutric Regosol
3.2. Physical and chemical soil properties Physical and chemical properties for the soil profiles are presented in Table 2. Clay content ranged from 32.1% to 68.5%,
while sand content varied from 15.8% to 40.1% in the profiles. The textural class of the soils changed between clay and clay
loams. Typic Haplustert (PII and PIV profiles) included higher fine fraction content than those of silt and sand. Because 10
these profiles were located on low slope positions (the lowland plateau and foot slope) in the study field, they were within
the accumulation area. On the other hand, other profiles formed on high slope positions that led to soil transport. The reason
for it is higher clay deposition in these profiles through the processes of transportation and colluviation, rather than
weathering from the adjacent hill areas (Akhtaruzzaman et al., 2014). The clay content was lower in the A horizons and
increased with depth in all profiles. In addition to that, Ovalles and Collins (1986) also reported that physical soil properties 15
such as the distribution of clay content with depth, sand content and pH were highly correlated to landscape position.
Bulk density values for the soils ranged from 1.22 to 1.61 gr.cm−3 across the profiles of the toposequence. Bulk density
content was relatively lower in different horizons of profile PIV compared to that of other profiles and included high
amounts of sand particles. The low amount of organic carbon (Gupta et al., 2010) might have contributed to the higher
values of bulk density in the soil. The bulk density values were the lowest in the surface or close to the surface horizons, and 20
they increased progressively with depth. Similar results were reported by Göl and Dengiz (2008). Lower bulk density values
were related to organic matter and clay content, especially at the surface horizon.
Organic matter originates from open-system influxes, which decreased with depth. The amount of organic matter added to
surface horizons varied between 1.65% and 2.35%, also influx decreased from 0.14% to 0.15% in the C/Cr horizons. Soil pH
does not vary significantly along the toposequence. The pH valued ranged from 6.93 to 8.25 in all horizons and increased
with depth, except for Lithic Ustorthent soils (PI). This profile has lower pH values, being located on the upper slope
positions that promote basic cation leaching, whereas other profiles were neutral to basic soil reaction pH values. In addition,
CaCO3 contents ranged from 0.20% to 2.67% even the development of all these profiles on basaltic parent material which
doesn’t produce carbonate. It can be said that this case resulted from carbonate contamination. Similar to our findings,
Aksoy (1991) found a lime content of 2% to 26% in soils on the Kayacik plains in Gaziantep, although the primary material
25
30
in the area of their study was basalt. The CEC values varied and could be correlated to clay and organic matter content, with
maximum values of 42.80 cmolc. kg−1 in the surface soils of all profiles, and minimum values of 11.09 cmolc. kg−1 in the
subsurface horizons (C or Cr); additionally they showed no trend with depth except for the PIV profile that showed no
significant decrease in value with depth. The highest CEC values were found where smectite was the predominant clay type
in the presence of aluminosilicate minerals. The base saturation values were almost 100% for all profiles. Calcium and 35
Solid Earth Discuss., doi:10.5194/se-2016-105, 2016Manuscript under review for journal Solid EarthPublished: 23 August 2016c© Author(s) 2016. CC-BY 3.0 License.

9
Magnesium were the prevailing exchangeable cations for all profiles and ranged from 33.16 to 42.24 cmolc. kg−1 in surface
horizons. Higher contents of Ca and Mg in the surface horizons were probably related to weathering of the basalt parent
material and biological accumulation from plants (Akbar et al., 2010).
5 Table 2. Some physical and chemical features of studied profiles
Horizon Depth
(cm)
pH(H2O)
(1/2.5)
EC
(dS.cm-1)
CaCO3
(%)
O.M
(%)
Exchangeable Cations
(cmolc·kg-1) CEC
(cmolc·kg-1)
B.D
(gr.cm-3)
Particle size distribution
(%)
Na K Ca+Mg C Si S Class
PI / Shoulder (Lithic Ustorthent / Eutric Regosol )
A 0-16 7.03 0.19 0.50 2.25 0.28 1.02 33.16 34.46 1.44 34.4 25.5 40.1 CL
Cr 16+ 6.93 0.25 0.20 0.42 0.45 1.24 9.39 11.09 1.61 - - - -
PII / Low land plateau (Typic Haplustert / Haplic Vertisol)
A 0-12 7.05 0.16 0.79 1.71 0.35 0.24 40.17 40.76 1.42 41.5 24.2 34.3 C
Bss1 12-48 7.72 0.19 0.29 1.69 0.74 0.31 48.07 49.13 1.22 68.5 18.3 23.9 C
Bss2 48-89 7.79 0.34 1.37 0.59 1.31 0.41 47.25 48.97 1.34 49.8 26.4 20.7 C
Cr 89+ 7.96 0.30 1.18 0.17 1.26 0.24 32.84 34.35 1.44 - - - -
PIII / Backslope (Lithic Ustorthent / Eutric Regosol)
Ap 0-24 7.87 0.55 0.49 2.35 0.41 0.28 42.24 42.93 1.44 32.1 27.9 40.1 CL
Cr 24+ 8.04 0.10 0.29 0.55 1.03 0.15 14.20 15.38 1.65 - - - -
PIV / Footslope (Typic Haplustert / Haplic Verisol)
Ap 0-23 7.50 0.17 0.20 1.65 0.22 1.67 40.91 42.80 1.28 56.2 23.1 20.7 C
Bss1 23-65 7.30 0.44 0.98 1.26 0.25 1.47 39.64 41.36 1.29 62.6 12.8 24.5 C
Bss2 65-106 8.25 0.17 1.10 1.09 1.33 1.41 37.59 40.33 1.23 68.4 15.8 15.8 C
C 106+ 8.14 0.11 2.67 0.14 1.35 1.40 36.04 39.78 1.30 - - - - EC: Electrical Conductivity, BD: Bulk Density, O.M: organic Matter, CEC: Cation Exchange Capacity 3.3. Total content 10 The composition of the material that was investigated clearly reflects an Si-rich and basaltic character. The major element
concentrations and bulk density of the toposequences profiles developed on Quaternary and Mesozoic basalt (colluvial
deposit; foot slope, back slope, lowland plateau and slope, respectively) in the Samsun-Bafra Plain, Northern Turkey, are
given in Table 3. All soils contained large concentrations of SiO2, Al2O3 or Fe2O3. These elements Si, Al, Fe were chosen
due to their abundant existence in the soils (˃93% of total elemental composition occurs as oxides) (Langley-Turnbaugh and
Bockheim, 1998).
15
Solid Earth Discuss., doi:10.5194/se-2016-105, 2016Manuscript under review for journal Solid EarthPublished: 23 August 2016c© Author(s) 2016. CC-BY 3.0 License.

10
In most cases, chemical compositions of parent materials of soils resembled each other. There were, however, some minor
differences in the chemical composition of the B and C horizons between the sites. The SiO2 had a slightly higher content at
the PIV site; the Al2O3 had a slightly lower content in the PI and PIII profiles; the Fe2O3 had a slightly higher content in the
PIII soil profiles; the MgO had a slightly lower content in the soil profiles of PIV and PII, and the CaO had a slightly higher
content in the soils of PIV – especially in Bss 2 and C horizons – and in PI. 5
10
The content of Fe2O3 in all soil profiles was determined to be at a higher level than their parent materials. On the other hand,
the content of other elements in the soils were detected at a lower level than those of the parent materials (except for the PII
profile for SiO2). In the solum layer of Typic Haplustert (PII), concentrations of Al, Fe and Mg are enriched, whereas
concentrations of Si, Ca, Na and K levels were decreased (except for the PIV profile where Si and K increased in the solum
layer).
Table 3. Geochemical characteristics (total analysis of the bulk material including soil skeleton and fine earth) of the investigated profiles
Horizon Depth
(cm)
Bulk
Density
SiO2
(%)
Al2O3
(%)
Fe2O3
(%)
MgO
(%)
CaO
(%)
Na2O
(%)
K2O
(%)
TiO2
(%)
P2O5
(%)
MnO
(%)
Cr2O3
(%)
PI / Shoulder (Lithic Ustorthent / Eutric Regosol )
A 0-16 1,44 45,32 6,99 11,83 4,16 5,06 0,84 2,85 0,84 0,48 0,22 0,012
Cr 16+ 1,61 45,80 7,46 10,02 4,85 5,90 0,92 2,80 0,78 0,47 0,25 0,008
PII / Low land plateau (Typic Haplustert / Haplic Vertisol)
A 0-12 1,42 50,73 17,56 10,69 2,34 1,42 1,21 2,93 0,98 0,17 0,22 0,021
Bss1 12-48 1,22 46,30 17,36 11,02 5,44 1,48 1,38 3,08 0,82 0,45 0,18 0,009
Bss2 48-89 1,34 53,67 17,78 8,63 2,25 1,60 1,14 2,56 0,87 0,08 0,18 0,024
C 89+ 1,44 58,32 16,13 7,81 1,74 1,70 1,59 3,14 1,06 0,18 0,19 0,035
PIII / Backslope (Lithic Ustorthent / Eutric Regosol)
Ap 0-24 1,44 43,83 10,91 14,04 3,89 3,19 0,37 1,75 1,02 0,33 0,50 0,006
Cr 24+ 1,65 42,83 9,75 13,92 3,71 5,72 0,55 1,29 1,07 0,40 0,57 0,002
PIV / Footslope (Typic Haplustert / Haplic Verisol)
Ap 0-23 1,28 59,38 13,76 7,02 1,53 2,37 1,25 1,62 0,97 0,20 0,21 0,060
Bss1 23-65 1,29 58,87 13,97 7,10 1,60 1,05 1,05 1,43 0,98 0,06 0,29 0,052
Bss2 65-106 1,23 53,20 13,11 6,48 2,30 8,22 0,99 1,37 0,87 0,10 0,17 0,045
C 106 + 1,30 52,78 10,05 6,39 2,51 8,55 1,04 1,42 0,84 0,12 0,14 0,043
The chemical composition for all soil samples was predominantly SiO2 and Al2O3, with SiO2 from 42.83 to 59.38% and
Al2O3 from 6.99 to17.78%. TiO2 content, 0.78 to 1.07%, was markedly decreased in the weathered products. For this case,
15
Solid Earth Discuss., doi:10.5194/se-2016-105, 2016Manuscript under review for journal Solid EarthPublished: 23 August 2016c© Author(s) 2016. CC-BY 3.0 License.

11
Jianwu et al., (2014) also reported that fresh basalt had a decreased titanium content of between 0.82 to 0.97% depending on
the parent material weathering. The soil samples showed significant variations of 6.99 to 17.78% in terms of the Al2O3
concentration as a result of the abundance of plagioclase. This result was also supported by Machado et al., (2008). Major
element concentration of the PI and PII profiles showed a trend of irregular distribution with depth. However, other profiles
tended to have a regularly decreasing distribution with depth in their major element concentrations. The CaO values were 5
higher in the subsoil than the surface. The MgO values showed that there were significant differences among the horizons.
The high value of MgO was caused by the presence of mica minerals (biotite). In addition, concentrations of K2O, 1.29 to
3.08%, and Na2O, 0.84 to 1.38%, correlated to the existence of alkali feldspar and common mineral in the basaltic rock.
3.4. Chemical weathering indices 10
Based on the principles of soil genesis, alkali and alkaline earth metals (Na, Mg, K and Ca) move through the soil horizons
before the silicium fraction as the weathering process continues (Souri et al., 2006). Although profiles developed on basaltic
materials are still new (Quaternary age), the evaluation of weathering indices was performed with the objective of showing
basaltic material at an early stage of weathering. Weathering indices for weathering profile samples have conventionally
been measured using the molecular proportions of major element oxides (Price and Velbel, 2003). Potential chemical 15
weathering indices of the unweathered (C/Cr horizon) and weathered (solum) basaltic material are shown in Table 4.
Nesbitt and Wilson (1992) separated weathering profiles into four qualitative analyses, which are incipient, intermediate,
advanced and extreme. Several indices are considered, such as the chemical index of alteration (CIA; Nesbitt and Young,
1982), the Chemical Index of Weathering (CIW; Harnois, 1988), the Weathering Index of Parker (WIP), the Plagioclase
index of alteration (PIA; Fedo et al., 1995), the Product index (P; Reiche, 1950), the bases/R2O3 (Birkeland,1999) and the 20
Vogt index/Vogt’s residual index (V; Vogt, 1927). They can quantify the condition of different parent materials at the onset
of weathering, assess their fertility, provide a better perception of elemental mobility in the course of weathering and
estimate the source of soil nutrients in addition to changes in the primary minerals (Fiantis et al., 2010).
These indices should be easy to use, involving chemical elements common in soil analyses (Harnois, 1988; Price and Velbel,
2003). The use of the CIA, CIW and PIA are to give a quantitative measure of feldspar weathering by relating Al enrichment 25
in the weathering residues – in contrast to Na, Ca and K – which should be removed from a soil profile during plagioclase or
K-feldspar weathering (Nesbitt and Young, 1982; Price and Velbel, 2003; Fiantis et al., 2010). WIP, introduced by Parker
(1970) for silicate rocks is based on the proportions of alkaline and alkaline earth metals present (Fiantis et al., 2010). The
most mobile major elements don’t need to suppose that sesquioxide concentration remains approximately constant in the
course of weathering. The V index is a geochemical method for evaluating the maturity of residual sediments. The 30
Bases/R2O3 index uses the principle that, in a leaching process, the ratio between the concentration of mobile base elements
(Mg, Ca, Na and K) and relatively immobile elements (Al, Fe and Ti) decreases over time (Mourier, 2008).
Table 4. Weathering rates of studied soils
Solid Earth Discuss., doi:10.5194/se-2016-105, 2016Manuscript under review for journal Solid EarthPublished: 23 August 2016c© Author(s) 2016. CC-BY 3.0 License.
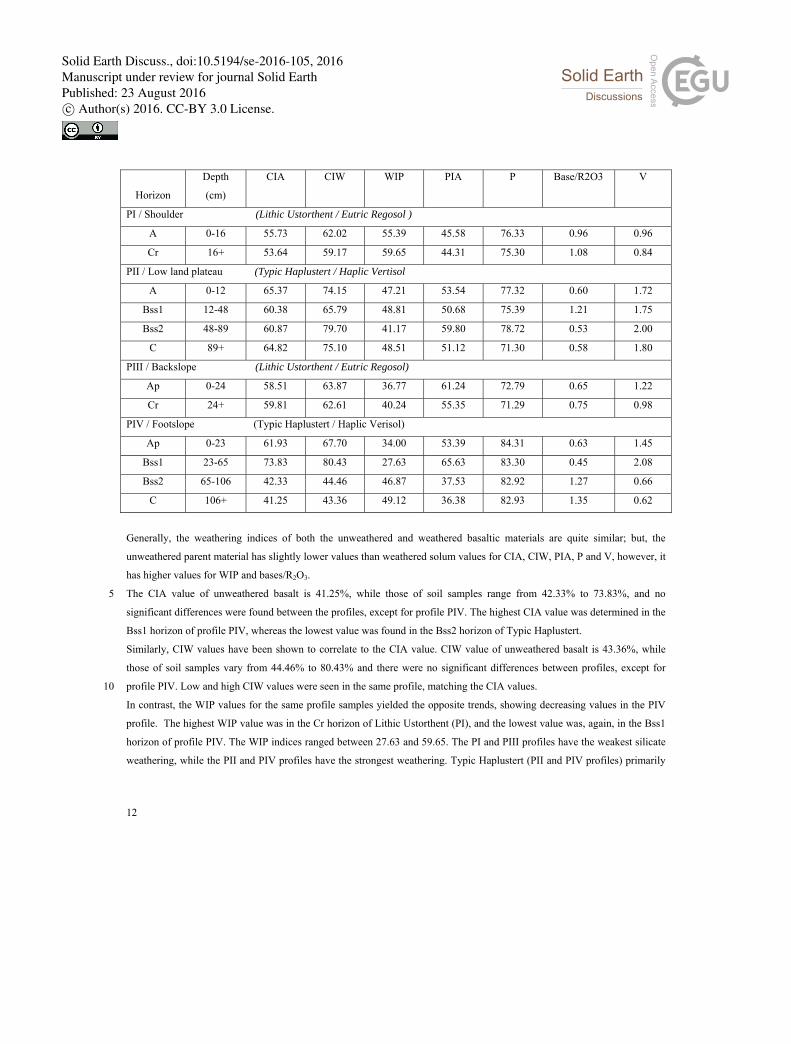
12
Horizon
Depth
(cm)
CIA CIW WIP PIA P Base/R2O3 V
PI / Shoulder (Lithic Ustorthent / Eutric Regosol )
A 0-16 55.73 62.02 55.39 45.58 76.33 0.96 0.96
Cr 16+ 53.64 59.17 59.65 44.31 75.30 1.08 0.84
PII / Low land plateau (Typic Haplustert / Haplic Vertisol
A 0-12 65.37 74.15 47.21 53.54 77.32 0.60 1.72
Bss1 12-48 60.38 65.79 48.81 50.68 75.39 1.21 1.75
Bss2 48-89 60.87 79.70 41.17 59.80 78.72 0.53 2.00
C 89+ 64.82 75.10 48.51 51.12 71.30 0.58 1.80
PIII / Backslope (Lithic Ustorthent / Eutric Regosol)
Ap 0-24 58.51 63.87 36.77 61.24 72.79 0.65 1.22
Cr 24+ 59.81 62.61 40.24 55.35 71.29 0.75 0.98
PIV / Footslope (Typic Haplustert / Haplic Verisol)
Ap 0-23 61.93 67.70 34.00 53.39 84.31 0.63 1.45
Bss1 23-65 73.83 80.43 27.63 65.63 83.30 0.45 2.08
Bss2 65-106 42.33 44.46 46.87 37.53 82.92 1.27 0.66
C 106+ 41.25 43.36 49.12 36.38 82.93 1.35 0.62
Generally, the weathering indices of both the unweathered and weathered basaltic materials are quite similar; but, the
unweathered parent material has slightly lower values than weathered solum values for CIA, CIW, PIA, P and V, however, it
has higher values for WIP and bases/R2O3.
The CIA value of unweathered basalt is 41.25%, while those of soil samples range from 42.33% to 73.83%, and no
significant differences were found between the profiles, except for profile PIV. The highest CIA value was determined in the
Bss1 horizon of profile PIV, whereas the lowest value was found in the Bss2 horizon of Typic Haplustert.
5
10
Similarly, CIW values have been shown to correlate to the CIA value. CIW value of unweathered basalt is 43.36%, while
those of soil samples vary from 44.46% to 80.43% and there were no significant differences between profiles, except for
profile PIV. Low and high CIW values were seen in the same profile, matching the CIA values.
In contrast, the WIP values for the same profile samples yielded the opposite trends, showing decreasing values in the PIV
profile. The highest WIP value was in the Cr horizon of Lithic Ustorthent (PI), and the lowest value was, again, in the Bss1
horizon of profile PIV. The WIP indices ranged between 27.63 and 59.65. The PI and PIII profiles have the weakest silicate
weathering, while the PII and PIV profiles have the strongest weathering. Typic Haplustert (PII and PIV profiles) primarily
Solid Earth Discuss., doi:10.5194/se-2016-105, 2016Manuscript under review for journal Solid EarthPublished: 23 August 2016c© Author(s) 2016. CC-BY 3.0 License.

13
undergo weak and moderate silicate weathering, respectively. On the other hand, the degree of silicate weathering in the
Lithic Ustorthent soils was in the intermediate stage.
Based upon the principles of the Parker (PIA) and Product (P) indices, the samples are more weathered and regarded to be
older. These indices have quite different chemical bases. While Parker (PIA) is a suitable index to seek for the mobility of
alkali and alkaline earth metals through the soil profile, the Product index is appropriate to track movements of less mobile 5
elements (Souri et al., 2016).
In the profiles, the PIA value varied between 23.38 and 65.63, and no significant differences were found between the
profiles. The highest PIA rate was in the Bss1 horizon of profile PIV, and the lowest rate was, again, in the same profile in
the C horizon. The P index varied between 84.31and 71.29. It tended to decrease with depth for all profiles, except for the
Bss horizon of profile PII. 10
The bases/R2O3 value was below 1.4 in all profiles, ranging between 0.45 and 1.35. Generally, this index value increased
with depth in all profiles except for the Bss1 horizon of profile PIV, including the low level of the index value.
Because of its mobility in the course of chemical weathering, alkaline and alkaline earth elements are able to undergo
prominent changes, which resulted in the lower values on the Vogt index (V) for the unweathered samples. Some alkaline
and alkaline earth elements were flushed out of weathered grain material by rainfall. 15
3.5. Mass-Balance The pedological mass-balance model is an approach in quantitative geochemistry used to calculate chemical weathering and
loss/gain in soil formation. Because of their abundance in the soils – 93% of total elemental structure occurs as oxides – and 20
their importance in the soil formation process (Langley-Turnbaugh and Bockheim, 1998), the behavior of eight elements
were assessed in this research (Si, Al, Ca, Mg, Na, K, Mn and Fe), and the values for these elements are indicated in Table 5.
The researcher calculated the enrichment/depletion factors to get long-term weathering rates of soils in relation to the
immobile element contents (Egli et al., 2008). The enrichment/depletion factor is a ratio of the chemical concentration of an
element in the soil to its concentration in the parent material. The mass transport function is described as the mass fraction of 25
an element added or subtracted from the system during weathering relative to the mass of the element originally existing in
the parent material. Strain, mass fractions added to, or subtracted from, each horizon and the loss or gain of elements during
pedogenesis was calculated in accordance with Eqn. (1) to (3). The calculation of the gains or losses of elements require the
values of immobile elements. The open-system mass transport functions (τ) and strains (Mjflux) are listed against depth for
each soil and element (Table 5). 30
The mass-balance calculations that utilize immobile elements require two important assumptions related to elemental
components (White, 1995; Egli et al., 2001a, b). The first assumption includes the determination of the composition of the
parent material. For soils developed at sites on bedrock, the potential errors are confined to local heterogeneities in the
bedrock composition. It is more difficult to estimate the initial composition when soils have developed on sedimentary
Solid Earth Discuss., doi:10.5194/se-2016-105, 2016Manuscript under review for journal Solid EarthPublished: 23 August 2016c© Author(s) 2016. CC-BY 3.0 License.
14
parent materials such as cover beds. Consequently, the gains and losses are calculated based on the lowermost and least
weathered soil horizon (Waroszewski, 2016).
Zirconium and titanium have been used as immobile indices, which are stable in the soil environment (Brimhall and Dietrich
1987; Chadwick et al., 1990; Merritts et al., 1992; Harden 1988). Titanium was chosen as the immobile element for
calculating volume changes (strain). 5
Mass-balance calculations for basalt soils were conducted with Ti as the immobile elements, while Zr was used as the
immobile element in the granite and rhyolite. The SiO2 and Ti content did not correlate to the basalt soils (R2=0.04),
indicating that Ti concentrations were largely unaffected by eolian additions. Mineral phases in the basalt soils that could not
be derived from the basalt parent material, such as quartz and mica, were classified as eolian materials. The feldspars in the
eolian material is likely to occur, and Al enrichment values in the soils support the addition of eolian feldspars (Heckman 10
and Rasmussen, 2011). Mass-balance calculations of enrichment in Al were measured in the most horizons.
Element losses are seen in all upper horizons of the profiles except for profile PIII and PIV in Al and Na, and profile PII in
Al, Mg, K and Fe. The most intense leaching was observed in the Bss1 horizon (PIV) for Ca, Mg and Na. Negative mass-
balance values of up to 89% were found for Ca in the illuvial horizon of this profile. However, an enrichment of Al (except
for PII) and Fe (except for PIV) were measured in the uppermost horizons. 15
Negative strains were measured in the PIV and PI profiles (except for Al in profile PIV and Fe in profile PI), while positive
strains were measured in profiles PII and PIII (except for Ca in PIII, and Na in PIII and PII) (see Table 5). Positive values
show dilatation due to the formation of humus or (bio) pores (Egli et al., 2001b).
Greater losses of Ca and Mg emerge on the soil surface due to intense weathering and leaching, and losses increase with
depth in profiles PIand PIV. These elements appear to be the most mobile elements since they are the first elements to be
leached from the weathering profile.
20
The majority of loss in the basalt bedrock mass was in the form of Ca (−73.65 kg m−2), Mg (−12.74 kg m−2), Na (−1.18 kg
m−2) and K (1.79 kg m−2), sourced from the weathering of Ca feldspars, labrador and bytownite, that include high amounts of
the element calcium (Welch and Ullman, 1993). There is a very small amount of sodium in basaltic rock. The reason for the
loss can be due to the small amount of this element. Ca and Mg have a significantly different behavior. The net losses of Ca 25
and Mg seem in many cases to be significant when compared to Na. The open-system mass transport functions were slightly
lower for base cations in all the profiles, and finally, the leaching of base cations was more noticeable.
30
35
Solid Earth Discuss., doi:10.5194/se-2016-105, 2016Manuscript under review for journal Solid EarthPublished: 23 August 2016c© Author(s) 2016. CC-BY 3.0 License.
15
Table 5. Mass transport function values (τ) and mass losses/gains (g.cm-2) for some elements of soil profiles
Profile -Land Position
Horizon Si Al Ca Mg Na K Fe (τ) Mjflux (τ) Mjflux (τ) Mjflux (τ) Mjflux (τ) Mjflux (τ) Mjflux (τ) Mjflux
PIV Footslope
Ap -
0,03 -4,62 0,19 6,34 -
0,76 -
22,09 -
0,47 -4,03 0,04 0,14 -
0,01 -0,06 -
0,05 -1,06
Bss1 -
0,04 -
14,66 0,19 12,16 -
0,89 -
48,36 -
0,45 -7,20 -
0,13 -0,88 -
0,14 -1,23 -
0,05 -1,92
Bss2 -
0,03 -7,39 0,26 13,62 -
0,07 -3,20 -
0,12 -1,51 -
0,08 -0,44 -
0,07 -0,51 -
0,02 -0,70 C 0,00 0,00 0,00 0,00 0,00 0,00 0,00 0,00 0,00 0,00 0,00 0,00 0,00 0,00
Total - -26,67 - 32,13 - -
73,65 - -12,74 - -1,18 - -1,79 - -3,68
PIII Backslope
Ap 0,07 10,37 0,17 5,58 -
0,41 -7,82 0,10 1,22 -
0,29 -0,53 0,42 1,80 0,06 2,66 Cr 0,00 0,00 0,00 0,00 0,00 0,00 0,00 0,00 0,00 0,00 0,00 0,00 0,00 0,00
Total - 10,37 - 5,58 - -7,82 - 1,22 - -0,53 - 1,80 - 2,66
PII Low land plateau
A -
0,06 -5,43 0,18 4,51 -
0,10 -0,26 0,45 1,25 -
0,18 -0,44 0,01 0,05 0,48 5,91 Bss1 0,03 5,20 0,39 21,44 0,13 0,72 3,04 17,98 0,12 0,66 0,27 2,86 0,82 21,86
Bss2 0,12 31,88 0,34 24,95 0,15 1,12 0,58 4,52 -
0,13 -0,91 -
0,01 -0,09 0,35 12,20 C 0,00 0,00 0,00 0,00 0,00 0,00 0,00 0,00 0,00 0,00 0,00 0,00 0,00 0,00
Total - 31,65 - 50,90 - 1,59 - 23,74 - -0,69 - 2,81 - 39,97
PI Shoulder A -
0,08 -9,22 -
0,13 -2,41 -
0,20 -2,98 -
0,20 -2,45 -
0,15 -0,35 -
0,05 -0,38 0,10 2,39 Cr 0,00 0,00 0,00 0,00 0,00 0,00 0,00 0,00 0,00 0,00 0,00 0,00 0,00 0,00
Total - -9,22 - -2,41 - -2,98 - -2,45 - -0,35 - -0,38 - 2,39 3.6.Clay minerals In order to identify clay and primer minerals for Lithic Ustorthent and Typic Haplustert soils, XDR analysis and SEM
(Scanning Electron Microscope) images of clay minerals and primer minerals of some soil samples were carried out and are
shown in Figure 3 and Figure 4.
5
Basalt largely consists of mafic silicate minerals. With increasing weathering, these minerals were either transformed into a
new mineral phase (e.g., smectite), or decomposed (Egli et al., 2008). Random inspection of mineral composition detected
some non-clay minerals like quartz and K feldspar. The XRD patterns from the horizons of all profiles exhibited diffraction 10
peaks of quartz (0.336 to 0.338) and from the Ap horizon of CD-P4 profile K feldspar (0.344) (Figure 3). While basaltic
rocks may include quartz as an additional mineral, if considerable amounts are found in basaltic soils, they are usually of
aeolian origin (Wilson, 2006).
The clay mineralogical components of the soils in all profiles were similar, but varied in abundance. The prepared samples
for XRD pattern analysis of K+25 oC, K+550 oC, Mg− air dried and Mg+ glycolated samples indicated kaolinite, smectite
and illite in the C horizon of the PIV profile. In addition, vermiculite was also identified in the same layer.
15
Solid Earth Discuss., doi:10.5194/se-2016-105, 2016Manuscript under review for journal Solid EarthPublished: 23 August 2016c© Author(s) 2016. CC-BY 3.0 License.
16
5
10
15
20
25
30
35
40
Sm: Smectite, I: illite, K: kaolinite, Q: quarts
Figure 3. X-ray diffractograms of surface and subsurface horizons for each profiles
Solid Earth Discuss., doi:10.5194/se-2016-105, 2016Manuscript under review for journal Solid EarthPublished: 23 August 2016c© Author(s) 2016. CC-BY 3.0 License.

17
5
10
15
20
25
XRD patterns of some typical soil clay samples from the least and the strongest weathered soil horizons of sites are indicated
in Figure 3. Kaolinite is present all samples; the most characteristic peaks of kaolinite: 0.72 nm and 0.36 (Moore and
Reynolds, 1989), are not affected by glycolation, but disappear at 550 oC. These peaks (001, 002), of the crystalline type, are
sharp and symmetrical. The soils on the higher position had more kaolinite than those on the lower position, which is
indicative of the different developmental stages of the soils.
B A
2
D C
Figure 4: SEM images of clay minerals and primer mineral of some soil samples (A: 1: Quartz; 2: K-Feldspat; B: 1: Illite-Smectite; 2: Quartz; C: 1: Zeolite; 2: Smectite) The K+25 oC (air-dried) pattern exhibits a broad peak between 1.2 and 1.1, and 0.42 which includes smectite. These peaks
can be separated into several peaks under Mg+glycolated conditions. The most important reflections (1.6 nm and 1.5 nm)
correspond to smectites. Illite is distinguished by the (00l) series 1.01 and 0.50 nm. The air-dried patterns of these peaks, of
the crystalline type, are exhibited sharply and symmetrically. This clay mineral is unaffected by glycolation and heat
treatment (550 °C).
Kaolinite and smectite are the most frequently observed secondary phyllosilicates in magmatic soils, with kaolinite derived
from the weathering of feldspar, and vermiculite from the weathering of mica (Wilson, 2006). Vermiculites with hydrous Al
Solid Earth Discuss., doi:10.5194/se-2016-105, 2016Manuscript under review for journal Solid EarthPublished: 23 August 2016c© Author(s) 2016. CC-BY 3.0 License.

18
are common during weathering of muscovite (Barnhisel and Bertsch, 1989). The present of hydrated kaolin phases might
have resulted from the generally hot and dry climate conditions, and the ustic soil moisture regime. Both vermiculite and
illite existed in small amounts in the subsurface horizons, however only illite was found in surface horizons. Illites, or clay
micas, are generally inherited from the parent material or formed through the weathering of coarser mica particles (Allen and
Hajek, 1989). Researchers have also argued that illite may form authigenically (Harder, 1974; Norris and Pickering, 1983), 5
or through the conversion of smectite to a 1 nm mineral in arid environments (Mahjoory, 1975).
4. Conclusıons In this study the features of pedogenic evolution of four soil profiles formed in topographically different positions of the
southwestern–northeastern direction were investigated. The investigation considered the mass-balance, geochemical, clay
mineralogy and chemical weathering indices of Typic Haplustert and Lithic Ustorthent soils represented by four profiles
formed on basaltic parent material to understand the relationship between particular soils, and the landscapes and ecosystems
in which they function. For this purpose, geochemical features, some physicochemical and mineralogical properties were
determined to compare the profile weathering rates. The results of the study showed a strong relationship between the
topography and some of the soil’s morphological, mineralogical, physical and chemical characteristics.
10
15
Soil depth and physical soil features such as texture, structure and bulk density were found to improve downwards within the
toposequence. Fine earth concretions were lower in the back slope position, whereas, low slope degree positions included
less gravel content.
Mass-balance calculations indicated that massive mineral weathering led to considerable Si losses through leaching and an 20
exchange of cation, such as Na+, K+, Ca2+ and Mg2+, particularly from the upper horizons. These losses were particularly
observed in the early stages of the soil’s pedological development.
The soils were affected by element losses. However, they were still measurable. Mass-balance calculations and the use of
weathering indices showed significant leaching of major base cations and Si owing to the weathering of primary minerals
such as feldspars and olivine. The prevailing processes which were determined by the mass-balance analysis included de-25
silication and loss of bases. In general, negative values and element loss increased due to progressing soil age.
Ultimately, chemical weathering of silicate rocks through hydrolysis leads to an exchange of the cations Na+, K+, Ca2+ and
Mg2+ for H+ and perhaps a loss of Si4+ (Kramer, 1968). Cations such as Na+, K+ and Ca2+ are commonly generated by the
weathering of feldspar. The cation Mg2+ is derived from sheet silicates and mafic minerals, and it resides in smectite clays
(Nesbitt and Young, 1984; Pettijohn et al., 1987). In general, hydrolytic weathering causes a progressive transformation of
affected components into clay minerals, ultimately kaolinite.
30
The weathering indices values from CIA, CIW, WIP, PIA, P bases/R2O3 and V indicated that soils classified as Entisol and
Vertisol have similar pedochemical properties. In spite of similar weathering rates, the soils were classified differently as a
Solid Earth Discuss., doi:10.5194/se-2016-105, 2016Manuscript under review for journal Solid EarthPublished: 23 August 2016c© Author(s) 2016. CC-BY 3.0 License.

19
result of erosion. This showed that the conditions of soil development in the study area had a far more impact on elemental
loss and weathering than the parent material in the site.
4. Acknowledgments
The authors gratefully acknowledge the scientific research grant (TÜBİTAK-213O073) from the Scientific and
Technological Research Council of Turkey.
5
10
References Akbar, M.H., Ahmed, O.H., Jamaluddin, A.S., Nik Ab. Majid, N.M., Abdul-Hamid, H., Jusop, S., Hassan, A., Yusof, K.H.,
and Abdu, A.: Differences in Soil Physical and Chemical Properties of Rehabilitated and Secondary Forests. American
Journal of Applied Sciences. 7, 9, 1200-1209,doi: 10.3844/ajassp.2010.1200.1209, 2010.
Akhtarruzzaman, Md., Haque, EMd. and Osman, K.T.: Morphological, Physical and Chemical Characteristics of Hill Forest
Soils at Chittagong University, Bangladesh. Open Journal of Soil Science, 4, 26-35, doi: 10.4236/ojss.2014.41004, 2014.
Allen, B.L. and Hajek, B.F.: Mineral occurrence in soil environments. Pp. 199-278 in: Minerals in Soil Environments (J.B.
Dixon and S.B. Weed, editors). Soil Science Society American Book Series No. 1, Madison, USA. 15
DOI:10.2136/sssabookser1.2ed.c5, 1989.
Barnhisel, R.I. and Bertsch, P.M.: Chlorites and hydroxy interlayered vermiculite and smectite: in Minerals in Soil
Environments: 2nd ed., J. B. Dixon and S. B. Weed, eds., Science Society of America Journal, Madison, Wisconsin, 729-
788, 1989.
Birkeland, P.W.: Soils and Geomorphology. Oxford Univ. Press, New York, 430 pp, 1999. 20
Blake, G.R. and Hartge, K.H.: Bulk Density and Particle Density. In: Methods of Soil Analysis, Part I, Phsical and
mineralogical Methods. ASA and SSSA Agronomy Monograph no 9 (2nded), Madison.pp: 363-381, 1986.
Boul, S.W. and Hole, F.D.: Clay skin genesis in Wisconsin Soils. Soil Science Society of America, 25, 377-379,
doi:10.2136/sssaj1961.03615995002500050021x, 1961.
Bouyoucos, G.J.: A recalibration of the hydrometer method for making mechanical analysis of soils. Agronomy Journal, 43, 25
434-438. DOI:10.2134/agronj1951.00021962004300090005x, 1951.
Brimhall, G.H. and Dietrich, W.E.: Constitutive mass balance relations between chemical composition, volume, density,
porosity, and strain in metasomatic hydrochemical systems: Results on weathering and pedogenesis. Geochimica et
Cosmochimica Acta, 51, 567-587, doi:10.1016/0016-7037(87)90070-6, 1987.
Chadwick, O.A., Brimhall, G.H. and Hendricks, D.: From a black to a gray box-a mass balance interpretation of
pedogenesis. Geomorphology, 3, 369-390,
30
doi:10.1016/0169-555X(90)90012-F, 1990.
Solid Earth Discuss., doi:10.5194/se-2016-105, 2016Manuscript under review for journal Solid EarthPublished: 23 August 2016c© Author(s) 2016. CC-BY 3.0 License.

20
Dahms, D., Favill, F., Krebs, R. and Egli, M.: Soil weathering and accumulation rates of oxalate-extractable phases derived
from alpine chronosequences of up to 1 Ma in age. Geomorphology, 151-152, 99-113, doi:
10.1016/j.geomorph.2012.01.021, 2012.
Egli, M. and Fitze, P.: Formulation of pedologic mass balance based on immobile elements: a revision. Soil Science, 165,
437-443, doi: 10.1097/00010694-200005000-00008, 2000. 5
Egli, M., Fitze, P. and Mirabella, A.: Weathering and evolution of soils formed on granitic, glacial deposits: results from
chronosequences of Swiss alpine environments. Catena, 45, 19-47, doi: 10.1016/S0341-8162(01)00138-2, 2001b.
Egli, M., Mirabella, A. and Fitze, P.: Clay mineral formation in soils of two different chronosequences in the Swiss Alps.
Geoderma. 104, 145–175, doi: 10.1016/S0016-7061(01)00079-9, 2001a.
Egli, M., Mirabella, A. and Sartori, G.: The role of climate and vegetation in weathering and clay mineral formation in late 10
Quaternary soils of the Swiss and Italian Alps. Geomorphology, 102, 307-324, doi:10.1016/j.geomorph.2008.04.001, 2008.
Egli, M., Mirabella, A. and Sartori, G.: The role of climate and vegetation in weathering and clay mineral formation in late
Quaternary soils of the Swiss and Italian Alps. Geomorphology, 102, 307-324, doi: 10.1016/j.geomorph.2008.04.001, 2008.
Fedo, C.M., Nesbitt, H.W. and Young, G.M.: Unraveling the effects of potassium metasomatism in sedimentary rocks and
paleosols, with implications for paleoweathering conditions and provenance. Geology, 23: 921-924, 1995. 15
Fiantis, D., Nelson, M., Shamshuddin, J., Goh, T.B. and Van Ranst, E.: Determination of the Geochemical Weathering
Indices and Trace Elements Content of New Volcanic Ash Deposits from Mt. Talang (West Sumatra) Indonesia. Eurasian
Soil Science, 43, 13, 1477-1485, doi:10.1134/S1064229310130077, 2010.
Gee, G.W. and Bauder, J.W.: Particle-size Analysis. P. 383 - 411. In A.L. Page (ed.). Methods of soil analysis, Part 1,
Physical and mineralogical methods (Second Edition), Agronomy, 383-411, doi: 10.12691/env-3-4-4, 1986. 20
25
Göl, C. and Dengiz, O.: Effect of Modifying Land Cover and Long-Term Agricultural Practices on the Soil Characteristics in
Native Forest-Land. Journal of Environmental Biology, 29,5, 667-682, PMID:19295064, 2008.
Gupta, R.D., Arora, S., Gupta, G.D. and Sumberia, N.M.: Soil Physical Variability in Relation to Soil Erodibility under
Different Land Uses in Foothills of Siwaliks in N-W India. Tropical Ecology, 51, 2, 183-197, 2010.
Harden, J.W.: Genetic interpretations of elemental and chemical differences in a soil chronosequence, California. Geoderma,
43, 179-193, doi:10.1016/0016-7061(88)90042-0, 1988.
Harder, H.: Illite mineral synthesis at surface temperatures. Chemical Geology, 14, 241–253, doi: 10.1016/0009-
2541(74)90062-X, 1974.
Harnois, L.: The CIW index- a new chemical index of weathering. Sedimentary Geology, 55, 319-322, doi: 10.1016/0037-
0738(88)90137-6, 1988. 30
Heckman, K. and Rasmussen, C.: Lithologic controls on regolith weathering and mass flux in forested ecosystems of the
southwestern USA. Geoderma, 164, 99-111, doi: 10.1016/j.geoderma.2011.05.003, 2011.
Langley-Turnbaugh, S.J. and Bockheim, J.G.: Mass balance of soil evolution on late Quaternary marine terraces in coastal
Oregon. Geoderma, 84, 265-364, 1998.
Solid Earth Discuss., doi:10.5194/se-2016-105, 2016Manuscript under review for journal Solid EarthPublished: 23 August 2016c© Author(s) 2016. CC-BY 3.0 License.

21
Machado, A., Azevedo, J.M.M., Almeida, D.P.M. and Chemale, JrF.: Geochemistry of volcanic Rocks from Faial island
(Azores). Revista Electrónica de Ciências da Terra Geosciences On-line Journal, 5, 1-14, 2008.
Mahjoory, R.A.: Clay mineralogy, physical and chemical properties of some soils in arid regions of Iran. Soil Science
Society of America Journal, 39, 1157-1164, doi: 10.2136/sssaj1975.03615995003900060036x, 1975.
Merritts, D.J., Chadwick, O.A., Hendricks, D.M., Brimhall, G.H. and Lewis, C.J.: The mass balance of soil evolution on late
Quaternary marine terraces, northern California. Geological Society of America Bulletin, 104, 1456-1470,
doi:10.1130/0016-7606(1992)1042.3.CO;2, 1992.
5
Minasny, B., McBeatney, A.B., Salvador-Lanes, S.: Quantitative models for pedogenesis-A review. Geoderma, 144, 140-
157, doi: 10.1016/j.geoderma.2007.12.013, 2008.
Moore, D.M. and Reynolds, R.C.Jr.: X-ray Diffraction and the Identification and Analysis of Clay Minerals. second edition,
Oxford University Press, Oxford, 378 pp., 1997
10
15
Mourier, B., Poulenard, J., Chauvel, C., Faivre, P. and Carcaillet, C.: Distinguishing subalpine soil types using extractible Al
and Fe fractions and REE geochemistry. Geoderma, 145, 107-120, doi:10.1016/j.geoderma.2008.03.001, 2008.
Nelson, D.W. and Sommers, L.E.: Total carbon, organic carbon and organic matter. In: Methods of Soil Analysis, Part 2.
Chemical and Microbiological Methods Page.(L.A. Miller, R.H. Keeney, D.R, 2ndeds.). American Society of Agronomy,
Madison, WI, 539-579, 1982.
Nesbitt, H.W. and Wilson, R.E.: Recent chemical weathering of basalts. American Journal of Science. 292, 740-777,
doi: 10.2475/ajs.292.10.740, 1992.
Nesbitt, H.W. and Young, G.M.: Early Proterozoic climates and plate motions inferred from major element chemistry of
lutites. Nature. 299, 715–717, doi:10.1038/299715a0, 1982. 20
Norris, K. and Pickering, J.G.: Clay minerals. Soils: An Australian Viewpoint, Division of Soils, CSIRO, Melbourne.
Academic Press Ltd, London, pp. 281–308, 1983.
Ovalles, F.A. and Collins, M.E.: Soil-landscape relationships and soil variability in north central Florida. Soil Science
Society of America Journal, 50: 401-408, doi: 10.2136/sssaj1986.03615995005000020029x, 1986.
Parker, A.: An Index of Weathering for Silicate Rocks. Geological Magazine, 107, 501–
504,
25
70. http://dx.doi.org/10.1017/S0016756800058581, 19
Price, J.R. and Velbel, M.A.: Chemical weathering indices applied to weathering profiles developed on heterogeneous felsic
metamorphic parent rocks. Chemical Geology, 202, 3-4, 397-416, doi:10.1016/j.chemgeo.2002.11.001, 2003.
Reiche, R.: A survey of weathering processes and products. University of New Mexico Publications in Geology, The
University of New Mexico Press, No:3, 50 pp, 1950. 30
Soil Survey Laboratory: Soil Survey Laboratory Methods Manual, United States Department of Agriculture Natural
Resources Conservation Service, Soil Survey Investigations. Report No. 42, 2004.
Soil Survey Staff: Soil Survey Manual. USDA Handbook. No: 18, Washington D.C. USA, 1993.
Solid Earth Discuss., doi:10.5194/se-2016-105, 2016Manuscript under review for journal Solid EarthPublished: 23 August 2016c© Author(s) 2016. CC-BY 3.0 License.
22
5
Soil Survey Staff: Soil Taxonomy. A Basic of Soil Classification for Making and Interpreting Soil Survey. USDA Handbook
No: 436, Washington D.C. USA, 1999.
Souri, B., Watanabe, M. and Sakagami, K.: Contribution of Parker and Product indexes to evaluate weathering condition of
Yellow Brown Forest soils in Japan. Geoderma,130, 346-355, doi:10.1016/j.geoderma.2005.02.007, 2006.
Vogt, T.: Sulitjelmafeltets geologi og petrografi. Norges Geologiske Undersokelse, 121, 560 pp, 1927 (in Norwegian, with
English abstract).
Waroszewski, J., Egli, M., Kabala, C., Kierczak, J. and Dagmar, B.: Mass fluxes and clay mineral formation in soils
developed on slopes deposits of the Kowarski Grbiet (Karkonosze Mountains, Czech Republic/Poland). Geoderma, 264,
363-378, http://dx.doi.org/10.5167/uzh-120438, 2016.
White, A.F.: Chemical weathering rates of silicate minerals in soils. In: White, A.F., Brantley, S.L. Ž. Eds., Chemical
Waethering Rates of Silicate Minerals. Reviews in Mineralogy, vol. 31, Mineralogical Society of America, 407–461 pp,
1995.
10
15
Whittig, L.D. and Allardice, W.R.: X-ray diffraction techniques.In: Methods of Soil Analysis, Part 1. Physical and
Mineralogical Methods.(A. Klute, ed., 2nd eds.), ASA publication 9, Madison, Wisconsin, 55-86, 1986.
Wilson, M.J.: Factors of soil formation: parent material. As exemplified by a comparison of granitic and basaltic soils. In:
Scalenghe, R., Certini, G. (Eds.), Soils: Basic Concepts and Future Challenges. Cambridge University Press, New York, pp.
113-130, http://dx.doi.org/10.1017/CBO9780511535802.010, 2006.
Solid Earth Discuss., doi:10.5194/se-2016-105, 2016Manuscript under review for journal Solid EarthPublished: 23 August 2016c© Author(s) 2016. CC-BY 3.0 License.