SolarCity Corp - Duke University Investment Club · With its recent acquisition of advanced solar...
31
SolarCity Corp Patrick He, Lukas Neske, Bohan Wu
-
Upload
truongcong -
Category
Documents
-
view
219 -
download
2
Transcript of SolarCity Corp - Duke University Investment Club · With its recent acquisition of advanced solar...

SolarCity Corp
Patrick He, Lukas Neske, Bohan Wu

2
Session Agenda
I. Investment Thesis
II. Industry Overview
III. Company Analysis
IV. Valuation
V. Appendix

Investment Thesis

4
SolarCity (NASDAQ: SCTY)
Silevo acquisition provides higher efficiency and lower manufacturing costs
MyPower program triggers soaring demand for solar energy and panels at low cost
Low market penetration leaves significant room for future growth
Long term energy contracts provide steady, high-quality revenue streams
With its recent acquisition of advanced solar manufacturer Silevo and launch of the MyPower program, SolarCity has transformed itself into a vertically integrated solar energy company, which is poised to capture even greater market share and solidify itself as a leader in the solar industry.
Income Tax Credit to be reduced from 30% to 10% in 2017
Cost competitiveness relies on economies of scale
Negative EBITDA across the solar industry
CATALYSTS
RISKS
Recommendation: BUY Current Price: $51.51 Target: $74.31

Industry Overview

6
Solar Electricity 101

7
Solar Panels 101 – Terminology
MEASURE OF ELECTRICITY COST
$/KWh
MEASURE OF SOLAR PANEL COST
$/W
EQUATIONS
Energy = Power * Time
Joules (J) = Watt (w) * second (s)
KWh = 1000W * 3600s = 3,600,000 J

8
Solar Panels 101 – Efficiency
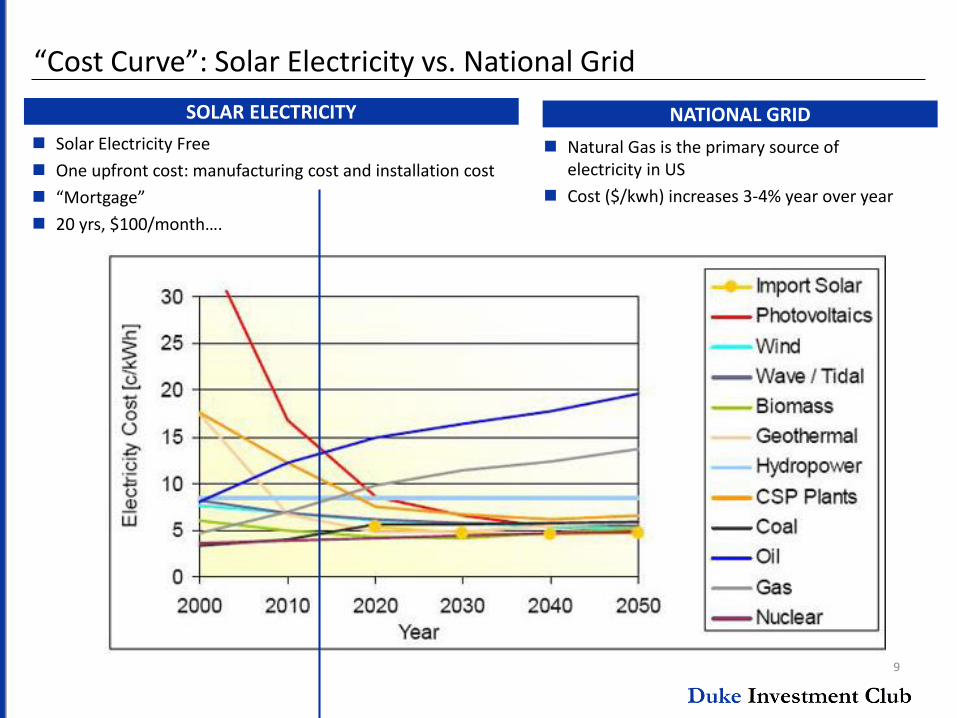
9
“Cost Curve”: Solar Electricity vs. National Grid
SOLAR ELECTRICITY NATIONAL GRID
Solar Electricity Free
One upfront cost: manufacturing cost and installation cost
“Mortgage”
20 yrs, $100/month….
Natural Gas is the primary source of electricity in US
Cost ($/kwh) increases 3-4% year over year

Polysilicon ModuleMounting Hardware
Finance Installation O&MEnd-User
Energy Delivery
VALUE CHAIN SOLAR INDUSTRY
Only few companies are “vertically integrated” New value chain participants: Solar Storage
Ability to provide cost effective storage
Requires new technologies
10
Sources: Bloomberg New Energy Finance
Cumulative installed solar capacity: 15,900 MW (Q2 2014)
Average nuclear power plant: 900 MW
53% of all new electric capacity installed has come from solar
Most important metric to measure panel price: $/W
US: around $1/W
China: around $0.5/W
US government imposes high tariff on solar panels exported from China
Obama’s Green Dilemma
MACROECONOMIC CONDITIONS
Industry Overview

11
Major Players
Design, Installation, Monitoring
Only limited financing options compared to SCTY
Market Share >10%
Provide multiple renewable Energy options
Focus on design and engineering of panels
Market Share >4%
Focus on photovoltaic
Design and installation for commercial business
Market Share >5%
Residential solar specialist
Market Share 20%

Company Analysis

Company Overview
Source: GTM Research
Originally: Solar Installer
Is now vertically integrated
Customers in 15 states
Highest market share in solar industry
Rapid growth in a quickly expanding industry
BUSINESS MODEL
ENERGY PRODUCTSMARKET SHARE
PERFORMANCE
45
50
55
60
65
70
75
80
SolarLease
Lease solar panel system
Pay by the month
No upfront payment
Power Purchase Agreement (PPA)
Lease solar panel system
Pay by kWh
Purchase system any time after 5 years
MyPower – loan program
Does not charge customers an upfront cost Customer owns hardware on the roof
Term of 20 years with interest rate set as low as 4.5%, includes 30-year warranty
4

14
SolarCity 1.0 – Asset-light, Rapid Business Expansion
ASSET-LIGHT BUSINESS MODEL Panel Installer founded in 2006
Panels manufactured by other major solar manufacturing companies
Unprecedented leasing option with no upfront cost
Very successful and innovative; flexible cost case
CO-FOUNDERS: TWO BROTHERS AND A COUSIN
Lyndon Rive
CEO
Phenomenal corporate leadership
From 2 to 6,000 employees
Peter Rive
CTO
Climate change concerns
Very technologically capable
Elon Musk
Chairman of SolarCity
Vision: sustainable energy and interplanetary exploration

15
SolarCity 2.0 – Acquisition-Driven Cost Minimization
Complete Vertical Integration
SolarCity Finance Co,
LLC10/09/2013
$158 mn in stock
Leading provider of PV mounting systems in US
6/17/2014
$200 mn in stock & cash
Catalyst #1
8/13/2013
$120 mn in stock & cash
Industry-leading marketing and sales organization
Simplified solar array installations
Will acquire anything that lowers Cost per Watt

16
Catalyst 1: SolarCity Acquires Silevo

17
Introducing the TRIEX Tunneling Junction Cell
HIGH EFFICIENCY, LOW COST

Relationship with state of NY enables Giga-factory
Originally initiated by Silevo
1-gigawatt factory within next 2 yrs
Aimed at meeting soaring demand
18
Why Acquire Silevo?
High EfficiencyLow manufacturing cost
Copper electrode metallization
Simple 6 core production steps
Crystalline-amorphous hybrid nature
Low temperature coefficient
77 F = 25 C
26.4% when leveraging cells’ bifacial nature
Experienced Management to Join SolarCity
Brings decades of solar engineering experience
CEO Zheng Xu, CTO Jianming Fu, VP Product Engineering Ben Heng, and EVP Christopher Beitel
Higher Efficiency at High Temperature
Proven Scalability

19
Technology Profile
SOLAR MODULES MOUNTING HARDWARE
SOFTWARE GRID CONTROL SYSTEMS
Photovoltaic cells that convert sunlight into direct current electricity
Unique TRIEX tunneling junction cell design results in high efficiency (24%) and low cost
Faster installation
Lower cycle time
Superior aesthetics
ZepSolar
System design automation
Energy production forecasting
Utility rate tariff database
Energy usage evaluations
Logistics and resource management
Customer account management
Real time energy monitoring
Fleet control of solar systems to manage voltage, power quality, and remote diagnostics
Peak load and solar intermittency management

20
Market Penetration Still Low
One million customer target by mid-2018 implies 70% compounded annual growth from end of 2013
Historical compounded annual growth in cumulative customers of 102% since 2009
Range of Potential Customers 250,000 500,000 1,000,000
/Total Single Family Housing Units in 15 Markets 40,521,461 40,521,461 40,521,461
=Implied Single-Family Market Penetration 0.6% 1.2% 2.5%
Potential Cumulative Residential MW Deployed 1500 MW 3000 MW 6000 MW
Approximately 200,000 new single-family homes built per year in 15 markets over last 5 years
Outpacing annual new solar installations
Market penetration poised to remain low and provide further opportunity

21
Contracted Customer Payments Remaining at $3.3B and Growing
Estimated nominal contract payments remaining of $3.3 billion offer 20 years of revenue visibility
Cumulative customers: 141,034
Cumulative energy contracts booked: 128,933
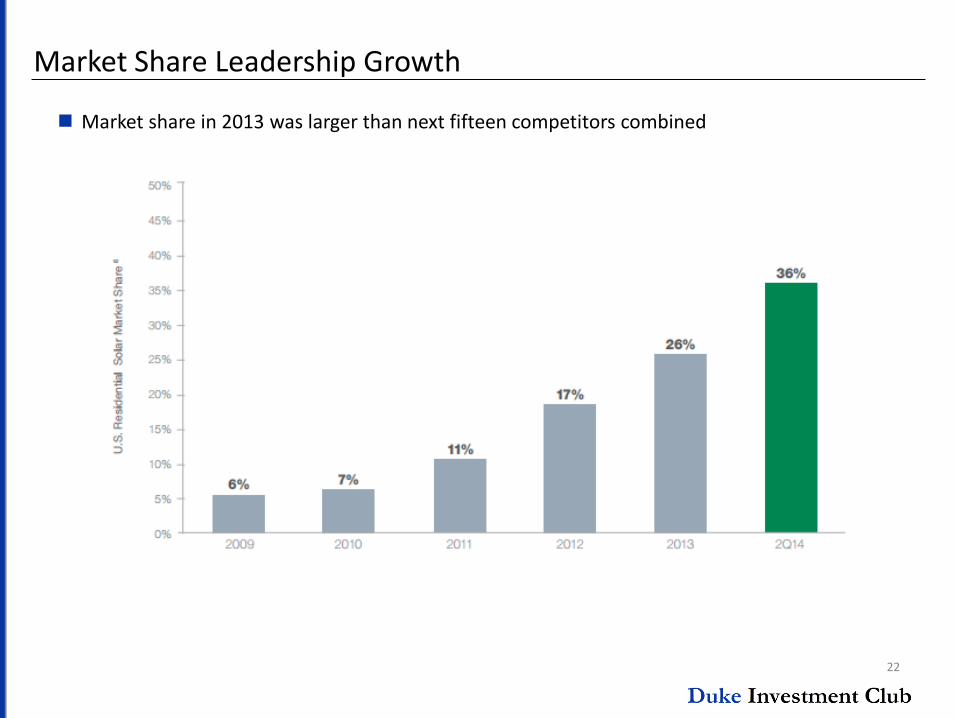
22
Market Share Leadership Growth
Market share in 2013 was larger than next fifteen competitors combined

23
Revenue Stream
High margin revenue stream from long term contracts
Each customer provides visible cash flow stream, similar to household utility bill payment
HIGH QUALITY ENERGY PAYMENTS
Consistent, predictable annuity cash flow stream
Long-term contracts of at least 20 years
High FICO scores (average is over 750)
PREDICTABLE RATE OF RETURN
System production and degredationconsistently outpacing forecasts
Low ongoing maintenance and capital costs
Higher utility rates increase customer contract value and bolster renewals
CUMULATIVE NET LOSS RATE

Risks and Mitigations
New Gigafactory in Buffalo, NY to meet soaring demand
Will there be soaring demand for solar panels?
Uncertainty about MyPower popularity
Income Tax Credit down to 10% from 30% in 2017
MYPOWER AND MANUFACTURING
FINANCIALSVALUATION RISK
COST DEVELOPMENT
Negative EBITDA
Waiting for crossing of the cost curve
Although technology advances, production costs remain significantly higher than China’s
Cost competitiveness relies on economies of scale
CEO’s Valuation method
Uses “retained value” method
Aggressive assumptions
E.g. default risk almost 0
CEO just sold 100,000 SCTY shares
Our main concern
-300
-250
-200
-150
-100
-50
0
2009 2010 2011 2012 2013 2014M
illio
ns
8
Valuation
26
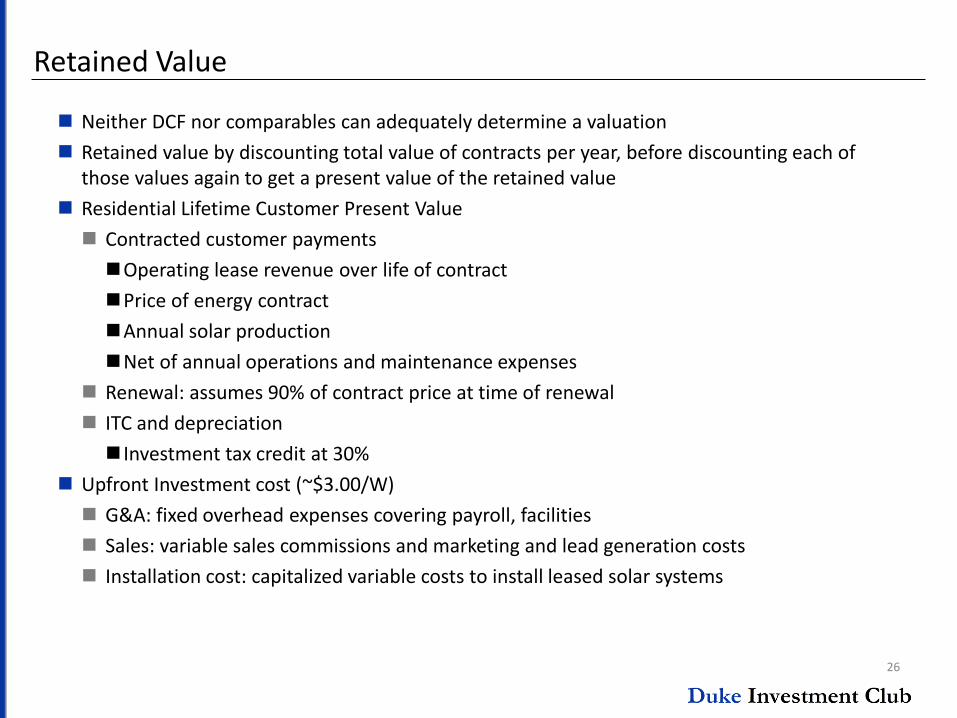
Retained Value
Neither DCF nor comparables can adequately determine a valuation
Retained value by discounting total value of contracts per year, before discounting each of those values again to get a present value of the retained value
Residential Lifetime Customer Present Value
Contracted customer payments
Operating lease revenue over life of contract
Price of energy contract
Annual solar production
Net of annual operations and maintenance expenses
Renewal: assumes 90% of contract price at time of renewal
ITC and depreciation
Investment tax credit at 30%
Upfront Investment cost (~$3.00/W)
G&A: fixed overhead expenses covering payroll, facilities
Sales: variable sales commissions and marketing and lead generation costs
Installation cost: capitalized variable costs to install leased solar systems

27
Retained ValueSolarcity - Retained Value Projection
Fiscal Year Ends December 31, 2014
2012A 2013A 2014E 2015E 2016E Assumptions
Lease/PPA Revenue Per Watt Per Year $0.35
New MW Deployed Under Lease 255 262 509 0 0 RV Discount Rate (Retained Value per Watt) 6.00%
Revenue per Watt $4.75 $4.75 $4.75 $4.75 $4.75 WACC 10.10%
Cost per Watt $3.87 $3.25 $3.00 $3.00 $3.00
Retained Value per Watt $0.88 $1.50 $1.75 $1.75 $1.75 WACC Calculation
Retained Value $224 $393 $891 $0 $0 Beta 1.63
Market Risk Premium 7.06%
Loan (MyPower) Risk-Free Rate 2.11%
New MW Deployed Under Loan 0 0 0 900 1200 Cost of Equity 10.49%
Revenue per Watt $4.75 $4.75 $4.75 $4.75 $4.75 Tax Rate 0.00%
Cost per Watt $3.00 $3.00 $3.00 $3.00 $3.00 After-Tax Cost of Debt 5.65%
Retained Value per Watt $0.00 $0.00 $0.00 $1.75 $1.75 WACC 10.10%
Retained Value $0 $0 $0 $1,575 $2,100
Sum of Parts Valuation
Sales DCF of Project CF $91.9
New MW Booked Under Contract 168 11 278 260 103
Retained Value per Watt $1.85 $1.80 $1.74 $1.71 $1.79 Retained Value at end of 2016 $5,677.4
Retained Value $311 $20 $484 $444 $184 Retained Value Discounted to PV $4,625
Total Retained Value $535 $413 $1,374 $2,019 $2,284 Terminal Value based on 2017 Value Creation $896.1
Discounted Retained Value $1,248 $1,666 $1,711 Terminal Multiple 3.0x
TV based on 2017 Value Creation $2,688
Net Cash $28.8
Total Market Value $7,434
Diluted Share Count 100.05
Price Per Share $74.31
WACC RV Discount Rate
$74.31 12.10% 11.10% 10.10% 9.10% 8.10% $74.31 7.00% 6.50% 6.00% 5.50% 5.00%
2.0x $63.64 $64.48 $65.35 $66.25 $67.17 2.0x $55.51 $60.23 $65.35 $70.93 $77.02
Terminal Multiple 2.5x $68.12 $68.96 $69.83 $70.72 $71.65 Terminal Multiple 2.5x $59.99 $64.70 $69.83 $75.41 $81.49
3.0x $72.60 $73.44 $74.31 $75.20 $76.13 3.0x $64.47 $69.18 $74.31 $79.89 $85.97
3.5x $77.07 $77.92 $78.78 $79.68 $80.60 3.5x $68.95 $73.66 $78.78 $84.36 $90.45
4.0x $81.55 $82.39 $83.26 $84.16 $85.08 4.0x $73.42 $78.14 $83.26 $88.84 $94.93

Appendix

29
Appendix I: Notes
Planning to create a Silicon Valley research facility and pilot plant
Chinese supply at Low $0.50 per watt
Our cost advantages compared to overseas come form installation labor, settings, wiring due to few panels to be installed
Panel CAPEX at $0.35 – 0.40 per watt
Buffalo NY area, Niagara Falls, hydropower – to lower production costs
Use partnerships to fund the CAPEX

Appendix II: Performance
1 YEAR
3 YEAR
0
15
30
45
60
75
90
105
0
15
30
45
60
75
90
105
10/17/13 12/17/13 2/17/14 4/17/14 6/17/14 8/17/14 10/17/14

31
Appendix III. Partnership with Tesla
Revenue from Super-Chargers Solar Panels
Home Energy Storage Battery Packs

![Price Performance 3YR (USD) - ValueWalk - Breaking News ...€¦ · loans [MyPower loans have no tax equity]), adjusted for debt, the Silevo earn ... SolarCity Corp. May 4, 2016 Axiomcapital.com](https://static.fdocuments.in/doc/165x107/5ae8993d7f8b9a3d3b903372/price-performance-3yr-usd-valuewalk-breaking-news-loans-mypower-loans.jpg)