SOLAR REPORT 2 Table of contents STATE OF SOLAR PV IN AUSTRALIA 3 BATTERY STORAGE UPDATES 6...
19
SOLAR REPORT MARCH 2016 Australian Energy Council DD MM YYYY © Australian Energy Council Level 14, 50 Market Street, Melbourne SOLAR REPORT JANUARY 2018 Australian Energy Council
Transcript of SOLAR REPORT 2 Table of contents STATE OF SOLAR PV IN AUSTRALIA 3 BATTERY STORAGE UPDATES 6...

SOLAR REPORT MARCH 2016
Australian Energy Council
DD MM YYYY
© Australian Energy Council
Level 14, 50 Market Street, Melbourne
VIC 3000
SOLAR REPORT JANUARY 2018 Australian Energy Council

2
2
Table of contents
STATE OF SOLAR PV IN AUSTRALIA ........................................................................ 3
BATTERY STORAGE UPDATES ................................................................................ 6
ESTIMATED RESIDENTIAL PV GENERATION ............................................................ 9
LEVELISED COST OF ENERGY .............................................................................. 11
PAYBACK PERIOD, DETAILED MODEL .................................................................. 14
METHODOLOGY APPENDIX ................................................................................... 16
1. Solar installations methodology .................................................................................................................... 16
2. Levelised Cost of Electricity Methodology .................................................................................................. 16
3. Payback period methodology ....................................................................................................................... 18

3
3
STATE OF SOLAR PV IN AUSTRALIA
Updated data from the Clean Energy Regulator (CER) on 30 January 2018, shows that 2017 was a
record-breaking year for solar in Australiai. Due to a 12-month reporting lag for solar systems, the
raw 31 December 2017 data under estimates the total number of installations and installed capacity1.
By the end of 2017, cumulative installed capacity for solar photovoltaic (PV) systems in Australia
stood at 6,401 MW with close to 1.8 million installations. This is up from 5,463 MW and 1.64 million
installations at the same time in the previous year - illustrating the continued strong growth in solar
installation. The amount of rooftop PV capacity installed during 2017 is estimated to have reached
over 1 GW, making 2017 a record year for Australian rooftop solar PV.
The raw 31 December 2017 data under estimates the total number of installations and installed
capacity. This under estimation occurs because solar PV owners have up to 12 months to report
their data to the CER, so we do not see the final reported capacity and number of installations for
the most recent months.
Figure 1: Monthly installations, installed solar PV capacity and average system size Jan
2012 – 2017
Source: Clean Energy Regulator (adjusted data), Australian Energy Council analysis, January 2018
Illustrated in figure 1, the two most recent months of November and December show an apparent sharp drop in installed capacity and total installations again likely to be due to the 12-month lag in
1 Solar PV system owners have up to 12 months to report their data to the Clean Energy Regulator, so the reported data
for the most recent months is likely to understate the number of actual installations, as well as the installed capacity.

4
4
data1, which does not reflect the actual capacity uptake in more recent months as of 31 December 2017.
We estimated November and December 2017 only accounts for around 75 and 43 per cent of actual installations and installed capacity respectively. The adjusted data will of course show a significant increase compared to the raw data.
Our adjusted data reveals that the total number of rooftop PV installations reached a record high, surpassing 17,000 installations in November 2017. The monthly number of installations has been consistent for the past year (excluding January) and the estimated monthly average unit size reached 6.87 kW. Households and small businesses have opted for bigger system sizes, with one factor being the rapid fall in solar PV costs2.
Figure 2: Total installed capacity (GW) since 2012 in Australia
Source: Clean Energy Regulator data, Australian Energy Council analysis, January 2018
Australia added more solar power in 2017 alone (937.8 MW of solar capacity) than the capacity of
South Australia’s decommissioned Northern and Playford power stations (784 MW), which closed in
2016. Due to reporting lag, the actual number of installed rooftop PV capacity is expected to be
higher, and we estimate it reached over 1 GW.
With the deployment of new battery storage technologies, the growth of rooftop PV is expected to
be driven more in future by the commercial and industrial sectors rather than residential installers,
who have been the main source of growth up to date.
2 March 2017 Solar Report, Australian Energy Council
1.04 GW
0.79 GW 0.80 GW
0.71 GW0.75 GW
0.94 GW
2012 2013 2014 2015 2016 2017 (unadjusteddata)

5
5
Figure 3: Proportion of yearly solar PV installed capacity across jurisdictions
Source: Clean Energy Regulator data, Australian Energy Council analysis, January 2018
Figure 3 shows that Western Australia has had a continuous increasing share of national rooftop PV
capacity. While Queensland’s yearly installed capacity remains the largest share across the nation,
although the state is no longer experiencing the same growth boom that was seen in 2012-13.
0.48% 1.36% 0.61% 0.81% 0.92% 1.00%
13.96%16.84% 21.49%
24.99% 22.28% 23.01%
40.40% 33.94%31.11% 27.31%
26.67% 28.50%
13.32% 17.85%10.31% 9.44%
10.39%9.80%
20.05%16.61%
21.46% 21.24%19.33% 17.23%
9.61% 8.78% 11.89% 13.63%17.13% 17.79%
0%
10%
20%
30%
40%
50%
60%
70%
80%
90%
100%
2012 2013 2014 2015 2016 2017 (unadjusteddata)
ACT NSW QLD SA VIC WA

6
6
BATTERY STORAGE UPDATES The concept of solar-powered rechargeable batteries has been increasingly mentioned in the media
and gained significant attention late last year when Tesla’s 100MW battery was installed in South
Australia.
According to the latest data, released by the Clean Energy Regulator on 30 January 2018, the
number of concurrent small-scale solar and battery installations of all brands reached 3,763
installations in 2017, a large jump from 1,566 installations in 2016.
Illustrated in figure 4, the strong end to 2017 was led by the charge of home batteries in New South
Wales, Victoria and Queensland. In the past two years, the total concurrent installations of these
states account for 80 per cent of solar PV with concurrent battery installations throughout Australia.
2017 saw New South Wales dominate with 42.6 per cent of installations, followed by Queensland
and Victoria with 18.2 and 15.9 per cent respectively. Despite having a high percentage growth, the
Northern Territory and Tasmania have the least amount of concurrent solar-battery installations a
factor of their smaller populations (table 1).
Figure 4: Australian distributed solar PV with concurrent battery installations
7
7
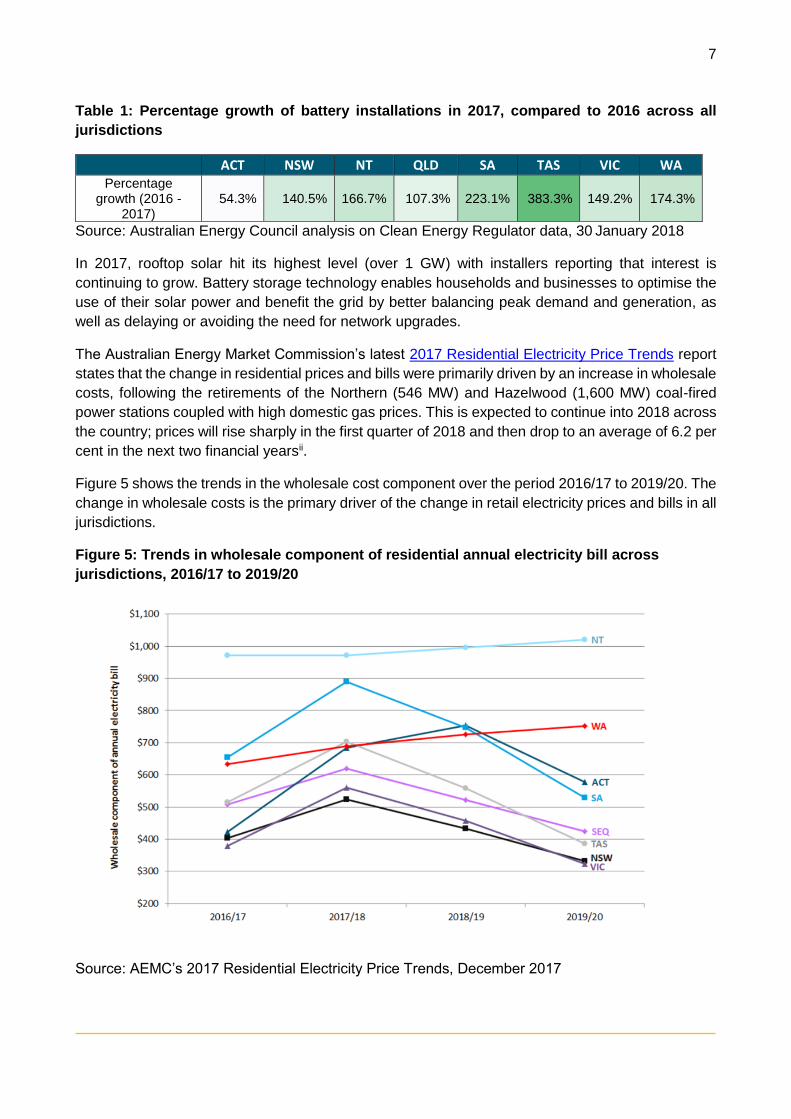
Table 1: Percentage growth of battery installations in 2017, compared to 2016 across all
jurisdictions
ACT NSW NT QLD SA TAS VIC WA Percentage
growth (2016 -2017)
54.3% 140.5% 166.7% 107.3% 223.1% 383.3% 149.2% 174.3%
Source: Australian Energy Council analysis on Clean Energy Regulator data, 30 January 2018
In 2017, rooftop solar hit its highest level (over 1 GW) with installers reporting that interest is
continuing to grow. Battery storage technology enables households and businesses to optimise the
use of their solar power and benefit the grid by better balancing peak demand and generation, as
well as delaying or avoiding the need for network upgrades.
The Australian Energy Market Commission’s latest 2017 Residential Electricity Price Trends report
states that the change in residential prices and bills were primarily driven by an increase in wholesale
costs, following the retirements of the Northern (546 MW) and Hazelwood (1,600 MW) coal-fired
power stations coupled with high domestic gas prices. This is expected to continue into 2018 across
the country; prices will rise sharply in the first quarter of 2018 and then drop to an average of 6.2 per
cent in the next two financial yearsii.
Figure 5 shows the trends in the wholesale cost component over the period 2016/17 to 2019/20. The
change in wholesale costs is the primary driver of the change in retail electricity prices and bills in all
jurisdictions.
Figure 5: Trends in wholesale component of residential annual electricity bill across
jurisdictions, 2016/17 to 2019/20
Source: AEMC’s 2017 Residential Electricity Price Trends, December 2017

8
8
The Australian Competition and Consumer Commission’s Gas Inquiry 2017-2020 Interim Report,
shows that the supply-demand outlook for the east coast gas market remains tight. During the last
quarter of 2017, the Federal Government intervened in the gas market to increase supply; including
restricting the amount of gas for export. Australia Pacific LNG Pty Ltd diverted gas to the domestic
market during planned outages. QGC Pty Ltd had effectively diverted gas originally intended for LNG
export to the domestic market. Gladstone LNG and Santos had entered into an agreement with
ENGIE to supply the local east coast market over 2018 and 2019, using gas that would otherwise
have been exported as LNG.
As electricity prices continue to rise, battery storage provides a solution for cheaper energy. This was seen recently, when the South Australian Government announced that at least 50,000 home solar panels and batteries will be rolled out over the next four and a half years to build the world’s largest “virtual power plant” in the state.

9
9
ESTIMATED RESIDENTIAL PV GENERATION
Figure 6 illustrates the seasonal patterns of the estimated total output of solar systems, nationally.
PV generation is low during May to July, while it unsurprisingly reaches a peak during summer each
year. December is consistently the highest month for PV electricity generation. The PV output is
obtained by multiplying the efficiency factor of systems with the estimated capacity (MW) in each
state (as described in Section 2 of this report).
The efficiency factor is calculated from PVoutput where self-selecting solar systems enter data into
a database. Due to self-selection, the estimate may have an upward bias as self-selecting clients
are more likely to maintain solar systems and therefore have a higher efficiency factor. Sample sizes
for the Northern Territory and Tasmania are very small. The Clean Energy Regulator data may not
accurately capture the rooftop PV generating capacity due to systems that have failed, and are no
longer generating, or systems that have been upgraded but have not been notified to the Clean
Energy Regulator. All systems which are reported to the Clean Energy Regulator are assumed to be
residential.
Figure 6: Estimated residential PV generation (GWh)
Source: Australian Energy Council analysis, January 2018
0
200
400
600
800
1,000
1,200
Jul-
12
Sep
-12
No
v-1
2Ja
n-1
3M
ar-1
3M
ay-1
3Ju
l-1
3Se
p-1
3N
ov-
13
Jan
-14
Mar
-14
May
-14
Jul-
14
Sep
-14
No
v-1
4Ja
n-1
5M
ar-1
5M
ay-1
5Ju
l-1
5Se
p-1
5N
ov-
15
Jan
-16
Mar
-16
May
-16
Jul-
16
Sep
-16
No
v-1
6Ja
n-1
7M
ar-1
7M
ay-1
7Ju
l-1
7Se
p-1
7N
ov-
17
GW
h
NT
TAS
WA
VIC
SA
QLD
NSW & ACT
10
10
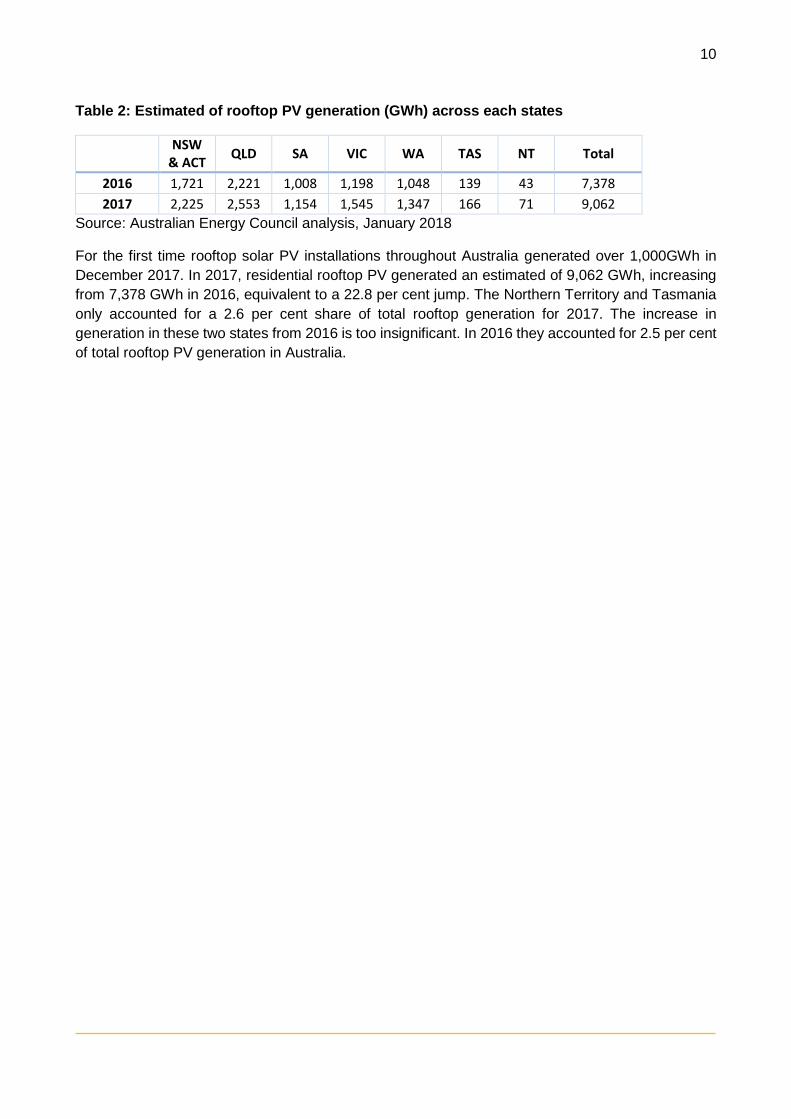
Table 2: Estimated of rooftop PV generation (GWh) across each states
NSW
& ACT QLD SA VIC WA TAS NT Total
2016 1,721 2,221 1,008 1,198 1,048 139 43 7,378
2017 2,225 2,553 1,154 1,545 1,347 166 71 9,062
Source: Australian Energy Council analysis, January 2018
For the first time rooftop solar PV installations throughout Australia generated over 1,000GWh in
December 2017. In 2017, residential rooftop PV generated an estimated of 9,062 GWh, increasing
from 7,378 GWh in 2016, equivalent to a 22.8 per cent jump. The Northern Territory and Tasmania
only accounted for a 2.6 per cent share of total rooftop generation for 2017. The increase in
generation in these two states from 2016 is too insignificant. In 2016 they accounted for 2.5 per cent
of total rooftop PV generation in Australia.

11
11
LEVELISED COST OF ENERGY The Levelised Cost of Energy (LCOE) is the cost of energy per kWh produced. When this is equal
to or below the cost consumers pay directly to suppliers for electricity, this is called grid parity. Table
3 shows the LCOE for solar in Australia’s major cities, indicative retail prices and current feed-in tariff
(FiT) rates. The detailed methodology can be found in the Appendix.
The retail comparison rates are representative variable rates and do not include supply charges. For
all capital cities, excluding Perth and Hobart, retail prices are based on the implied usage charges
from St Vincent de Paul’s tracking of market offers, which was last updated in July 2017. Perth prices
are regulated and obtained from Synergy. Hobart prices were obtained from Aurora Energy’s Tariff
31, while Darwin prices are obtained from Jacana Energy’s regulated residential usage charges.
Tables 4, 5 and 6 show the LCOE across major cities at different discount rates.
Many electricity retailers raised their solar FiT, which allows customers to shop around and choose
the best price. In many states, householders will benefit from a steep increase in solar FiT from
around 9c/kWh to a minimum of 12.8c/kWh for their exports fed back to the grid.
Table 3: Central estimate: 6.53 per cent discount rate (ten-year average mortgage rate)
System Size Retail prices
FIT
All figures in c/KWh 2.0 kW 3.0 kW 4.0 kW 5.0 kW 7.0 kW 10.0 kW
Adelaide $0.15 $0.13 $0.12 $0.11 $0.12 $0.12 $0.48 $0.17
Brisbane $0.15 $0.13 $0.12 $0.11 $0.11 $0.12 $0.33 $0.12
Canberra $0.14 $0.13 $0.12 $0.11 $0.12 $0.12 $0.22 $0.13
Darwin* $0.24 $0.20 $0.18 - $0.16 $0.13 $0.26 $0.26
Hobart $0.21 $0.18 $0.17 $0.16 $0.16 $0.16 $0.25 $0.09
Melbourne $0.20 $0.16 $0.15 $0.15 $0.16 $0.15 $0.26 $0.12
Sydney $0.15 $0.13 $0.12 $0.12 $0.12 $0.13 $0.31 $0.13
Perth $0.13 $0.11 $0.10 $0.10 $0.11 $0.11 $0.26 $0.07
Source: Australian Energy Council analysis, January 2018
* In Darwin, there is no 5kW pricing as installers prefer to list pricing for 4.5kW systems and as
there are additional hurdles for connecting solar systems above that size to the grid.

12
12
Table 4: Low cost of capital sensitivity: 5.30 per cent discount rate (low current standard
variable rate)
System Size Retail prices
FIT
All figures in c/KWh 2.0 kW 3.0 kW 4.0 kW 5.0 kW 7.0 kW 10.0 kW
Adelaide $0.14 $0.12 $0.11 $0.11 $0.11 $0.12 $0.48 $0.17
Brisbane $0.15 $0.12 $0.12 $0.11 $0.11 $0.12 $0.33 $0.12
Canberra $0.13 $0.12 $0.11 $0.11 $0.11 $0.12 $0.22 $0.13
Darwin $0.22 $0.19 $0.17 - $0.15 $0.12 $0.26 $0.26
Hobart $0.20 $0.17 $0.16 $0.15 $0.15 $0.15 $0.25 $0.09
Melbourne $0.18 $0.16 $0.15 $0.14 $0.15 $0.14 $0.26 $0.12
Sydney $0.14 $0.13 $0.12 $0.11 $0.12 $0.12 $0.31 $0.13
Perth $0.12 $0.11 $0.10 $0.09 $0.10 $0.11 $0.26 $0.07
Source: Australian Energy Council analysis, January 2018
Table 5: High cost of capital sensitivity: 13.07 per cent discount rate (indicative personal
loan rate)
System Size Retail prices
FIT
All figures in c/KWh 2.0 kW 3.0 kW 4.0 kW 5.0 kW 7.0 kW 10.0 kW
Adelaide $0.20 $0.17 $0.16 $0.15 $0.15 $0.16 $0.48 $0.17
Brisbane $0.21 $0.17 $0.16 $0.15 $0.15 $0.16 $0.33 $0.12
Canberra $0.18 $0.17 $0.15 $0.14 $0.16 $0.16 $0.22 $0.13
Darwin $0.34 $0.28 $0.25 - $0.22 $0.17 $0.26 $0.26
Hobart $0.29 $0.24 $0.22 $0.21 $0.21 $0.22 $0.25 $0.09
Melbourne $0.27 $0.22 $0.20 $0.19 $0.21 $0.20 $0.26 $0.12
Sydney $0.20 $0.18 $0.16 $0.15 $0.16 $0.17 $0.31 $0.13
Perth $0.17 $0.15 $0.13 $0.13 $0.14 $0.15 $0.26 $0.07
Source: Australian Energy Council analysis, January 2018
Small and Large business - Levelised Cost of Electricity
Tables 6 and 7 show the estimated cost of electricity production for commercial-sized solar systems.
As businesses look to reduce overhead costs, installation of large-scale solar panels continue to
increase.
Business tariffs differ to residential retail tariffs. Depending on the size of the customer and the
amount of energy used, businesses have the ability to negotiate lower prices. If a business was to
consume all electricity onsite, the electricity prices in Tables 6 and 7 would represent the cost per
kWh of consumption from the energy generated from the different system sizes listed. For

13
13
businesses, installation occurs if the benefits of installation outweigh the cost. The average electricity
bill for industrial businesses in 2014-15 was 10.72 c/kWhiii.
The Clean Energy Regulator sets out guidelines for the redemption of small-scale certificates. There
are two criteria which can exclude a system from receiving STCs: systems cannot exceed 100 kW
in capacity or generate more than 250 MWh per yeariv.
Table 6: Central estimate: 7.30 per cent discount rate, ten-year average small business
interest rate
System Size
All figures in c/KWh 10kW 30kW 50kW 70kW 100kW
Adelaide $0.13 $0.12 $0.12 $0.12 $0.12
Brisbane $0.13 $0.13 $0.12 $0.12 $0.12
Canberra $0.13 $0.12 $0.11 $0.11 $0.11
Hobart $0.19 $0.17 $0.16 $0.16 $0.16
Melbourne $0.16 $0.15 $0.15 $0.14 $0.14
Sydney $0.14 $0.13 $0.13 $0.13 $0.12
Perth $0.12 $0.11 $0.12 $0.12 $0.11
Source: Australian Energy Council analysis, January 2018
Table 7: Central estimate: 5.26 per cent discount rate, ten-year average large business
interest rate
System Size
All figures in c/KWh 10kW 30kW 50kW 70kW 100kW
Adelaide $0.12 $0.11 $0.11 $0.11 $0.11
Brisbane $0.12 $0.12 $0.11 $0.11 $0.11
Canberra $0.12 $0.11 $0.10 $0.10 $0.10
Hobart $0.17 $0.15 $0.15 $0.15 $0.14
Melbourne $0.14 $0.14 $0.13 $0.13 $0.13
Sydney $0.13 $0.12 $0.12 $0.12 $0.11
Perth $0.11 $0.10 $0.11 $0.11 $0.10
Source: Australian Energy Council analysis, January 2018

14
14
PAYBACK PERIOD, DETAILED MODEL
Using a similar methodology to that used to calculate the LCOE of solar PV in Australia (see Section
4), the Australian Energy Council has calculated the payback period for residential solar PV systems.
The payback period is defined as the year when the cumulative savings are greater than the
cumulative costs of a solar PV system. Savings represent the avoided cost of consumption and any
revenue received from FiTs. The cumulative cost incurred represents the initial investment and the
time value of money. A detailed methodology is contained in Appendix 2.
Figure 7 highlights the payback period for different system sizes across Australia. Note that electricity
prices are increased at CPI levels (currently 1.9 per cent, last updated December 2017) and any
changes to CPI will affect the payback period.
Figure 7: Payback period for solar PV (5.30 per cent discount rate)
* In Darwin, there is no 5kW pricing as Darwin installers prefer to list pricing for 4.5kW systems instead and as there are
additional hurdles for connecting solar systems above that size to the grid.
Source: Australian Energy Council analysis, 2017
Many retailers offer higher solar FiTs, which help to offset the impact of higher prices in some states
and deliver savings to customers with solar panels, for example, in Darwin, the offered FiT is 25.7
c/kWh, which significantly helps lower the payback periods by at least five years if compared to a
FiT of 12.8 c/kWh. Perth, once the leading state with the lowest payback years, has been surpassed
by Adelaide. Adelaide is currently having the constant lowest payback period of three years for 3kW,
4kW and 5kW systems.
Figure 8 shows the expected payback period for systems with a 6.53 per cent discount rate (10-year
average home loan rate).
Ad
elai
de
Ad
elai
de
Ad
elai
de
Ad
elai
deB
risb
ane
Bri
sban
e
Bri
sban
e
Bri
sban
e
Can
ber
ra
Can
ber
ra
Can
ber
ra
Can
ber
ra
Dar
win
Dar
win
Dar
win
Dar
win
*
Ho
bar
t
Ho
bar
t
Ho
bar
t
Ho
bar
t
Mel
bo
urn
e
Mel
bo
urn
e
Mel
bo
urn
e
Mel
bo
urn
e
Syd
ney
Syd
ney
Syd
ney
Syd
neyPer
th
Per
th
Per
th
Per
th0
5
10
15
20
2 kW 3 kW 4 kW 5 kW
Pay
bac
k p
eri
od
(ye
ars)
15
15
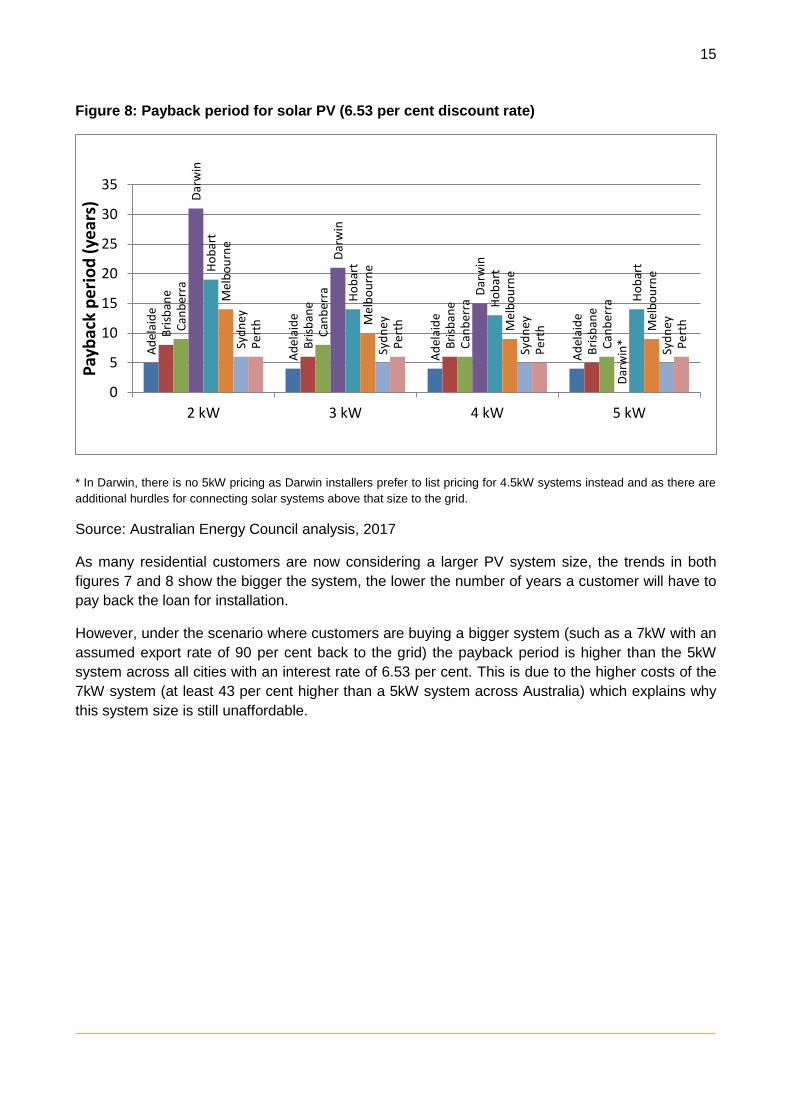
Figure 8: Payback period for solar PV (6.53 per cent discount rate)
* In Darwin, there is no 5kW pricing as Darwin installers prefer to list pricing for 4.5kW systems instead and as there are
additional hurdles for connecting solar systems above that size to the grid.
Source: Australian Energy Council analysis, 2017
As many residential customers are now considering a larger PV system size, the trends in both
figures 7 and 8 show the bigger the system, the lower the number of years a customer will have to
pay back the loan for installation.
However, under the scenario where customers are buying a bigger system (such as a 7kW with an
assumed export rate of 90 per cent back to the grid) the payback period is higher than the 5kW
system across all cities with an interest rate of 6.53 per cent. This is due to the higher costs of the
7kW system (at least 43 per cent higher than a 5kW system across Australia) which explains why
this system size is still unaffordable.
Ad
elai
de
Ad
elai
de
Ad
elai
de
Ad
elai
de
Bri
sban
e
Bri
sban
e
Bri
sban
e
Bri
sban
e
Can
ber
ra
Can
ber
ra
Can
ber
ra
Can
ber
ra
Dar
win
Dar
win
Dar
win
Dar
win
*
Ho
bar
t
Ho
bar
t
Ho
bar
t
Ho
bar
t
Mel
bo
urn
e
Mel
bo
urn
e
Mel
bo
urn
e
Mel
bo
urn
e
Syd
ney
Syd
ney
Syd
ney
Syd
ney
Per
th
Per
th
Per
th
Per
th
0
5
10
15
20
25
30
35
2 kW 3 kW 4 kW 5 kW
Pay
bac
k p
eri
od
(ye
ars)

16
16
METHODOLOGY APPENDIX
1. Solar installations methodology
Analysis from the Clean Energy Regulator’s (CER) monthly released data allows us to estimate the
amount of solar PV installed in Australia. Since November 2015, the CER has consistently
released data dated as at the first t of each month. The new consistent release date allows us to
provide a more accurate estimate of the capacity of recent installations. Due to the lag in reporting
of new installations, however, the CER data takes up to 12 months to be finalised.
2. Levelised Cost of Electricity Methodology
Introduction
The methodology outlines our approach in calculating the Levelised Cost of Electricity (LCOE) for
solar panels installed across capital cities in Australia. Our analysis includes the following:
Initial investment
Annual costs
Discount rate
Efficiency
System degradation rate
Initial investment
The initial investment plays a major role in the LCOE calculations. The initial investment represents
the cost of buying and installing solar panels all values are inclusive of Federal small-scale
technology certificate (STC) discounts.
The initial investments in this report are obtained from the Solar Choice website. Solar Choice takes
prices from over 125 installers across Australia and updates pricing data monthly.
Annual costs
We have estimated the annual cost to clean a solar panel at $12.50v, and the average sized solar
panel in our calculations to be 200W.
Discount rate
The discount rate represents the risk nature of the consumer. For this exercise, three different
discount rates have been used and will be updated each quarter. The central estimate is based on
the 10-year average home loan, as presented by the Reserve Bank of Australia (6.53 per cent).
The low discount rate sensitivity is based on the minimum variable home loan mortgage rate offered
by the Big Four banks (currently 5.3 per cent).

17
17
The high discount rate sensitivity is based on personal loans offered by the Big Four banks as the
assumption has been made that a personal loan will include all costs including the initial start-up of
the loan (13.07 per cent).
Small business and large business discount rates are based on the 10-year average of the variable
weighted average rate on credit outstanding. The large business discount rate is 5.26 per cent and
the small business discount rate is 7.30 per cent.
The discount rate also takes into account the Consumer Price Index (CPI); this has been given a
constant value of 1.9 per cent.
Efficiency
The kWh/kWp represents the average daily production of solar panels. The number was obtained
from the Clean Energy Council’s consumer guide to installing household solar panelsvi. The
efficiency figure represents the average daily output for a 1 kW system.
System degradation rate
The system degradation rate is used to show the reduced output of a system from year to year.
Numbers vary from approximately 0.1 per cent to 1 per cent depending on the system. The Australian
Energy Council has used 0.5% as a constant degradation rate for all LCOE calculations.
Formula
Retail comparison rates
St Vincent de Paul tracks market offers on a bi-annual basis. New South Wales, Queensland, South
Australia and Victoria implied usage charge of electricity have been obtained from these reports.
A single rate tariff was analysed to calculate the implied usage charge in Victoria, South Australia,
New South Wales and the ACT. Tariff 11 in Queensland. Tasmania’s usage charge was obtained
for Aurora Energy tariff 31 and Synergy the sole retailer in Western Australia was used.

18
18
3. Payback period methodology
This methodology outlines our approach in calculating the payback period for solar panels installed
across capital cities in Australia. Our analysis includes the following:
Initial investment
Discount rate
Efficiency
System degradation rate
Export rate
Avoided usage cost
FiT
Initial investment, discount rate, efficiency and system degradation rate are described in appendix
1. Key difference to LCOE calculation is the payback period assumes no annual maintenance cost.
Calculation
Payback period occurs when ∑ savings > ∑ cost
Where:
Savings = (usage cost x (1+ CPI)t x consumption / 100) + (Export x FiT)
Cost = investment x (1 + real discount rate)t
t = years
Avoided cost and FiT
The onsite consumption is multiplied by the retailer’s usage charges, CPI has been applied to the
usage charge to allow for growth in retail prices. The excess energy is exported to the grid and the
customer is expected to receive the mandatory FiT or a realistic market offer where mandatory
tariffs are not applicable.
Export rate
The percentage of onsite consumption and electricity which is exported to the grid is calculated
using the median value from Sunwiz’s analysisvii. See Figure 6 below.

19
19
Figure 9: Export rate of residential solar PV at different system sizes
Source: Sunwiz analysis, 2015
i Postcode data for small-scale installations, Clean Energy Regulator, 30 January 2018 ii 2017 Residential Electricity Price Trends, Australian Energy Market Commission, December 2017. iii BCA, “Impact of Green Energy Policies on Electricity Prices”, June 2014 iv Clean Energy Regulator, “How to have STCs assigned to you as a Registered Agent”, http://ret.cleanenergyregulator.gov.au/For-Industry/Agents/Having-STCs-assigned-to-you/stcs-assigned-to-you v estimate based on, RenewEconomy, 26 August 2013, http://reneweconomy.com.au/2013/hidden-cost-of-rooftop-solar-who-should-pay-for-maintenance-99200 vi Clean Energy Council, http://www.solaraccreditation.com.au/dam/cec-solar-accreditation-shared/guides/Guide-to-installing-solar-PV-for-households.pdf vii Sunwiz, Solar Pays Its Way on Networks. Last accessed 17 June 2015.