
Solar Oven Report
24
i Executive Summary This project was created for the purpose of designing a solar oven with the intention of predicting its maximum temperature capability. The oven would have a total of three different configurations, each having its own maximum possible temperature. Configuration number one was a basic oven design that consisted of an outer compartment, an inner compartment, and a transparent film for the window. Configuration number two added the use of a second window that was placed over the standard window creating a dual pane design. Configuration number three consisted of the basic oven with an added reflector to magnify the power of the sun. All three configurations required a maximum temperature prediction for each o ne. In order to predict such temperatures, the oven first had to be fully constructed so that the final measurements would be available to use in the calculations. The primary materials of the ov en consisted of two cardboard boxes for the oven compartments, transparency film for the window, and aluminum foil for the reflector. These materials were crafted together along with a few other items and assembled into the final oven d esign. All of the necessary measurements were taken and documented for use in the calculation of the predicted temperatures. A spreadsheet was created in order to make all the calculations. Research had to be done to find the values for the solar energy incident, transmission and absorption coefficients, and the coefficient of reflection for the reflector design. Equations were modeled based on tables of values from other designs in order to determine the heat transfer coefficients that specifically applied to this design. Once the spreadsheet was complete, the only missing values in order to determine the temperature was the outdoor temperature that would be present during the actual test of the design. A sunny day was chosen to test the oven. The outside temperature was measured to be 29.2 degrees Celsius. A digital thermometer was inserted into the oven chamb er. The oven was p laced perpendicular to the sun’s rays (90 degrees). This angle of orientation would be the angle always used for the test as well as in a ll the calculations. The temperature was measured ever y three minutes for a total of eighteen minutes. The configuration was to be changed every six minutes. In other words, from zero to six minutes, the basic oven configuration was tested; from six to twelve minutes, the dual pane co nfiguration was tested; and from twelve to eighteen minutes, the reflector configuration was tested. These readings would not b e the final readings, but it was enough data to plot what the final readings would be. The measured outside temperature was plugged i nto the spreadsheet and the p redicted temperatures were determined. The predicted max imum temperature of the basic oven configuration is 98.73 C. The predicted maximum temperature of the dual pane configuration is 123 C. The predicted maximum temperature of the reflector configuration is 118.8 C. The measured temperatures of the actual test starting from zero minutes, measured every three minutes in degrees Celsius were: 29.2, 59.9, 68.8, 77.5, 79.8, 87.6, & 105. Based on these values, the actual maximum temperatures of each con figuration were able to be plotted in relation to each other and the max imum predictions using a logarithmic curve. All values matched the curve relatively close, therefore the predicted maximum is close to what would happen if the test was conducted over a longer amount of time.
-
Upload
jacobwhite -
Category
Documents
-
view
223 -
download
0
Transcript of Solar Oven Report
7/29/2019 Solar Oven Report
http://slidepdf.com/reader/full/solar-oven-report 1/23
i
Executive Summary
This project was created for the purpose of designing a solar oven with the intention of
predicting its maximum temperature capability. The oven would have a total of three different
configurations, each having its own maximum possible temperature. Configuration number one
was a basic oven design that consisted of an outer compartment, an inner compartment, and atransparent film for the window. Configuration number two added the use of a second window
that was placed over the standard window creating a dual pane design. Configuration number three consisted of the basic oven with an added reflector to magnify the power of the sun. All
three configurations required a maximum temperature prediction for each one.
In order to predict such temperatures, the oven first had to be fully constructed so that the final
measurements would be available to use in the calculations. The primary materials of the oven
consisted of two cardboard boxes for the oven compartments, transparency film for the window,
and aluminum foil for the reflector. These materials were crafted together along with a few other items and assembled into the final oven design. All of the necessary measurements were taken
and documented for use in the calculation of the predicted temperatures.
A spreadsheet was created in order to make all the calculations. Research had to be done to find
the values for the solar energy incident, transmission and absorption coefficients, and the
coefficient of reflection for the reflector design. Equations were modeled based on tables of
values from other designs in order to determine the heat transfer coefficients that specificallyapplied to this design. Once the spreadsheet was complete, the only missing values in order to
determine the temperature was the outdoor temperature that would be present during the actual
test of the design.
A sunny day was chosen to test the oven. The outside temperature was measured to be 29.2
degrees Celsius. A digital thermometer was inserted into the oven chamber. The oven was placed perpendicular to the sun’s rays (90 degrees). This angle of orientation would be the angle alwaysused for the test as well as in all the calculations. The temperature was measured every three
minutes for a total of eighteen minutes. The configuration was to be changed every six minutes.
In other words, from zero to six minutes, the basic oven configuration was tested; from six totwelve minutes, the dual pane configuration was tested; and from twelve to eighteen minutes, the
reflector configuration was tested. These readings would not be the final readings, but it was
enough data to plot what the final readings would be.
The measured outside temperature was plugged into the spreadsheet and the predicted
temperatures were determined. The predicted maximum temperature of the basic oven
configuration is 98.73 C. The predicted maximum temperature of the dual pane configuration is123 C. The predicted maximum temperature of the reflector configuration is 118.8 C. The
measured temperatures of the actual test starting from zero minutes, measured every three
minutes in degrees Celsius were: 29.2, 59.9, 68.8, 77.5, 79.8, 87.6, & 105. Based on these values,
the actual maximum temperatures of each configuration were able to be plotted in relation toeach other and the maximum predictions using a logarithmic curve. All values matched the curve
relatively close, therefore the predicted maximum is close to what would happen if the test was
conducted over a longer amount of time.
7/29/2019 Solar Oven Report
http://slidepdf.com/reader/full/solar-oven-report 2/23
ii
Table of Contents
Executive Summary ......................................................................................................................... i
Table of Contents ............................................................................................................................ ii
1 Introduction ............................................................................................................................. 1
1.1 Project Purpose & Goals ................................................................................................. 1Oven Design & Construction .......................................................................................................... 2
1.2 Construction & Design Plan ........................................................................................... 21.3 Materials and Tools......................................................................................................... 2
1.4 Step by Step Construction ............................................................................................... 2
1.4.1 Step 1 – Building the Basic Oven Configuration.................................................... 21.4.2 Step 2 – Building the Dual Pane Add-on ................................................................ 3
1.4.3 Step 3 – Building the Reflector ............................................................................... 3
1.4.4 Finishing Touches ................................................................................................... 4
2 Calculations of Predicted Temperatures ................................................................................. 42.1 Planning the Calculations – Spreadsheet Overview ....................................................... 4
2.2 Basic Oven Calculations ................................................................................................. 52.2.1 Power In .................................................................................................................. 52.2.2 Power Out ............................................................................................................... 5
2.3 Dual Pane Oven Calculations ......................................................................................... 8
2.3.1 Dual Pane Overview ............................................................................................... 8
2.3.2 Power In .................................................................................................................. 82.3.3 Power Out ............................................................................................................... 9
2.4 Reflector Oven Calculations ......................................................................................... 10
2.4.1 Reflector Overview ............................................................................................... 10
2.4.2 Optimal Angle ....................................................................................................... 102.4.3 Calculating the Gain ............................................................................................. 11
2.4.4 Power In ................................................................................................................ 112.4.5 Power Out ............................................................................................................. 12
2.5 Summary of Oven Calculations .................................................................................... 12
3 Testing the Oven ................................................................................................................... 13
3.1 Planning the Test........................................................................................................... 133.2 Oven Set-up & Outdoor Conditions ............................................................................. 13
3.3 Testing the Basic Oven ................................................................................................. 13
3.4 Using the Second Pane.................................................................................................. 143.5 Using the Reflector ....................................................................................................... 14
3.6 Summary of Test Results .............................................................................................. 14
4 Predictions Vs. Actual .......................................................................................................... 14
5 Conclusion ............................................................................................................................ 165.1 Recap of Goals and Construction ................................................................................. 16
5.2 Recap of Calculations ................................................................................................... 16
5.3 Recap of Test ................................................................................................................ 17
5.4 Summing it all Up ......................................................................................................... 176 Appendices ............................................................................................................................ 18
6.1 Appendix A – Basic Oven Spreadsheet ........................................................................ 18
6.2 Appendix B – Dual Pane Oven Spreadsheet................................................................. 19

7/29/2019 Solar Oven Report
http://slidepdf.com/reader/full/solar-oven-report 3/23
iii
6.3 Appendix C – Reflector Oven Spreadsheet .................................................................. 20
7/29/2019 Solar Oven Report
http://slidepdf.com/reader/full/solar-oven-report 4/23
1
1 Introduction
For this project a solar oven was required that would harness the energy of the sun to reach a
maximum temperature that must be predicted in advance. A team of five individuals was
assembled in order to accomplish this task. The team’s first responsibility would be to build theoven out of the provided materials. The oven would be constructed primarily of cardboard. Other materials include transparency film for the window, aluminum foil for the reflector, and wadded
newspaper for the insulation. Once the oven construction was completed, the dimensions could
be measured for use in the calculations to predict the maximum temperature.
A total of three different oven designs were required. A basic configuration consisting of a
simple oven with a one-layer window, a dual pane configuration that utilizes a second window
layer, and finally, a reflector configuration that uses aluminum foil to reflect additional power into the oven. Each of these configurations required that the temperature to be predicted in
advance. These predictions will have to be calculated using the applicable values, equations, and
coefficients related to solar energy and heat transfer combined with the project specific values of this particular oven. All of these vales will then be entered into a spreadsheet and evaluated to
determine the final predictions.
Following the temperature predictions, the actual oven will be taken out and physically tested.The maximum temperature that the oven is capable of reaching will be measured and compared
with the predicted temperatures. All of these values will be plotted to model an equation to
determine if the predicted temperature and actual temperature readings fit on the same curve.This will give the team a good idea on whether or not the calculations are close to what would
happen in real life.
A detailed run-though of the entire process will follow in subsequent sections. Below is asummary of the project purpose and goals.
1.1 Project Purpo se & Goals
Design a solar oven that is capable of effectively harnessing the power of the sun in threedifferent configurations:
o Basic Oven Configuration – consisting of the oven compartment and window.
o Dual Pane Configuration – with an added window layer.
o Reflector Configuration – with an added reflector.
Accurately predict the maximum temperature that each oven configuration is capable of reaching.
Model equations that fit both the predicted values and the actual values to confirm theaccuracy of the calculations.
7/29/2019 Solar Oven Report
http://slidepdf.com/reader/full/solar-oven-report 5/23
2
Oven Design & Construction
1.2 Cons truct io n & Design Plan
The first task of the project is to construct the oven. All of the necessary materials and tools were
provided to accomplish this. The main oven compartment was planned to consist of an outer boxand an inner box made from packing cardboard. The inner box would serve as the collector that
would radiate the heat from the sun. In between the two boxes would be empty space thatdemands some soft of insulation to prevent heat loss. A single glazing of Transparency film was
required for the window of the basic design. A second layer of transparency film would be
needed for the dual pane design, but had to be removable for easy transition between
configurations. Additionally, a reflector was required for the final configuration. The followingmaterials and tools were provided and used in the construction of the solar oven.
1.3 Materials and Tool s
Large packing box (outer box), 15x12x10 inches
Small half box (inner box), 9x6x4.5 inches Transparency film for glazing, 8.5x11
Newspaper for insulation
Black spray paint
Aluminum foil
Temperature sensor
Temperature meter
Cardboard
Stock paper
Knife
Scissors Small wood blocks
Epoxy
Tape
String
1.4 Step by Step Cons truc t ion
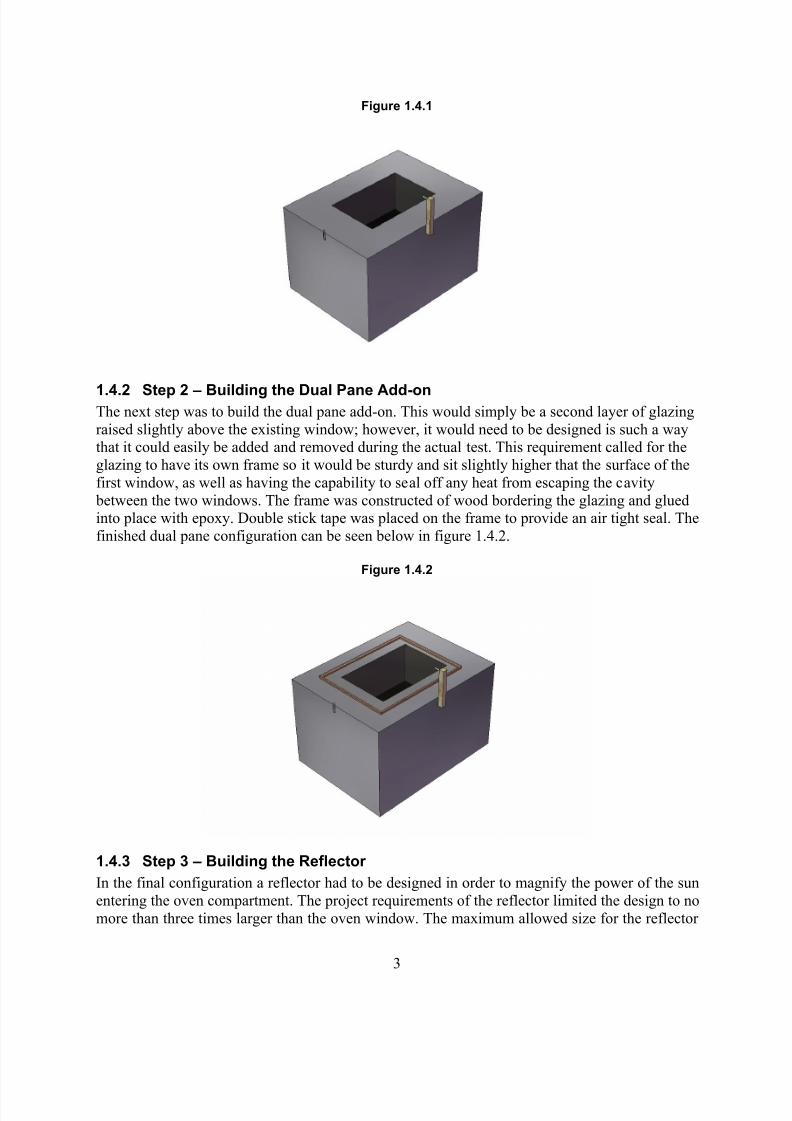
1.4.1 Step 1 – Building the Basic Oven Configuration
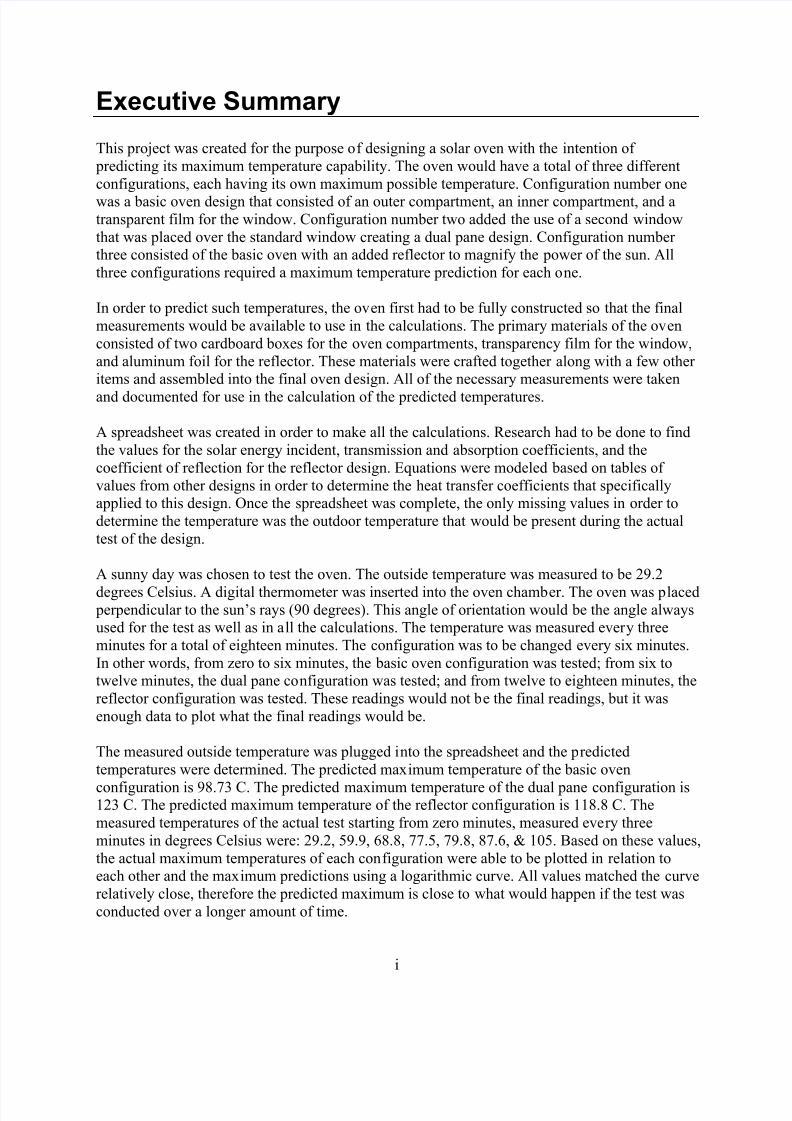
The large box and small box was assembled from basic cardboard flats. The shape of the smaller
box was traced on the larger box so a hole could be cut to form the opening of the oven. The
inside surface of the smaller box would be used as the solar collector. This surface was coatedwith black spray paint. Black was chosen because it absorbs the most light and produces themost heat. The collector was attached to the inside of the outer box and sealed with tape all
around to prevent air leaks. Next, the hole between the outer box and collector was covered with
one sheet of transparency film (or glazing) and sealed on all sides. The finishing touch included asun dial to interpret the angle of the sun in relation to the oven at any given time. The basic oven
was complete and can be seen below in figure 1.4.1.
7/29/2019 Solar Oven Report
http://slidepdf.com/reader/full/solar-oven-report 6/23
3
Figure 1.4.1
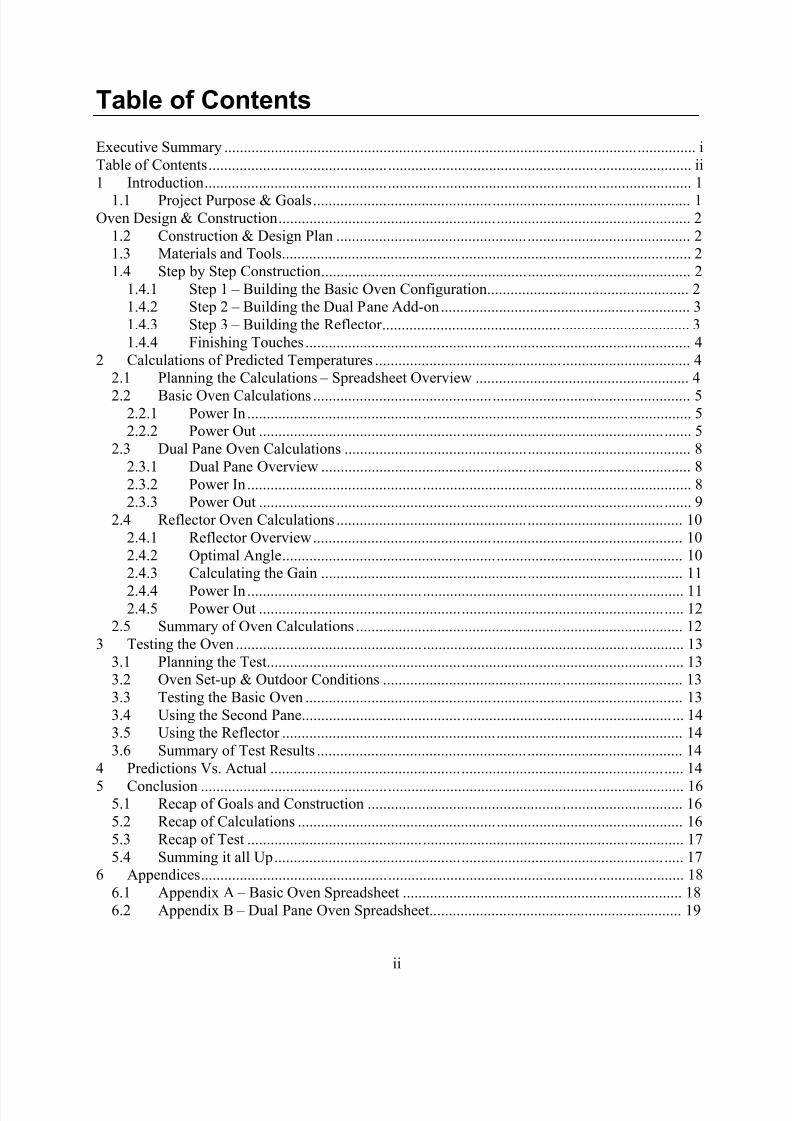
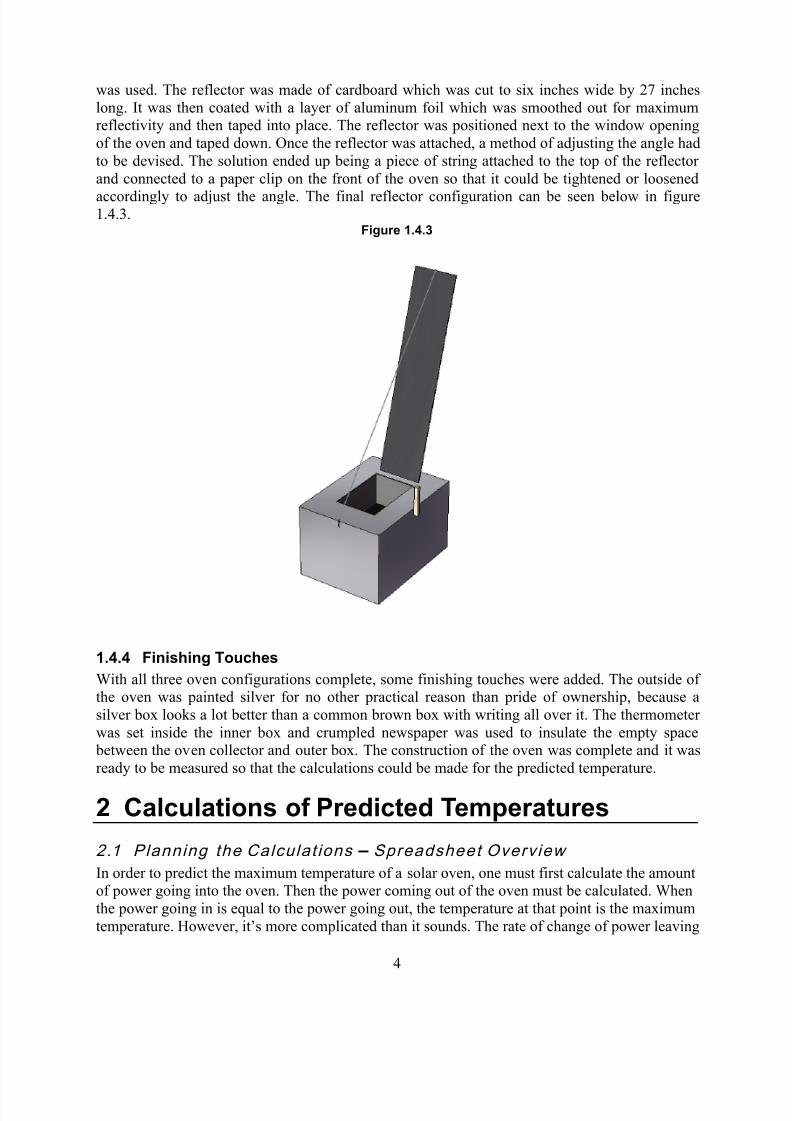
1.4.2 Step 2 –
Building the Dual Pane Add-onThe next step was to build the dual pane add-on. This would simply be a second layer of glazing
raised slightly above the existing window; however, it would need to be designed is such a waythat it could easily be added and removed during the actual test. This requirement called for the
glazing to have its own frame so it would be sturdy and sit slightly higher that the surface of the
first window, as well as having the capability to seal off any heat from escaping the cavity
between the two windows. The frame was constructed of wood bordering the glazing and gluedinto place with epoxy. Double stick tape was placed on the frame to provide an air tight seal. The
finished dual pane configuration can be seen below in figure 1.4.2.
Figure 1.4.2
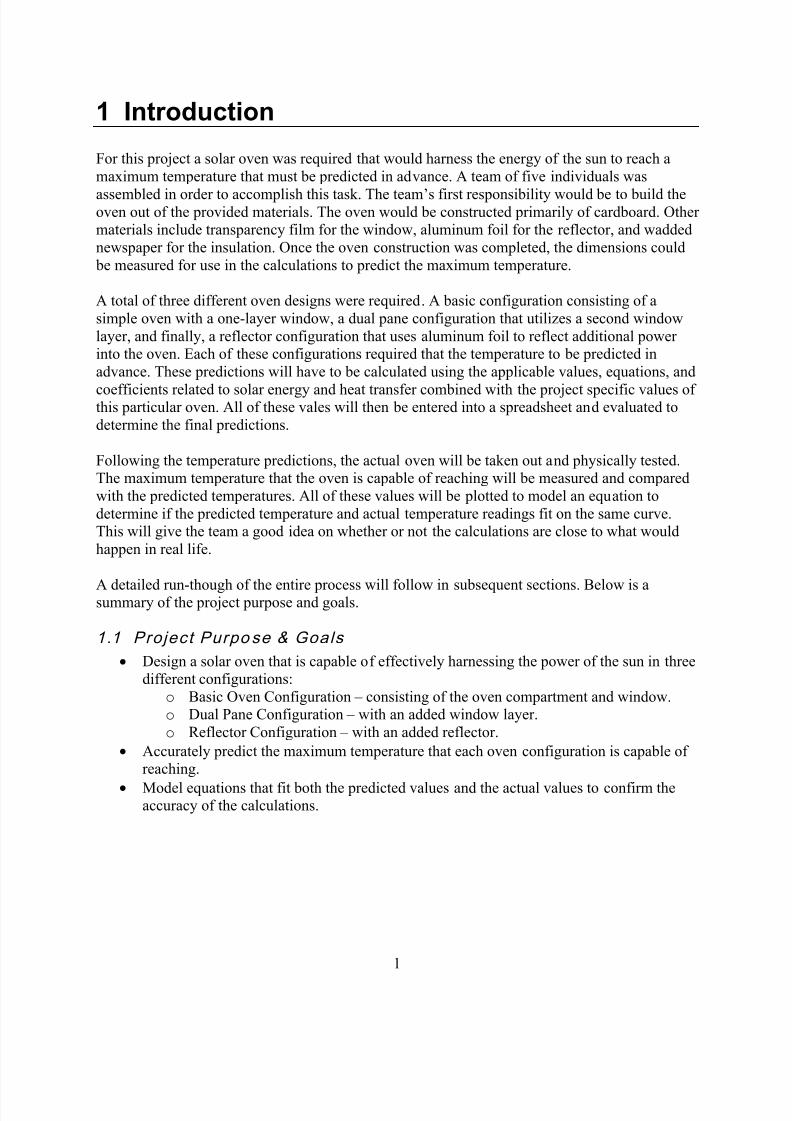
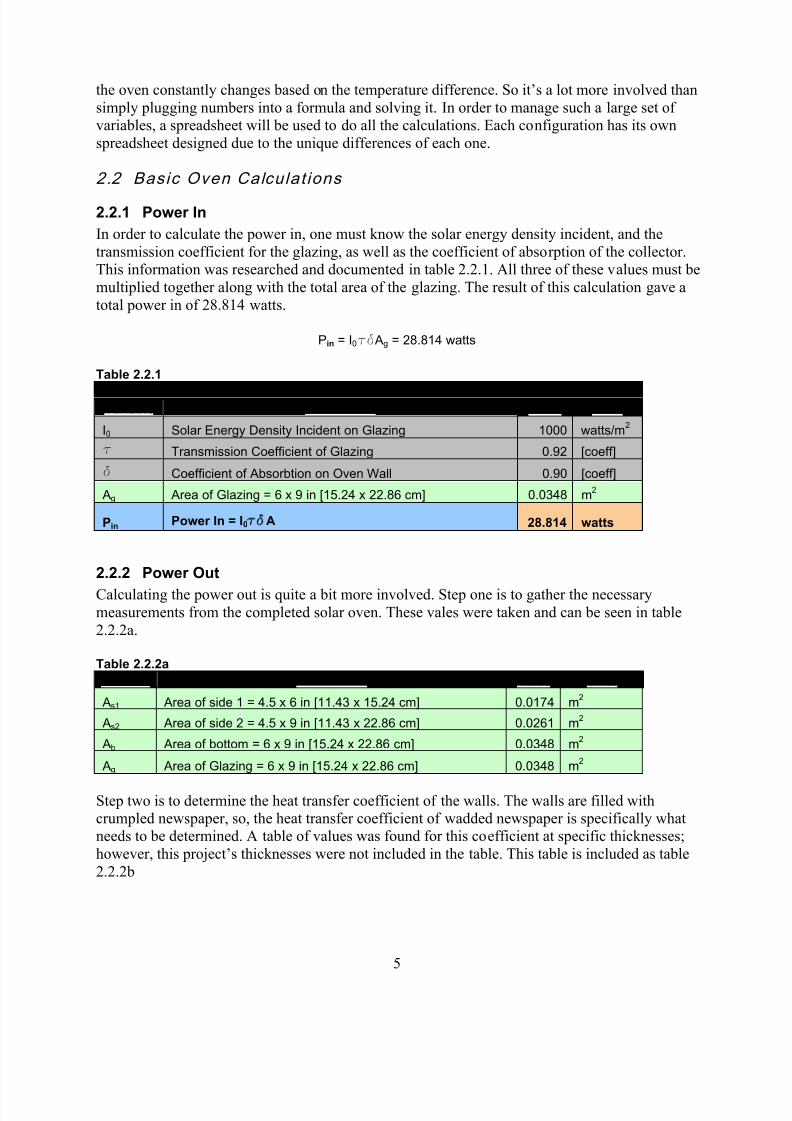
1.4.3 Step 3 – Building the Reflector
In the final configuration a reflector had to be designed in order to magnify the power of the sun
entering the oven compartment. The project requirements of the reflector limited the design to no
more than three times larger than the oven window. The maximum allowed size for the reflector
7/29/2019 Solar Oven Report
http://slidepdf.com/reader/full/solar-oven-report 7/23
4
was used. The reflector was made of cardboard which was cut to six inches wide by 27 inches
long. It was then coated with a layer of aluminum foil which was smoothed out for maximumreflectivity and then taped into place. The reflector was positioned next to the window opening
of the oven and taped down. Once the reflector was attached, a method of adjusting the angle had
to be devised. The solution ended up being a piece of string attached to the top of the reflector
and connected to a paper clip on the front of the oven so that it could be tightened or loosened
accordingly to adjust the angle. The final reflector configuration can be seen below in figure1.4.3.
Figure 1.4.3
1.4.4 Finishing Touches
With all three oven configurations complete, some finishing touches were added. The outside of the oven was painted silver for no other practical reason than pride of ownership, because a
silver box looks a lot better than a common brown box with writing all over it. The thermometer
was set inside the inner box and crumpled newspaper was used to insulate the empty space between the oven collector and outer box. The construction of the oven was complete and it was
ready to be measured so that the calculations could be made for the predicted temperature.
2 Calculations of Predicted Temperatures
2.1 Planning the Calculat ions – Spreadsheet Overview
In order to predict the maximum temperature of a solar oven, one must first calculate the amountof power going into the oven. Then the power coming out of the oven must be calculated. When
the power going in is equal to the power going out, the temperature at that point is the maximum
temperature. However, it’s more complicated than it sounds. The rate of change of power leaving
7/29/2019 Solar Oven Report
http://slidepdf.com/reader/full/solar-oven-report 8/23
5
the oven constantly changes based on the temperature difference. So it’s a lot more involved than
simply plugging numbers into a formula and solving it. In order to manage such a large set of variables, a spreadsheet will be used to do all the calculations. Each configuration has its own
spreadsheet designed due to the unique differences of each one.
2.2 Basic Oven Calculat ions
2.2.1 Power In
In order to calculate the power in, one must know the solar energy density incident, and the
transmission coefficient for the glazing, as well as the coefficient of absorption of the collector.This information was researched and documented in table 2.2.1. All three of these values must be
multiplied together along with the total area of the glazing. The result of this calculation gave a
total power in of 28.814 watts.
Pin = I0td Ag = 28.814 watts
Table 2.2.1
Power Invariable Description value units
I0 Solar Energy Density Incident on Glazing 1000 watts/m2
t Transmission Coefficient of Glazing 0.92 [coeff]
d Coefficient of Absorbtion on Oven Wall 0.90 [coeff]
Ag Area of Glazing = 6 x 9 in [15.24 x 22.86 cm] 0.0348 m2
Pin Power In = I0tdA 28.814 watts
2.2.2 Power Out
Calculating the power out is quite a bit more involved. Step one is to gather the necessarymeasurements from the completed solar oven. These vales were taken and can be seen in table
2.2.2a.
Table 2.2.2a
variable Description value units
As1 Area of side 1 = 4.5 x 6 in [11.43 x 15.24 cm] 0.0174 m2
As2 Area of side 2 = 4.5 x 9 in [11.43 x 22.86 cm] 0.0261 m2
Ab Area of bottom = 6 x 9 in [15.24 x 22.86 cm] 0.0348 m2
Ag Area of Glazing = 6 x 9 in [15.24 x 22.86 cm] 0.0348 m2
Step two is to determine the heat transfer coefficient of the walls. The walls are filled withcrumpled newspaper, so, the heat transfer coefficient of wadded newspaper is specifically whatneeds to be determined. A table of values was found for this coefficient at specific thicknesses;
however, this project’s thicknesses were not included in the table. This table is included as table
2.2.2b
7/29/2019 Solar Oven Report
http://slidepdf.com/reader/full/solar-oven-report 9/23
6
Table 2.2.2b
Heat Transfer Coefficient of Wadded Newspaper
Wall Thickness (cm) Usb (watts/deg. C m2)
2.5 2.72
5.1 1.76
7.6 1.38.9 1.13
10.2 1.02
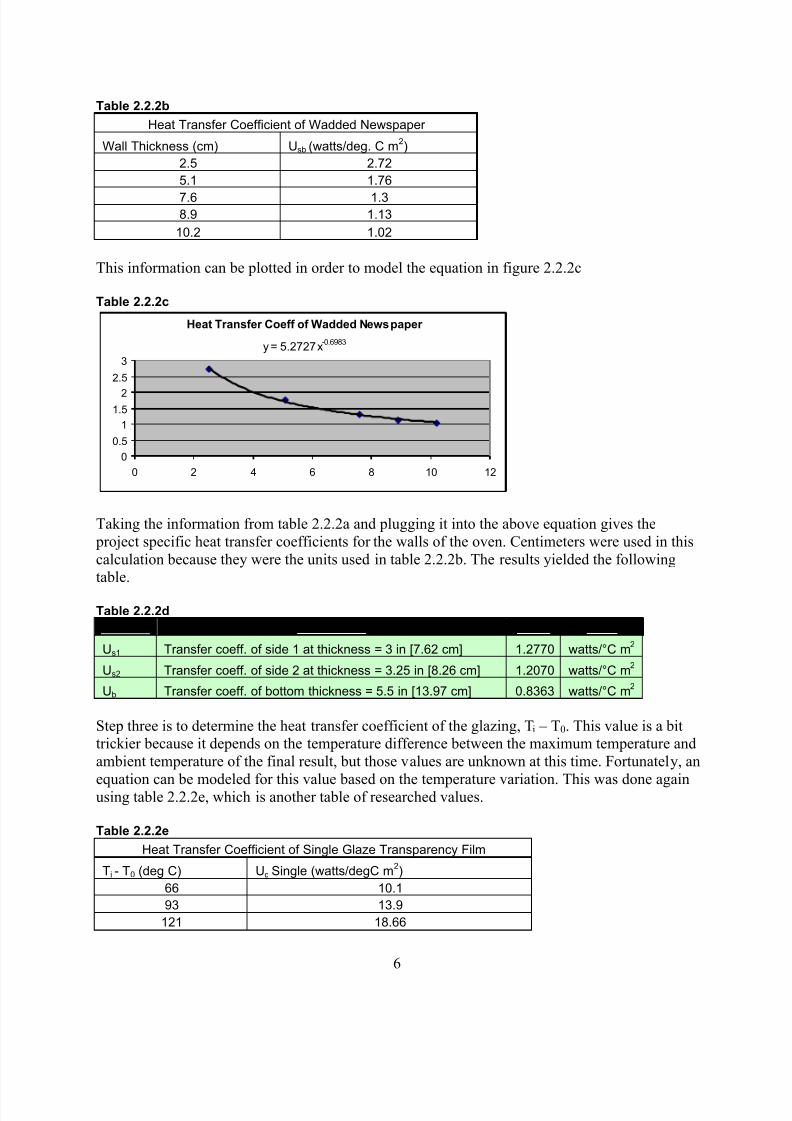
This information can be plotted in order to model the equation in figure 2.2.2c
Table 2.2.2c
Heat Transfer Coeff of Wadded Newspaper
y = 5.2727x-0.6983
0
0.5
1
1.52
2.5
3
0 2 4 6 8 10 12
Taking the information from table 2.2.2a and plugging it into the above equation gives the
project specific heat transfer coefficients for the walls of the oven. Centimeters were used in this
calculation because they were the units used in table 2.2.2b. The results yielded the followingtable.
Table 2.2.2d
variable description value units
Us1 Transfer coeff. of side 1 at thickness = 3 in [7.62 cm] 1.2770 watts/°C m2
Us2 Transfer coeff. of side 2 at thickness = 3.25 in [8.26 cm] 1.2070 watts/°C m2
Ub Transfer coeff. of bottom thickness = 5.5 in [13.97 cm] 0.8363 watts/°C m2
Step three is to determine the heat transfer coefficient of the glazing, Ti – T0. This value is a bittrickier because it depends on the temperature difference between the maximum temperature and
ambient temperature of the final result, but those values are unknown at this time. Fortunately, an
equation can be modeled for this value based on the temperature variation. This was done againusing table 2.2.2e, which is another table of researched values.
Table 2.2.2e
Heat Transfer Coefficient of Single Glaze Transparency Film
Ti - T0 (deg C) Ug Single (watts/degC m2)
66 10.1
93 13.9
121 18.66
7/29/2019 Solar Oven Report
http://slidepdf.com/reader/full/solar-oven-report 10/23
7
149 24.34
177 31.6
204 40.11
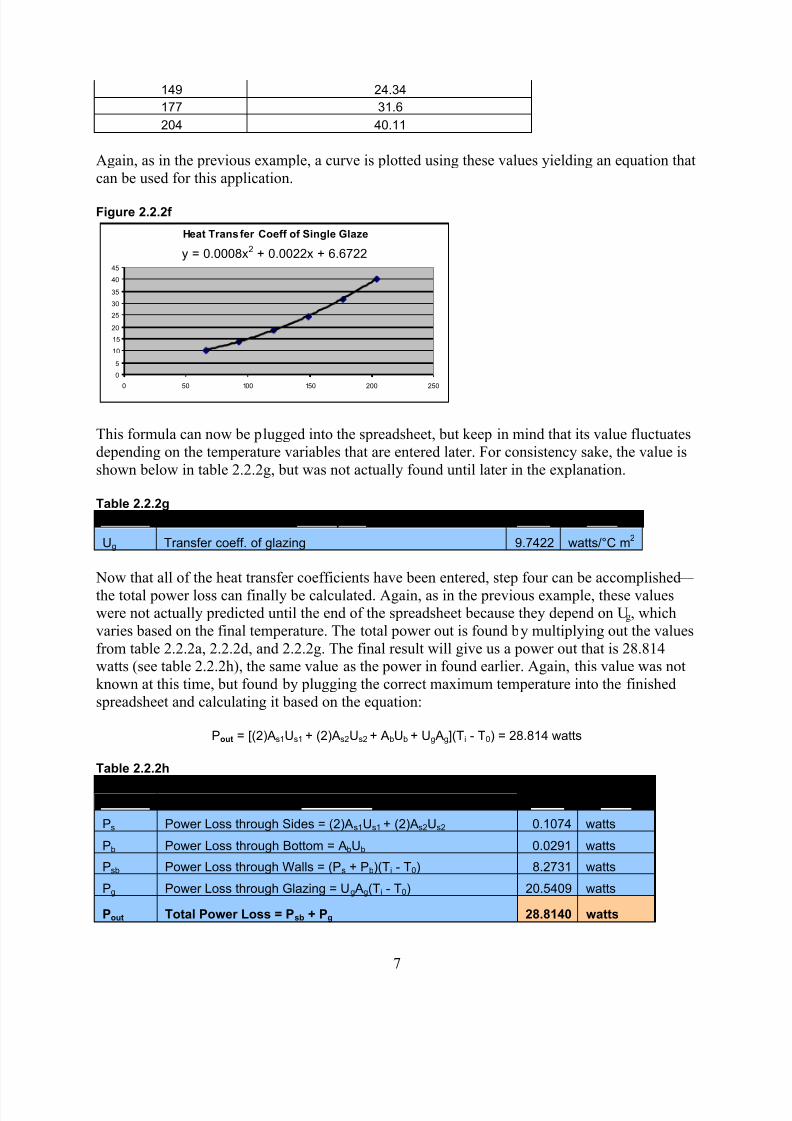
Again, as in the previous example, a curve is plotted using these values yielding an equation that
can be used for this application.
Figure 2.2.2f
Heat Transfer Coeff of Single Glaze
y = 0.0008x2
+ 0.0022x + 6.6722
0
5
10
15
20
25
30
35
40
45
0 50 100 150 200 250
This formula can now be plugged into the spreadsheet, but keep in mind that its value fluctuates
depending on the temperature variables that are entered later. For consistency sake, the value is
shown below in table 2.2.2g, but was not actually found until later in the explanation.
Table 2.2.2g
variable description value units
Ug Transfer coeff. of glazing 9.7422 watts/°C m2
Now that all of the heat transfer coefficients have been entered, step four can be accomplished —
the total power loss can finally be calculated. Again, as in the previous example, these valueswere not actually predicted until the end of the spreadsheet because they depend on Ug, which
varies based on the final temperature. The total power out is found by multiplying out the values
from table 2.2.2a, 2.2.2d, and 2.2.2g. The final result will give us a power out that is 28.814watts (see table 2.2.2h), the same value as the power in found earlier. Again, this value was not
known at this time, but found by plugging the correct maximum temperature into the finished
spreadsheet and calculating it based on the equation:
Pout = [(2)As1Us1 + (2)As2Us2 + AbUb + Ug Ag](Ti - T0) = 28.814 watts
Table 2.2.2h
Power Outvariable Description value units
Ps Power Loss through Sides = (2)As1Us1 + (2)As2Us2 0.1074 watts
Pb Power Loss through Bottom = AbUb 0.0291 watts
Psb Power Loss through Walls = (Ps + Pb)(Ti - T0) 8.2731 watts
Pg Power Loss through Glazing = Ug Ag(Ti - T0) 20.5409 watts
Pout Total Power Loss = Psb + Pg 28.8140 watts
7/29/2019 Solar Oven Report
http://slidepdf.com/reader/full/solar-oven-report 11/23
8
The final step in calculating the maximum temperature is to plug in the correct temperature
values that the previous calculations are looking for in order to determine a final value. The Pout is looking for Ti-T0 to finalize the calculation. The ambient temperature on the day of the test
was 29.2 degrees C, so we know what T0 is. Since all values are now connected in the
spreadsheet, and only one remains to be found, all that has to be done is tweak Ti until Pin is the
same as Pout. When this is done, the final temperature of the basic oven configuration turns out to
be 89.79 degrees C. Please see table 2.2.2i below for a summary this process. The fullspreadsheet can be seen in Appendix A.
Table 2.2.2i
Ti Internal Temperature of the Oven 89.79 °C
T0 Ambient Temperature (Temperature Outside) 29.2 °C
Ti - T0 Internal Temperature minus Outside Temperature 60.5876 °C
Pin Power In = I0tdA 28.814 watts
Pout Total Power Loss = Psb + Pg 28.814 watts
2.3 Dual Pane Oven Calcu lat ions
2.3.1 Dual Pane Overview
The dual pane configuration is calculated on a separate spreadsheet, but uses the exact same
method of calculation as the first. There are only two major differences in this configuration.
One, the transmission coefficient of the glazing slightly lessens due to the second layer; and two,
the heat transfer coefficient lessens due to the increased thickness. The dual pane configuration’s
ability to retain heat outweighs the reduced amount of energy intake, therefore allowing the ovento reach a higher temperature.
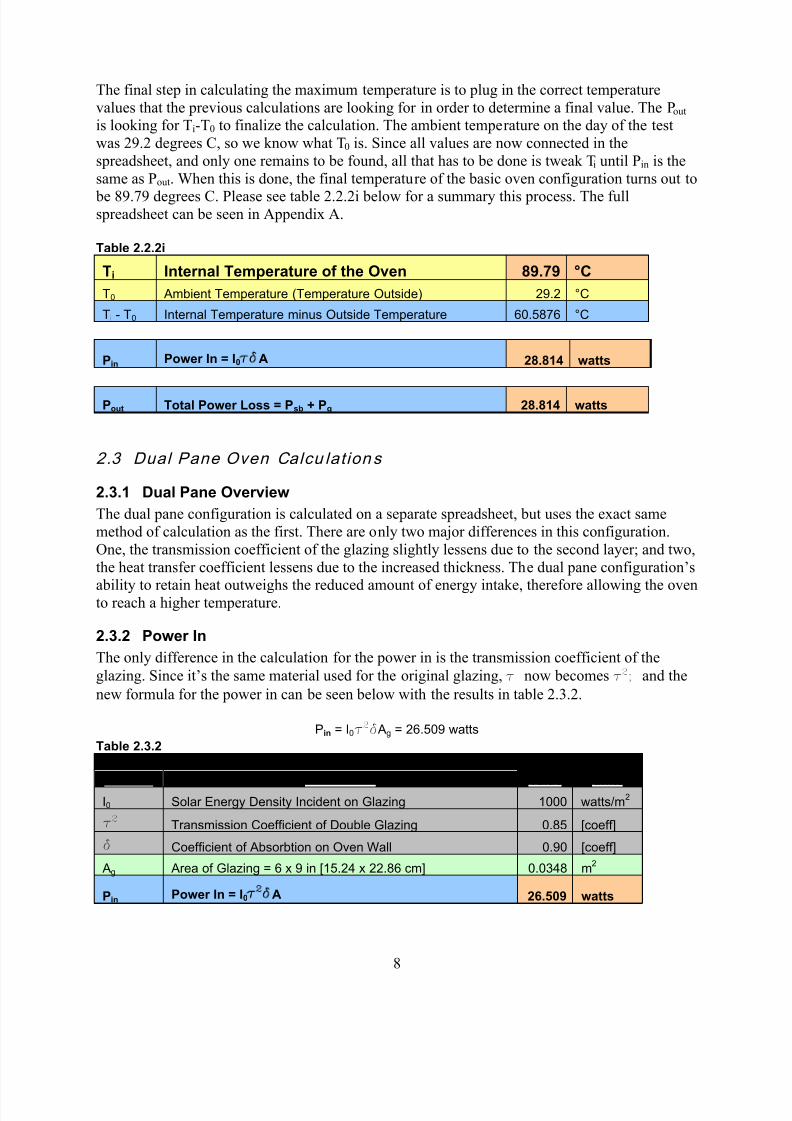
2.3.2 Power In
The only difference in the calculation for the power in is the transmission coefficient of the
glazing. Since it’s the same material used for the original glazing, t now becomes t2; and the
new formula for the power in can be seen below with the results in table 2.3.2.
Pin = I0t2d Ag = 26.509 watts
Table 2.3.2
Power In
variable Description value unitsI0 Solar Energy Density Incident on Glazing 1000 watts/m
2
t2 Transmission Coefficient of Double Glazing 0.85 [coeff]
d Coefficient of Absorbtion on Oven Wall 0.90 [coeff]
Ag Area of Glazing = 6 x 9 in [15.24 x 22.86 cm] 0.0348 m2
Pin Power In = I0t2dA 26.509 watts
7/29/2019 Solar Oven Report
http://slidepdf.com/reader/full/solar-oven-report 12/23
9
2.3.3 Power Out
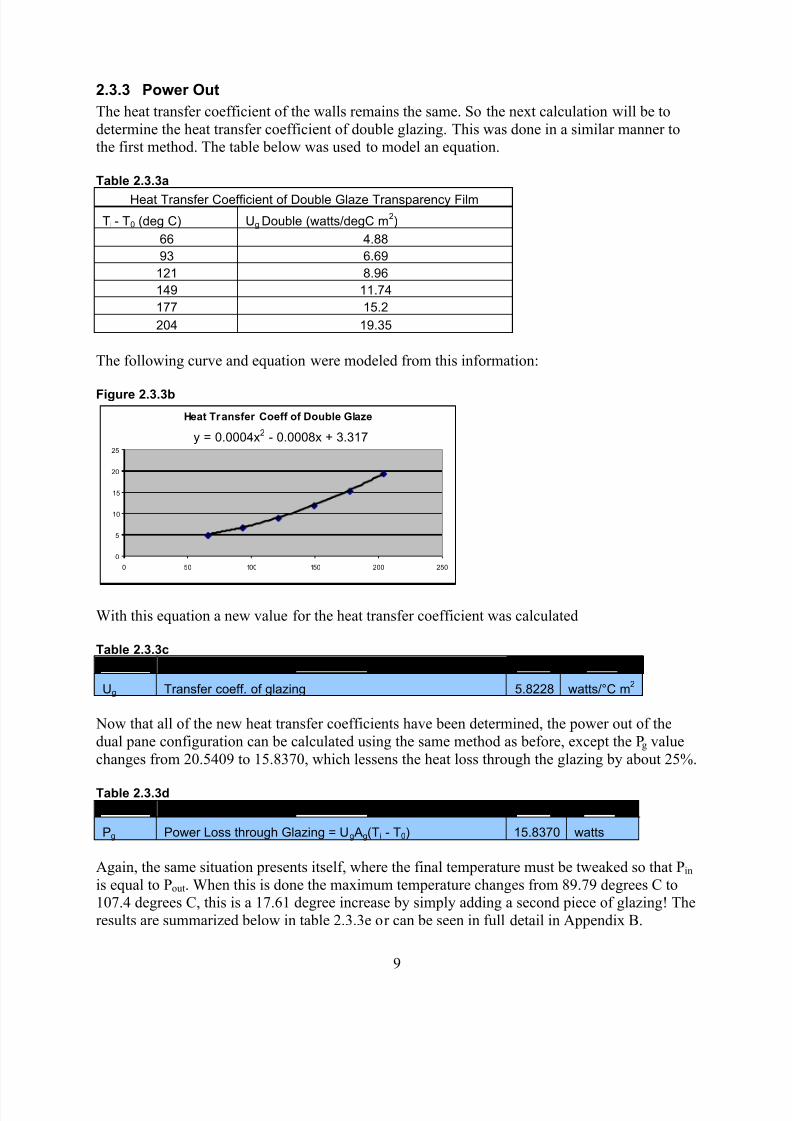
The heat transfer coefficient of the walls remains the same. So the next calculation will be to
determine the heat transfer coefficient of double glazing. This was done in a similar manner tothe first method. The table below was used to model an equation.
Table 2.3.3a
Heat Transfer Coefficient of Double Glaze Transparency Film
Ti - T0 (deg C) Ug Double (watts/degC m2)
66 4.88
93 6.69
121 8.96
149 11.74
177 15.2
204 19.35
The following curve and equation were modeled from this information:
Figure 2.3.3b
Heat Transfer Coeff of Double Glaze
y = 0.0004x2
- 0.0008x + 3.317
0
5
10
15
20
25
0 50 100 150 200 250
With this equation a new value for the heat transfer coefficient was calculated
Table 2.3.3c
variable Description value units
Ug Transfer coeff. of glazing 5.8228 watts/°C m2
Now that all of the new heat transfer coefficients have been determined, the power out of the
dual pane configuration can be calculated using the same method as before, except the Pg value
changes from 20.5409 to 15.8370, which lessens the heat loss through the glazing by about 25%.
Table 2.3.3d
variable Description value units
Pg Power Loss through Glazing = Ug Ag(Ti - T0) 15.8370 watts
Again, the same situation presents itself, where the final temperature must be tweaked so that P in
is equal to Pout. When this is done the maximum temperature changes from 89.79 degrees C to107.4 degrees C, this is a 17.61 degree increase by simply adding a second piece of glazing! The
results are summarized below in table 2.3.3e or can be seen in full detail in Appendix B.
7/29/2019 Solar Oven Report
http://slidepdf.com/reader/full/solar-oven-report 13/23
10
Table 2.3.3e
Ti Internal Temperature of the Oven 107.4 °C
T0 Ambient Temperature (Temperature Outside) 29.2 °C
Ti - T0 Internal Temperature minus Outside Temperature 78.1555 °C
Pin Power In = I0tdA 26.509 watts
Pout Total Power Loss = Psb + Pg 26.509 watts
2.4 Ref lector Oven Calculat ions
2.4.1 Reflector Overview
The reflector configuration requires some additional calculations in order to determine. The main
difference between the basic configuration and the reflector configuration is that the power in isamplified by some factor that will be referred to as the gain. Finding this factor is the major part
of predicting the maximum temperature.
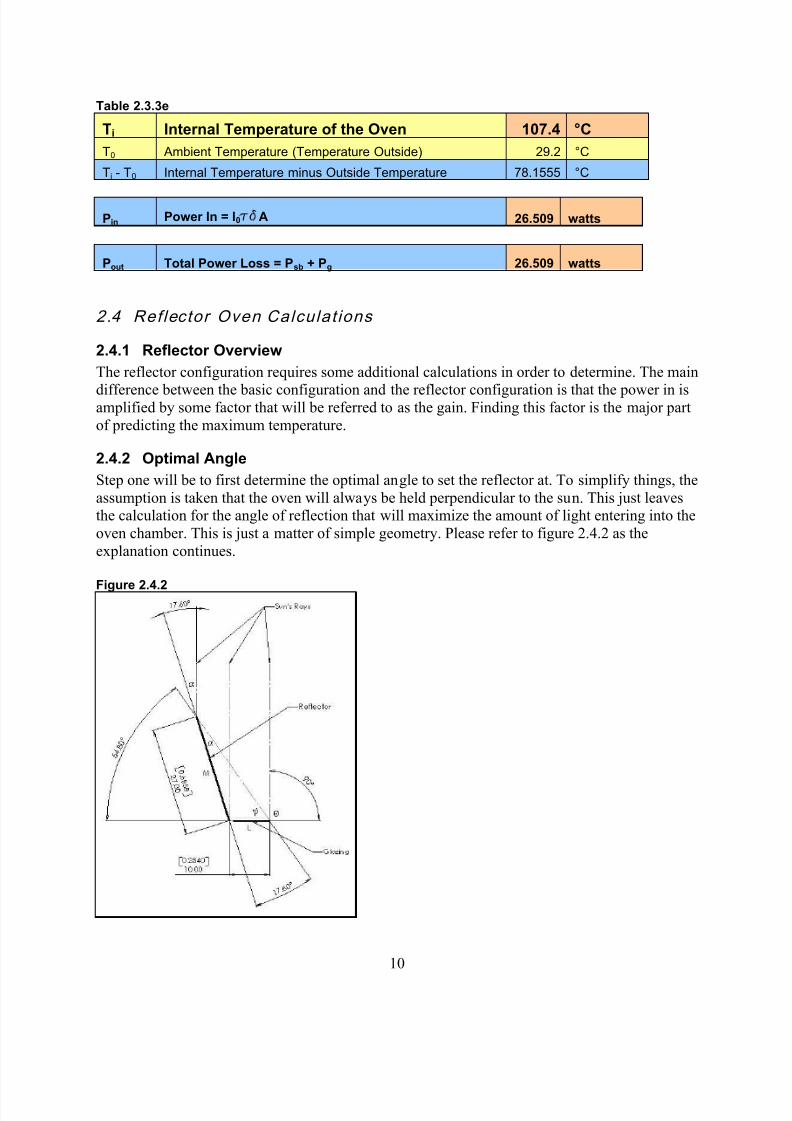
2.4.2 Optimal Angle
Step one will be to first determine the optimal angle to set the reflector at. To simplify things, the
assumption is taken that the oven will always be held perpendicular to the sun. This just leavesthe calculation for the angle of reflection that will maximize the amount of light entering into the
oven chamber. This is just a matter of simple geometry. Please refer to figure 2.4.2 as the
explanation continues.
Figure 2.4.2
7/29/2019 Solar Oven Report
http://slidepdf.com/reader/full/solar-oven-report 14/23
11
CAD software was used to create dimensionally driven geometry. Geometric relationships and
dimensions can be assigned to anything and forced to solve based on the entered values. Thereflector length, M, was set to 27 inches, and the length of the glazing, L, was set to 10 inches
(it’s actually 9 inches, but the reflector is one inch from the edge). Then a perpendicular
relationship was added to the sun’s rays in relation to the glazing representing angle Q. Next, the
two angles, a, were set equal to each other. Finally, angle y was adjusted until the reflected
beam of light rested on the very edge of the glazing. Adding angle Q and angle a gave anoptimal angle of 107.6 degrees.
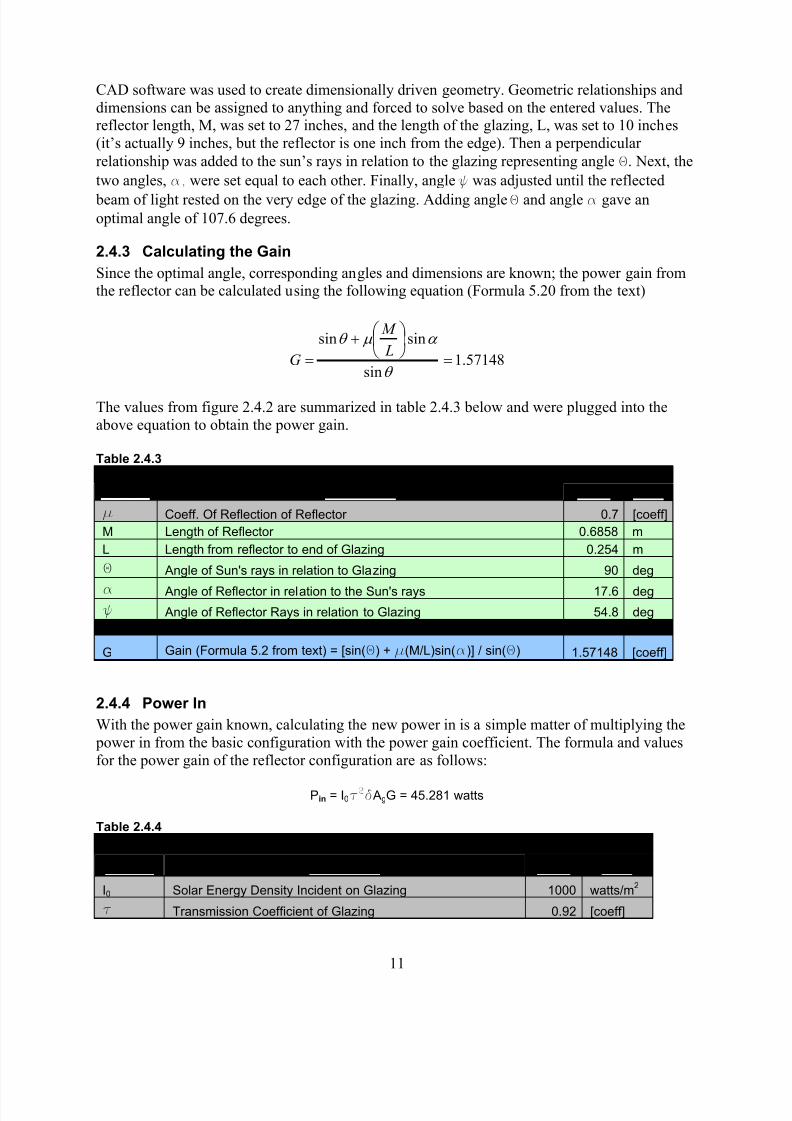
2.4.3 Calculating the Gain
Since the optimal angle, corresponding angles and dimensions are known; the power gain fromthe reflector can be calculated using the following equation (Formula 5.20 from the text)
57148.1sin
sinsin
L
M
G
The values from figure 2.4.2 are summarized in table 2.4.3 below and were plugged into the
above equation to obtain the power gain.
Table 2.4.3
Reflector Power
variable Description value units
m Coeff. Of Reflection of Reflector 0.7 [coeff]
M Length of Reflector 0.6858 m
L Length from reflector to end of Glazing 0.254 m
Q Angle of Sun's rays in relation to Glazing 90 deg
a Angle of Reflector in relation to the Sun's rays 17.6 deg
ѱ Angle of Reflector Rays in relation to Glazing 54.8 deg
G Gain (Formula 5.2 from text) = [sin(Θ) + m(M/L)sin(a)] / sin(Θ) 1.57148 [coeff]
2.4.4 Power In
With the power gain known, calculating the new power in is a simple matter of multiplying the
power in from the basic configuration with the power gain coefficient. The formula and values
for the power gain of the reflector configuration are as follows:
Pin = I0t2d AgG = 45.281 watts
Table 2.4.4
Power In
variable Description value units
I0 Solar Energy Density Incident on Glazing 1000 watts/m2
t Transmission Coefficient of Glazing 0.92 [coeff]
7/29/2019 Solar Oven Report
http://slidepdf.com/reader/full/solar-oven-report 15/23
12
d Coefficient of Absorbtion on Oven Wall 0.90 [coeff]
Ag Area of Glazing = 6 x 9 in [15.24 x 22.86 cm] 0.0348 m2
Pin Power In with Reflector = I0tdAG 45.281 watts
The new power gain is a whopping 16.467 watt increase over the basic oven configuration.
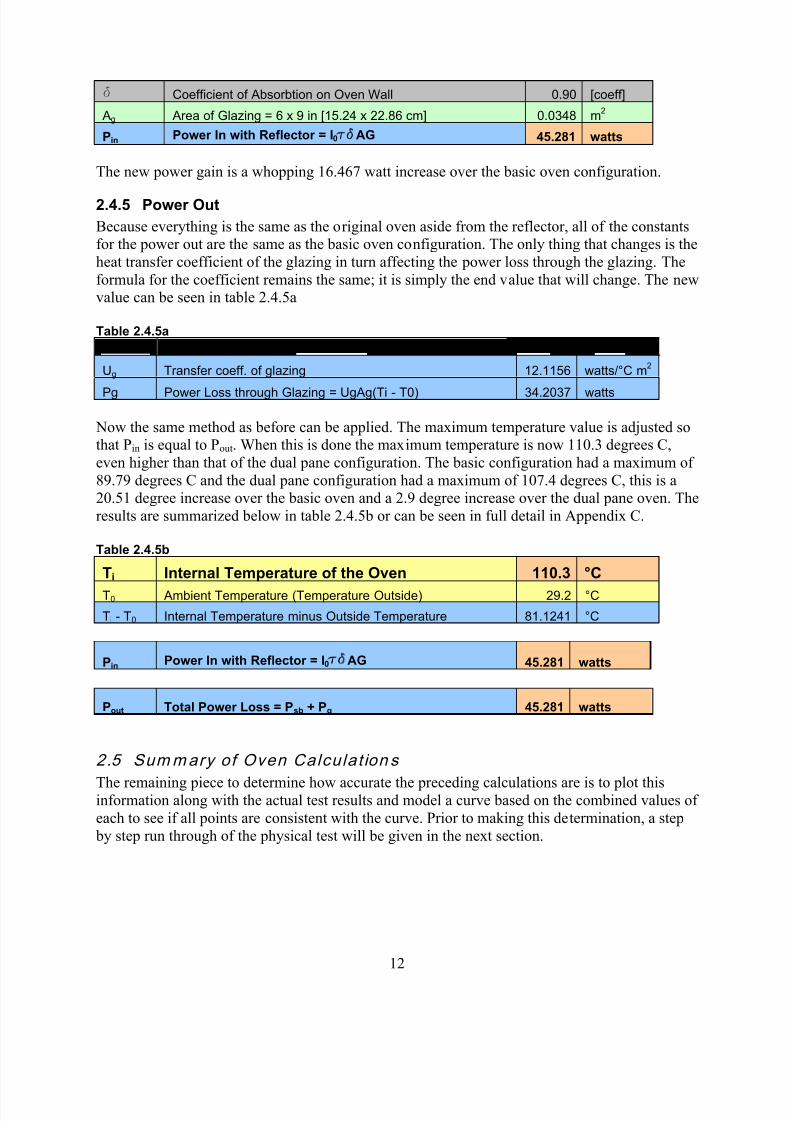
2.4.5 Power Out
Because everything is the same as the original oven aside from the reflector, all of the constantsfor the power out are the same as the basic oven configuration. The only thing that changes is the
heat transfer coefficient of the glazing in turn affecting the power loss through the glazing. The
formula for the coefficient remains the same; it is simply the end value that will change. The newvalue can be seen in table 2.4.5a
Table 2.4.5a
variable Description value units
Ug Transfer coeff. of glazing 12.1156 watts/°C m2
Pg Power Loss through Glazing = UgAg(Ti - T0) 34.2037 watts
Now the same method as before can be applied. The maximum temperature value is adjusted sothat Pin is equal to Pout. When this is done the maximum temperature is now 110.3 degrees C,
even higher than that of the dual pane configuration. The basic configuration had a maximum of
89.79 degrees C and the dual pane configuration had a maximum of 107.4 degrees C, this is a20.51 degree increase over the basic oven and a 2.9 degree increase over the dual pane oven. The
results are summarized below in table 2.4.5b or can be seen in full detail in Appendix C.
Table 2.4.5b
Ti Internal Temperature of the Oven 110.3 °C
T0 Ambient Temperature (Temperature Outside) 29.2 °C
Ti - T0 Internal Temperature minus Outside Temperature 81.1241 °C
Pin Power In with Reflector = I0tdAG 45.281 watts
Pout Total Power Loss = Psb + Pg 45.281 watts
2.5 Summary of Oven Calculat ion s
The remaining piece to determine how accurate the preceding calculations are is to plot thisinformation along with the actual test results and model a curve based on the combined values of
each to see if all points are consistent with the curve. Prior to making this determination, a step
by step run through of the physical test will be given in the next section.
7/29/2019 Solar Oven Report
http://slidepdf.com/reader/full/solar-oven-report 16/23
13
3 Testing the Oven
3.1 Plann ing the Test
It was determined in advance that there was insufficient time to test the oven over the full
amount of time that would allow it to reach its actual maximum temperature. This is where
mathematical modeling will have to come into play. If at least three values are measured atspecific increments of time for each test, then the information can be plotted in such a way that
the future conditions can be forecasted based on the yielded equation. It was decided that the
temperature would be measured every three minutes for a total of eighteen minutes. Each of thethree configurations was to be changed every six minutes. In other words, from zero to six
minutes, the basic oven configuration will be tested; from six to twelve minutes, the dual pane
configuration will be tested; and from twelve to eighteen minutes, the reflector configuration will
be tested.
3.2 Oven Set-up & Outdo or Cond i t ions
The solar oven was tested at 1:15pm on November 14, 2007 by two of the team members. The
outdoor conditions that day provided a suitable environment for the solar rays to penetrate theoven. There were no clouds in the sky and the outdoor tem perature was 29.2˚C (84.56˚F). The
team members placed the solar oven outside in the shade while they were setting up the oven sothat no solar energy would prematurely heat the oven. A flat block of cement was chosen for the
solar oven to rest on for the testing phase that had full exposure and did not risk any interference
with potential shade that might have obstructed the solar radiation. A temperature probe wasconnected to the oven and the entire device was placed in the sun so that the suns rays were
directly hitting the oven window. The team members placed books underneath the back edge of
the oven till the sun dial cast a shadow that was projected directly under the dial confirming that
the angle of the sun was directly perpendicular to the glazing.
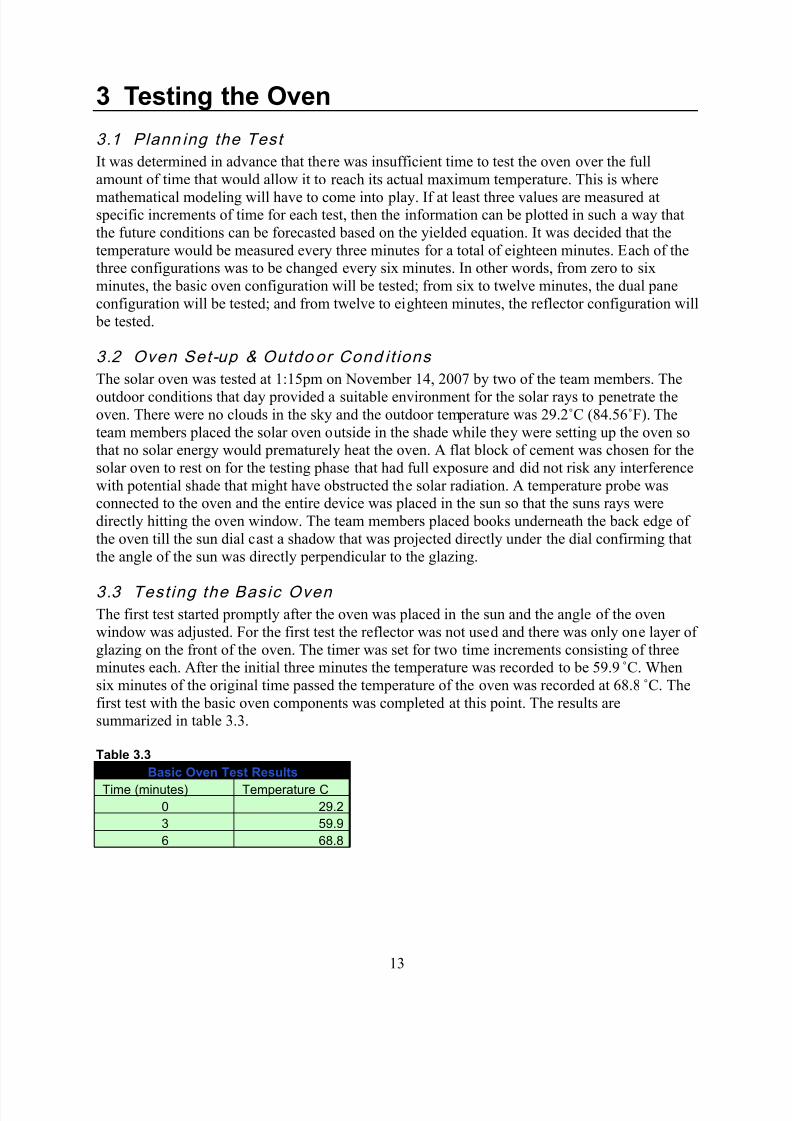
3.3 Test ing the Basic Oven The first test started promptly after the oven was placed in the sun and the angle of the oven
window was adjusted. For the first test the reflector was not used and there was only one layer of
glazing on the front of the oven. The timer was set for two time increments consisting of threeminutes each. After the initial three minutes the temperature was recorded to be 59.9 ˚C. When
six minutes of the original time passed the temperature of the oven was recorded at 68.8 ˚C. The
first test with the basic oven components was completed at this point. The results aresummarized in table 3.3.
Table 3.3
Basic Oven Test Results
Time (minutes) Temperature C
0 29.2
3 59.9
6 68.8
7/29/2019 Solar Oven Report
http://slidepdf.com/reader/full/solar-oven-report 17/23
14
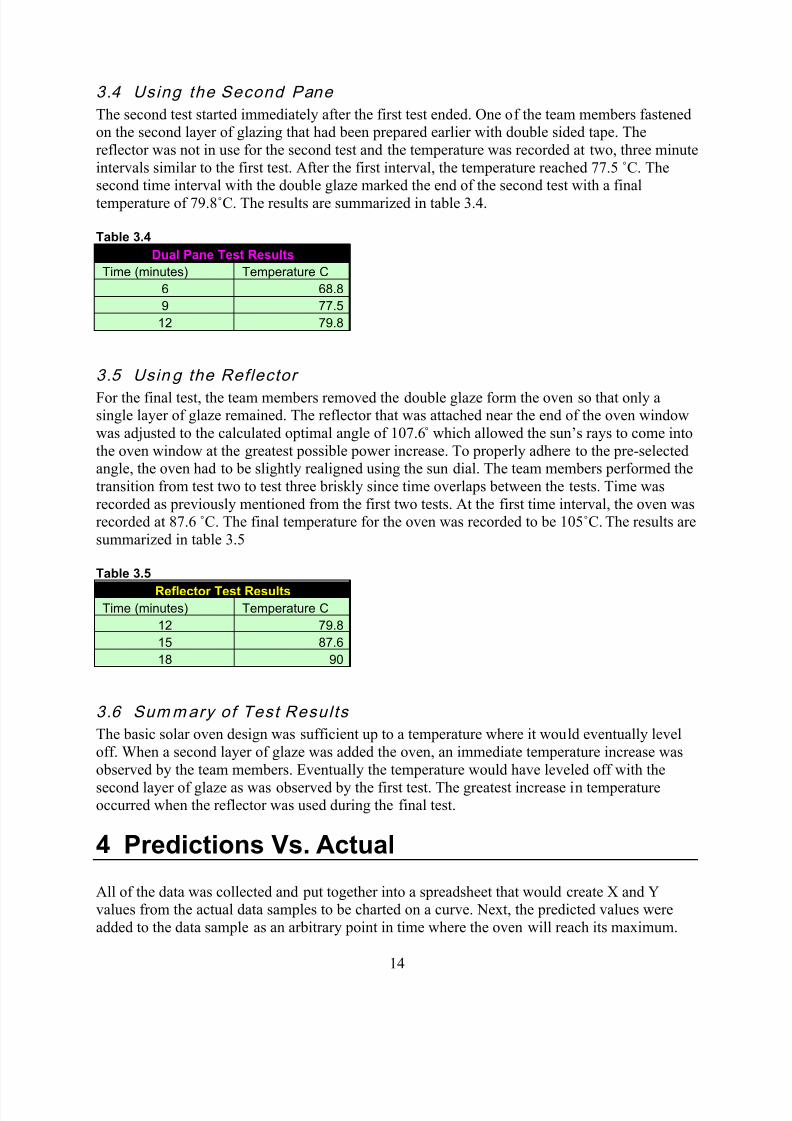
3.4 Using the Second Pane
The second test started immediately after the first test ended. One of the team members fastenedon the second layer of glazing that had been prepared earlier with double sided tape. The
reflector was not in use for the second test and the temperature was recorded at two, three minute
intervals similar to the first test. After the first interval, the temperature reached 77.5 ˚C. Thesecond time interval with the double glaze marked the end of the second test with a final
temperature of 79.8˚C. The results are summarized in table 3.4.
Table 3.4
Dual Pane Test Results
Time (minutes) Temperature C
6 68.8
9 77.5
12 79.8
3.5 Usin g the Reflector
For the final test, the team members removed the double glaze form the oven so that only asingle layer of glaze remained. The reflector that was attached near the end of the oven window
was adjusted to the calculated optimal angle of 107.6˚ which allowed the sun’s rays to come into
the oven window at the greatest possible power increase. To properly adhere to the pre-selectedangle, the oven had to be slightly realigned using the sun dial. The team members performed the
transition from test two to test three briskly since time overlaps between the tests. Time was
recorded as previously mentioned from the first two tests. At the first time interval, the oven wasrecorded at 87.6 ˚C. The final temperature for the oven was recorded to be 105˚C. The results are
summarized in table 3.5
Table 3.5
Reflector Test ResultsTime (minutes) Temperature C
12 79.8
15 87.6
18 90
3.6 Summary of Test Resul ts
The basic solar oven design was sufficient up to a temperature where it would eventually level
off. When a second layer of glaze was added the oven, an immediate temperature increase was
observed by the team members. Eventually the temperature would have leveled off with the
second layer of glaze as was observed by the first test. The greatest increase in temperatureoccurred when the reflector was used during the final test.
4 Predictions Vs. Actual
All of the data was collected and put together into a spreadsheet that would create X and Yvalues from the actual data samples to be charted on a curve. Next, the predicted values were
added to the data sample as an arbitrary point in time where the oven will reach its maximum.
7/29/2019 Solar Oven Report
http://slidepdf.com/reader/full/solar-oven-report 18/23
15
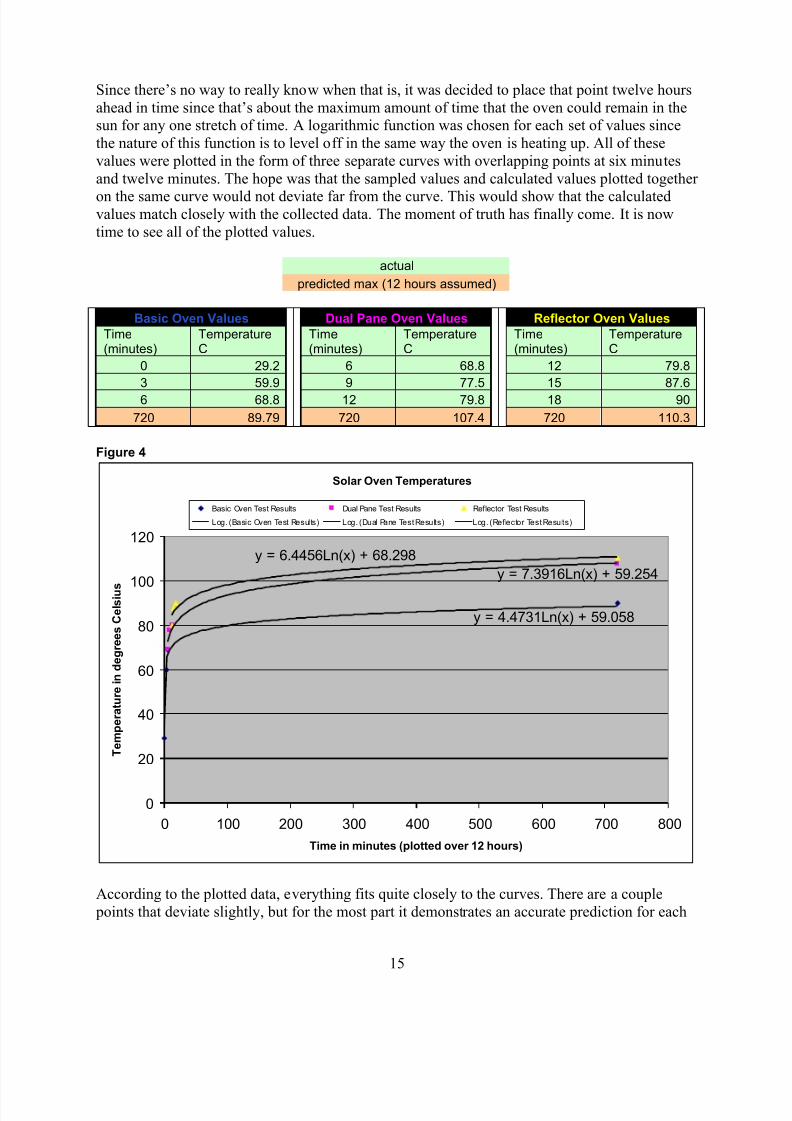
Since there’s no way to really know when that is, it was decided to place that point twelve hours
ahead in time since that’s about the maximum amount of time that the oven could remain in thesun for any one stretch of time. A logarithmic function was chosen for each set of values since
the nature of this function is to level off in the same way the oven is heating up. All of these
values were plotted in the form of three separate curves with overlapping points at six minutes
and twelve minutes. The hope was that the sampled values and calculated values plotted together
on the same curve would not deviate far from the curve. This would show that the calculatedvalues match closely with the collected data. The moment of truth has finally come. It is now
time to see all of the plotted values.
actual
predicted max (12 hours assumed)
Basic Oven Values
Time(minutes)
TemperatureC
0 29.2
3 59.9
6 68.8
720 89.79
Dual Pane Oven Values
Time(minutes)
TemperatureC
6 68.8
9 77.5
12 79.8
720 107.4
Reflector Oven Values
Time(minutes)
TemperatureC
12 79.8
15 87.6
18 90
720 110.3
Figure 4
Solar Oven Temperatures
y = 4.4731Ln(x) + 59.058
y = 7.3916Ln(x) + 59.254
y = 6.4456Ln(x) + 68.298
0
20
40
60
80
100
120
0 100 200 300 400 500 600 700 800
Time in minutes (plotted over 12 hours)
TemperatureindegreesCelsius
Basic Oven Test Results Dual Pane Test Results Reflector Test Results
Log. (Basic Oven Test Results) Log. (Dual Pane Test Results) Log. (Reflector Test Results)
According to the plotted data, everything fits quite closely to the curves. There are a couple
points that deviate slightly, but for the most part it demonstrates an accurate prediction for each
7/29/2019 Solar Oven Report
http://slidepdf.com/reader/full/solar-oven-report 19/23
16
oven configuration. This is simply a forecast of the maximum temperature. The only way to
determine if it’s correct to 100% certainty is to do a physical test over a 12 hour period of time.Given that it was only an 18 minute test, these are really good results for the small amount of
time spent testing the oven.
5 Conclusion
5.1 Recap of Goals and Cons truc t ion
The goal of the project was to design and build a solar oven capable of effectively collecting the
sun’s energy and containing the heat produced by the collector; as well as calculating an accurate
perdition of the maximum temperature capability of the design. The design included three
different configurations: a basic configuration, a dual pane configuration, and a reflector configuration. Calculations for all three configurations were required. The team assembled the
oven using the provided materials so that all the necessary measurements could be taken for use
in the calculations. Once the dimensions were documented, the oven was prepared for testing so
that all three configurations could be switched between seamlessly.
5.2 Recap of Calculat ions
In order to predict the temperature of the basic solar oven, two factors were considered, the first
factor being the power out, and the second being the power in. In order for an oven to reach its
maximum temperature, the power out must be equal to the power in. To calculate the power in,the equation Pin = IoτaA was used where Pin = the power in, Io = the energy per square meter of
the sun to which we assumed to be 1000 watts/ sq meter, τ = .92 which was the coefficient of the
glaze, and a= the coefficient of the absorption of the walls of the solar oven, and A= the area of
the collector which was 0.0348 m2. Using this formula we found that the predicted power in for
the basic oven was 28.814 Watts. In order to calculate the power out, the formula Pout = UA∆Τ
was used, where Pout = power out, U = the thermal conductivity of the material, A = area of theconducting surface, and ∆Τ = the change in temperature. The heat transfer coefficients werefound for the total power escaping through the walls and the glazing and plugged into the
formula along with the corresponding dimensions. Once all these values were linked up in the
spreadsheet, TI, the internal temperature of the oven, was adjusted until the Pout became 28.814watts (equal to the Pin) at a predicted temperature of 89.79 degrees C.
Predicting the temperature for the dual plane oven was very similar to predicting the temperaturefor the single glaze oven, but for the Pin, the value of , τ, was squared to equal 0.85 for the power
in which gave us a value of 26.509 watts. The next thing that changed was the value for the
transfer coefficient of the glazing to account for the second layer. Lastly, the temperature was
again adjusted so that Pin would equal Pout giving a temperature prediction of 107.4 degrees Cwhich was higher than that of the single glazing.
In order to predict the internal temperature of the oven with the reflector, only the power inequation was to be modified seeing as how the reflector had little to no effect on the power
output of the oven. In order to calculate the power that the reflector put into the oven, the
reflector had to be measured and the optimal angle had to be calculated. This was done using
nothing but geometric relationships in a CAD program. The angle of the suns rays in relation to
7/29/2019 Solar Oven Report
http://slidepdf.com/reader/full/solar-oven-report 20/23
17
the glazing was decided to always be 90 degrees; the angle of the reflector to the suns rays was
17.6 degrees; and the angle of the reflector rays in relation to the glazing which we calculated to
be 54.8 degrees. Then using the formula supplied by the textbook (sin(Θ) + m(M/L)sin(a)] /
sin(Θ)), the gain was calculated to be 1.57148. Adding this into the Pin of the spreadsheet, a new
power input of 45.281 watts was achieved, which was significantly higher then the two prior oven configurations. The final predicted temperature of the oven with the reflector turned out to
be 110.3 degrees C. If more detailed information about the calculations is required please refer back to section two, or see the Appendices for full spreadsheet layouts for each configuration.
5.3 Recap of Test
For the actual test of the oven it was planned to be tested over a total of 18 minutes in order tosave time. Each of the three oven configurations were tested sequentially for six minutes each.
Temperature readings were taken every three minutes. This would give each configuration the
necessary three points for plotting the curves that tell if the actual test is close to the calculations.
The measured temperatures of the actual test starting from zero minutes, measured every threeminutes in degrees Celsius were: 29.2, 59.9, 68.8, 77.5, 79.8, 87.6, & 105.
5.4 Summ ing it al l Up
The tested values were gathered along with the calculated values in the spreadsheet. The
maximum temperatures were assumed to be twelve hours ahead in time since that’s about as longas the sun stays up in any given day. Using a logarithmic curve plot in the spreadsheet program,
all the values were plotted together to determine how well the predicted temperatures fit on the
curve with the actual temperatures. Based on the twelve hour assumption, all of the points fitrelatively close on the curve with each other for each of the three oven configurations. The
plotted values can be seen by referring back to Figure 4. This is a satisfactory result taking into
account the very short amount of time spent testing the oven. Only 18 minutes were used in
determining fairly closely what would happen in 36 hours (12 hours each for threeconfigurations). Although it’s not a definite confirmation of the maximum temperature, it’s well
within the parameters of most real world applications. This method of designing a solar oven
would be superior in most situations as opposed to spending long hours or even days testing
different ovens to finally arrive at the solution. The project has come to an end and wascompleted successfully.
7/29/2019 Solar Oven Report
http://slidepdf.com/reader/full/solar-oven-report 21/23
18
6 Appendices
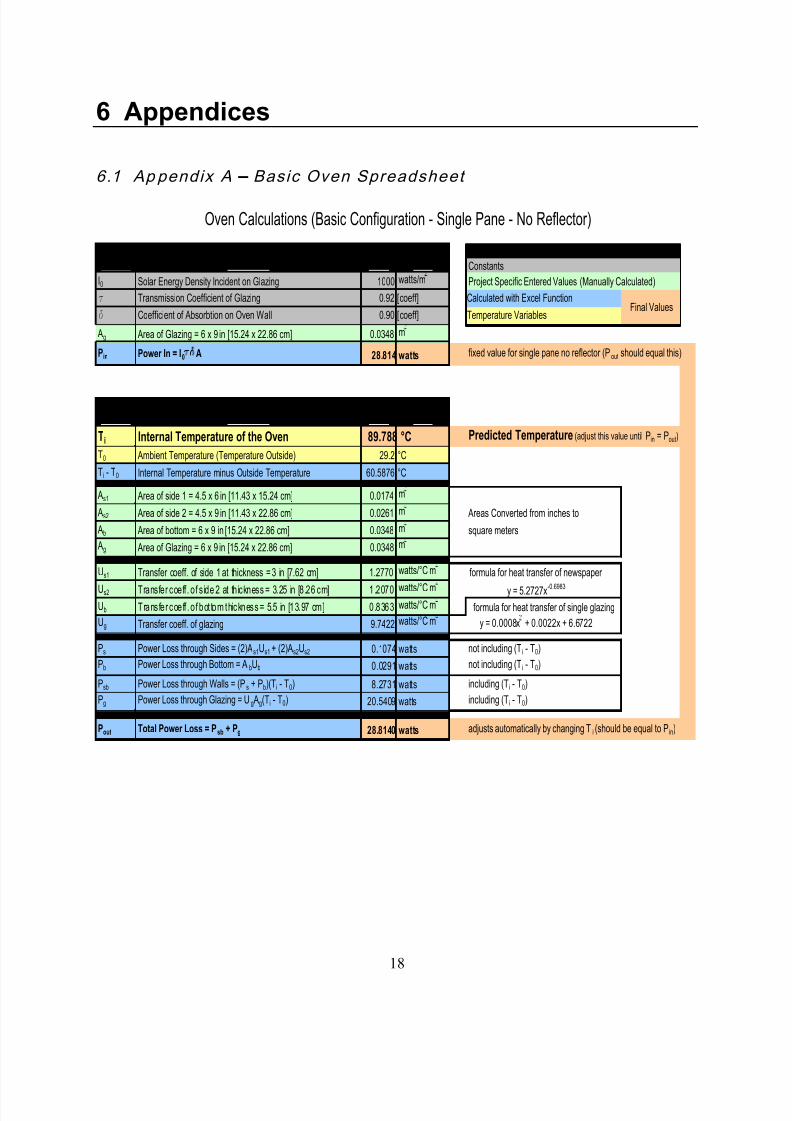
6.1 Appendix A – Basic Oven Spreadsheet
variable description value units Constants
I0 Solar Energy Density Incident on Glazing 1000 watts/m Project Specific Entered Values (Manually Calculated)
t Transmission Coefficient of Glazing 0.92 [coeff] Calculated with Excel Function
d Coefficient of Absorbtion on Oven Wall 0.90 [coeff] Temperature Variables
Ag Area of Glazing = 6 x 9 in [15.24 x 22.86 cm] 0.0348 m
Pin Power In = I0tdA 28.814 watts fixed value for single pane no reflector (Pout should equal this)
variable description value units
Ti Internal Temperature of the Oven 89.788 °C Predicted Temperature (adjust this value until Pin = Pout)
T0 Ambient Temperature (Temperature Outside) 29.2 °C
Ti - T0 Internal Temperature minus Outside Temperature 60.5876 °C
As1 Area of side 1 = 4.5 x 6 in [11.43 x 15.24 cm] 0.0174 m
As2 Area of side 2 = 4.5 x 9 in [11.43 x 22.86 cm] 0.0261 m Areas Converted from inches to
Ab Area of bottom = 6 x 9 in [15.24 x 22.86 cm] 0.0348 m square meters
Ag Area of Glazing = 6 x 9 in [15.24 x 22.86 cm] 0.0348 m
Us1 Transfer coeff. of side 1 at thickness = 3 in [7.62 cm] 1.2770 watts/°C m
Us2 Transfer coeff . of s ide 2 at thickness = 3.25 in [8.26 cm] 1.2070 watts/°C mUb Trans fer coeff . o f bot tom thickness = 5.5 in [13.97 cm] 0.8363 watts/°C m formula for heat transfer of single glazing
Ug Transfer coeff. of glazing 9.7422 watts/°C m
Ps Power Loss through Sides = (2)As1Us1 + (2)As2Us2 0.1074 watts not including (Ti - T0)
Pb Power Loss through Bottom = AbUb 0.0291 watts not including (Ti - T0)
Psb Power Loss through Walls = (Ps + Pb)(Ti - T0) 8.2731 watts including (Ti - T0)
Pg Power Loss through Glazing = Ug Ag(Ti - T0) 20.5409 watts including (Ti - T0)
Pout Total Power Loss = Psb + Pg 28.8140 watts adjusts automatically by changing T i (should be equal to Pin)
Oven Calculations (Basic Configuration - Single Pane - No Reflector)
formula for heat transfer of newspaper
y = 5.2727x-0.6983
y = 0.0008x + 0.0022x + 6.6722
Power In
Power Out
Legend
Final Values
7/29/2019 Solar Oven Report
http://slidepdf.com/reader/full/solar-oven-report 22/23
19
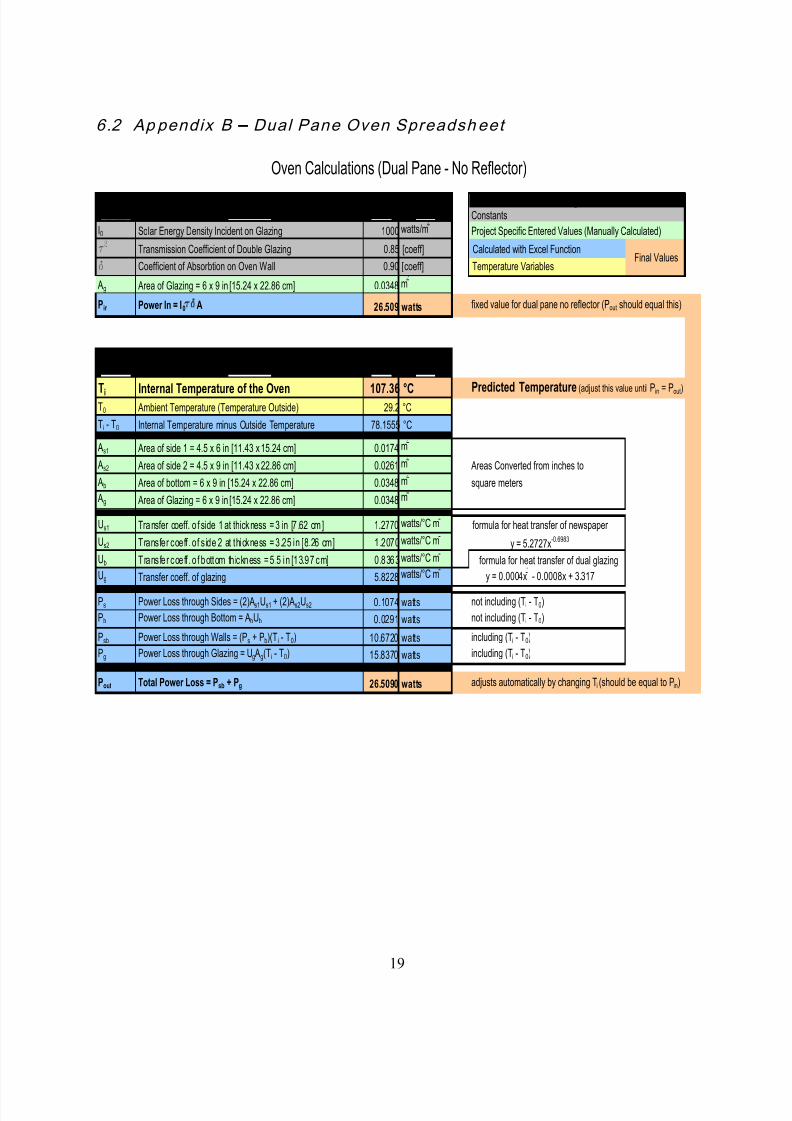
6.2 Appendix B – Dual Pane Oven Spreadsheet
variable description value units Constants
I0 Solar Energy Density Incident on Glazing 1000 watts/m Project Specific Entered Values (Manually Calculated)
t2
Transmission Coefficient of Double Glazing 0.85 [coeff] Calculated with Excel Function
d Coefficient of Absorbtion on Oven Wall 0.90 [coeff] Temperature Variables
Ag Area of Glazing = 6 x 9 in [15.24 x 22.86 cm] 0.0348 m
Pin Power In = I0tdA 26.509 watts fixed value for dual pane no reflector (P out should equal this)
variable description value units
Ti Internal Temperature of the Oven 107.36 °C Predicted Temperature (adjust this value until Pin = Pout)T0 Ambient Temperature (Temperature Outside) 29.2 °C
Ti - T0 Internal Temperature minus Outside Temperature 78.1555 °C
As1 Area of side 1 = 4.5 x 6 in [11.43 x 15.24 cm] 0.0174 m
As2 Area of side 2 = 4.5 x 9 in [11.43 x 22.86 cm] 0.0261 m Areas Converted from inches to
Ab Area of bottom = 6 x 9 in [15.24 x 22.86 cm] 0.0348 m square meters
Ag Area of Glazing = 6 x 9 in [15.24 x 22.86 cm] 0.0348 m
Us1 Transfer coeff. o f side 1 at thickness = 3 in [7 .62 cm] 1.2770 watts/°C m
Us2 Transfer coeff . of side 2 at thickness = 3.25 in [8.26 cm] 1.2070 watts/°C m
Ub Transfer coeff . of bottom thickness = 5.5 in [13.97 cm] 0.8363 watts/°C m formula for heat transfer of dual glazing
Ug Transfer coeff. of glazing 5.8228 watts/°C m
Ps Power Loss through Sides = (2)As1Us1 + (2)As2Us2 0.1074 watts not including (T i - T0)
Pb Power Loss through Bottom = AbUb 0.0291 watts not including (T i - T0)
Psb Power Loss through Walls = (Ps + Pb)(T i - T0) 10.6720 watts including (Ti - T0)
Pg Power Loss through Glazing = Ug Ag(Ti - T0) 15.8370 watts including (Ti - T0)
Pout Total Power Loss = Psb + Pg 26.5090 watts adjusts automatically by changing Ti (should be equal to Pin)
formula for heat transfer of newspaper
y = 5.2727x-0.6983
y = 0.0004x - 0.0008x + 3.317
Oven Calculations (Dual Pane - No Reflector)
Power In
Power Out
Legend
Final Values
7/29/2019 Solar Oven Report
http://slidepdf.com/reader/full/solar-oven-report 23/23
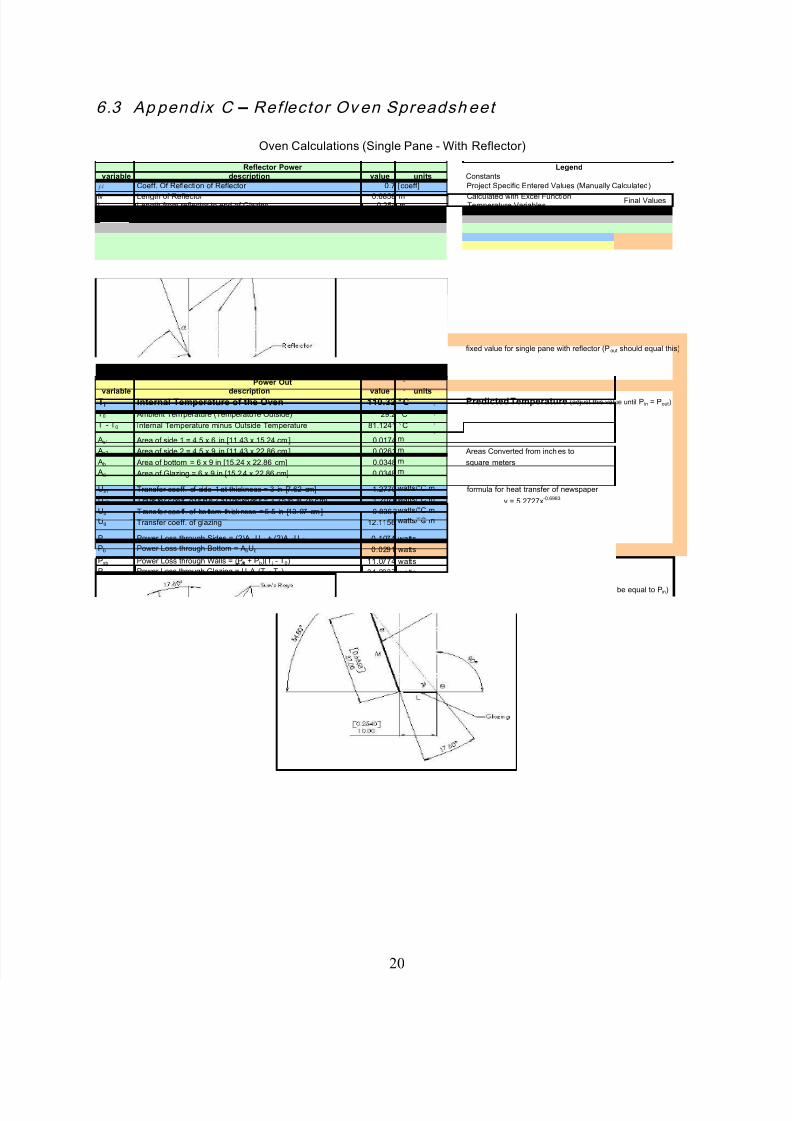
6.3 Appendix C – Reflector Ov en Spreadsheet
variable description value units Constants
m Coeff. Of Reflection of Reflector 0.7 [coeff] Project Specific Entered Values (Manually Calculated)
M Length of Reflector 0.6858 m Calculated with Excel FunctionL Length from reflector to end of Glazing 0.254 m Temperature Variables
Q Angle of Sun's rays in relation to Glazing 90 deg
a Angle of Reflector in relation t o the Sun's rays 17.6 deg
ѱ Angle of Reflector Rays in relation to G lazing 54.8 deg
G Gain (Formula 5.2 from text) = [sin(Θ) + m(M/L)sin(a)] / sin(Θ) 1.57148 [coeff] Multiply Basic Pin by this value to obtain P in with reflector
variable description value units
I0 Solar Energy Density Incident on Glazing 1000 watts/m
t Transmission Coefficient of Glazing 0.92 [coeff]
d Coefficient of Absorbtion on Oven Wall 0.90 [coeff]
Ag Area of Glazing = 6 x 9 in [15.24 x 22.86 cm] 0.0348 m
Pin Power In with Reflector = I 0tdAG 45.281 watts fixed value for single pane with reflector (P out should equal this)
variable description value unitsTi Internal Temperature of the Oven 110.32 °C Predicted Temperature (adjust this value until Pin = Pout)
T0 Ambient Temperature (Temperatu re Outside) 29.2 °C
Ti - T0 Internal Temperature minus Outside Temperature 81.1241 °C
As1 Area of side 1 = 4.5 x 6 in [11.43 x 15.24 cm] 0.0174 m
As2 Area of side 2 = 4.5 x 9 in [11.43 x 22.86 cm] 0.0261 m Areas Converted from inches to
Ab Area of bottom = 6 x 9 in [15.24 x 22.86 cm] 0.0348 m square meters
Ag Area of Glazing = 6 x 9 in [15.24 x 22.86 cm] 0.0348 m
Us1 Transfer coeff. of side 1 at thickness = 3 in [7.62 cm] 1.2770 watts/°C m
Us2 Transfer coeff . o f s ide 2 at thickness = 3.25 in [8.26 cm] 1.2070 watts/°C m
Ub T rans fe r coe ff . of bo ttom th ick ness = 5 .5 in [13.97 cm] 0 .8363 watts/°C m formula for heat transfer of single glazing
Ug Transfer coeff. of glazing 12.1156 watts/°C m
Ps Power Loss through Sides = (2)As1Us1 + (2)As2Us2 0.1074 watts not including (Ti - T0)
Pb Power Loss through Bottom = AbUb 0.0291 watts not including (Ti - T0)
Psb Power Loss through Walls = (Ps + Pb)(Ti - T0) 11.0774 watts including (Ti - T0)
Pg Power Loss through Glazing = Ug Ag(Ti - T0) 34.2037 watts including (Ti - T0)
Pout Total Power Loss = Psb + Pg 45.2810 watts adjusts automatically by changing T i (should be equal to Pin)
formula for heat transfer of newspaper
y = 5.2727x-0.6983
y = 0.0008x2
+ 0.0022x + 6.6722
Oven Calculations (Single Pane - With Reflector)
Reflector Power
Power In
Power Out
Legend
Final Values


![The Solar Oven Experiment[1]](https://static.fdocuments.in/doc/165x107/58ee32c81a28ab93788b45f7/the-solar-oven-experiment1.jpg)