Solar Hydrogen Project Group Update 14 th July 2009.
30
Solar Hydrogen Project Group Update 14 th July 2009
-
date post
20-Dec-2015 -
Category
Documents
-
view
217 -
download
1
Transcript of Solar Hydrogen Project Group Update 14 th July 2009.

Solar Hydrogen Project
Group Update
14th July 2009

Progress
To Do- efficiency trade off between PEC inputs / outputs (with SD - maybe Zachari?)- costs of prototype (with CC) and costing down exercise- review the model methodology (with Adam Hawkes)- economics of storage (mostly from literature at the moment)

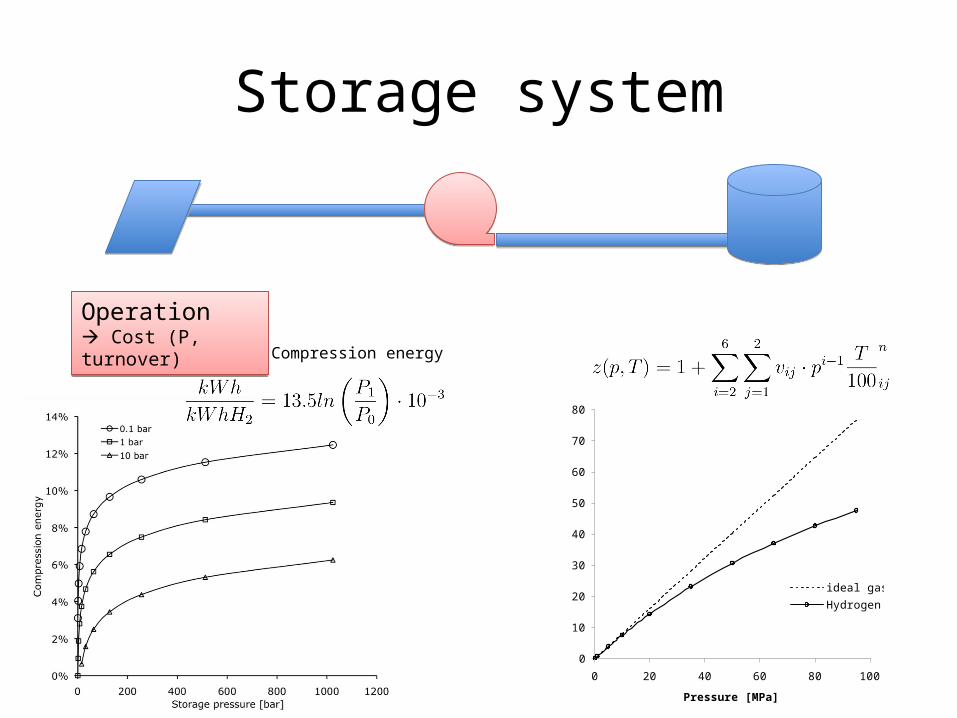
Storage system
PECProduction rate
Compressor Cost (ΔP,KW)
Tank Cost (P,Capacity)
Installation Cost (V, A, P?)
Operation Cost (P, turnover)

Storage system
Tank Cost (P,Capacity)
Thermal Storage Capacity [kWh]
0 kWh
10 kWh
20-40 kWh
Net
Pre
sent
Val
ue [£
]Initial model prediction:Limited benefit above 40 kWhe
Tank diameter 0.83 m
“Worst case”- Half annual demand <1500 kWhe
- Hydrogen equivalent: 11.1 m3 @ 20 MPa- Tank diameter: 2.7 m

Storage system
PECProduction rate
Tank Cost (P,Capacity)
0
5
10
15
20
25
30
35
40
45
0 20 40 60
Pressure [MPa]
Cost
[£/k
Wh
]
Higher pressure increased embrittlement
Storage system
Operation Cost (P, turnover)Operation Cost (P, turnover)
Compression energy
0
10
20
30
40
50
60
70
80
0 20 40 60 80 100
Pressure [MPa]
Den
sit
y [
kg
m-3
]
ideal gas
Hydrogen

Storage system
Compressor Cost (ΔP,KW)Compressor Cost (ΔP,KW)
Literature figures:<10 kW >6600 $ kW−1 >250kW <1000 $ kW−1
Usually based on large scale systems Power dominant over pressure
For small systems, maximum pressure assumed to be critical, but no reliable figures in literature.Any experts????
Model assumption: 10 £ MPa-1
Installation Cost (V, A, P?)
Installation Cost (V, A, P?)
Land cost factor 300 £ m-2
Installation cost 650 £ m-3

Optimum Storage Pressure
-
0.5
1.0
1.5
2.0
2.5
3.0
3.5
4.0
4.5
0 10 20 30
Pressure [MPa]
Cost
[k£
]
100 kWh50 kWh10 kWhMinSeries5Series6
H2 Specific Energy 33.3 kWh/kgR 8.314472 J K^-1 mol-1H2 atomic weight 1.00794 g mol^-1T 300 K
Tank capacity 10 kWh /dayAverage daily turnover 100%Total Energy stored 36500 kWh
Economic life 10 yearsIRR 10%Discount factor 6.14Energy price 0.1 £ / kWh
Generation Pressure 0.1 MpaStorage Pressure 20 Mpa
CapEx parametersLand cost factor 300 £ m^-2Installation cost 650 £ m^-3Tank cost 96.31 £Compressor 10 £ /Mpa
OpExCompression Energy 7%Cost to compress 160.42 £
Tank capacity 0.30 kg H2Tank volume 0.04 m^3Tank diameter 0.41 mTank area (+ 25% contingency) 0.17 m^2
Cost of land 50.48 £Cost of installation 24.15 £
Total cost 235.06 £

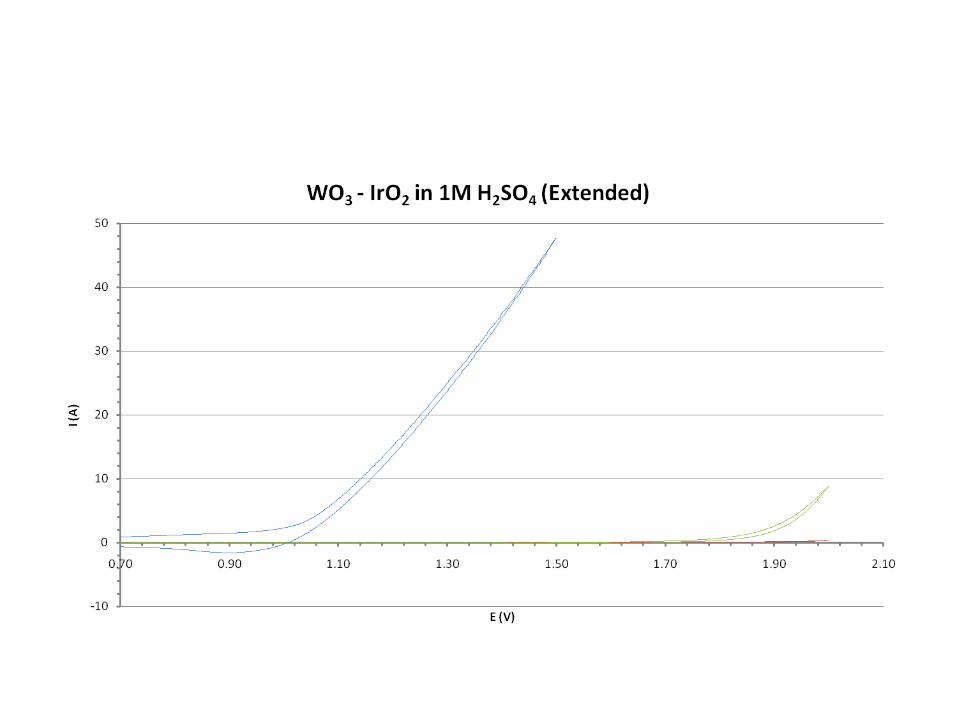
IrO2 Deposition
• Tried electrodepositing Ir on WO3
• Heat treatment increases current remarkably
• Cannot conclude whether heat treatment affect WO3 or Ir

Solar Hydrogen Project: SD
• Fe2O3 work:
– Steph/Monica: material produced by ultra-sonic spray pyrolysis
– Comparative study of different types of Fe2O3:
• EPFL CVD (new samples received)• EPFL USP (from Monica)• Hydrogen Solar spray pyrolysis• other?

Solar Hydrogen Project: SD
• The following slides were added post-meeting. Data for:
– EPFL CVD (old sample): photocurrent-potential plots, showing large increase with chopping frequency. (Due to ?)
– HS SP (poor performing): photocurrent-potential plot shows increase in photocurrent due to greater contribution from the transient photocurrent at short times. (NB: real current density has not been calculated.)

Fe2O3: HS (poor!)
-5.0E-05
0.0E+00
5.0E-05
1.0E-04
1.5E-04
2.0E-04
2.5E-04
-0.5 -0.25 0 0.25 0.5 0.75 1
Potential vs qre / Volt
cd /
Acm
-2
Dark 450 nm

Fe2O3: HS Photocurrent-potential
-5.0E-07
0.0E+00
5.0E-07
1.0E-06
1.5E-06
2.0E-06
2.5E-06
3.0E-06
-0.5 -0.25 0 0.25 0.5 0.75 1
Potential vs qre / Volt
Ph
oto
curr
ent
den
sit
y /
Acm
-2
87 Hz 279 Hz
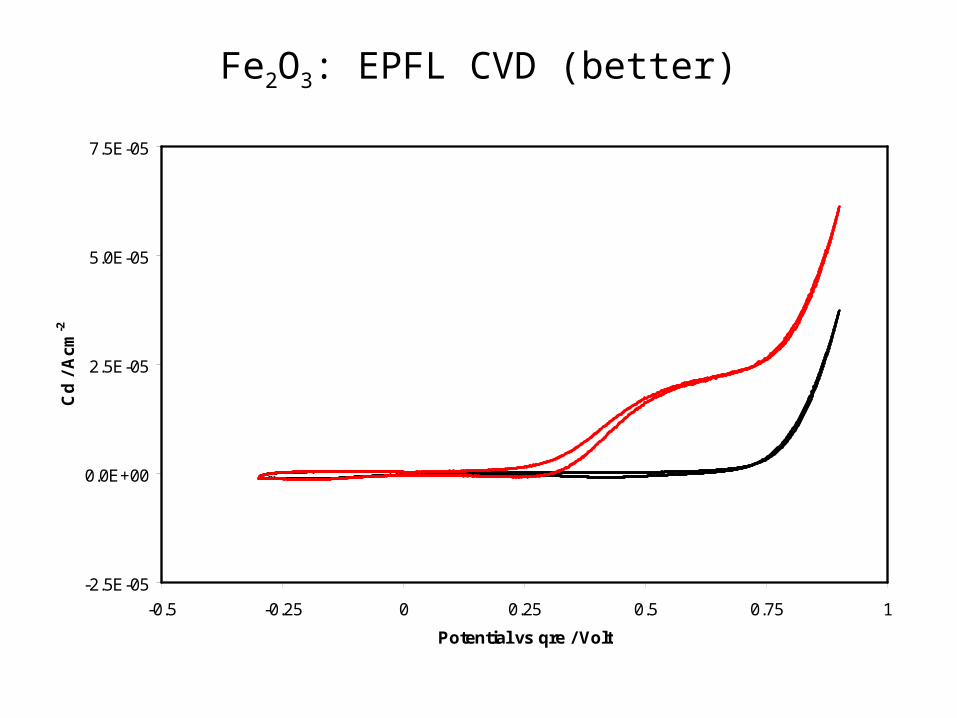
Fe2O3: EPFL CVD (better)
-2.5E-05
0.0E+00
2.5E-05
5.0E-05
7.5E-05
-0.5 -0.25 0 0.25 0.5 0.75 1
Potential vs qre / Volt
Cd
/ A
cm
-2

Fe2O3: EPFL Photocurrent-potential
0
0.025
0.05
0.075
0.1
0.125
0.15
-0.5 -0.25 0 0.25 0.5 0.75 1
Potential vs qre / Volt
Ph
oto
curr
ent
den
sity
/ A
rb U
nit
s
87 Hz 279 Hz

FZ update
• Membrane Permeation and selectivity study
• Update on sartorius reactor fittings/ tubing


Modeling of Photocatalytic Reactors
Zachary Ulissi
Steve Dennison
Geoff Kelsall
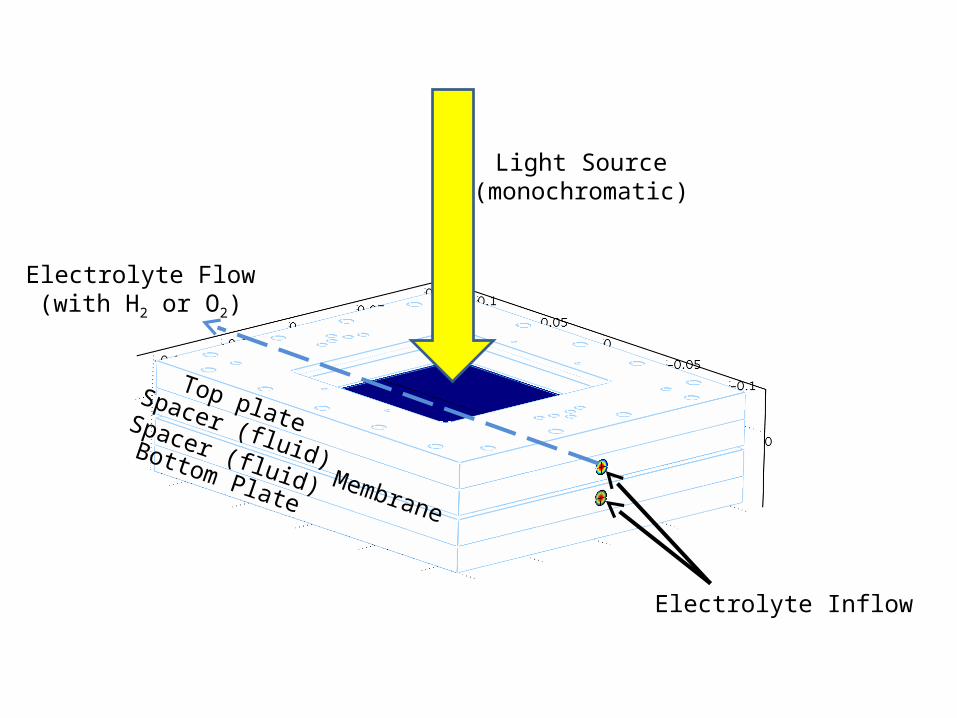
Top plateSpacer (fluid)Spacer (fluid)Bottom Plate
Membrane
Electrolyte Inflow
Electrolyte Flow(with H2 or O2)
Light Source(monochromatic)

Mesh Cathode
Electrolyte Inflow
Electrolyte Flow(with H2 or O2)
Photo-Anode
MembraneFluid ChamberFluid Chamber

Mesh Cathode(Conductor)
Membrane
Photo-Anode
Absorption, α e-h+
2e
2H+
H2
+
Diffusion
Kinetics
Fluid Flow+Diffusion
Diffusion
Fluid Flow+Diffusion
H2O+ 2H+O2
Kinetics
Absorption,Diffusion (2),Band Bending
Electrolyte Flow(if laminar)(1)
(1)
(2)
(2)
(3)
(3)
(4?)


log(
Velo
city
/ C
ente
rline
Vel
ocity
)
log(Velocity / Centerline Velocity)Flow=3.5ml/min

log(
Velo
city
/ C
ente
rline
Vel
ocity
)
log(Velocity / Centerline Velocity)Flow=3.5ml/min → 700ml/minLaminar → Turbulent at ≈200ml/min

log(Velocity / Centerline Velocity)Flow=300ml/min

Next Steps
• Determine whether inlet corners should be removed
• Couple diffusion in flow to constant flux on surfaces
• Identify approximate rates of diffusion of e/h and degree of band bending in photo-anode
• Approximate kinetics of surface reactions (most difficult portion)