Solar 101 Presented by: Massachusetts Clean Energy Center June 12, 2012
40
Solar 101 Presented by: Massachusetts Clean Energy Center June 12, 2012 “Installing a solar PV system is a terrific investment, and of course it is a good thing to do for the earth. Once you become familiar with the economics, it is a no-brainer.” – Resident, Hatfield, MA
-
Upload
buffy-floyd -
Category
Documents
-
view
23 -
download
1
description
Solar 101 Presented by: Massachusetts Clean Energy Center June 12, 2012 “Installing a solar PV system is a terrific investment, and of course it is a good thing to do for the earth. Once you become familiar with the economics, it is a no-brainer.” Resident, Hatfield, MA. Agenda. - PowerPoint PPT Presentation
Transcript of Solar 101 Presented by: Massachusetts Clean Energy Center June 12, 2012
Solar 101
Presented by:Massachusetts Clean Energy Center
June 12, 2012
“Installing a solar PV system is a terrific investment, and of course it is a good thingto do for the earth. Once you become familiar with the economics, it is a no-brainer.”
– Resident, Hatfield, MA
2
Agenda• Why are we here?• Solar PV Basics• Goals/Structure of Solarize Massachusetts• Solar PV Incentives and Financials• Getting Started
3
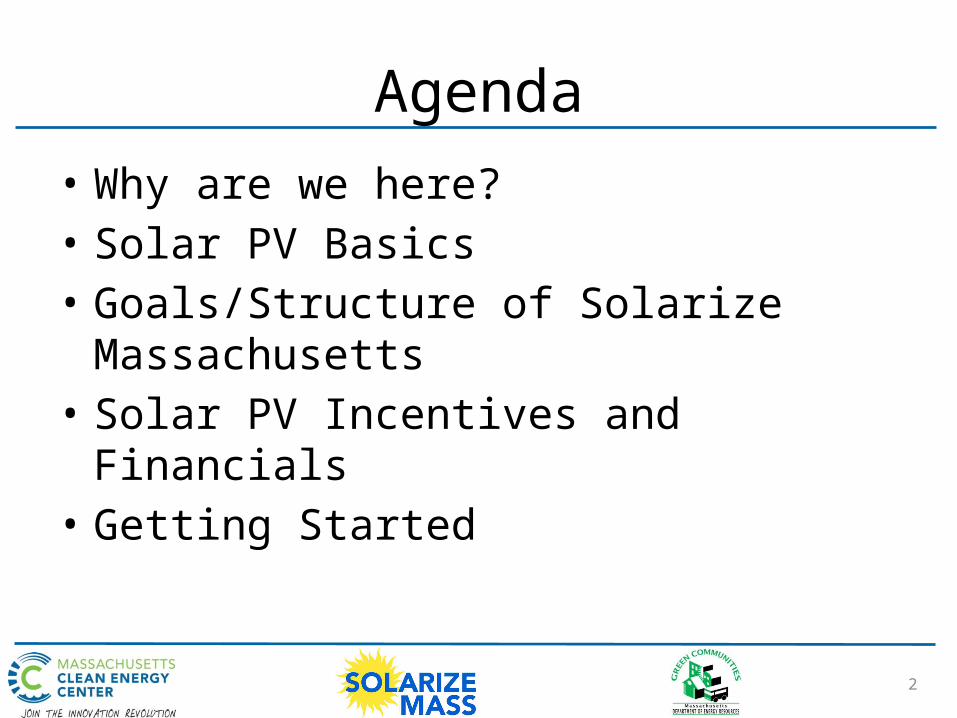
Why are we here: Environment
From 1990 to 2006, MA averaged 100 deaths per year from asthmaSource: MA DPH
Statewide Fish Advisory: Safe Eating Guidelines: “…for pregnant women, women who may become pregnant, nursing mothers and children under 12 years old: Do Not Eat: Freshwater fish caught in streams, rivers, lakes, and ponds in MA”

4
Why Are We Here: Economics
Years
Cost
of E
lect
ricity
($/k
Wh)
1 2 3 4 5 6 7 8 9 10 11 12 13 14 15 16 17 18 19 20 $-
$0.05
$0.10
$0.15
$0.20
$0.25
$0.30
Electricity Prices
PV after Incentives
PV before Incentives
5
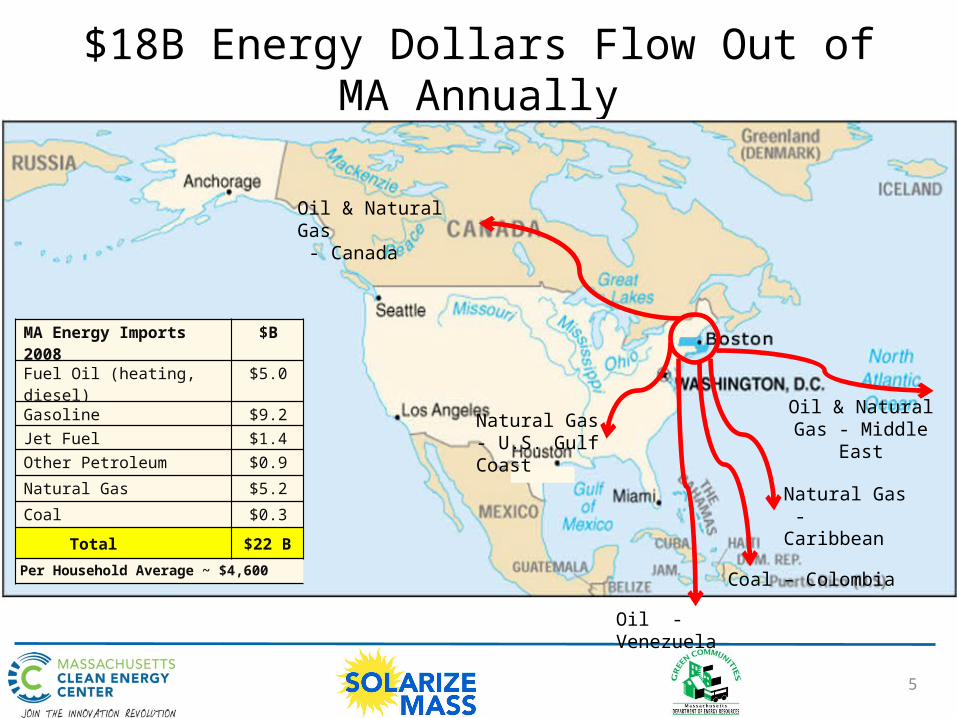
$18B Energy Dollars Flow Out of MA Annually
Oil & Natural Gas - Canada
Oil - Venezuela
Oil & Natural Gas - Middle East
Coal – Colombia
MA Energy Imports 2008
$B
Fuel Oil (heating, diesel) $5.0
Gasoline $9.2
Jet Fuel $1.4
Other Petroleum $0.9
Natural Gas $5.2
Coal $0.3
Total $22 B
Per Household Average ~ $4,600
Natural Gas - Caribbean
Natural Gas - U.S. Gulf Coast
6
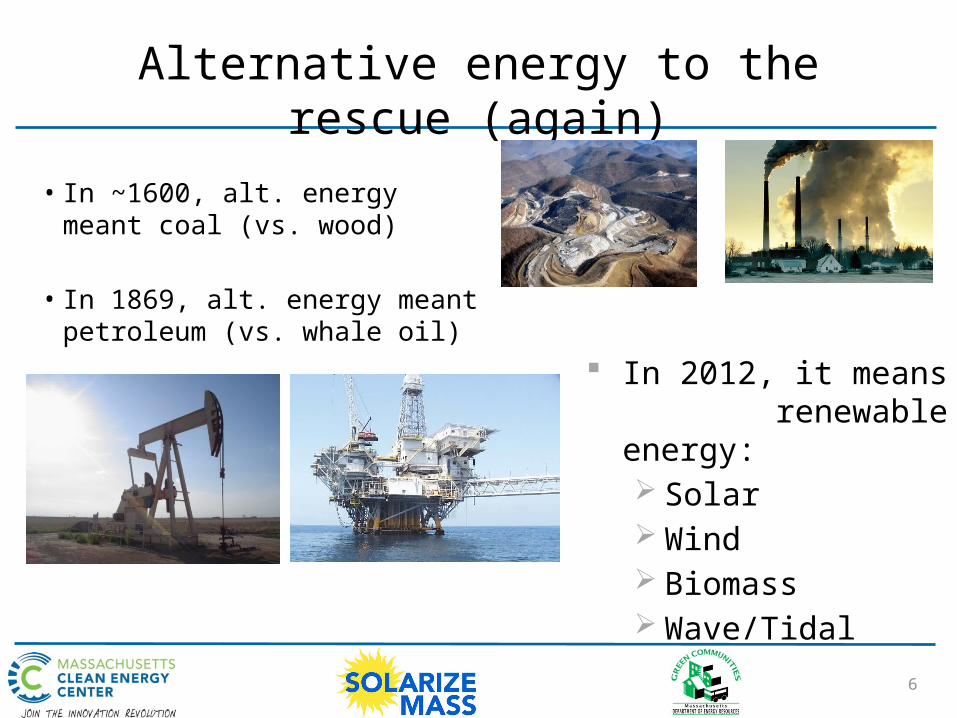
Alternative energy to the rescue (again)
• In ~1600, alt. energy meant coal (vs. wood)
• In 1869, alt. energy meant petroleum (vs. whale oil)
In 2012, it means renewable energy: Solar Wind Biomass Wave/Tidal
7
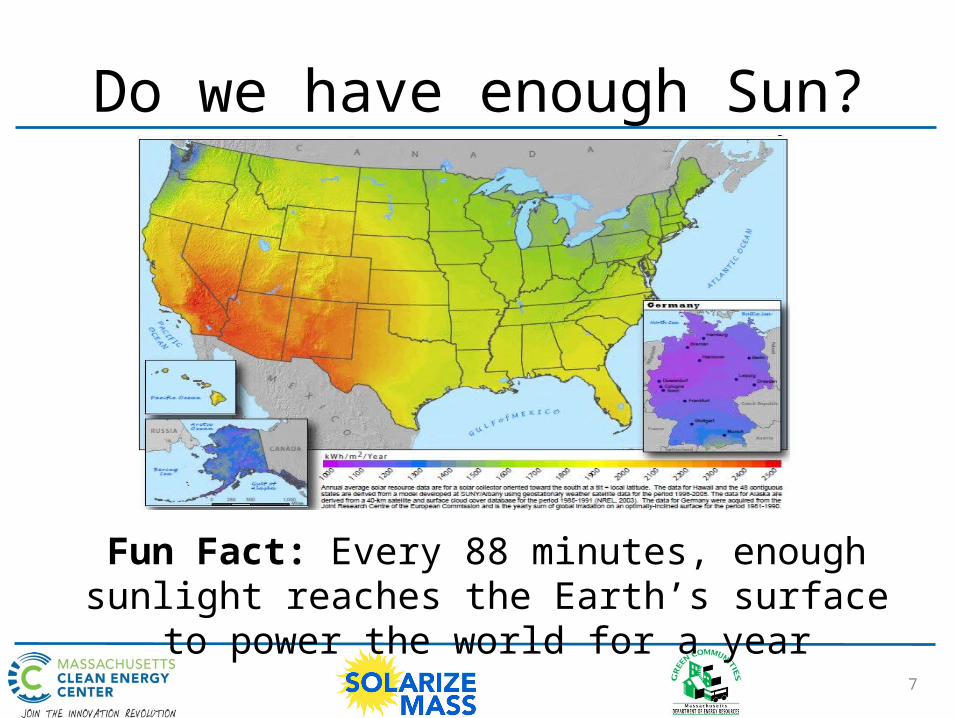
Do we have enough Sun?
Fun Fact: Every 88 minutes, enough sunlight reaches the Earth’s surface to power the world for a year

8
Agenda• Why are we here?• Solar PV Basics• Goals/Structure of Solarize Massachusetts• Solar PV Incentives and Financials• Getting Started
9
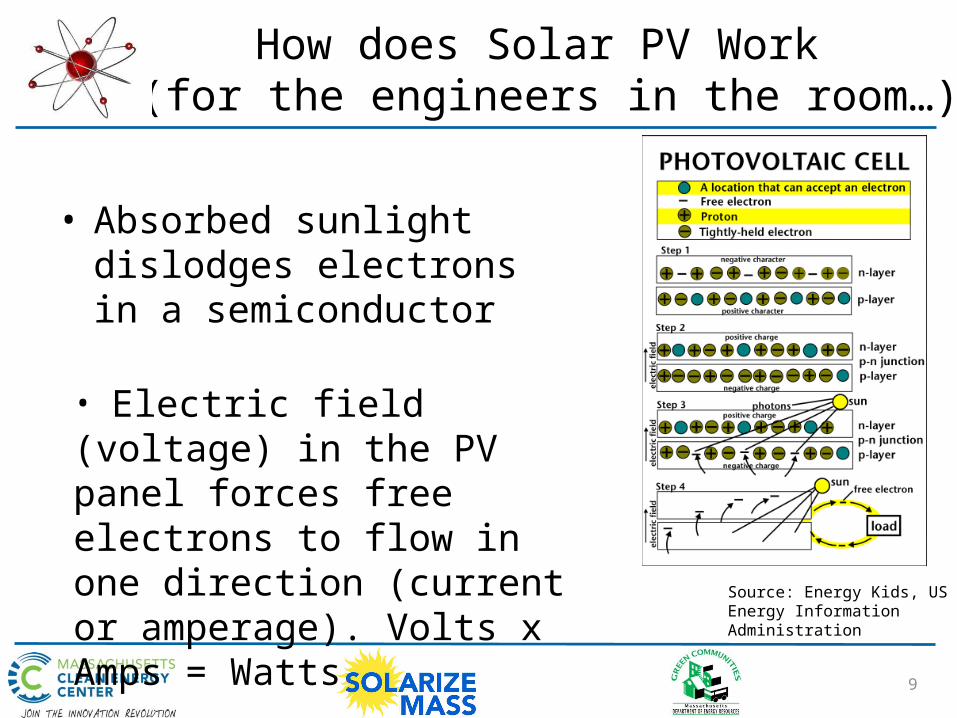
• Absorbed sunlight dislodges electrons in a semiconductor
How does Solar PV Work (for the engineers in the room…)
Source: Energy Kids, US Energy Information Administration
• Electric field (voltage) in the PV panel forces free electrons to flow in one direction (current or amperage). Volts x Amps = Watts

10
Kilowatts vs. Kilowatt-hours
• PV system size is measured in kilowatts– 1,000 watts = 1 kilowatt (kW)
• Electricity use measured in kilowatt-hours– 100 watt light bulb left on for 10 hours uses 1,000
watt-hours (1 kWh)
• Average Massachusetts home uses 8,004 kWh per year (EIA, 2010)
11
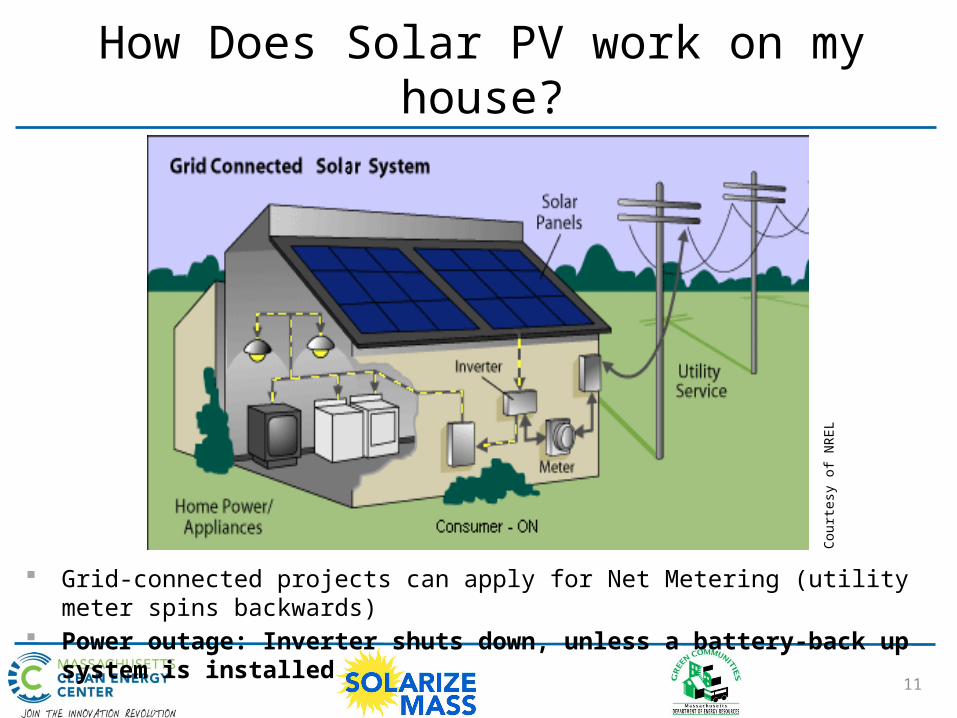
How Does Solar PV work on my house?
Grid-connected projects can apply for Net Metering (utility meter spins backwards)
Power outage: Inverter shuts down, unless a battery-back up system is installed
Cour
tesy
of N
REL
1212
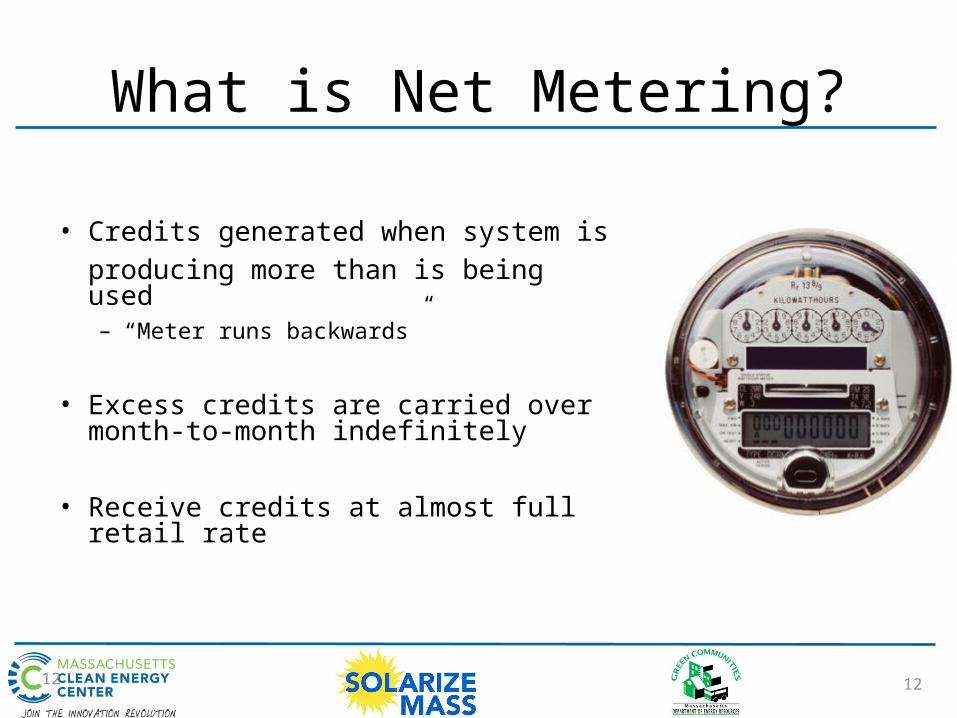
What is Net Metering?
• Credits generated when system is producing more than is being used– “Meter runs backwards”
• Excess credits are carried over month-to-month indefinitely
• Receive credits at almost full retail rate

13
How big a system do I need?• Electricity bill shows summary of
prior year’s consumption
• Incentives are designed for systems sized ≤ load
• Efficiency or lower energy use allows for a smaller system!
Back of the Envelope Calculation: 1 kW PV = approximately 1,200 kWh/year
14
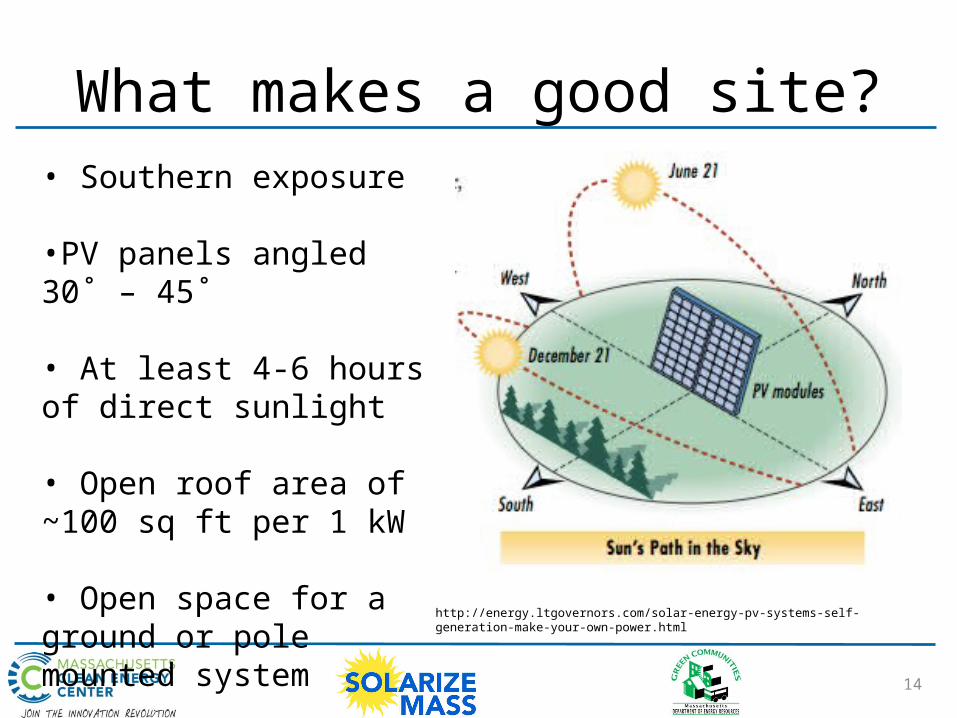
What makes a good site?
http://energy.ltgovernors.com/solar-energy-pv-systems-self-generation-make-your-own-power.html
• Southern exposure
•PV panels angled 30˚ – 45˚
• At least 4-6 hours of direct sunlight
• Open roof area of ~100 sq ft per 1 kW
• Open space for a ground or pole mounted system

15
Shading of Solar PV Systems• Initial site feasibility can be
determined online through aerial images
• Shading can significantly reduce the output of a system, changing the financials of a project
• Installer is the expert in determining feasibility
16
What to do with a Non-Feasible Site
• Consider energy efficiency– www.MassSave.com
• Other renewable energy technologies– Solar Hot Water (
www.masscec.com/solarhotwater)– Geothermal– Biomass
• Community Solar Projects• Help us spread the word about Solarize Mass
17
Agenda
• Why are we here?• Solar PV Basics• Goals/Structure of Solarize Massachusetts• Solar PV Incentives and Financials• Getting Started
18
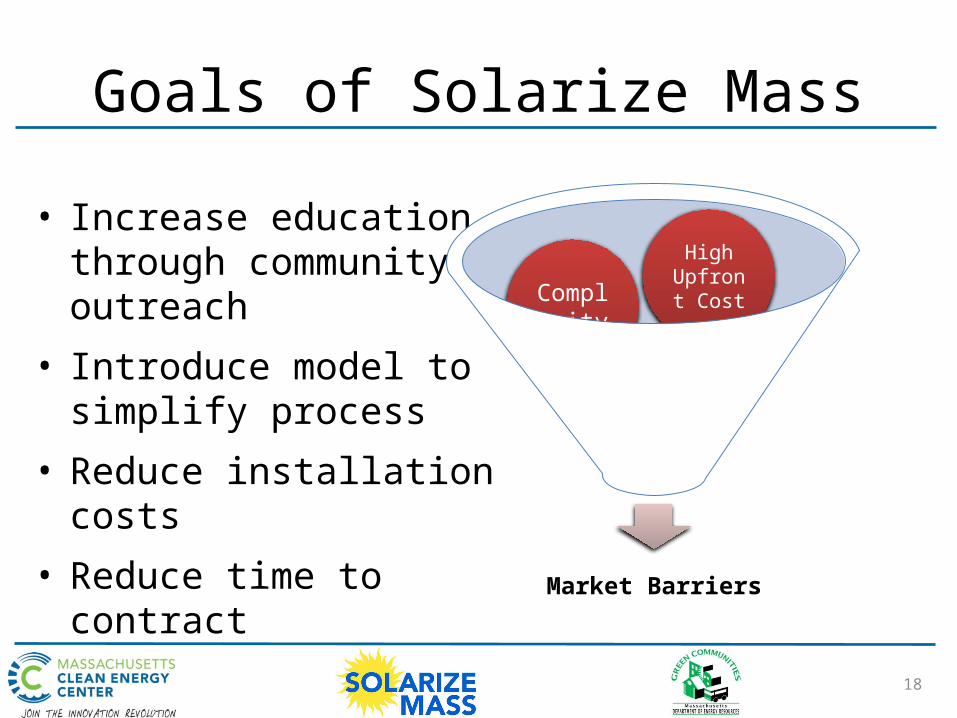
Goals of Solarize Mass
• Increase education through community outreach
• Introduce model to simplify process
• Reduce installation costs
• Reduce time to contract
Market Barriers
Customer
Inertia
Complexity
High Upfront Cost
19
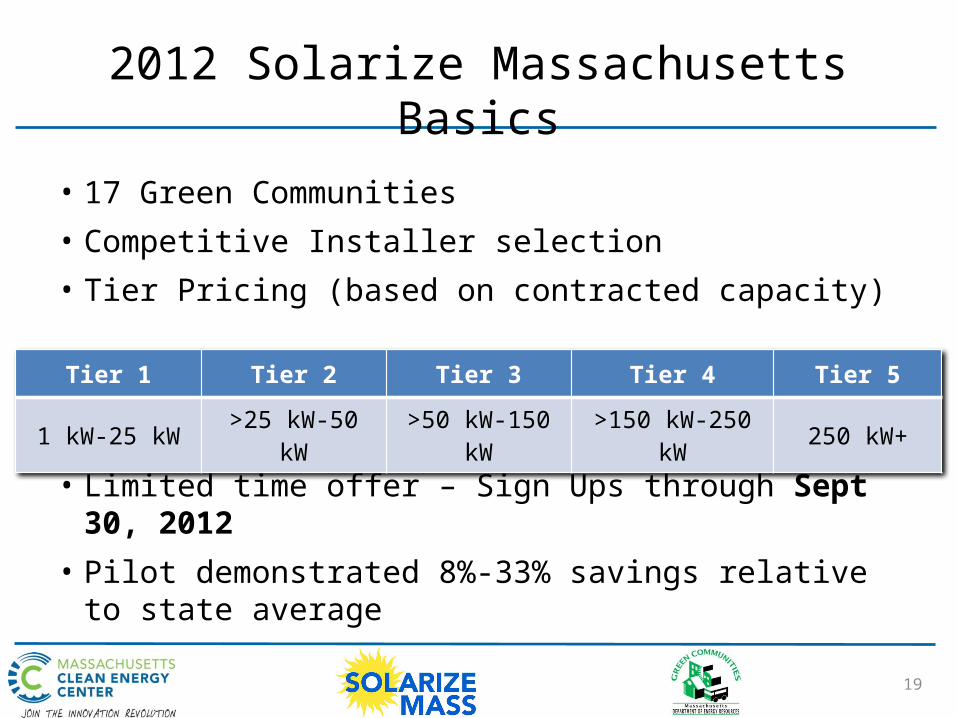
2012 Solarize Massachusetts Basics
• 17 Green Communities• Competitive Installer selection• Tier Pricing (based on contracted capacity)
• Limited time offer – Sign Ups through Sept 30, 2012
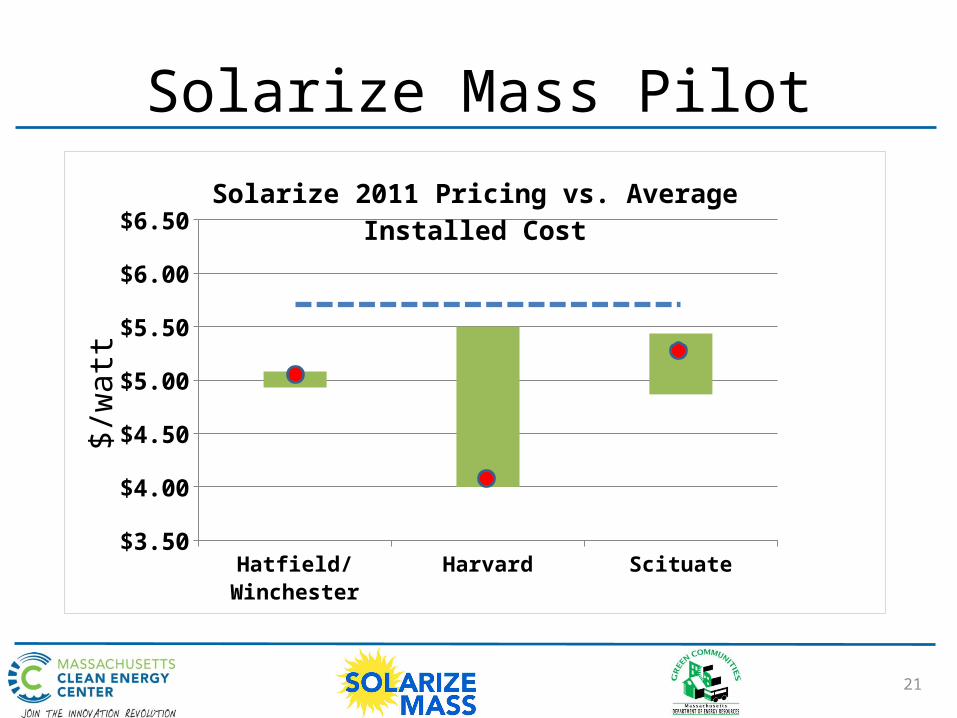
• Pilot demonstrated 8%-33% savings relative to state average
Tier 1 Tier 2 Tier 3 Tier 4 Tier 5
1 kW-25 kW >25 kW-50 kW >50 kW-150 kW >150 kW-250 kW 250 kW+
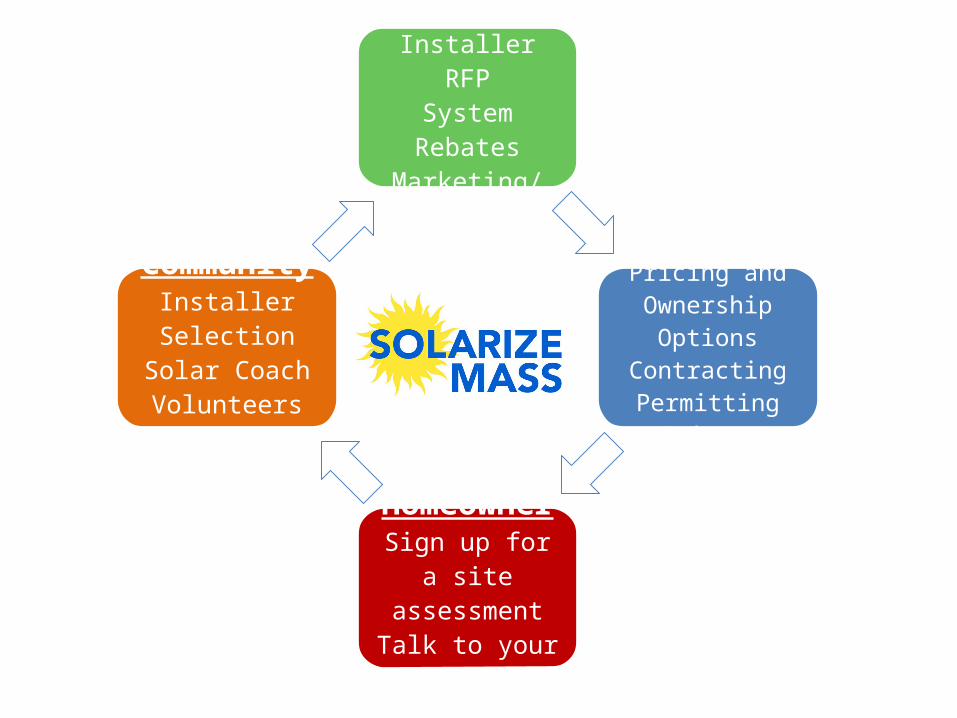
MassCECInstaller RFP
System RebatesMarketing/Education
InstallerFree Site
AssessmentsTiered Pricing and
Ownership Options
ContractingPermitting
Rebate ApplicationInstallation
Interconnection
HomeownerSign up for a site
assessmentTalk to your neighbors!
CommunityInstaller Selection
Solar CoachVolunteersOutreach
21
Solarize Mass Pilot
Hatfield/Winchester
Harvard Scituate$3.50
$4.00
$4.50
$5.00
$5.50
$6.00
$6.50Solarize 2011 Pricing vs. Average Installed Cost
$/w
att
22
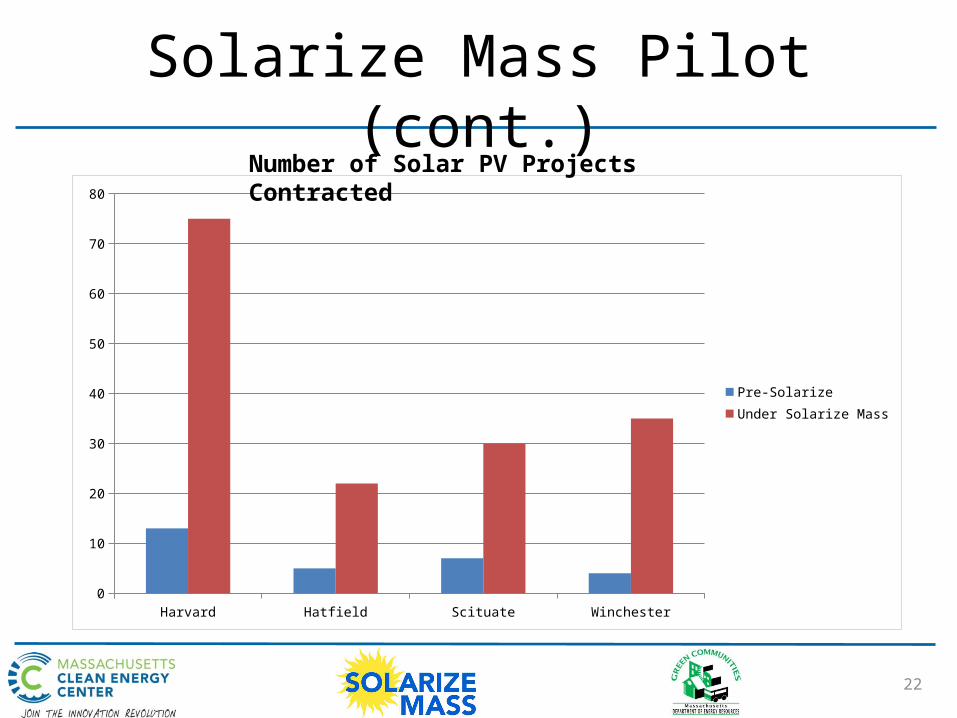
Solarize Mass Pilot (cont.)
Harvard Hatfield Scituate Winchester0
10
20
30
40
50
60
70
80
Pre-SolarizeUnder Solarize Mass
Number of Solar PV Projects Contracted
23
Agenda
• Why are we here?• Solar PV Basics• Goals/Structure of Solarize Massachusetts• Solar PV Incentives and Financials• Getting Started

24
Solar PV Incentives and Finance• Strong Policy Framework– Gov. Patrick goal of 250 MW
solar by 2017
– 2008 Global Warming Solutions Act
– 2008 Green Communities Act

25
Residential Project Trends
2002 2003 2004 2005 2006 2007 2008 2009 2010 20110
2
4
6
8
10
12
14
0
200
400
600
800
1000
1200
1400
1600
1800
2000
# ProjectsAverage Project Cost
Ave
rage
Cos
t ($/
Watt
)

26
Ownership Models
• Outright purchase• Power Purchase Agreement (PPA)• Lease
Referred to as 3rd Party Ownership
27
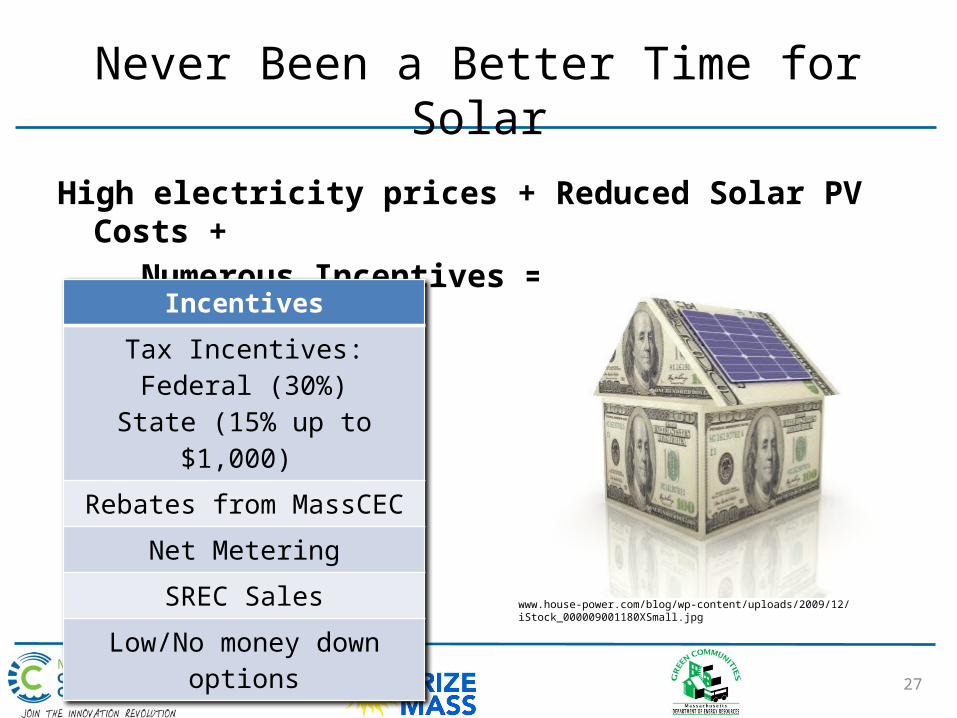
Never Been a Better Time for Solar
High electricity prices + Reduced Solar PV Costs +Numerous Incentives = Economical solar projects
Incentives
Tax Incentives:Federal (30%)
State (15% up to $1,000)
Rebates from MassCEC
Net Metering
SREC Sales
Low/No money down optionswww.house-power.com/blog/wp-content/uploads/2009/12/iStock_000009001180XSmall.jpg
28
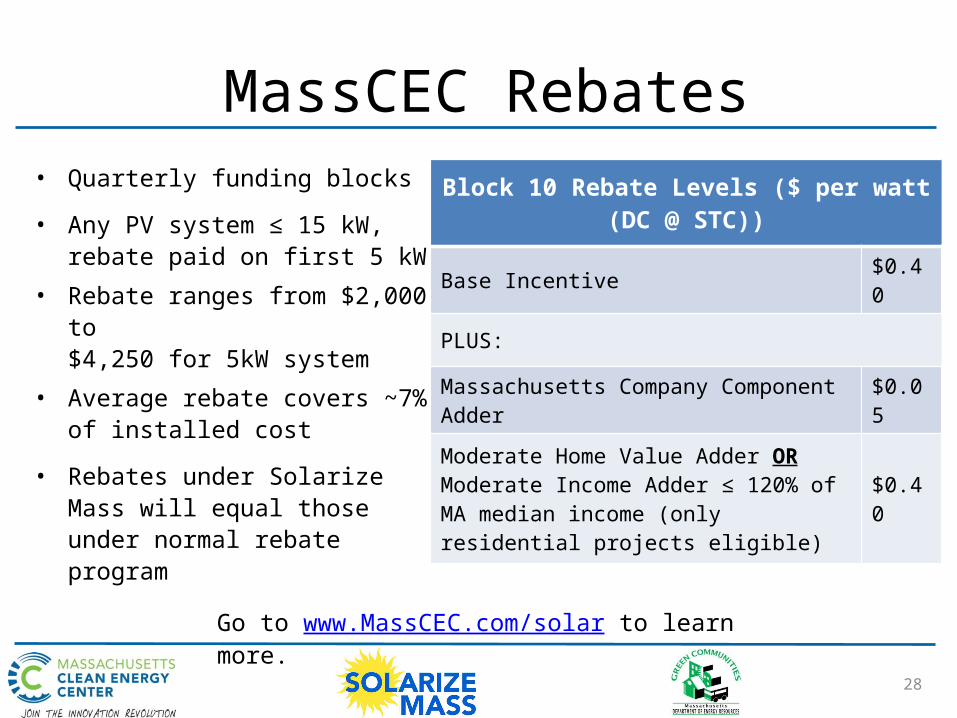
• Quarterly funding blocks
• Any PV system ≤ 15 kW, rebate paid on first 5 kW
• Rebate ranges from $2,000 to $4,250 for 5kW system
• Average rebate covers ~7% of installed cost
• Rebates under Solarize Mass will equal those under normal rebate program
MassCEC Rebates
Block 10 Rebate Levels ($ per watt (DC @ STC))
Base Incentive $0.40
PLUS:
Massachusetts Company Component Adder $0.05
Moderate Home Value Adder OR Moderate Income Adder ≤ 120% of MA median income (only residential projects eligible)
$0.40
Go to www.MassCEC.com/solar to learn more.
29
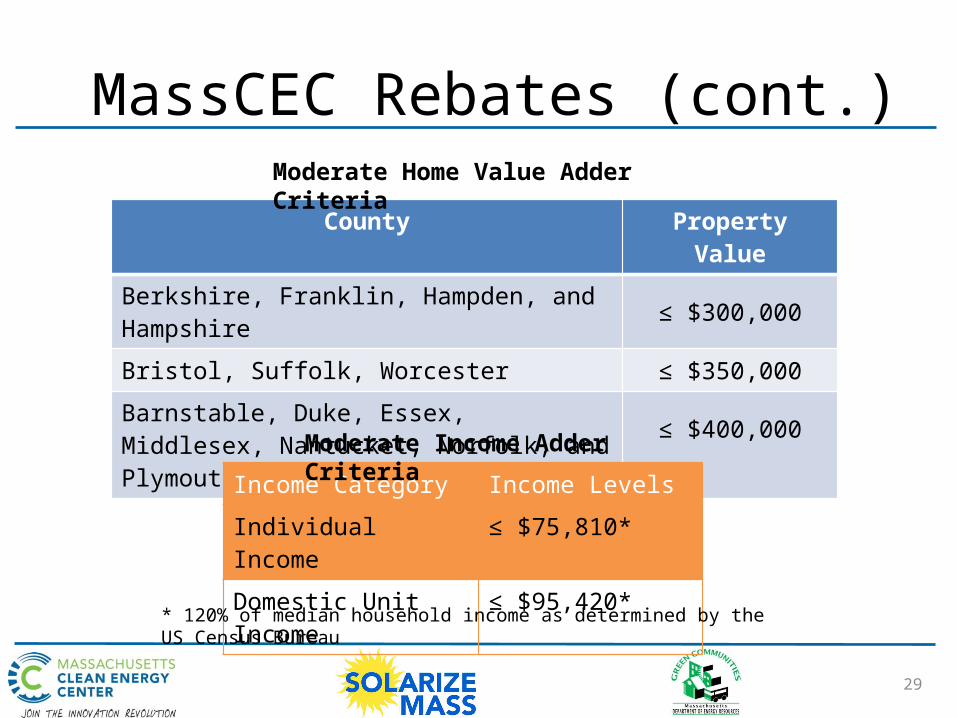
MassCEC Rebates (cont.)
County Property ValueBerkshire, Franklin, Hampden, and Hampshire ≤ $300,000Bristol, Suffolk, Worcester ≤ $350,000Barnstable, Duke, Essex, Middlesex, Nantucket, Norfolk, and Plymouth
≤ $400,000
Income Category Income Levels
Individual Income ≤ $75,810*
Domestic Unit Income ≤ $95,420*
Moderate Home Value Adder Criteria
* 120% of median household income as determined by the US Census Bureau
Moderate Income Adder Criteria
30
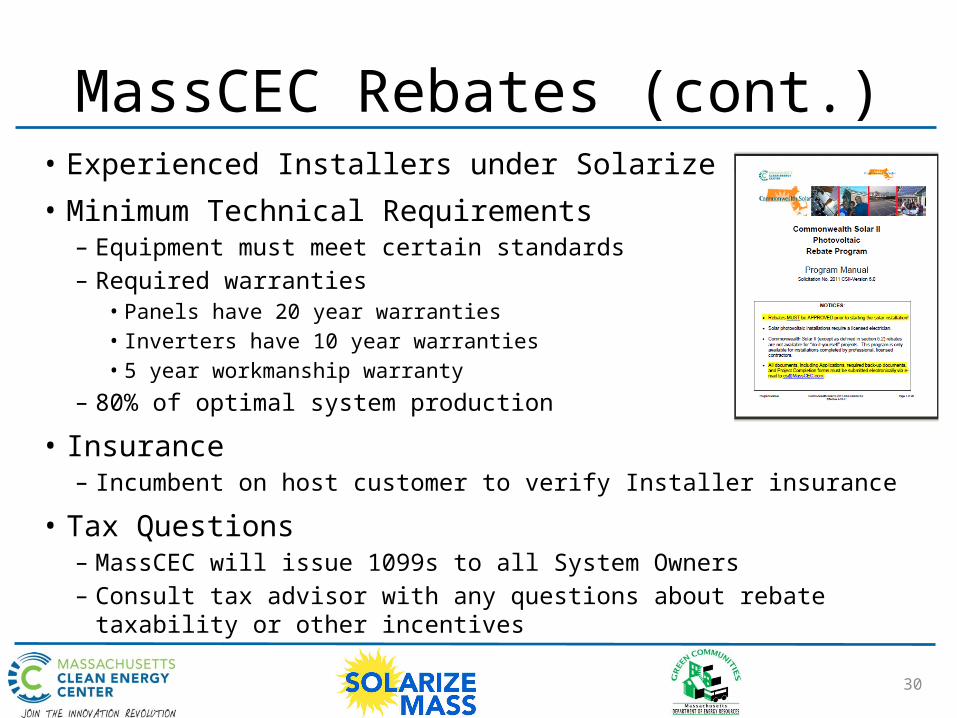
• Experienced Installers under Solarize Mass
• Minimum Technical Requirements– Equipment must meet certain standards– Required warranties
• Panels have 20 year warranties• Inverters have 10 year warranties• 5 year workmanship warranty
– 80% of optimal system production
• Insurance– Incumbent on host customer to verify Installer insurance
• Tax Questions– MassCEC will issue 1099s to all System Owners– Consult tax advisor with any questions about rebate taxability or other
incentives
MassCEC Rebates (cont.)

31
Solar Renewable Energy Certificates (SRECs)
Electricity Pathway
• Electrons from all generation sources are physically the same
• Cannot be tracked independently on the grid
SRECs Pathway
• SRECs represent the “green” attributes of the renewable generation source
• Utilities are required to purchase SRECs every year
• 1 SREC = 1,000 kWh
• Verified SRECs ensure that only one buyer can claim each SREC
Electricity and SRECs can be, and often are, sold
separately

32
SRECs (cont)
• Not as complicated as it sounds: Small-scale project owners will work with SREC aggregators or brokers to sell SRECs to utilities
• Projects installed in 2012 will be eligible to sell SRECs for 10 years
• SRECs generally sell between $285 - $550/SREC
• Monthly production reported to MassCEC’s Production Tracking System (PTS)

33
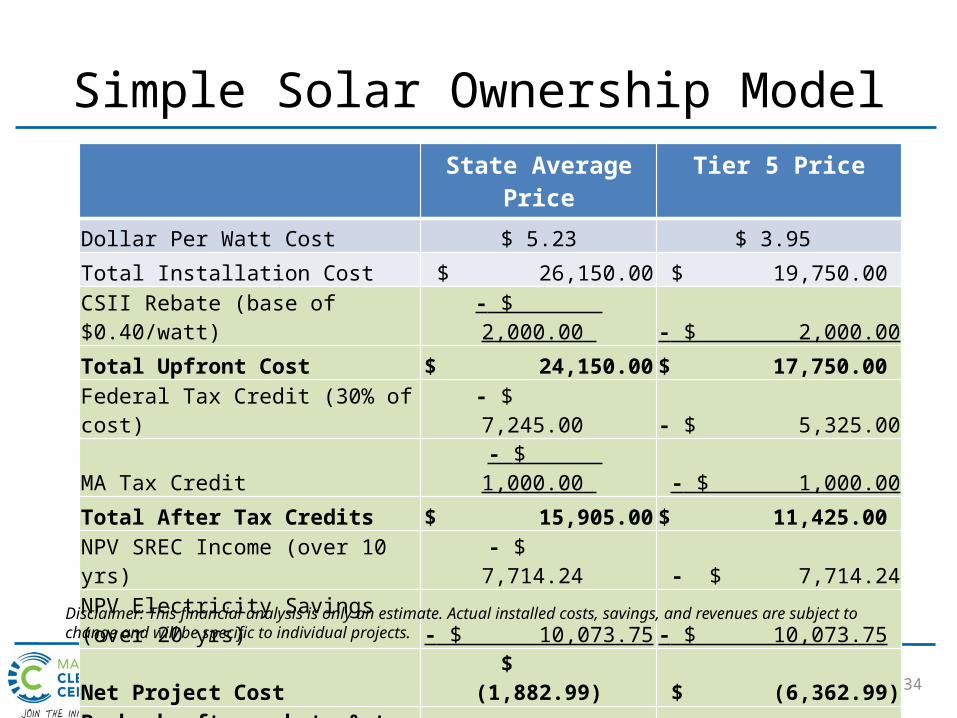
* Assumes qualification for the base rebate incentive and is eligible for federal and state tax incentives.
Disclaimer: This financial analysis is only an estimate. Actual installed costs, savings, and revenues are subject tochange and will be specific to individual projects.
Assumptions: Simple Solar Ownership ModelAssumptions
Size: 5 kW (5,000 watts)
Panel Degradation: 1% Annually
Electricity Price: $0.15/kWh
Electricity Price Escalator: 3% Annually
Life of System: 20 years
SREC Value: $285.00
Timeline for SREC Sales: 10 years
Income Tax Rate: 28%
Discount Rate: 7.5%
34
State Average Price Tier 5 Price
Dollar Per Watt Cost $ 5.23 $ 3.95
Total Installation Cost $ 26,150.00 $ 19,750.00
CSII Rebate (base of $0.40/watt) - $ 2,000.00 - $ 2,000.00
Total Upfront Cost $ 24,150.00 $ 17,750.00
Federal Tax Credit (30% of cost) - $ 7,245.00 - $ 5,325.00
MA Tax Credit - $ 1,000.00 - $ 1,000.00
Total After Tax Credits $ 15,905.00 $ 11,425.00
NPV SREC Income (over 10 yrs) - $ 7,714.24 - $ 7,714.24
NPV Electricity Savings (over 20 yrs) - $ 10,073.75 - $ 10,073.75
Net Project Cost $ (1,882.99) $ (6,362.99)
Payback after rebate & tax credits 7-8 years 5-6 years
Simple Solar Ownership Model
Disclaimer: This financial analysis is only an estimate. Actual installed costs, savings, and revenues are subject to change and will be specific to individual projects.
35
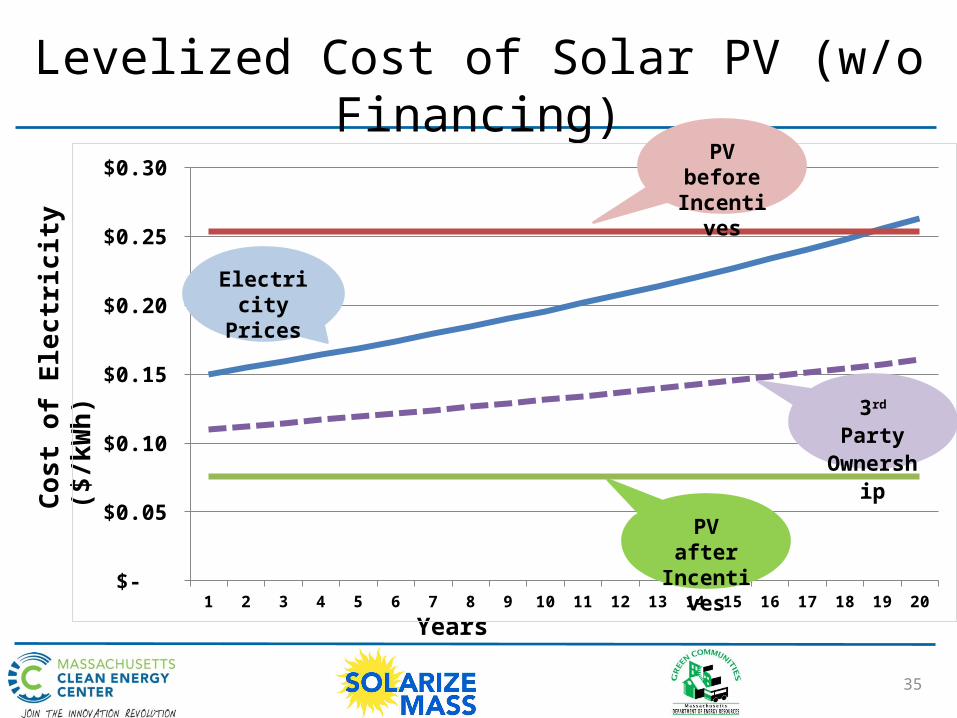
Levelized Cost of Solar PV (w/o Financing)
Years
Cost
of E
lect
ricity
($/k
Wh)
1 2 3 4 5 6 7 8 9 10 11 12 13 14 15 16 17 18 19 20 $-
$0.05
$0.10
$0.15
$0.20
$0.25
$0.30
3rd Party Ownership
Electricity Prices
PV after Incentives
PV before Incentives

36
Levelized Cost of Solar PV (w/ 5% Financing)
1 2 3 4 5 6 7 8 9 10 11 12 13 14 15 16 17 18 19 20 $-
$0.05
$0.10
$0.15
$0.20
$0.25
$0.30
$0.35
Cost
of E
lect
ricity
($/k
Wh)
Years
Electricity Prices
PV after Incentives
PV before Incentives
3rd Party Ownership
37
Agenda
• Why are we here?• Solar PV Basics• Goals/Structure of Solarize Massachusetts• Solar PV Incentives and Financials• Getting Started
38
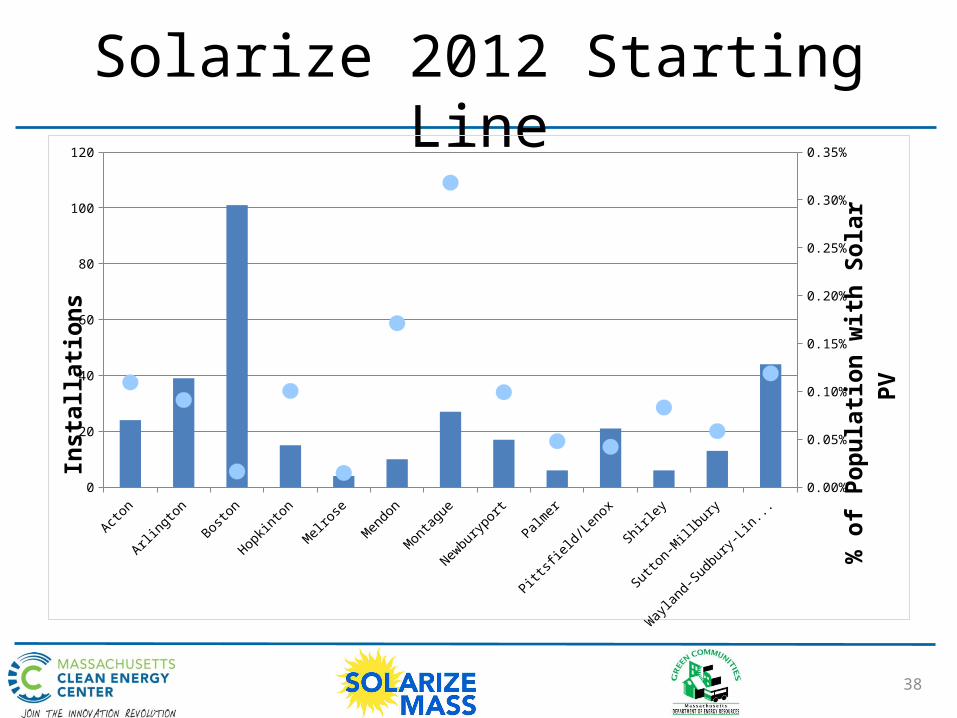
Solarize 2012 Starting Line
Acton
Arlingto
n
Boston
Hopkinton
Melrose
Mendon
Montague
Newburyp
ort
Palmer
Pittsfield
/Lenox
Shirle
y
Sutton-M
illbury
Way
land-Su
dbury-Lin
coln
0
20
40
60
80
100
120
0.00%
0.05%
0.10%
0.15%
0.20%
0.25%
0.30%
0.35%
Inst
alla
tions
% o
f Pop
ulati
on w
ith S
olar
PV

39
Next Steps• Sign up at www.SolarizeMass.com or with sign-up
sheet
• When selected, Installer will contact you about doing a free site assessment – Nothing is binding at this point
• Consider other options if solar PV is not feasible
• Tell your friends and neighbors!
40
Thank you!www.SolarizeMass.com
(617) 315-9306
MassCEC: [email protected]
Or
Solar Coach: [email protected]