SOL30 - RA2016 - 27 april EN
38
SOLUTIONS 30 Présentation de l’activité & des perspectives Janvier 2017 Gianbeppi Fortis, Président du Directoire 2016 ANNUAL RESULTS 27 APRIL 2017 Gianbeppi Fortis, Chairman of the Executive Board Jérôme Boillot, Chief Financial Officer 1
Transcript of SOL30 - RA2016 - 27 april EN

SOLUTIONS 30
Présentation de l’activité & des perspectivesJanvier 2017
Gianbeppi Fortis, Président du Directoire
2016 ANNUAL RESULTS2 7 A P R I L 2 0 1 7
Gianbeppi Fortis,
Chairman of the Executive Board
Jérôme Boillot,
Chief Financial Officer
1

Solutions for New Technologies
SOLUTIONS 30 IN BRIEF
Making the technological changes that constantly transform our
daily lives accessible to everyone
20%
people, including 2,700 employees & 1,000 freelancers
> 3,700
Mis
sion
30%
>15,000
2003
2
Key
figu
res
Creation of PC30, the in-home IT support specialist
average annual growth in turnover since 2007
of our business is outside France in: Benelux, Germany, Italy and Spain
service calls per day, 10 million since the founding of the company

Solutions for New Technologies
SOLID SKILLS BASE TO SERVESIX GROWTH SEGMENTS
INFORMATIQUE | TELECOM
SÉCURITÉ MONÉTIQUE ENERGIE OBJETS CONNECTÉS E-SANTÉ
B2B2B
B2B2C
3
SOLUTIONS 30 steps up the transition to all digital
Solutions for New Technologies
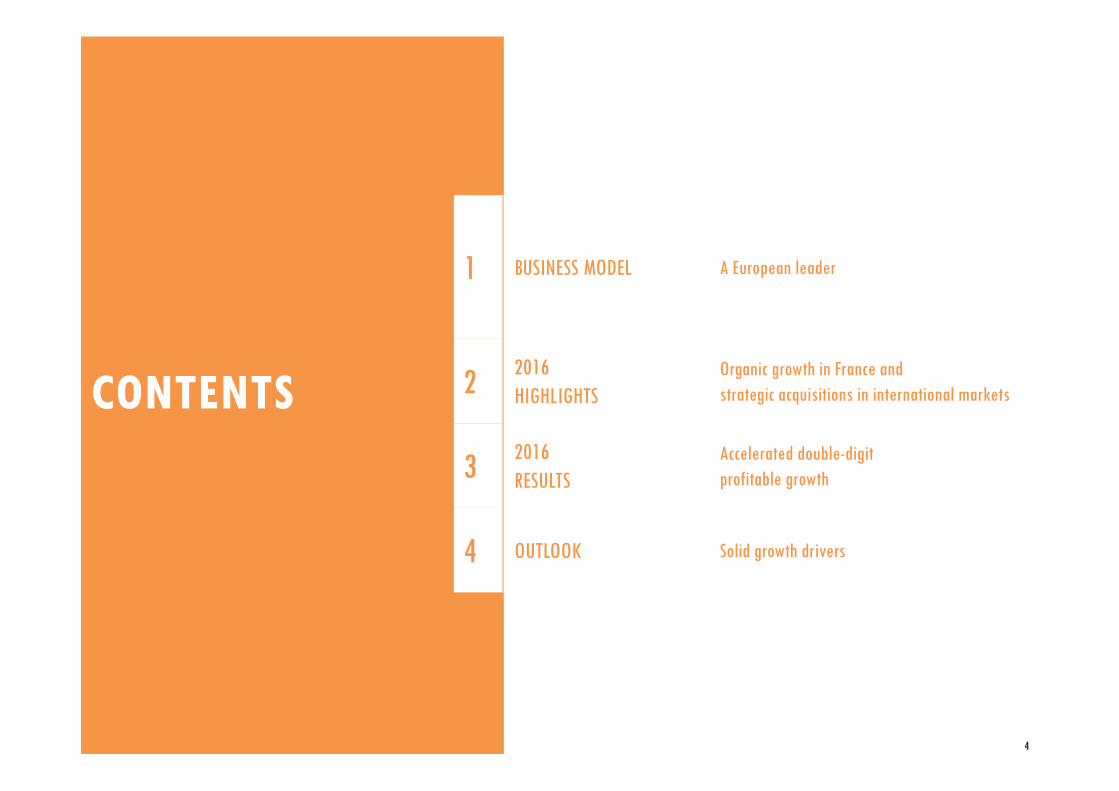
CONTENTS
4
1 BUSINESS MODEL A European leader
2 2016HIGHLIGHTS
Organic growth in France andstrategic acquisitions in international markets
3 2016 RESULTS
Accelerated double-digit profitable growth
4 OUTLOOK Solid growth drivers
THE SOLUTIONS 30 BUSINESS MODEL
A European leader
5

Solutions for New Technologies
PROFITABLE GROWTH STRATEGY
average annual growth2007-2016
2003Founded
2005Paris Marché Libre 5,8%
7,7% 7,6%
9,0% 8,8%9,0% (*)
2007 2008 2009 2010 2011 2012 2013 2014 2015 2016*
30.136.2
44.954.7
63.8
77.1
94.2
111.7
125.2
France turnover
International turnover
EBITDA/turnover
191.8
Listing on Alternext
First acquisition2 major contracts: Linky & Fibre optic
Listing on both Paris and Frankfurt exchanges
Acquisitions in Benelux and Germany
+23%
(*) Adjusted EBITDA
€ million
6
Solutions for New Technologies
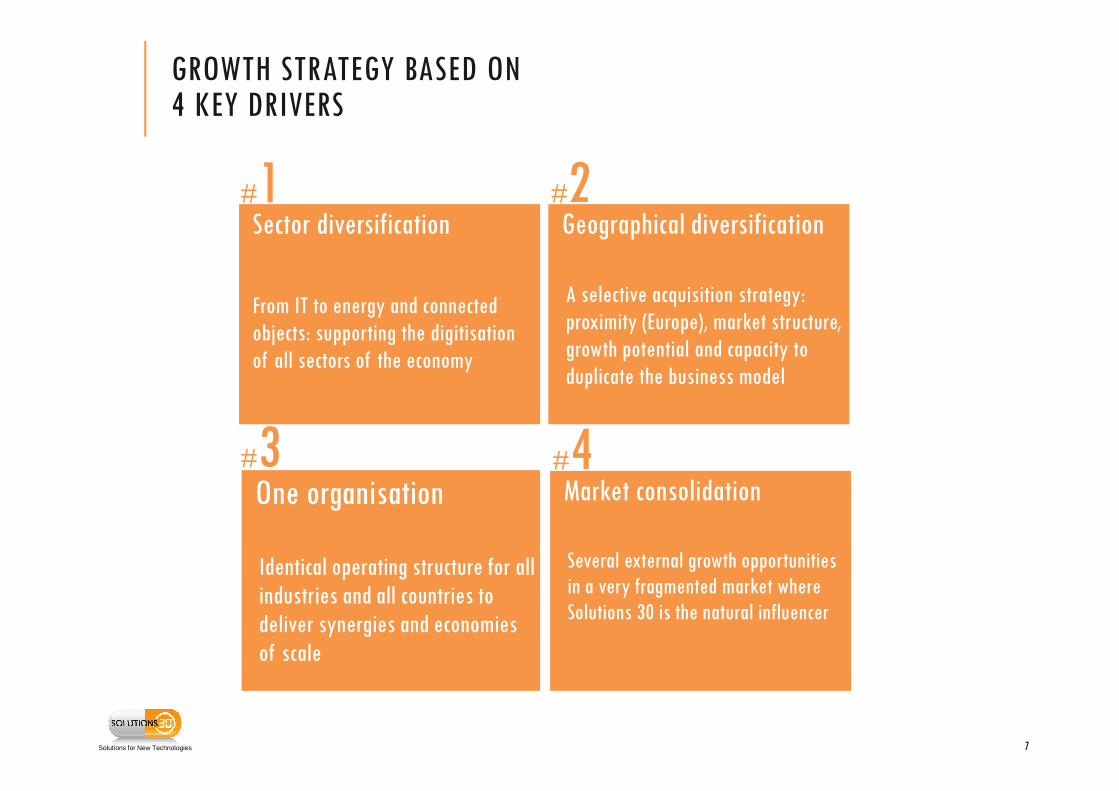
GROWTH STRATEGY BASED ON 4 KEY DRIVERS
Sector diversification
From IT to energy and connectedobjects: supporting the digitisationof all sectors of the economy
Geographical diversification
A selective acquisition strategy: proximity (Europe), market structure, growth potential and capacity to duplicate the business model
#1 #2
One organisation
Identical operating structure for all industries and all countries to deliver synergies and economiesof scale
#3Market consolidation
Several external growth opportunitiesin a very fragmented market whereSolutions 30 is the natural influencer
#4
7
Solutions for New Technologies
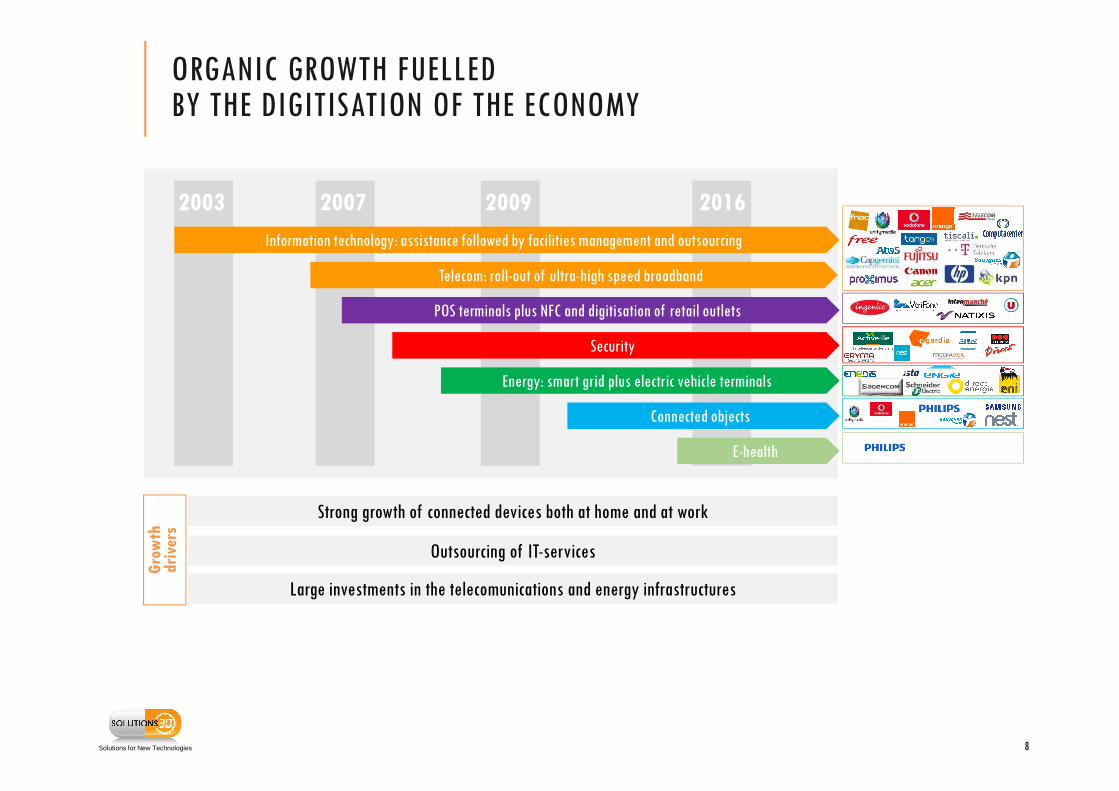
20162007 2009
E-health
Energy: smart grid plus electric vehicle terminals
Information technology: assistance followed by facilities management and outsourcing
Security
Connected objects
POS terminals plus NFC and digitisation of retail outlets
ORGANIC GROWTH FUELLED BY THE DIGITISATION OF THE ECONOMY
Telecom: roll-out of ultra-high speed broadband
Strong growth of connected devices both at home and at work
Outsourcing of IT-services
Large investments in the telecomunications and energy infrastructures
2003
Gro
wth
driv
ers
8
Solutions for New Technologies
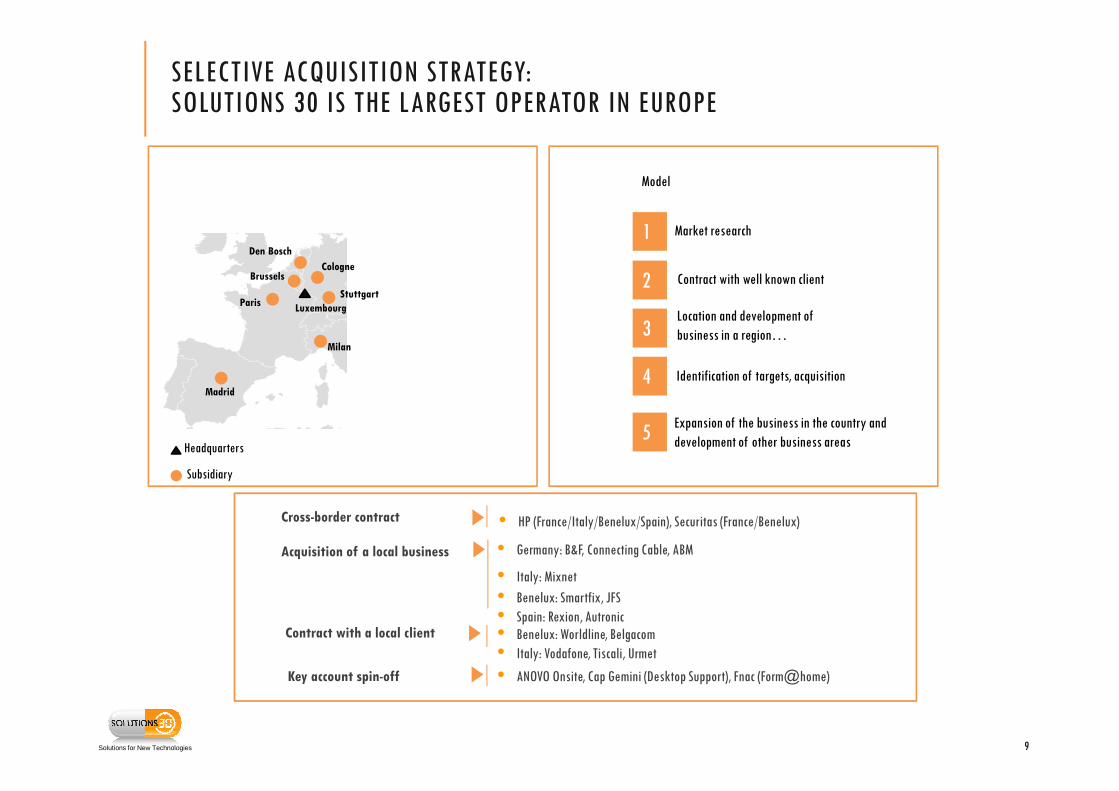
Stuttgart
Milan
LuxembourgParis
Madrid
Brussels
Den Bosch
Cologne
Headquarters
Subsidiary
SELECTIVE ACQUISITION STRATEGY: SOLUTIONS 30 IS THE LARGEST OPERATOR IN EUROPE
Identification of targets, acquisition
Location and development of business in a region…
Expansion of the business in the country and development of other business areas
Market research
Contract with well known client
1
2
3
4
5
Model
9
Cross-border contract
Acquisition of a local business
Contract with a local client
Key account spin-off
• HP (France/Italy/Benelux/Spain), Securitas (France/Benelux)
• Germany: B&F, Connecting Cable, ABM
• Italy: Mixnet
• Benelux: Smartfix, JFS• Spain: Rexion, Autronic• Benelux: Worldline, Belgacom• Italy: Vodafone, Tiscali, Urmet
• ANOVO Onsite, Cap Gemini (Desktop Support), Fnac (Form@home)

Solutions for New Technologies
SOLUTIONS 30, PARTNER FOR THE LAST DIGITAL MILE
10
E-health Energy
IT | Telecoms
Security
Connected objects
POS terminals
Installation & assistanceNetwork infrastructure

Solutions for New Technologies
Subsidiaries of digital players
Multi-technical groups
The only player able to carry out large-scale projects in short timeframes with the reliability expected by major contractors
BPO
Independent and local pure players
International pure players
Specialist players
A DIFFERENTIATED MARKET POSITION
Geogra
phi
c pre
senc
e
An atomised and fragmented market in which Solutions 30 is the only structured and global
player
11
Range of services
Solutions for New Technologies
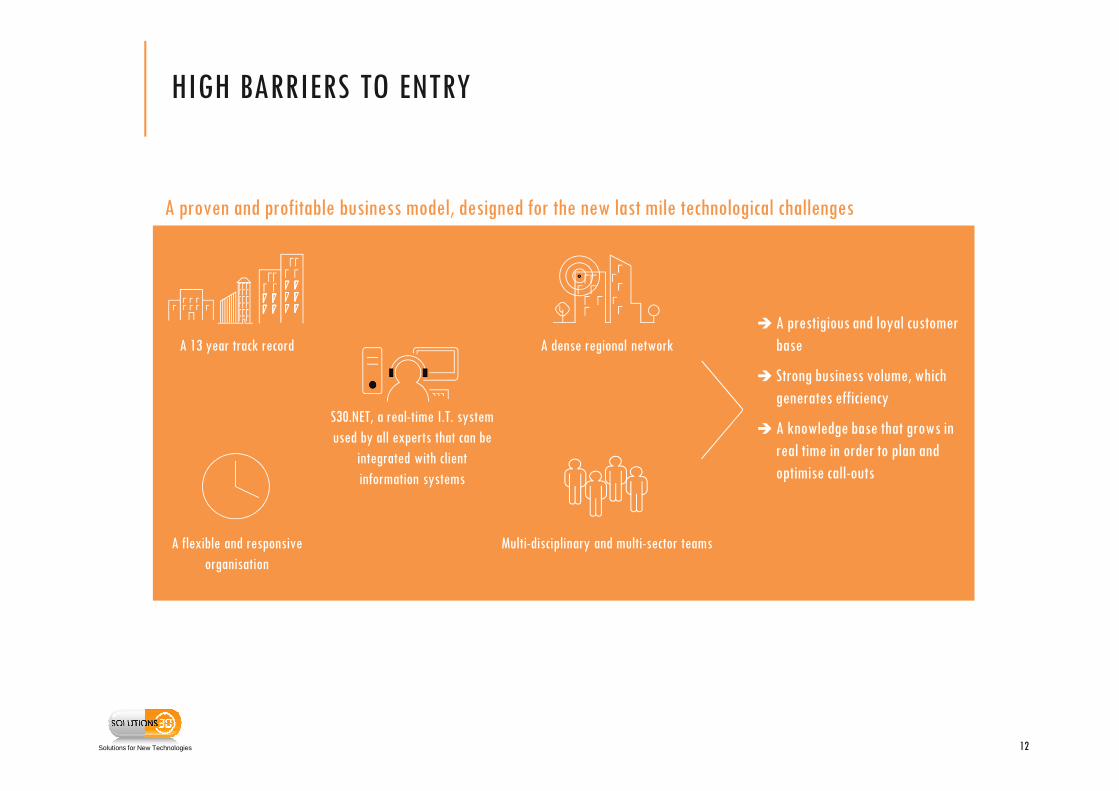
A flexible and responsive organisation
A 13 year track record A dense regional network
Multi-disciplinary and multi-sector teams
� A prestigious and loyal customer base
� Strong business volume, whichgenerates efficiency
� A knowledge base that grows in real time in order to plan and optimise call-outs
HIGH BARRIERS TO ENTRY
A proven and profitable business model, designed for the new last mile technological challenges
S30.NET, a real-time I.T. system used by all experts that can be
integrated with client information systems
12

Solutions for New Technologies
Synergies in our
markets
the renewal of legacy
markets and the growth of
new markets
Our business
model
successfully delivers
profitable growth and
generates cash flow across
the European market
We aim to be
the backbone of a potential
market of 500 million
people from our large
domestic base in France
SOLUTIONS 30, A POWERFUL AND SOLID MODEL
13
HIGHLIGHTS OF THE 2016 FINANCIAL YEAR
Organic growth in France and strategic acquisitions abroad
14

Solutions for New Technologies
ROBUST ORGANIC GROWTH
Energy | Smart Grid
I.T | Telecoms
2015 Contract of €90 million over 5 years for the deployment in France of broadband internet infrastructureStart of production in June 2015, with personnel specially trained in the SOL30SCHOOL
2016 Growth in turnover of 60% for 2016 260,000 new FTTH subscriptions in Q4 2016, 2.185 million FTTH lines installed at the end of 12/16, out of 27.7 million households connected to broadband and ultra-high speed broadband (Arcep data)
2015 Enedis: budget of €1.2 billion for the deployment of 35 million Linky meters 1st order: 10 million Linky meters, 30% for Solutions 301st phase of deployment: 10 million Linky meters, starting on 1 December 2015
2016 Turnover x8 3.8 million meters deployed, i.e. 18 to 19,000 meters installed per day to increase to 35,000 per day by the end of 2017 (Enedis data)
Award process underway for new tranche of 7 million metersAn overall market share of between 15 and 20% for Solutions 30
15

Solutions for New Technologies
A GOOD BUSINESS OUTLOOK
Energy | Smart Grid
I.T | Telecoms
BelgiumFibre pilot in progress with Proximus - Budget of €3 billion for FTTH deployment
ItalyFTTH deployment project launched - Budget of around €20 billion Call for tender expected in the second half of 2017
GermanyStart-up of operations for Deutsche TelekomNumerous opportunities for organic and external growth in a highly fragmented market
FranceEngie: budget of €300m for the deployment of 11 million Gazpar meters 1st order of 5.3 million Gazpar meters, 6% for Solutions 30Starting late 2017
Italy18 million gas meters to be replaced, 2 million already replaced 1st order of 1.8 million gas meters, 16% for Solutions 30Deployment over 3 years starting in May 2017
BelgiumSmart meter pilot in progress
16

Solutions for New Technologies
€191.8M
FIRST HALF
OF 2011
FIRST HALF
OF 2016
37%
20%
23%
20%
INTERNATIONAL BUSINESS IS REACHING CRITICAL SIZE
A targeted international acquisition policy in 2016� Strengthening of positions in the Benelux, Spain and Germany
90%
10%
France International
2010
€54.7M
2016
TURNOVER x 11
TURNOVER x 3
68%
32%
France International
Average annual international growth 2010 to 2016 +50%
17

RESULTSFOR THE 2016 FINANCIAL YEAR
Accelerated, double-digit profitable growth
18

Solutions for New Technologies
CONTINUOUS PROFITABLE GROWTH
19
+53 %
2016 turnover: €191.8M, + 53%
EBITDA: €17.3m, +57%
� Strong organic growth in France thanks to Fiber and Linky. The margin increased throughout the year� Consolidation of acquisitions abroad
5,8%
7,7% 7,6%
9,0% 8,8% 9,0%(*)
2007 2008 2009 2010 2011 2012 2013 2014 2015 2016
30.136.2
44.954.7
63.8
77.1
94.2
111.7
125.2
Turnover in France
International turnover
EBITDA/TURNOVER
191.8
2007 to 2016
+23% annual average growth
(*) Adjusted EBITDA
€ million

Solutions for New Technologies
29 %
1 %
13 %
14 %
9%
2 %
BREAKDOWN OF TURNOVER BY SECTOR
Share of turnover abroad:
32%
35 %
1 %
18 %
3 %
12 %
2 %Share of turnover abroad:
29%
Energy
I.T. | TelecomsB2B2C
Security
IoT
POS terminals
I.T. | TelecomsB2B
2016TURNOVER: €191.8M
2015TURNOVER: €125.3M
20

Solutions for New Technologies
STRONG GROWTH IN OPERATING PROFITABILITY
21
In €m 2016 2015 Change
Turnover 191.8 125.3 +53%
Operating costs 152.3 99.5 +53%
As % of turnover 79.4% 79.4%
Central org costs 22.2 14.8 +50%
As % of turnover 11.6% 11.8%
Adjusted EBITDA (1) 17.3 11.0 +57%
As % of turnover 9.0% 8.8%
Operational amortisation (2) -3.2 -1.8 +111%
As % of turnover
Adjusted EBIT (1) 14.1 9.2 +53%
As % of turnover 7.3% 7.3%
(1) Correction of items considered by the company as exceptional or non-recurring to provide a better view of operating performanceEBITDA Recurring operating income before net write-backs of amortisation, depreciation and provisionsEBIT Operating profit from recurring operations before amortisation of intangible assets, including goodwill
(2) Growth above business growth because of write-down of some inventories

Solutions for New Technologies
SIGNIFICANT INCREASE OF NET INCOME (GROUP SHARE)
22
In €m 2016 2015 Change
Adjusted EBIT 14.1 9.2 +53%
Amortisation of intangible assets -2.3 -1.2 +92%
Financial result (3) -1.2 -0.2
Non-recurring items (4) 0.3 -0.6
Corporate tax (5) -1.3 0.1
Net income from integrated companiesAs % of turnover
9.55.0%
7.35.8%
+31%
Amortisation of goodwill -1.5 -1.2 +23%
Consolidated net incomeAs % of turnover
8.14.2%
6.14.9%
+32%
Net income (group share)As % of turnover
8.34.3%
6.14.9%
+37%
(3) Background of strong organic growth and write-back of acquisitions. In 2015, the financial result included a capital gain of €0.3M on the sale of marketable securities. (4) Non-recurring items: this item mainly includes restructuring costs and Badwill related to acquisitions.(5) Corporate taxes: 12% of net income before taxes in 2016 - recognition of deferred taxes in 2015
Solutions for New Technologies
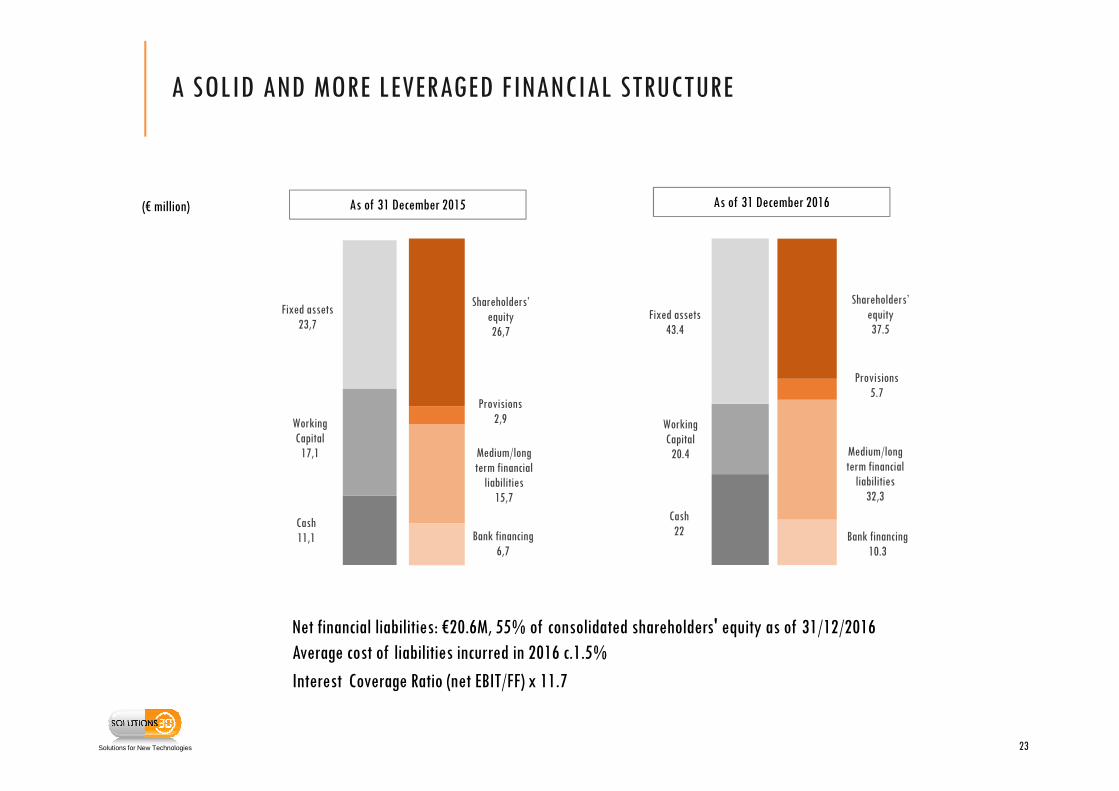
Net financial liabilities: €20.6M, 55% of consolidated shareholders' equity as of 31/12/2016Average cost of liabilities incurred in 2016 c.1.5%
Interest Coverage Ratio (net EBIT/FF) x 11.7
(€ million)
A SOLID AND MORE LEVERAGED FINANCIAL STRUCTURE
23
Bank financing6,7
Medium/long term financial
liabilities15,7
Provisions2,9
Shareholders’ equity26,7
As of 31 December 2015
11.1
2.9
15.7
6.7Cash 11,1
Working Capital
17,1
Fixed assets23,7
Bank financing10.3
Medium/long term financial
liabilities32,3
Provisions5.7
Shareholders’ equity37.5
As of 31 December 2016
2.9
15.7
6.7Cash22
Working Capital
20.4
Fixed assets43.4
Solutions for New Technologies
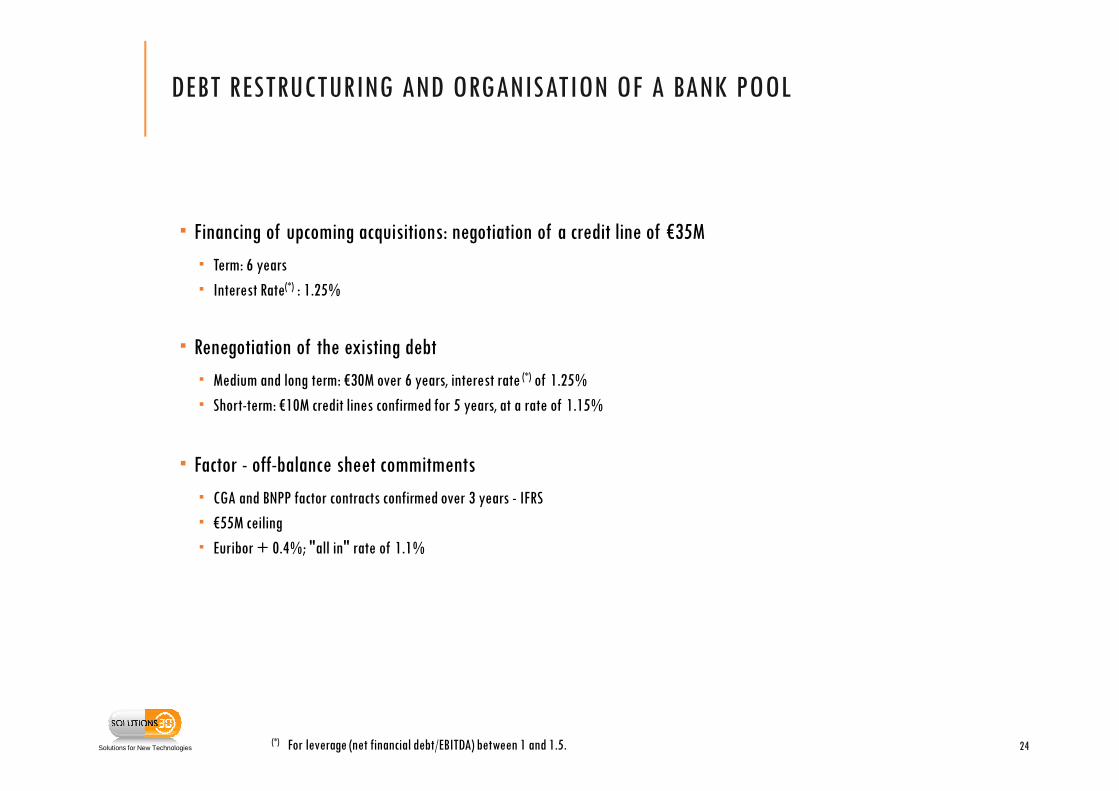
DEBT RESTRUCTURING AND ORGANISATION OF A BANK POOL
� Financing of upcoming acquisitions: negotiation of a credit line of €35M
� Term: 6 years
� Interest Rate(*) : 1.25%
� Renegotiation of the existing debt
� Medium and long term: €30M over 6 years, interest rate (*) of 1.25%
� Short-term: €10M credit lines confirmed for 5 years, at a rate of 1.15%
� Factor - off-balance sheet commitments
� CGA and BNPP factor contracts confirmed over 3 years - IFRS
� €55M ceiling
� Euribor + 0.4%; "all in" rate of 1.1%
24(*) For leverage (net financial debt/EBITDA) between 1 and 1.5.

Solutions for New Technologies
CASH GENERATION
+12.222
Cash flow
Chg.
WCR
Investment Net increase of
loans*
Cash flow as of 31 December 2016
+1.8
11.1
Cash flow as of 31 December 2015
(20.0)+20.2
€ million
* Including + €3.6m in the short term
(3.3)
Tres
Soc
integr
25

Solutions for New Technologies
24,7
35,5
11,3
20,6
2016 2017
France International
Q1 TURNOVER IN 2017
26
56.1
36.0
€ million
+43.7%
+82.3%
Q1 growth in 2017+55.8%
Mainly organic growth in France� Continued deployment of optical fibre � Continued installation of Linky smart meters (contract
started in December 2015)
Mainly external growth abroad� Autronic in Spain (March 2016)� JFS in Belgium (May 2016) � ABM in Germany (November 2016)

Solutions for New Technologies
A LIQUID SECURITY THAT IS CONSTANTLY GROWING
Volume Price
Share split: 20.4 million shares
Admission to the Frankfurt Stock Exchange's XETRA electronic trading system
Share split: 10.1 million shares
Price as of 25/04/2017 €17.95
Total No. of securities 20,440,516
Capitalisation €366.9m
Free float 59% (€216m)
Average trading volumes€480 K/ day
from 01/01/2017
Trading marketsAlternext Paris - ALS30
Deutsche Börse : XETRA, EO2
ISIN Code FR0013188844
Eligibility PEA and PEA-SME
Liquidity contract Louis Capital Market
Listing sponsor Genesta Finance
27

OUTLOOK Solid growth drivers
28

Solutions for New Technologies
THE DIGITAL REVOLUTION AFFECTS ALL SECTORS OF THE ECONOMY
Construction
Agriculture Public sector
Health
Energy
Distribution
Retail banking
Media
Tourism
Security
Digi
tal m
atur
ity in
the
secto
r
Changes over time
2010 2014 2020(e)
4
15
50-80(e)
Number of connected objects in the world in billions
Source: Gartner, IdateSource: Chart adapted from McKinsey
� Digital transformation is happening to various degrees in different sectors and some are still at the early stages of their transformation.
� Digital is being used by more and more people and is playing an increasingly important role in our lives.� GfK has forecasted 30 connected objects per French household by 2020.
29

Solutions for New Technologies
THE INFRASTRUCTURE MUST ADAPT TO NEW USES
30
2015 2020
More and more Internet users 3 billion 4.1 billion
More and more connected devices and objects
16.3 billion 26.3 billion
Increasingly fast connection speeds
24.7 Mbps 47.7 Mbps
More and more videos watched 70% of trafic 82% of trafic
Source: Cisco VNI Global IP traffic forecast 2015-2020
+37%
+62%
+93%
+12 points
Solutions for New Technologies
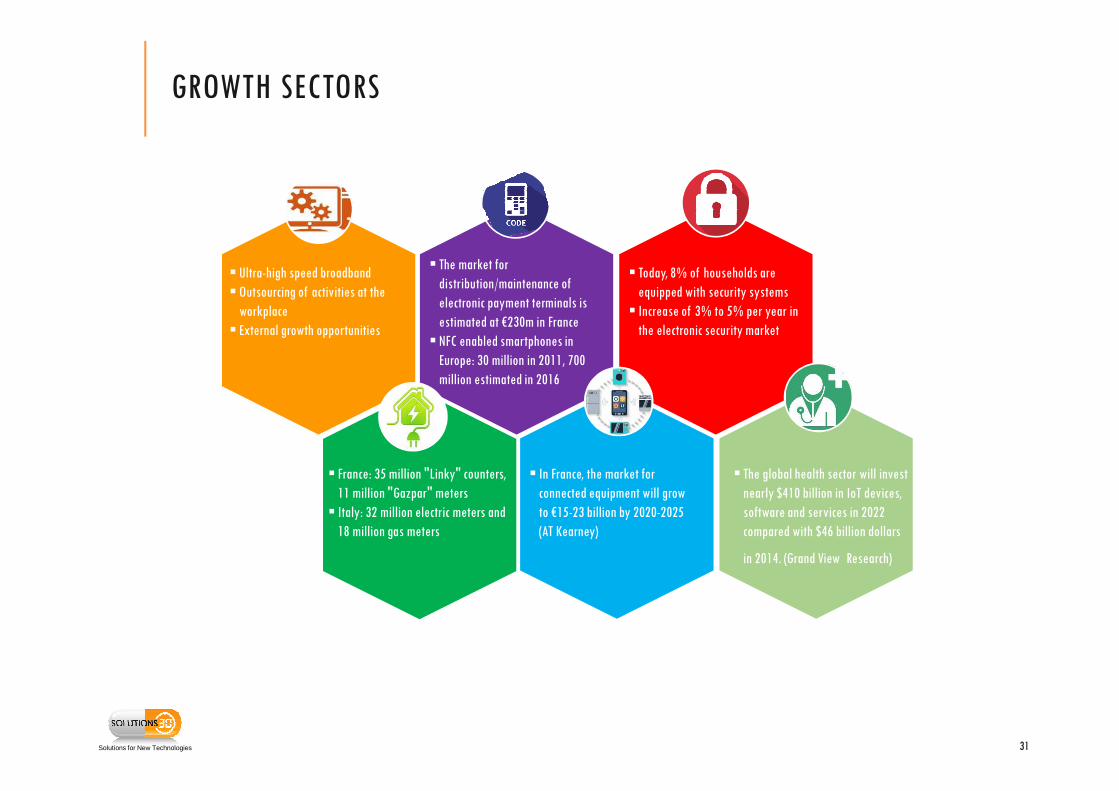
GROWTH SECTORS
� Ultra-high speed broadband� Outsourcing of activities at the
workplace� External growth opportunities
� Today, 8% of households are equipped with security systems
� Increase of 3% to 5% per year in the electronic security market
� The market for distribution/maintenance of electronic payment terminals is estimated at €230m in France
� NFC enabled smartphones in Europe: 30 million in 2011, 700 million estimated in 2016
� France: 35 million "Linky" counters, 11 million "Gazpar" meters
� Italy: 32 million electric meters and 18 million gas meters
� In France, the market for connected equipment will growto €15-23 billion by 2020-2025 (AT Kearney)
� The global health sector will invest nearly $410 billion in IoT devices, software and services in 2022 compared with $46 billion dollars
in 2014. (Grand View Research)
31

Solutions for New Technologies
INTERNATIONAL DEVELOPMENT
Stuttgart
Milan
LuxembourgParis
Madrid
Brussels
Den Bosch
Cologne
Head Office
Subsidiary
• The largest country in Europe (81 million inhabitants)• Some significant investment expected in infrastructure (ultra-
high speed broadband, energy...) • A very fragmented market
• Historical presence of SOLUTIONS 30• 2 key accounts with a strong potential: Vodafone & HP• Investment of $20 billion in broadband internet• Ongoing smart meter deployment
• Development of fibre and broadband internet• Grants for the development of telecoms infrastructure• Proximus ' Fibre for Belgium' a plan for investment of €3 billion over
10 years• Belgium: the deployment of smart meters is in a pilot phase
• Development through multinational clients already acquired in other areas
• Ongoing fibre and smart meter deployment• Strong recovery in the local economy
32

Solutions for New Technologies
Smartfix 30, a disruptive service which:
�is supported by a proven organisation
�integrates the ease of use of mobile technologies
�meets users' need for responsiveness
SMARTFIX 30 - 3000 SMARTPHONE EXPERTS
A home or phone support service to solve problems associated with the use of new technologies
Smartfix 30, a subsidiary of Solutions 30
A distinct graphic design
33

Solutions for New Technologies
SMARTFIX 30 - 3000 SMARTPHONE EXPERTS
3 seconds
30 seconds
Make appointments instantly using the application
Connection with an expert by phone
Call out by an expert using geolocation technology30 minutes
34

Solutions for New Technologies
European leader in support for the use of new digital technologies and the deployment of connected objects
SHORT AND MEDIUM TERM OUTLOOK
2017 outlook� Accelerated, double-digit profitable growth
Medium term� Turnover of €500m with five major markets of comparable size (Benelux, France, Germany, Italy,
Spain)
35
Solutions for New Technologies
1. European leader with a powerful domestic base facilitating business model duplication in other countries
2. High-growth markets: • Growth and renewal of I.T. and telecoms sectors• A boom in connected objects (energy, home automation, security, e-health...)
3. Unique business mode based on scaling up standardised services to generate profit and facilitate consolidation of new businesses at a reduced cost
4. Three major growth drivers of the business • Deployment of digital technologies into all sectors of the economy• International expansion • Consolidation of our market through external growth
5. Increasingly large and liquid stock market
OUR EQUITY STORY
36

SOLUTIONS30
Presentation of business activity and outlookJanuary 2017
Gianbeppi Fortis, Chairman of the Management Board
ANNUAL RESULTS 20162 7 A P R I L 2 0 1 7
Gianbeppi Fortis,
Chairman of the Executive Board
Jérôme Boillot,
Chief Financial Officer
37
Solutions for New Technologies
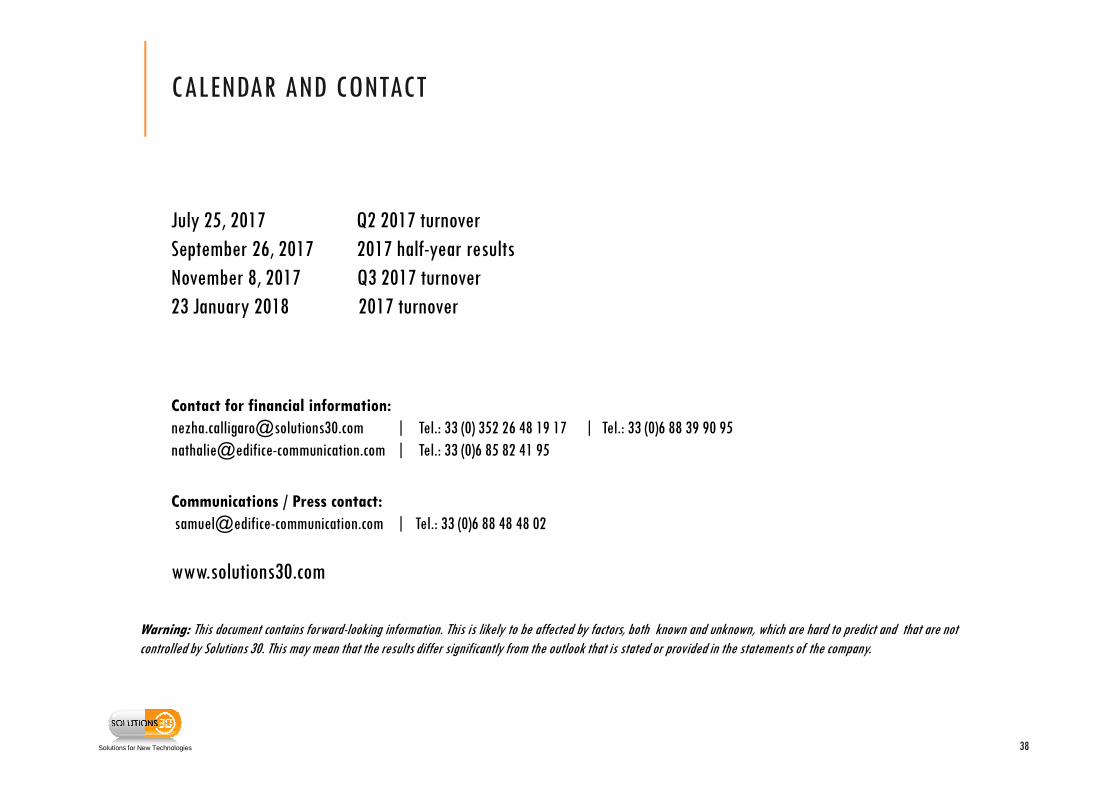
Contact for financial information:
[email protected] | Tel.: 33 (0) 352 26 48 19 17 | Tel.: 33 (0)6 88 39 90 [email protected] | Tel.: 33 (0)6 85 82 41 95
Communications / Press contact:
[email protected] | Tel.: 33 (0)6 88 48 48 02
www.solutions30.com
Warning: This document contains forward-looking information. This is likely to be affected by factors, both known and unknown, which are hard to predict and that are notcontrolled by Solutions 30. This may mean that the results differ significantly from the outlook that is stated or provided in the statements of the company.
CALENDAR AND CONTACT
38
July 25, 2017 Q2 2017 turnoverSeptember 26, 2017 2017 half-year resultsNovember 8, 2017 Q3 2017 turnover23 January 2018 2017 turnover