Soil and Fertilizer Management Considerations for Forage Systems in GA Dennis Hancock, PhD....
67
Soil and Fertilizer Management Considerations for Forage Systems in GA Dennis Hancock, PhD. Extension Forage Agronomist UGA – Dept. of Crop and Soil Sciences
-
Upload
lillian-carpenter -
Category
Documents
-
view
217 -
download
2
Transcript of Soil and Fertilizer Management Considerations for Forage Systems in GA Dennis Hancock, PhD....

Soil and Fertilizer Management Considerations for Forage Systems
in GA
Soil and Fertilizer Management Considerations for Forage Systems
in GA
Dennis Hancock, PhD.Extension Forage Agronomist
UGA – Dept. of Crop and Soil Sciences
Dennis Hancock, PhD.Extension Forage Agronomist
UGA – Dept. of Crop and Soil Sciences

52%
10%
3%
6%
23%
5%
Fertilizer Fuel & RepairsInterest on Var. Costs PesticidesLabor Fixed & Mgmt Costs
Hybrid Bermudagrass Hay – 2008Cost Breakdown

14-15% From ‘08

40% From ‘08

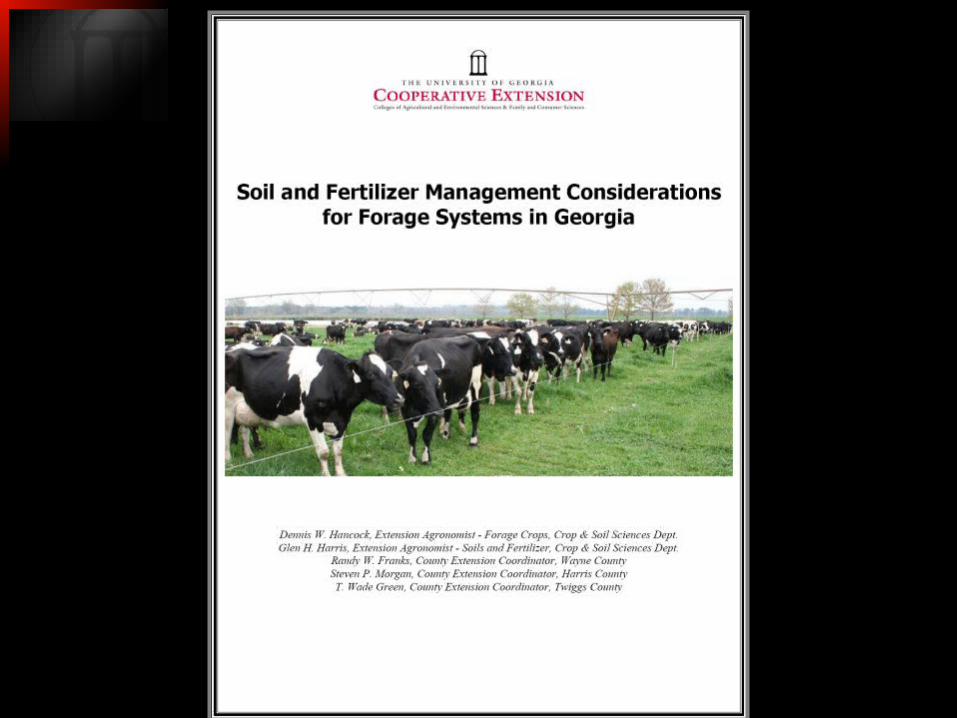
Get a Grip on Your Forage Costs
Get a Grip on Your Forage Costs
Get a Grip on Your Forage Costs
Get a Grip on Your Forage Costs
Fertilizer^
$0.80 - $0.70 - $0.60
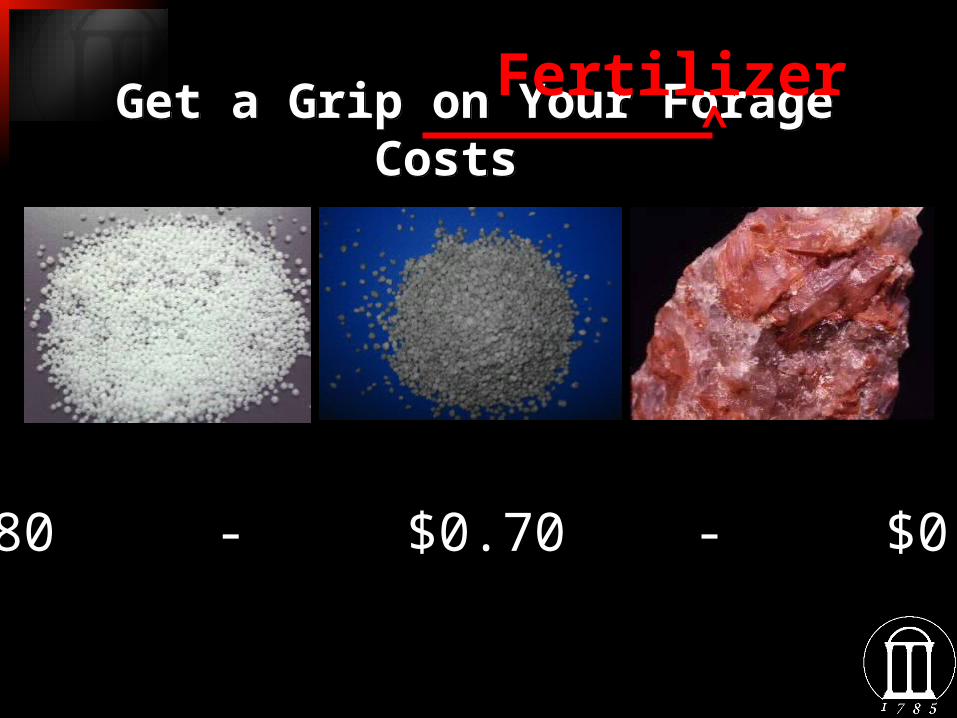
Outline
• Overview of Soil Fertility
• Rewards and Risks when Fertilizing Forages Animal Manures Commercial Fertilizer “Enhanced Efficiency” Fertilizer
Products (Nutrisphere, Agrotain, etc.)

Plant NutrientsPlant Nutrients
Element Available Form
Oxygen O2, OH-
Carbon C03-2, HCO3 , CO2
Hydrogen H+, OH-
Nitrogen NO3- , NH4
+
Phosphorus HPO4-2, H2PO4
-
Potassium K+
Macro- (Primary)
Element Available Form
Calcium Ca+2
Magnesium Mg+2
Sulfur SO4-2
Meso- (Secondary)
Element Available Form
Iron Fe+2 , Fe+3
Copper Cu+2 , Cu+
Zinc Zn+2
Manganese Mn+2 , MnO4-
Molybdenum
HMoO4- , MoO4
-2
Boron H3BO3, B4O7-2
Chlorine Cl-
Micro- (Trace)

Nutrients Removed/Acre With Bermudagrass Hay or Corn
Silage
Nutrients Removed/Acre With Bermudagrass Hay or Corn
Silage
0
50
100
150
200
250
300
lbs/
acre
rem
ove
d
Nitrogen Phosphate Potash Calcium Mag
6 Tons Bermudagrass Hay
30 Tons Corn Silage
0
50
100
150
200
250
300
lbs/
acre
rem
ove
d
Nitrogen Phosphate Potash Calcium Mag
6 Tons Bermudagrass Hay
30 Tons Corn Silage

Soil Test and Follow Fertility Recommendations
Soil Test and Follow Fertility Recommendations
Sample hayfields every year and 1/3 of your pastures each year.

Don’t plug ‘em up, just yet…Don’t plug ‘em up, just yet…

What is holding back hay yields?
DroughtDroughtLow Soil pHLow Soil pH
Inefficient N application methods
Inefficient N application methods
Less effectiveN sources
Less effectiveN sources
Low K fertilityLow K fertility
Insect DamageInsect Damage

Liebig’s Law of the Minimum
Liebig’s Law of the Minimum
Fe
Cl
Ca N
K
P
MnMoS Zn
Cu
B
Mg

Hybrid Bermudagrass Yield Response to N Rate
Hybrid Bermudagrass Yield Response to N Rate
0.0
2.0
4.0
6.0
8.0
10.0
12.0
14.0
0 100 200 300 400 500 600 700 800
Nitrogen Rate (lbs N/A)
Forage Yield(tons/A)
@15% moisture
Average or “Normal” Response

Hybrid Bermudagrass Yield Response to N Rate
Hybrid Bermudagrass Yield Response to N Rate
0.0
2.0
4.0
6.0
8.0
10.0
12.0
14.0
0 100 200 300 400 500 600 700 800
Nitrogen Rate (lbs N/A)
Forage Yield(tons/A)
@15% moisture
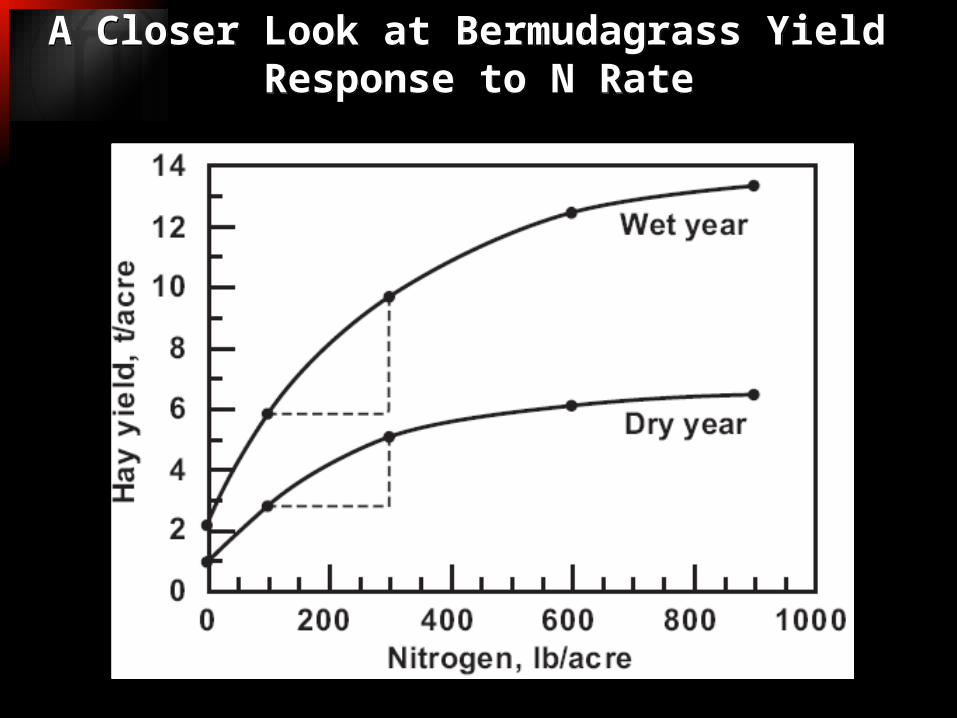
A Closer Look at Bermudagrass Yield Response to N Rate
A Closer Look at Bermudagrass Yield Response to N Rate

The False Economy of Shortcuts
The False Economy of Shortcuts
Cost of Production Compared to Average
Yield (t/ac) 60% 75% 90% 100% 110% 125%
8 $56 $71 $85 $94 $103 $118
7 $64 $80 $96 $107 $118 $134
6 $75 $94 $113 $125 $138 $156
5 $90 $113 $135 $150 $165 $188
4 $113 $141 $169 $188 $207 $235
3 $150 $188 $225 $250 $275 $313 Adapted from R.C. Lacy, 2008

A Closer Look at Bermudagrass Yield
Response to N Rate
A Closer Look at Bermudagrass Yield
Response to N Rate
0
2000
4000
6000
8000
10000
Yie
ld (
lbs
DM
/acr
e)
0 150 3000
2000
4000
6000
8000
10000
Yie
ld (
lbs
DM
/acr
e)
0 150 300
N Applied During the Season(lbs actual N/acre)
Eatonton 2007(Drought Year)

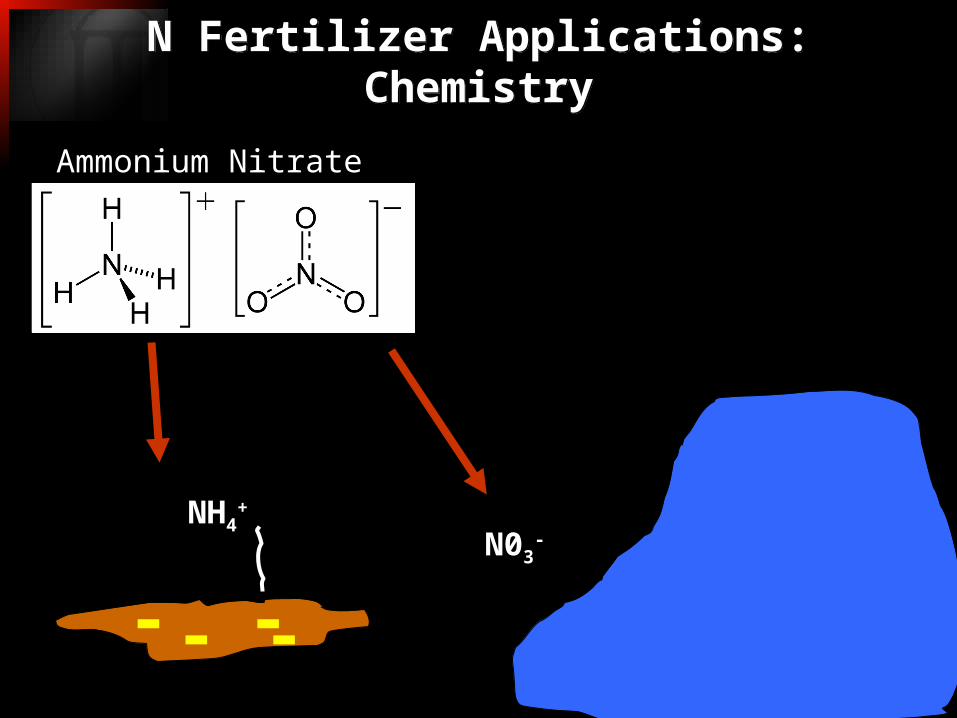
N Fertilizer Applications: Chemistry
N Fertilizer Applications: Chemistry
Ammonium Nitrate Urea
Uric Acid
N Fertilizer Applications: Chemistry
N Fertilizer Applications: Chemistry
Ammonium Nitrate
NH4+
----N03
-

N Fertilizer Applications: Chemistry
N Fertilizer Applications: Chemistry
R-(NH2)2
(Urea, Uric Acid, etc.)
+ H20
urease
2NH3 2NH4+
+ 2H+

N Application StrategiesN Application Strategies
M A M J J A S O
Green-up Only

N Application StrategiesN Application Strategies
M A M J J A S O
Green-up Only

N Application StrategiesN Application Strategies
M A M J J A S O
Green-up & After 2nd Cut
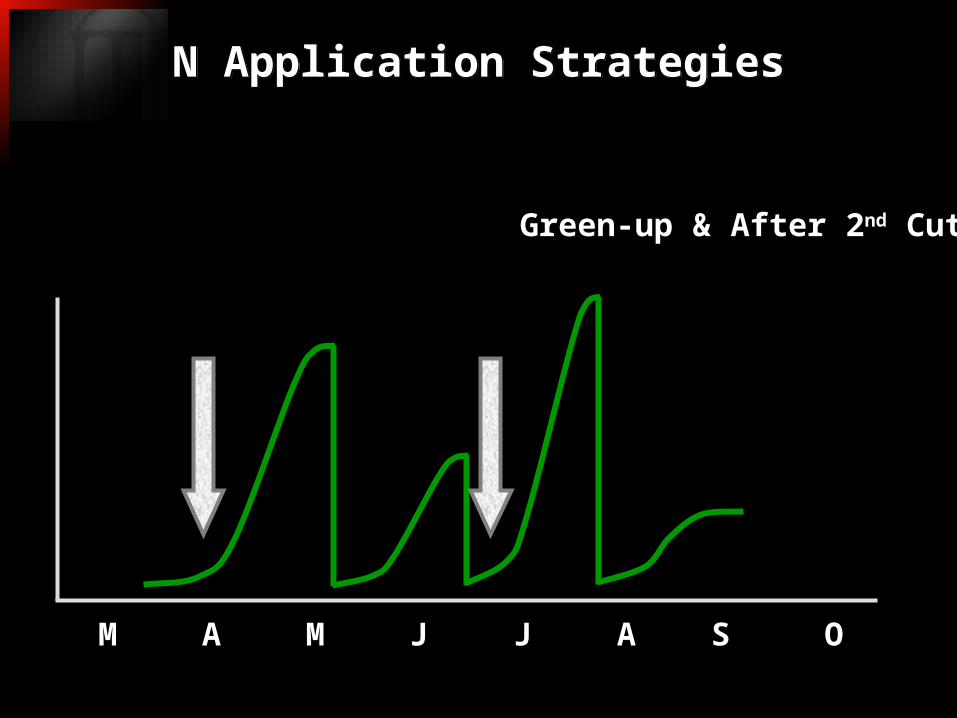
N Application StrategiesN Application Strategies
M A M J J A S O
Green-up & After 2nd Cut

N Application StrategiesN Application Strategies
M A M J J A S O
Green-up & After Each Cut
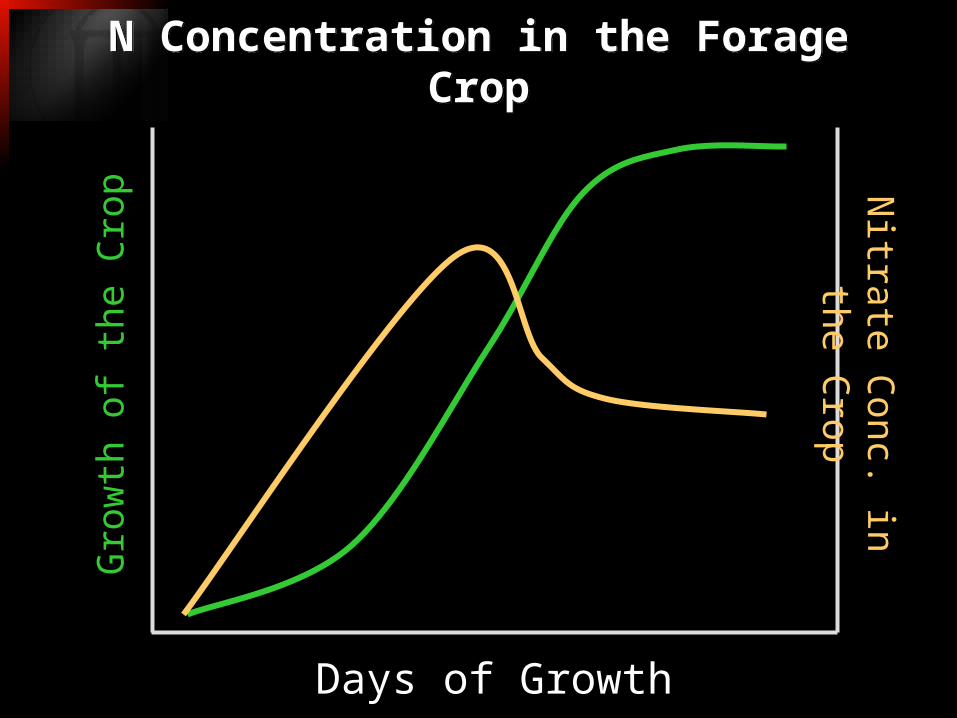
N Concentration in the Forage Crop
N Concentration in the Forage Crop
Days of Growth
Gro
wth
of
the C
rop
Nitra
te C
on
c. in th
e
Cro
p

N Concentration in the Forage Crop
N Concentration in the Forage Crop
Days of Growth
Nitra
te C
on
c. in th
e
Cro
p5000 ppm
Rec. Rate
2 x Rec. Rate
3 x Rec. Rate

N Concentration in the Forage Crop
N Concentration in the Forage Crop
Days of Growth
Nitra
te C
on
c. in th
e
Cro
p5000 ppm
Drought

N Concentration in the Forage Crop
N Concentration in the Forage Crop
Days of Growth
Nitra
te C
on
c. in th
e
Cro
p5000 ppm
Rec. Rate
2 x Rec. Rate
3 x Rec. Rate

Monitor Climate PredictionsMonitor Climate Predictions
http://www.cpc.ncep.noaa.gov/

Monitor Climate PredictionsMonitor Climate Predictions
http://www.cpc.ncep.noaa.gov/products/predictions/90day/

A Closer Look at Bermudagrass Yield
Response to N Rate
A Closer Look at Bermudagrass Yield
Response to N Rate
0
2000
4000
6000
8000
10000
Yie
ld (
lbs
DM
/acr
e)
0 150 3000
2000
4000
6000
8000
10000
Yie
ld (
lbs
DM
/acr
e)
0 150 300
N Applied During the Season(lbs actual N/acre)
Eatonton 2007(Drought Year)

A Closer Look at Bermudagrass Yield Response to N Rate
A Closer Look at Bermudagrass Yield Response to N Rate
Split Timing Jun. 7 Jul. 17 Aug. 15 Oct. 1 Total
- - - 521 e 824 d 39 c 474 c 1858 d
150 N greenup only 2764 bc 2043 bc 130 c 506 c 5442 c
150 Ygreenup & after 2nd cut 1921 bc 1450 cd 1620 b 663 c 5652 bc
150 YBefore ea. growth period 939 de 1946 bc 695 c 1644 b 5224 c
300 N greenup only 3999 a 3031 a 399 c 684 c 8113 ab
300 Ygreenup & after 2nd cut 3082 ab 2341 ab 2854 a 1542 b 9819 a
300 YBefore ea. growth period 1841 cd 3026 a 1734 b 2458 a 9058 a
2152 2094 1067 1139 64521167.2 870.1 823.2 411.4 2582.0
36.5 28.0 51.9 24.3 26.9
Source and Total Application Rate
Check
LSD (P<0.05)CV (%)
Urea
Average
Eatonton 2007

A Fertilization TrickA Fertilization Trick
• Long-term, this can increase yields by 5-10% and increase NUE by 25-30% Especially important under extremes
Leaching Volatilization (in the case of urea-based
products) Late freeze Drought
• Helps to prevent NITRATE TOXICITY!
Split Your Nitrogen Applications!Split Your Nitrogen Applications!

Fertilization StrategiesFertilization StrategiesNew N Fertilizer ProductsNew N Fertilizer Products

Enhanced Efficiency Fertilizer•Without AN, users of N
face risky alternatives. NH3 volatilization loss
•Urease is abundant in thatch & organic layers
High N use in hay.
•Enhanced Efficiency N Fertilizer Products may reduce volatilization loss
Urease inhibition Encapsulate & release
Ammonium Nitrate Urea
NBPT
maleic-itaconicco-polymer
PolymerCoating

Nitrogen Use EfficiencyNitrogen Use Efficiency
Eatonton
Calhoun 2008
SourceTotal Application Rate
Timing of Equal SplitsJun. 12 Jul. 25 Sep. 03 Oct. 16 Total
Nutrisphere 300 greenup & after 2nd cut 6290 a 3018 cd 5863 a 1814 c 16985 bc
ESN 300 greenup & after 2nd cut 4923 b 4167 ab 4257 b 2685 ab 16033 c
Agrotain-treated Urea 300 greenup & after 2nd cut 6804 a 4337 ab 6093 a 2058 bc 19291 a
Broiler Litter/Urea 300broiler litter at greenup, urea after 2nd cut
5817 ab 2701 de 5291 ab 2251 abc 16060 c
Urea 300 greenup & after 2nd cut 6495 a 3536 bc 5452 a 1819 c 17302 bc
Urea 300before each growth period
6013 a 4588 a 5030 ab 2870 ab 18500 ab
Ammon. Nitrate 300before each growth period
5891 ab 4147 a 5191 ab 2989 a 18219 ab
Check - - 4221 c 2118 e 2215 c 1455 c 10009 d
5807 3576 4924 2243 165501084.0 823.7 1088.3 855.1 1889.1
12.7 15.7 15.0 25.9 7.8LSD at 5% LevelCV (%)
Average
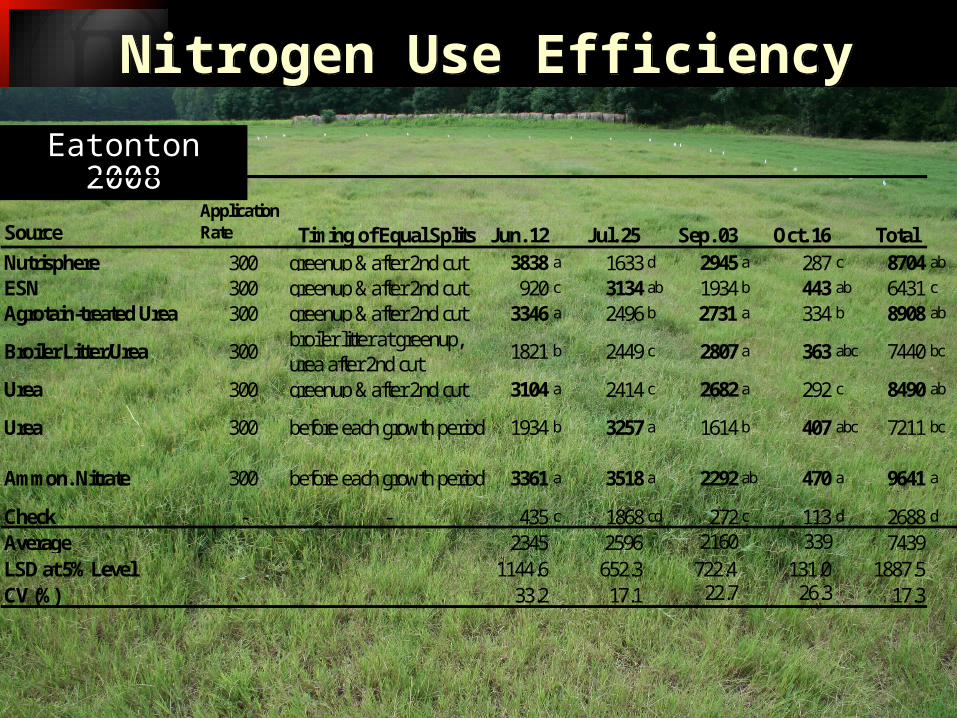
Nitrogen Use EfficiencyNitrogen Use Efficiency
Eatonton 2008
Source
Total Application Rate Timing of Equal Splits Jun. 12 Jul. 25 Sep. 03 Oct. 16 Total
Nutrisphere 300 greenup & after 2nd cut 3838 a 1633 d 2945 a 287 c 8704 ab
ESN 300 greenup & after 2nd cut 920 c 3134 ab 1934 b 443 ab 6431 c
Agrotain-treated Urea 300 greenup & after 2nd cut 3346 a 2496 b 2731 a 334 b 8908 ab
Broiler Litter/Urea 300 broiler litter at greenup, urea after 2nd cut
1821 b 2449 c 2807 a 363 abc 7440 bc
Urea 300 greenup & after 2nd cut 3104 a 2414 c 2682 a 292 c 8490 ab
Urea 300 before each growth period 1934 b 3257 a 1614 b 407 abc 7211 bc
Ammon. Nitrate 300 before each growth period 3361 a 3518 a 2292 ab 470 a 9641 a
Check - - 435 c 1868 cd 272 c 113 d 2688 d
2345 2596 2160 339 74391144.6 652.3 722.4 131.0 1887.5
33.2 17.1 22.7 26.3 17.3LSD at 5% LevelCV (%)
Average

New N ProductsNew N Products
??

Get a Grip on Your Forage Costs
Get a Grip on Your Forage Costs
Fertilizer^
$0.80 - $0.70 - $0.60
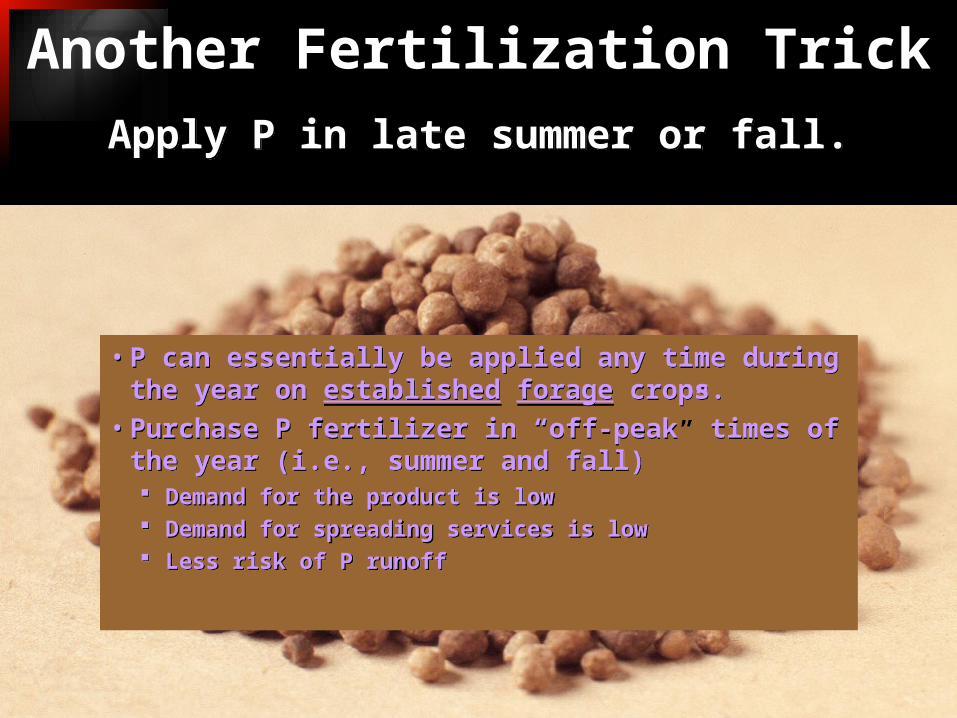
Another Fertilization TrickApply P in late summer or fall.Apply P in late summer or fall.
• P can essentially be applied any time during the year on established forage crops.
• Purchase P fertilizer in “off-peak” times of the year (i.e., summer and fall) Demand for the product is low Demand for spreading services is low Less risk of P runoff
• P can essentially be applied any time during the year on established forage crops.
• Purchase P fertilizer in “off-peak” times of the year (i.e., summer and fall) Demand for the product is low Demand for spreading services is low Less risk of P runoff

Another Fertilization TrickSplit Your Potassium Applications!Split Your Potassium Applications!
40-50%in the Spring
50-60%in mid – late season

Potash also determines competitiveness in
bermudagrass
Potash also determines competitiveness in
bermudagrass
Leafspot and winterhardiness

Poor Stress TolerancePoor Stress Tolerance
Leafspot DiseasesLeafspot Diseases
The Stand is Gone!The Stand is Gone!
Not CompetitiveNot Competitive
Grows Very SlowGrows Very SlowPoor WinterhardinessPoor Winterhardiness
K is for PersistenceK is for Persistence

K is the Key to a Good Stand
K is the Key to a Good Stand

Increase Corn GrainIncrease Corn GrainDries down slowerDries down slower
Later MaturingLater Maturing
K Effects on Corn SilageK Effects on Corn Silage
Faster Body Weight RecoveryFaster Body Weight Recovery

DO NOT cut back on lime!DO NOT cut back on lime!
Get your priorities right!
1. Lime is still job #1.
Get your priorities right!
1. Lime is still job #1.

How Soil pH Affects Availability of Plant Nutrients
The Difference of a soil pH of 5.8 vs. 6.2
NutrientAmt. Used Annually
Unit Price
Dec. in Efficiency
Value of Decrease
(Lbs/acre) ($/lb) ($/acre)
N 200 $0.85 20% -$34P2O5 50 $0.80 25% -$10K2O 150 $0.60 10% -$ 9
Total -$53


What’s a Common Soil pH Value
What’s a Common Soil pH Value
S. Piedmont

Fertilization StrategiesFertilization Strategies
Hayfield 2 & 3pH = 5.5P = 15K = 90OM = 1.5%
Hayfield 2 & 3pH = 5.5P = 15K = 90OM = 1.5%
Hayfield 1pH = 6.0P = 25K = 120OM = 2.5%
Hayfield 1pH = 6.0P = 25K = 120OM = 2.5%

Costs Increase When Soil Fertility Decreases
Costs Increase When Soil Fertility Decreases
Recommended Rate of
P & K Fertility N P2O5 K2O
Total Cost
------------- (lbs/acre) ------------- ($/acre)
V. High 250 0 0$187.5
0
High 250 30 150
318.59
Medium 250 60 200
352.17
Low 250 80 250
439.57
Assumptions: Using 32% UAN ($480/ton), DAP ($1300/ton), and Muriate of Potash ($780/ton).
Let’s assume P & K have been equally taken care of or equally neglected. So, let’s consider bermudagrass fertility.

If you must cut back…If you must cut back…
Do so uniformly!• If the recommendation is for N, P, and K,
be sure to apply each. Don’t just apply N!!! IMPORTANT Do a total reduction (by a percentage).
• Base the reduction in P and/or K off of the N reduction If you reduce N by 20% from the Rec. Rate… Then reduce the other recommended rates
by 20% EXCEPTION: If your soil is “Very Low.”
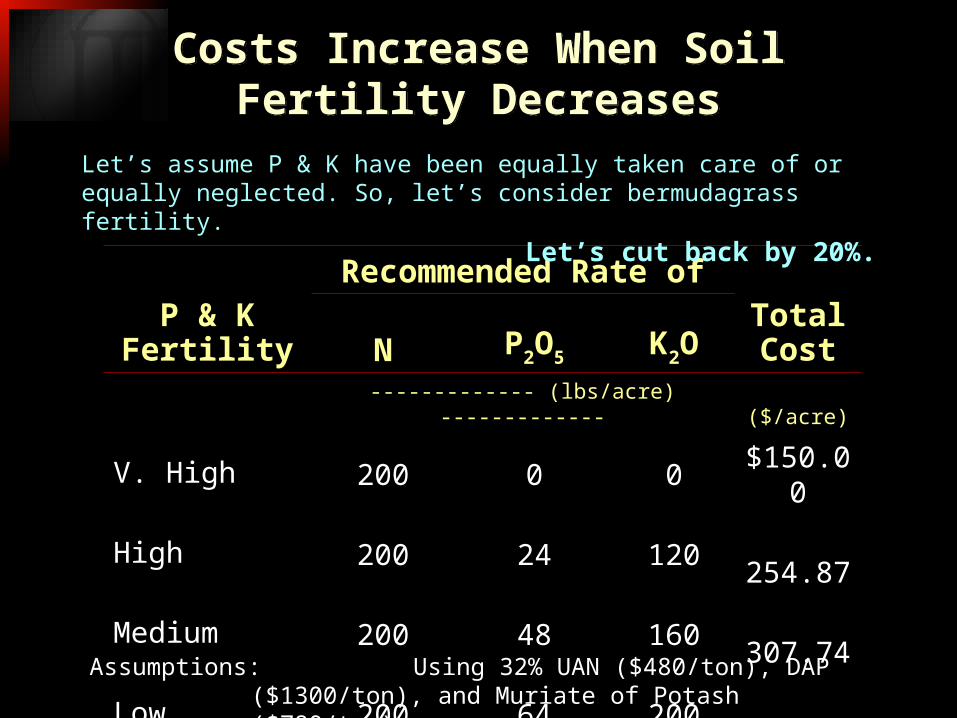
Costs Increase When Soil Fertility Decreases
Costs Increase When Soil Fertility Decreases
Recommended Rate of
P & K Fertility N P2O5 K2O
Total Cost
------------- (lbs/acre) ------------- ($/acre)
V. High 200 0 0$150.0
0
High 200 24 120
254.87
Medium 200 48 160
307.74
Low 200 64 200
351.65
Assumptions: Using 32% UAN ($480/ton), DAP ($1300/ton), and Muriate of Potash ($780/ton).
Let’s assume P & K have been equally taken care of or equally neglected. So, let’s consider bermudagrass fertility.
Let’s cut back by 20%.

Broiler Numbers Layer Numbers
A Major Fertility AdvantageA Major Fertility Advantage

Poultry Litter for Hay FieldsPoultry Litter for Hay Fields
• An excellent source of fertility, when used wisely.
• N release is skewed to the summer months.
• Weed pressure does increase Not a source of weed seed Changes the fertility and makes
broadleaf weeds more competitive.
• Potassium fertilization may not be adequate Poultry Litter: 3-3-2 Ideal bermudagrass fertilizer: 4-1-
3
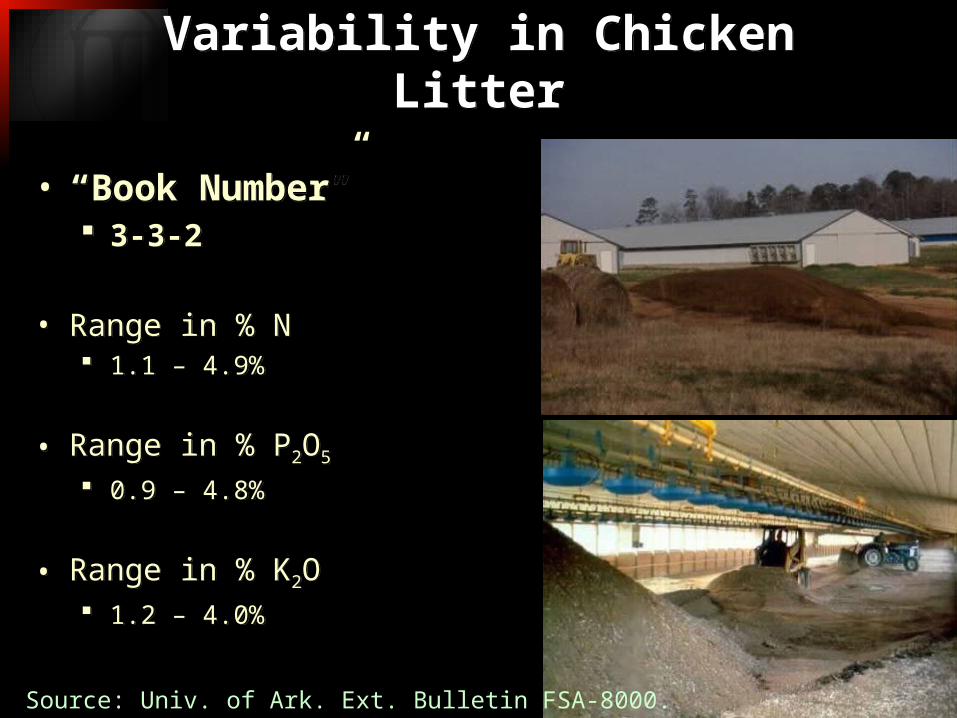
Variability in Chicken LitterVariability in Chicken Litter
• “Book Number” 3-3-2
• Range in % N 1.1 – 4.9%
• Range in % P2O5
0.9 – 4.8%
• Range in % K2O 1.2 – 4.0%
• “Book Number” 3-3-2
• Range in % N 1.1 – 4.9%
• Range in % P2O5
0.9 – 4.8%
• Range in % K2O 1.2 – 4.0%
Source: Univ. of Ark. Ext. Bulletin FSA-8000.

Foliar Fertilizer ApplicationsFoliar Fertilizer Applications
• Even if the product is 100% efficient (likely isn’t)
• The most a plant can take up will be 1-2 lbs of nutrients Works for many micro-nutrients (small quantities
needed) Not feasible for macro-nutrients without multiple
applications. (large quantities needed)
• Even if the product is 100% efficient (likely isn’t)
• The most a plant can take up will be 1-2 lbs of nutrients Works for many micro-nutrients (small quantities
needed) Not feasible for macro-nutrients without multiple
applications. (large quantities needed)

Doing Many Things Well
FFFFFFFA
F

Nutrients Removed/Acre With Bermudagrass Hay or Corn
Silage
Nutrients Removed/Acre With Bermudagrass Hay or Corn
Silage
0
50
100
150
200
250
300
lbs/
acre
rem
ove
d
Nitrogen Phosphate Potash Calcium Mag
6 Tons Bermudagrass Hay
30 Tons Corn Silage
0
50
100
150
200
250
300
lbs/
acre
rem
ove
d
Nitrogen Phosphate Potash Calcium Mag
6 Tons Bermudagrass Hay
30 Tons Corn Silage

Nutrients removed per acre in a typical weaned beef calf.
Nutrients removed per acre in a typical weaned beef calf.
0
50
100
150
200
250
300
lbs/
acr
e r
em
oved
Nitrogen Phosphate Potash Calcium Mag
500 lb animal
0
50
100
150
200
250
300
lbs/
acr
e r
em
oved
Nitrogen Phosphate Potash Calcium Mag
500 lb animal
Adapted from S. Forages 3rd Ed.

Efficiency of Four-legged Manure Spreaders
Efficiency of Four-legged Manure Spreaders
White et al., 2001 J. Environ. Qual. 30:2180–2187

Nutrient Distribution in Pastures
Nutrient Distribution in Pastures

Mechanical
Hay 30-70%
Silage 60-85%
Green Chop 70-95%
Efficiencies of Grazing and Mechanized Harvest
Efficiencies of Grazing and Mechanized Harvest
Method Efficiency
Grazing
Continuous Stocking 30-40%
Slow Rotation (3-4 paddocks) 50-60%
Moderate Rotation (6-8 paddocks)
60-70%
Strip Grazing 70-80%

QUESTIONS?QUESTIONS?
www.georgiaforages.com1-800-ASK-UGA1
www.georgiaforages.com1-800-ASK-UGA1