SOFTBANK CORP. CONSOLIDATED FINANCIAL REPORT For · PDF fileSOFTBANK CORP. CONSOLIDATED...
39
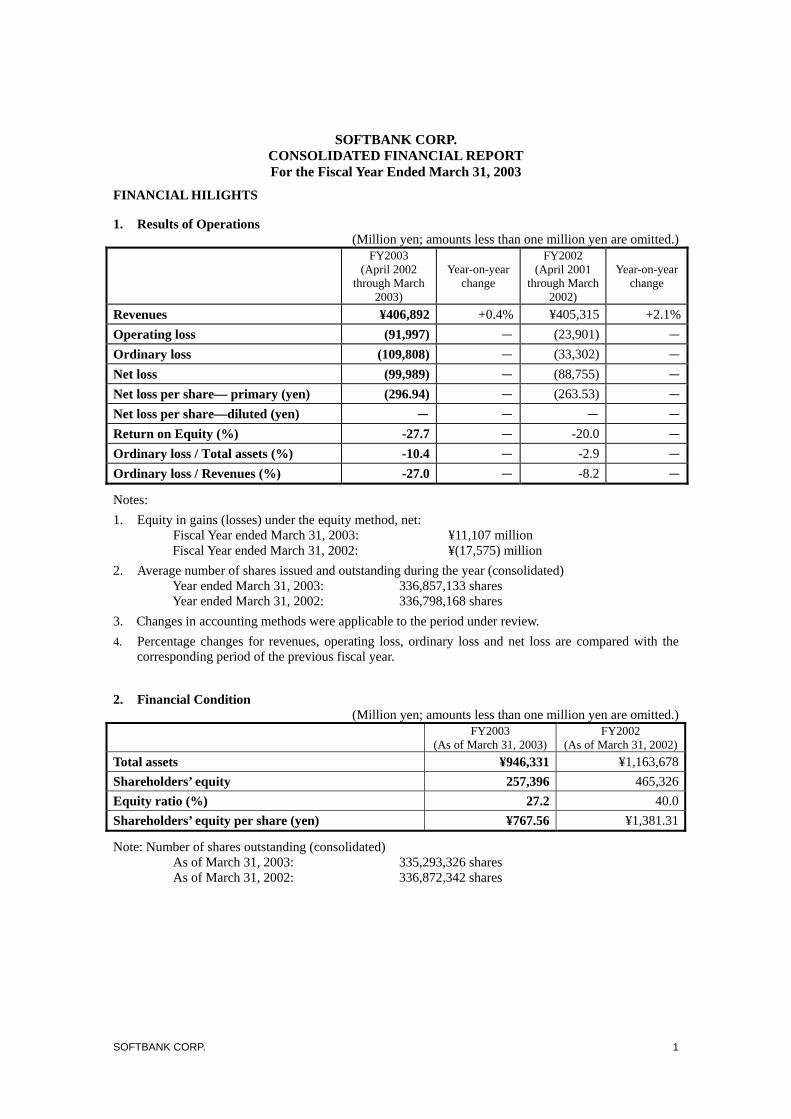
SOFTBANK CORP. CONSOLIDATED FINANCIAL REPORT For the Fiscal Year Ended March 31, 2003 FINANCIAL HILIGHTS 1. Results of Operations (Million yen; amounts less than one million yen are omitted.) FY2003 (April 2002 through March 2003) Year-on-year change FY2002 (April 2001 through March 2002) Year-on-year change Revenues ¥406,892 +0.4% ¥405,315 +2.1% Operating loss (91,997) - (23,901) - Ordinary loss (109,808) - (33,302) - Net loss (99,989) - (88,755) - Net loss per share— primary (yen) (296.94) - (263.53) - Net loss per share—diluted (yen) - - - - Return on Equity (%) -27.7 - -20.0 - Ordinary loss / Total assets (%) -10.4 - -2.9 - Ordinary loss / Revenues (%) -27.0 - -8.2 - Notes: 1. Equity in gains (losses) under the equity method, net: Fiscal Year ended March 31, 2003: ¥11,107 million Fiscal Year ended March 31, 2002: ¥(17,575) million 2. Average number of shares issued and outstanding during the year (consolidated) Year ended March 31, 2003: 336,857,133 shares Year ended March 31, 2002: 336,798,168 shares 3. Changes in accounting methods were applicable to the period under review. 4. Percentage changes for revenues, operating loss, ordinary loss and net loss are compared with the corresponding period of the previous fiscal year. 2. Financial Condition (Million yen; amounts less than one million yen are omitted.) FY2003 (As of March 31, 2003) FY2002 (As of March 31, 2002) Total assets ¥946,331 ¥1,163,678 Shareholders’ equity 257,396 465,326 Equity ratio (%) 27.2 40.0 Shareholders’ equity per share (yen) ¥767.56 ¥1,381.31 Note: Number of shares outstanding (consolidated) As of March 31, 2003: 335,293,326 shares As of March 31, 2002: 336,872,342 shares SOFTBANK CORP. 1
Transcript of SOFTBANK CORP. CONSOLIDATED FINANCIAL REPORT For · PDF fileSOFTBANK CORP. CONSOLIDATED...
SOFTBANK CORP. CONSOLIDATED FINANCIAL REPORT For the Fiscal Year Ended March 31, 2003
FINANCIAL HILIGHTS 1. Results of Operations
(Million yen; amounts less than one million yen are omitted.) FY2003
(April 2002 through March
2003)
Year-on-yearchange
FY2002 (April 2001
through March 2002)
Year-on-yearchange
Revenues ¥406,892 +0.4% ¥405,315 +2.1%Operating loss (91,997) - (23,901) -
Ordinary loss (109,808) - (33,302) -
Net loss (99,989) - (88,755) -
Net loss per share— primary (yen) (296.94) - (263.53) -
Net loss per share—diluted (yen) - - - -
Return on Equity (%) -27.7 - -20.0 -
Ordinary loss / Total assets (%) -10.4 - -2.9 -
Ordinary loss / Revenues (%) -27.0 - -8.2 -
Notes: 1. Equity in gains (losses) under the equity method, net:
Fiscal Year ended March 31, 2003: ¥11,107 million Fiscal Year ended March 31, 2002: ¥(17,575) million
2. Average number of shares issued and outstanding during the year (consolidated) Year ended March 31, 2003: 336,857,133 shares Year ended March 31, 2002: 336,798,168 shares
3. Changes in accounting methods were applicable to the period under review. 4. Percentage changes for revenues, operating loss, ordinary loss and net loss are compared with the
corresponding period of the previous fiscal year. 2. Financial Condition
(Million yen; amounts less than one million yen are omitted.) FY2003
(As of March 31, 2003)FY2002
(As of March 31, 2002)Total assets ¥946,331 ¥1,163,678Shareholders’ equity 257,396 465,326Equity ratio (%) 27.2 40.0Shareholders’ equity per share (yen) ¥767.56 ¥1,381.31
Note: Number of shares outstanding (consolidated) As of March 31, 2003: 335,293,326 shares As of March 31, 2002: 336,872,342 shares
SOFTBANK CORP. 1
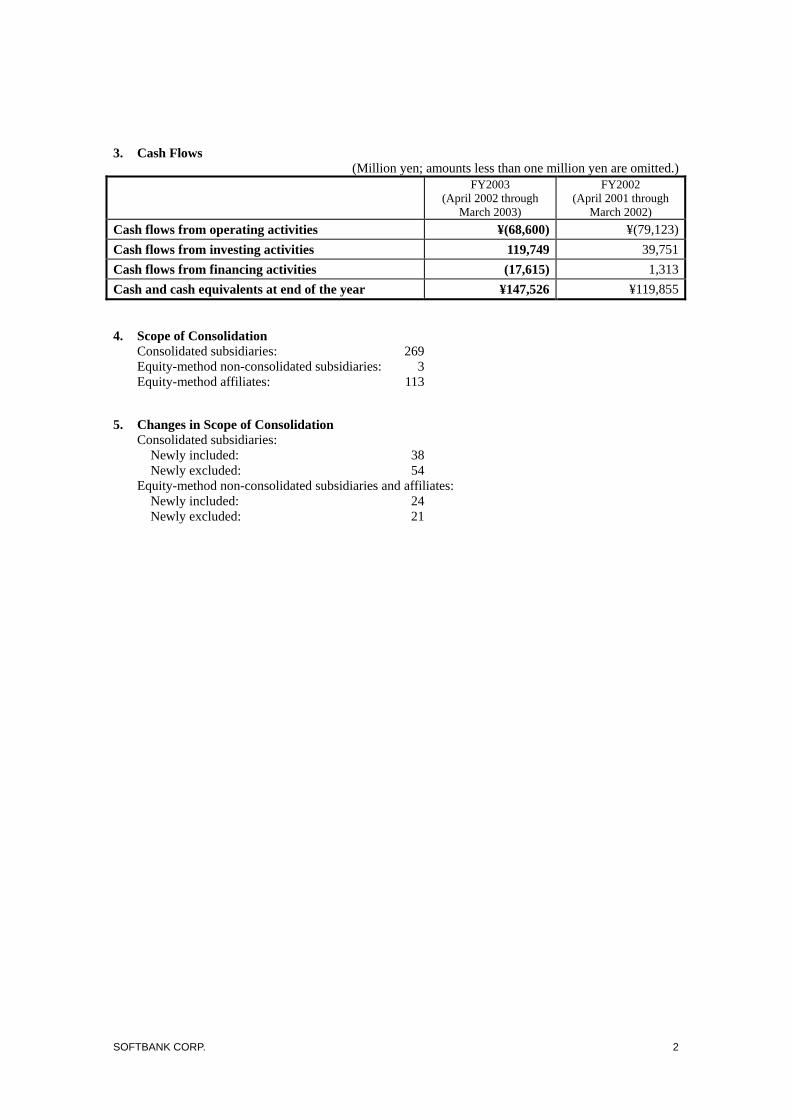
3. Cash Flows
(Million yen; amounts less than one million yen are omitted.) FY2003
(April 2002 through March 2003)
FY2002 (April 2001 through
March 2002) Cash flows from operating activities ¥(68,600) ¥(79,123)Cash flows from investing activities 119,749 39,751Cash flows from financing activities (17,615) 1,313Cash and cash equivalents at end of the year ¥147,526 ¥119,855 4. Scope of Consolidation
Consolidated subsidiaries: 269 Equity-method non-consolidated subsidiaries: 3 Equity-method affiliates: 113
5. Changes in Scope of Consolidation
Consolidated subsidiaries: Newly included: 38 Newly excluded: 54 Equity-method non-consolidated subsidiaries and affiliates: Newly included: 24 Newly excluded: 21
SOFTBANK CORP. 2

The SOFTBANK Group As of March 31, 2003, the SOFTBANK Group comprised 385 companies with operation in 8 segments as follows.
Business segment
Consolidated
subsidiaries (includes partnerships)
Equity-method non-consolidated subsidiaries and
affiliates (includes partnerships)
Principal products and operational content of each business
1. Broadband Infrastructure 14 8
ADSL high-speed Internet connection service and IP telephony service; fiber-optic ultra-high-speed Internet connection service and other operations
2. e-Commerce 19 10 Sales of PC software and such hardware as PCs and peripherals; enterprise solutions; diversified e-commerce business, including e-commerce between business and consumer
3. e-Finance 133 15 All inclusive Web-based financial operations, including Internet securities operations; management of domestic venture capital funds; incubation of portfolio corporations
4. Media & Marketing 13 7 Book and magazine publication in such areas as PCs, the Internet, entertainment, etc.; exhibition management; web content development
5. Broadmedia 14 2 Provision of applications and content for broadband broadcasting and communications and promoting the spread of such operations
6. Internet Culture 16 6 Internet-based advertising operations; broadband portal business; Internet-based auction business
7. Technology Services 7 4 Systems solutions business; business solutions business
8. Overseas Funds 42 54 U.S.- and Asia-focused global private equity operations in Internet-related companies
9. Others 11 10 Holding company functions for overseas operations; back-office services in Japan
Total 269 116 Note: SOFTBANK BB Corp., which is engaged in the Broadband Infrastructure and e-Commerce segments, is included in the Broadband Infrastructure segment; Yahoo Japan Corporation, which is engaged in the Internet Culture and Broadband Infrastructure segments, is included in the Internet Culture segment. Both of them are consolidated subsidiaries. I
SOFTBANK CORP.
・・
・・
SOFTBANK CORP.(Pure Holding Company)
e-Commerce
e-Finance
Media &MarketingTechnology
Services
Others
BroadbandInfrastructure
Broadmedia
nternet Culture
Overseas Funds
Morningstar, Inc.SOFTBANKFINANCE
CORPORATION
E*TRADE Japan K.K.
E*TRADE SECURITIES, CO., LTD.
Morningstar Japan K.K.
SOFTBANK INVESTMENT
CORPORATION
Dee Corp.
CarPoint K.K.
SOFTBANK Publishing Inc.
SOFTBANK ZDNet Inc.
SOFTBANK Media &Marketing Corp.
SOFTBANKTECHNOLOGY CORP.
Yahoo Japan Corporation
Club iT Corporation
BB Cable Corporation
SOFTBANKHoldings Inc.
[Domestic][Domestic][Overseas]
[Overseas]
UTStarcom, Inc.
SOFTBANKBroadmediaCorporation
[Operation HoldingCompanies] [Operation Holding
Companies]
SB CHINA HOLDINGS PTE LTD
Vector Inc.
cyber communications inc.
SOFTBANKTECHNOLOGY
HOLDINGS CORP.
Aozora Bank, Ltd.
IP REVOLUTION, INC.
SOFTBANK Korea Co., Ltd.
SOFTBANK FRONTIERSECURITIES CO., LTD
SOFTBANK US Ventures VI L.P.
Tavigator, Inc.
SB Life Science Ventures I, L.P.
e-Shopping! Books CORP.
SOFTBANK BB Corp.
・・
Segment
Consolidated subs
・ idiary
Equity-method subsid
・ ・ iary or affiliate
3
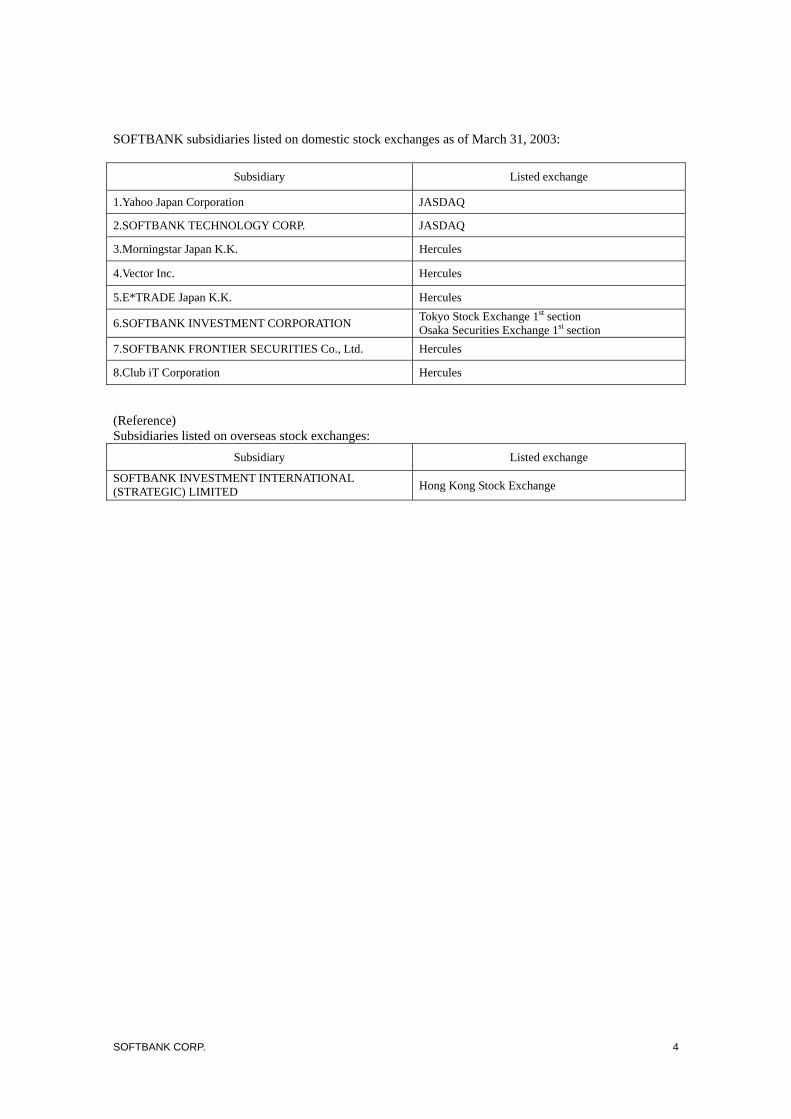
SOFTBANK subsidiaries listed on domestic stock exchanges as of March 31, 2003:
Subsidiary Listed exchange
1.Yahoo Japan Corporation JASDAQ
2.SOFTBANK TECHNOLOGY CORP. JASDAQ
3.Morningstar Japan K.K. Hercules
4.Vector Inc. Hercules
5.E*TRADE Japan K.K. Hercules
6.SOFTBANK INVESTMENT CORPORATION Tokyo Stock Exchange 1st section Osaka Securities Exchange 1st section
7.SOFTBANK FRONTIER SECURITIES Co., Ltd. Hercules
8.Club iT Corporation Hercules (Reference) Subsidiaries listed on overseas stock exchanges:
Subsidiary Listed exchange
SOFTBANK INVESTMENT INTERNATIONAL (STRATEGIC) LIMITED Hong Kong Stock Exchange
SOFTBANK CORP. 4
Management Policies 1. Fundamental Management Policy
The core management philosophy of the SOFTBANK Group (hereafter the “Group”) is
“Endeavoring to benefit society and the economy by fostering the sharing of wisdom and knowledge
gained through the IT revolution.” By conducting business activities in a creative manner, the Group
focuses its energy on both benefiting society and increasing its corporate value.
Since fiscal 2001, the Group has been guided by a management vision to use broadband to accelerate
the pace of the IT revolution in the 21st century. Accordingly, the Group’s resources are being
concentrated on the broadband business, with a particular focus on the broadband infrastructure
business.
This management policy remained unchanged in fiscal 2003, as the entire Group continued to direct
its resources and efforts to the broadband business. To create a solid platform for the promotion of its
broadband business, the Group merged four consolidated subsidiaries in January 2003 to create
SOFTBANK BB Corp., the Group’s largest operating company. This new company is clearly
positioned as the nucleus of the Group. The Group’s commitment to focusing on the broadband
business in order to maximize corporate value is firmly established.
2. Policy Regarding Allocation of Earnings
SOFTBANK CORP. (hereafter the “Company”) has followed a policy of distributing earnings in a
stable and proper manner to shareholders and all other stakeholders. In fiscal 2003, consolidated
retained earnings declined resulting from start-up costs in the broadband infrastructure business.
However, in consideration of our corporate policy to pay a stable dividend to shareholders, as well as
the Group’s medium to long-term outlook, the Company intends to pay a dividend of ¥7 per share, as
in fiscal 2002. As evidenced by the growing number of customers and other positive factors, the
Group is seeing concrete results in terms of earnings and cash flows from the broadband
infrastructure business, which will become the primary source of sales and earnings for the Group
over the medium and long term.
3. Medium and Long-Term Strategies and Key Performance Indicators
The Group’s management strategies over the medium and long-term are as stated:
1. Generate and maximize stable earnings and cash flows by succeeding in the broadband
infrastructure business. In this endeavor, the current goals are to continue to expand the customer
base and to quickly achieve profitability in the broadband infrastructure business.
SOFTBANK CORP. 5
2. Concurrently, the Group aims to develop a broad array of opportunities to generate earnings and
cash flows by leveraging synergies between Group companies and the broadband infrastructure
business.
These two strategies are integral elements of the Group’s management strategy.
Strategy 1 – Success in the Broadband Infrastructure Business - The Group is currently placing the highest priority on developing the broadband infrastructure
business.
- During fiscal 2003, the first step in this direction was taken by successfully achieving the goal of
expanding the customer base for the Yahoo! BB comprehensive broadband service jointly operated
by SOFTBANK BB Corp. and Yahoo Japan Corporation.
- In early February 2003, Yahoo! BB became the first DSL communications carrier and ISP in Japan
to exceed 2 million lines installed on a cumulative basis (according to data compiled by the Ministry
of Public Management, Home Affairs, Posts and Telecommunications), ranking solidly in first place
in Japan as both a communications carrier and ISP.
- Yahoo! BB has ranked first in Japan in the number of new lines installed every month as of June
2002.
- The Group’s ability to marshal its collective strengths to offer a variety of services and conduct an
effective and innovative sales promotion has been key to expanding the customer base.
- The most distinguishing feature of Yahoo! BB is a nationwide pure-IP broadband network that is
nearly complete. This network was designed from the outset to support the bundling of IP telephony
and other types of broadband services. Strategy 2 – Realize Synergies Between SOFTBANK Group Companies via the Broadband Infrastructure Business The Group’s operations and businesses in total exceed the business domains of other existing
communications carriers. Remaining firmly based on the infrastructure network, but providing a
greater scope, the Group’s business activities can further expand the breadth of the broadband
market.
The following are some specific illustrations.
- Yahoo Japan Corporation, Japan’s largest Internet portal, made a significant contribution to the
Group’s consolidated earnings in fiscal 2003 with the success of its Internet auction business and
other services. Over the medium and long-term, Yahoo! Japan’s brand can be further leveraged to
offer a variety of contents and services via the Group’s broadband infrastructure.
- SOFTBANK BB Corp., which is Japan’s leading distributor of IT products, has vendor and reseller
relationships built up over more than two decades, and has developed considerable business
expertise. Expectations are therefore high for rapid growth in the development and introduction of
SOFTBANK CORP. 6

broadband-related products and services.
- BB Cable Corporation, which is part of the Broadmedia segment, launched its BB Cable TV service
by using the ADSL network of Yahoo! BB. The Group’s objective is to create a new market in which
broadcasting and communications converge.
4. Important Management Issues
Achieve Profitability in the Broadband Infrastructure Business
As is true of most infrastructure businesses, the Group’s broadband infrastructure business requires
substantial start-up costs such as depreciation expenses for transmission equipment, etc., customer
acquisition costs and others. Expansion of the Yahoo! BB customer base was therefore a primary
goal in fiscal 2003 in order to rapidly increase the number of lines installed to a level at which
start-up costs can be recovered. As the cumulative lines installed have topped 2 million,
SOFTBANK BB Corp. is projected to achieve profitability on a monthly basis with its broadband
infrastructure business at the operating level. Plans call for the continued expansion of lines installed
to broaden the customer base and concurrently achieve profitability in the shortest time possible.
Growth and Stability in Other Group Segments
For e-Commerce, Media & Marketing, Broadmedia, Internet Culture, Technology Services and other
segments, the Group’s objective is to promote growth by channeling management resources into
activities offering the greatest potential for synergies with the strategic broadband infrastructure
business.
In the case of e-Finance and Overseas Funds, the nature of their business activities makes them
susceptible to volatile equity markets and related factors, which have adversely impacted their
business results. The Group intends to recover operating profitability by effectively managing
these businesses in accordance with market trends.
Diversifying Funding Channels
The Group primarily utilized cash and cash equivalents, proceeds from the sale of investment
securities, proceeds from the sale of stock in affiliated companies, and other measures to finance the
broadband infrastructure business and redeem maturing bonds. In segments other than the broadband
infrastructure, the Group businesses are projected to be self-funding. Funds required for the
Broadband Infrastructure segment’s capital expenditures, marketing programs and other activities
are to be procured through a variety of channels. In particular, funds for the procurement of
transmission equipment related to the increase of lines installed will be funded through lease finance
and so-called “securitization” . Additionally, the Group will effectively manage its finances in
SOFTBANK CORP. 7
consideration of appropriate leverage levels and optimal capitalization composition, a process that
includes reducing the cost of capital.
5. Fundamental Policy and Measures Regarding Corporate Governance
Fundamental Policy for Corporate Governance
The Group believes that effective corporate governance is essential to conducting management with
a priority on shareholders and cash flows. The management organization is structured to divide
authority among relevant parties and create autonomous units. This approach has been beneficial as
the Group entered new business areas during the development of the Internet era. The Group’s
structure is composed of a pure holding company, operation holding companies and operating
companies to facilitate decision-making based on the specialized knowledge required by each of the
Group’s business segments. The pure holding company manages and coordinates all matters
involving businesses that span the entire Group, maximizing synergies generated by the Group and
making substantial contributions to increasing the Group’s corporate value. Maintaining the balance
between the division of responsibilities and integration of management functions, in accordance with
market conditions, is carefully considered. For example, SOFTBANK BB Corp., which was
formed through a merger of four Group’s consolidated companies, was recently established.
Enactment of Measures Regarding Corporate Governance
(1) Management organization and other corporate governance items related to management
decision-making and the execution and supervision of business operations
The nucleus of the Group’s corporate governance is a nine-member board of directors at the pure
holding company level. The board is structured to ensure that all issues are fully debated and that
decisions can be made accurately and efficiently. Thus, the board is enabled to effectively fulfill its
role to conduct strategic decision-making of Group-wide issues and overseeing operating results. A
certain proportion of board members (currently three of the nine members) are external directors.
The role of the external directors is to supervise the performance of the CEO. The Group continues
to adopt a corporate auditor system whereby the auditors monitor the directors and their performance
of duties. The majority of the corporate auditors are from outside the Group, ensuring fairness and
transparency.
To efficiently and cohesively manage the business segments, each of which is delegated considerable
autonomy, a CEO Conference composed of the Company’s CEO and representatives from each
business segment is held monthly. The Conference coordinates management policies, monitors
operating results of Group companies and performs various other tasks. In line with the Group’s
policy of focusing resources on carefully selected businesses, the CEO Conference is currently
SOFTBANK CORP. 8

conducting a bold rationalization of unprofitable businesses and realigning its business portfolio.
Regarding internal controls, the Group has a system of operational audits to evaluate and verify
compliance by the Company and the Group with management policies, laws, articles of
incorporation, regulations, guidelines and other applicable rules.
Furthermore, the Group is distinguished by its various measures to strengthen corporate governance
functions, such as the extensive use of IT to facilitate efficient management and the attendance by an
external corporate lawyer at all board and CEO Conference meetings to provide guidance and
advice.
(2) Significant personal, financial, business or other relationships between the Group and external
directors and external corporate auditors
There are no applicable items.
(3) Measures taken during the past year to improve corporate governance
During the past year, there were organizational enhancements in the Group management and public
relations functions undertaken by the pure holding company. The Internal Audit Department was
established at the holding company in January 2002 and is responsible for monitoring the activities
of the Company and each Group companies to ensure compliance with management policies. To
confirm and maintain fairness and transparency of all business practices, the Group consistently
strives to enhance disclosure of relevant information. By holding meetings to report on operations,
informational meetings for securities analysts and others, placing news releases and other
information on its Web site, and conducting other related activities, the Group is taking prudent steps
to enhance its IR activities.
6. Other items
Fundamental Policy Regarding Relationships with Related Parties
There are no applicable items.
Important Items Regarding the Company’s Management
There are no applicable items.
SOFTBANK CORP. 9
Results of Operations and Financial Position 1. Results of Operations
Summary
Revenues increased ¥1,576 million, or 0.4%, to ¥406,892 million. Comparing with fiscal 2002,
revenues increased in the Broadband Infrastructure and Internet Culture segments and decreased in
the Media & Marketing and e-Commerce segments, respectively.
The operating loss increased ¥68,096 million to ¥91,997 million. The primary factor for this loss was
the increase in costs accompanying the expansion of operations in the Broadband Infrastructure
segment, which remains in the start-up phase. Excluding that segment, the other segments in total
achieved profitability at the operating level.
The ordinary loss increased ¥76,506 million to ¥109,808 million. This was the result of the operating
loss mentioned above and an increase of ¥8,410 million in net non-operating expenses to ¥17,811
million. Non-operating items included net equity in gains under the equity method of ¥11,107
million, compared to a net equity in losses under the equity method in fiscal 2002. However, there
was a net loss of ¥12,832 million on distributions from partnerships and a net exchange loss of
¥7,704 million because of the yen’s appreciation, as compared to the net exchange gains of ¥24,939
million in fiscal 2002. Net interest expenses decreased ¥5,925 million to ¥7,648 million due to the
reduction in interest-bearing debt.
The net loss increased ¥11,234 million to ¥99,989 million. There was a net special gain of ¥38,333
million, which was the result of special income of ¥134,405 million and special losses of ¥96,071
million. The loss before income taxes and minority interest decreased ¥48,465 million to ¥71,474
million. The largest component of special income was a gain on sale of investment securities of
¥127,607 million, representing the partial sale of stock held in Yahoo! Inc., Yahoo Japan Corporation
and UTStarcom, Inc. The major components of special losses were a loss on sale of investment
securities of ¥10,846 million, attributed to the sale of stock held in E*TRADE Group, Inc. and
CNET Networks, Inc., a valuation loss on investment securities of ¥33,848 million, derived
principally from the revaluation of stock held in CNET Networks, Inc. and E*TRADE Group, Inc.,
and a valuation loss on investments in affiliates of ¥32,323 million, primarily due to the revaluation
of stock held in Key3Media Group, Inc.
Results of Operations by Business Segment
SOFTBANK BB Corp. was established in January 2003, and since then the operations of
SOFTBANK CORP. 10
SOFTBANK BB Corp. were apportioned into the Broadband Infrastructure segment (for operations
formerly conducted mainly by BB Technologies Corporation and SOFTBANK Networks Inc.) and
the e-Commerce segment (for operations formerly conducted mainly by SOFTBANK EC
HOLDINGS CORP. and SOFTBANK COMMERCE CORP.). Furthermore, operating results of the
Yahoo! BB business ascribed to Yahoo Japan Corporation and those attributed to the Yahoo! BB
sales activities conducted by the former SOFTBANK COMMERCE CORP. for the April through
December period of fiscal 2003 were included in the Broadband Infrastructure segment’s fiscal 2003
results in order to accurately present the Group’s activities.
Broadband Infrastructure-Segment sales increased ¥30,839 million, or 336.3%, to ¥40,007
million. This was mainly attributable to the sharp growth in revenues for the Yahoo! BB business
when the number of lines installed surged from approx. 490,000 at the end of fiscal 2002 to approx.
2,360,000 at the end of fiscal 2003 and the service lineup was expanded. The growth in lines
installed increased customer acquisition costs related to incentive payments to sales agents and other
marketing expenses, as well as associated equipment depreciation expenses and lease payments, etc.
The operating loss increased ¥78,252 million to ¥96,204 million. For activities other than the Yahoo!
BB business, IP REVOLUTION, INC. (a wholly owned subsidiary of SOFTBANK BB Corp.), as a
provider of an ultra-high-speed, fiber-optic Internet connection services, realized steady growth in
sales throughout the fiscal year and achieved profitability on a monthly basis in the second half of
fiscal 2003.
To enhance its equity and strengthen its financial base, SOFTBANK BB Corp. procured ¥120,000
million through the issuance of common stock to SOFTBANK CORP. As half of this amount was
allocated to common stock, SOFTBANK BB Corp.’s common stock stood at ¥63,000 million at the
end of fiscal 2003.
e-Commerce-Segment sales decreased ¥18,109 million, or 6.4%, to ¥266,086 million. In fiscal
2002, this segment had benefited from the distribution of a major product from MICROSOFT CORP.
and the strong demand for anti-virus software sparked by widely publicized Internet viruses. Absent
such factors, SOFTBANK BB Corp. (formerly SOFTBANK COMMERCE CORP.) recorded a
decline in sales for fiscal 2003. The operating income decreased ¥739 million, or 23.1%, to ¥2,466
million, due to lower sales and competitive pressure on operating margins.
Among other e-Commerce segment companies, Vector Inc. continued to post growth in sales and
operating income in fiscal 2003, while CarPoint K.K. and e-Career CORP. both became profitable at
the operating level. Additionally, Dee Corp. and e-Shopping! Toys CORP. have progressed from
SOFTBANK CORP. 11

start-up to growth stages.
e-Finance-Segment revenue increased ¥3,906 million, or 16.1%, to ¥28,167 million. A major
contributor to this growth was increased brokerage commissions and financial income from interest
and dividends at E*TRADE SECURITIES, CO., LTD. The operating loss increased ¥903 million to
¥5,823 million, mainly due to an increase in valuation loss on operational investment securities of
SOFTBANK INVESTMENT CORPORATION attributed to adverse trends in the global financial
markets. In non-operating income and expenses, the segment posted a net loss of ¥12,583 million on
distributions from partnerships. Special losses of ¥4,246 million on the revaluation of affiliated
companies recorded by a consolidated subsidiary in Hong Kong and ¥2,541 million (other special
losses) due to a refund of success fees by SOFTBANK Ventures, Inc.
Media & Marketing-Segment sales decreased ¥31,526 million, or 65.1%, to ¥16,912 million and
the operating income decreased ¥3,085 million to a loss of ¥523 million. The exclusion from
consolidation of Key3Media Group, Inc. was the primary cause for the decline in both sales and
operating income. Also, the market for IT-related magazines and books faced contraction as
individuals increasingly used the Internet to acquire information. Due to this trend, both sales and
operating income declined at SOFTBANK Publishing Inc. Nevertheless, improvements in
SOFTBANK Publishing Inc.’s operating income were achieved in the second half of fiscal 2003, as
compared to the second half of fiscal 2002, through cost reductions and other measures.
Improvements in profitability were also realized at the operating level for SOFTBANK ZDNet Inc.
and other Media & Marketing segment companies.
Broadmedia-Segment sales decreased ¥182 million, or 1.5%, to ¥11,944 million. This was
principally the result of a marginal decline in sales at Club iT Corporation. Although sales from
services provided to existing CS subscribers remained solid, the company was no longer acquiring
new subscribers. Revenue increases were posted by BB Factory Corporation, which operates
“chBB”, a CS channel devoted exclusively to games-related programs, and CDN Solutions K.K.
(formerly Akamai Technologies Japan K.K.), which steadily acquired clients from among major
media firms and other companies. The operating loss increased ¥1,576 million to ¥1,615 million.
The primary factors were start-up expenses at CDN Solutions K.K. and development-related
expenses at BB Cable Corporation, which launched the “BB Cable TV” service via the ADSL
network. A consolidated adjustment of ¥3,295 million was amortized in fiscal 2003 as the special
loss (valuation loss on investment in affiliates) relating to the tender offer for Club iT Corporation.
Internet Culture-Segment sales increased ¥6,185 million, or 19.3%, to ¥38,200 million. The main
SOFTBANK CORP. 12

sources of growth were Yahoo Japan Corporation’s advertising revenues, which achieved an all-time
high, its introduction of system utilization fees and increased volume in its auction business.
Tavigator, Inc. also posted higher sales. Operating income for the segment increased ¥6,945 million,
or 69.9%, to ¥16,881 million, resulting from the income growth posted by the aforementioned Yahoo
Japan Corporation’s businesses.
Technology Services-Segment sales increased ¥7,201 million, or 38.9%, to ¥25,728 million. The
main contributor was SOFTBANK TECHNOLOGY CORP., specifically its e-business services such
as PC software and settlement and collection services and the ADSL sales support service of its
broadband solutions business. Operating income decreased ¥22 million, or 1.9%, to ¥1,113 million,
impacted by declines in the gross margin for the business solution and broadband solution businesses,
as well as increased personnel expenses, at SOFTBANK TECHNOLOGY CORP.
Overseas Funds-Segment revenue increased ¥796 million, or 32.1%, to ¥3,277 million, primarily
reflecting growth in fund management fees at SOFTBANK Holdings Inc. Operating income rose
¥2,218 million to ¥1,991 million as cost reductions from restructuring restored the segment
profitability.
Others-Segment sales decreased ¥4,941 million, or 23.8%, to ¥15,862 million. The operating loss
decreased ¥271 million to ¥6,383 million.
Results of Operations by Geographic Segment
Japan-Sales increased ¥33,311 million, or 9.4%, to ¥387,033 million, as revenues rose in the
Broadband Infrastructure, Internet Culture and other segments. The operating loss increased ¥66,263
million to ¥82,255 million. This was chiefly the result of increased up-front costs in the Broadband
Infrastructure segment associated with the Yahoo! BB business expansion.
North America-Sales decreased ¥26,589 million, or 87.3%, to ¥3,864 million and the operating
loss was ¥617 million, a difference of ¥2,472 million compared with fiscal 2002’s operating income.
The main reason for these changes was the exclusion of Key3Media Group, Inc. from consolidation.
Europe- Sales decreased ¥2,508 million, or 94.0%, to ¥160 million. The operating loss was ¥573
million, an improvement of ¥687 million over fiscal 2002’s operating loss. The main reason for these
changes was the exclusion of Key3Media Group, Inc. from consolidation.
Korea-Sales decreased ¥5,546 million, or 28.4%, to ¥13,973 million. The operating loss increased
SOFTBANK CORP. 13
¥1,240 million to ¥2,817 million.
2. Financial Position
Balance Sheet Analysis
Current assets increased ¥12,989 million to ¥407,437 million. Cash and deposits increased ¥33,922
million, which was attributable mainly to the sales of investment securities and partial sales of
investments in subsidiaries. However, there was a ¥17,000 million decrease in other current assets
because temporary payments by SOFTBANK BB Corp. (formerly BB Technologies Corporation),
that had been placed in other current assets, were transferred to property and equipment.
Property and equipment increased ¥73,840 million to ¥102,249 million. The main contributors
were the above mentioned transfer from other current assets and the purchase of transmission
equipment by SOFTBANK BB Corp., (formerly BB Technologies Corporation), including
equipment for installation in NTT central offices and modems for use in the homes of Yahoo! BB
subscribers.
Investments and other assets decreased ¥296,186 million to ¥412,346 million. As a result of the
partial sale of investments in Yahoo! Inc., UTStarcom, Inc. and other companies, investment
securities declined ¥253,735 million. Furthermore, investments in partnerships declined ¥43,849
million, which resulted primarily from the sale of investments in KFB Newbridge Investment, L.P.
and the revaluation of the carrying value of the SOFTBANK INTERNET TECHNOLOGY FUNDs.
Liabilities decreased ¥8,289 million to ¥642,929 million. Accounts payables – other increased
¥38,054 million, which reflected the purchase of transmission equipment by SOFTBANK BB Corp.
Interest-bearing debt declined ¥24,849 million due to bond redemptions and other factors. In
addition, long-term deferred tax liabilities decreased ¥37,676 million due to sales of investment
securities and other actions.
Shareholders’ equity decreased ¥207,929 million to ¥257,396 million. In addition to the ¥105,066
million decline in retained earnings caused by the net loss, the sale of investments in Yahoo! Inc. and
certain other factors resulted in a ¥87,029 million decline in net unrealized gain on other securities,
and there was a ¥13,644 million decline in translation adjustments.
Cash Flows Analysis
In fiscal 2003, cash was provided by investing activities, while used for operating and financing
SOFTBANK CORP. 14
activities. As a result, cash and cash equivalents increased to ¥147,526 million at the end of fiscal
2003., as compared to ¥119,855 million at the end of fiscal 2002.
Net cash used for operating activities was ¥68,600 million, ¥10,522 million less than cash used in
fiscal 2002. The loss before income taxes and minority interest was ¥71,474 million, but this was
partially offset by depreciation and amortization of ¥20,904 million and a valuation loss on
investment securities of ¥66,172 million and other non-cash expenses, while gains on sale of
marketable and investment securities of ¥116,839 million, equity in gains under the equity method of
¥11,107 million, and other non-cash income were negative factors. Another positive factor was the
¥11,977 million year-on-year decrease in cash payments for income taxes to ¥13,202 million.
Net cash provided by investing activities increased ¥79,998 million to ¥119,749 million. Purchases
of property and equipment and intangibles were ¥64,500 million (mainly transmission equipment
purchased by SOFTBANK BB Corp.) and purchase of marketable and investment securities was
¥33,413 million (mainly in the e-Finance segment). On the other hand, proceeds from sale of
marketable and investment securities, including Yahoo! Inc. stock, were ¥171,350 million and
proceeds from sale of interests in consolidated subsidiaries, including the partial sale of Yahoo Japan
Corporation stock, were ¥56,356 million.
Net cash used for financing activities was ¥17,615 million, a ¥18,929 million decrease from fiscal
2002. There was a ¥44,104 million increase in short-term borrowings, but repayment of bonds was
¥52,223 million. Furthermore, proceeds from issuance of bonds fell from ¥126,393 million to ¥2,496
million as measures were taken to reduce interest-bearing debts.
<Factors That May Have a Material Impact on Cash Flows in the Following Fiscal Year> Sale of investment in Aozora Bank, Ltd.
The Company is currently conducting negotiations to sell its investment in Aozora Bank, Ltd. and
plans to complete all necessary procedures before the semi-annual closing ending September 2003.
The Company expects that the sale of these shares will generate a suitable amount of proceeds. The
purchaser, timing of the sale, price and other matters will be disclosed when appropriate.
Redemption of Bonds
The Group had ¥178,087 million of bonds outstanding as of the end of fiscal 2003. Of this amount,
¥56,279 million is scheduled for redemption during fiscal 2004.
Commitment-line Contract
On October 24, 2002, the Company made a ¥86.0 billion commitment-line contract with eight banks
SOFTBANK CORP. 15

SOFTBANK CORP. 16
that was arranged by Mizuho Corporate Bank, Ltd. No decision has been reached at this time
regarding the extension of this contract in fiscal 2004. 【Equity ratio, Market cap equity ratio, Debt repayment period and Interest coverage ratio】 Years ended March 31 2003 2002
Equity ratio 27.2% 40.0%
Market cap equity ratio 48.9% 68.8%
Debt repayment period 6.7 years -
Interest coverage ratio 5.9 -
Equity ratio: Total shareholders’ equity / Total assets
Market cap equity ratio: Market capitalization / Total assets
Debt repayment period: Interest-bearing debt / Free cash flow
Interest coverage ratio: Free cash flow / Interest expenses
* All figures are computed from the Company’s consolidated financial statements.
* Market capitalization is calculated by multiplying the closing price of the Company’s shares by the
total number of shares outstanding at the end of fiscal 2003.
* Free cash flow represents the sum of operating and investing cash flows.
* Interest-bearing debt is the sum of liabilities on the consolidated balance sheets on which interest
must be paid.
* Negative figures are indicated by a “—“ sign.
* Interest expenses are the interest expense provided on the consolidated statements of income.

CONSOLIDATED BALANCE SHEETS
(Millions of yen; amounts less than one million yen are omitted.
Amount % Amount %
ASSETS
Current assets
Cash and deposits ¥147,503 ¥113,580 ¥33,922Notes and accounts receivable - trade 64,255 62,047 2,207Marketable securities 5,059 9,545 (4,485)Inventories 42,201 36,312 5,889Deferred tax assets 7,035 15,430 (8,394)Receivables related to margin transactions 48,847 42,316 6,531Other current assets 99,802 116,802 (17,000)Less : Allowance for doubtful accounts (current) (7,268) (1,586) (5,681)Total current assets 407,437 43.1 394,447 33.9 12,989
Non-current assets
Property and equipment, net
Transmission equipment 79,284 11,464 67,819Others 22,964 16,943 6,021Total tangible assets 102,249 10.8 28,408 2.4 73,840
Intangible assets, net
Software 11,194 8,741 2,453Consolidation adjustment 9,830 16,190 (6,360)Other intangibles 2,814 6,600 (3,786)Total intangible assets 23,838 2.5 31,531 2.7 (7,693)
Investments and other assets
Investment securities 267,414 521,150 (253,735)Investments in partnerships 97,606 141,456 (43,849)Long-term loans 780 1,287 (506)Deferred tax assets 32,701 35,832 (3,130)Other assets 15,637 10,313 5,323Less : Allowance for doubtful accounts (1,794) (1,506) (287)Total investments and other assets 412,346 43.6 708,533 60.9 (296,186)
Deferred charges 459 0.0 757 0.1 (298)
TOTAL ASSETS ¥946,331 ¥1,163,678 ¥(217,347)100.0 100.0
Increase(Decrease)
FY2003 FY2002 As of March 31, 2003 As of March 31, 2002
SOFTBANK CORP. 17
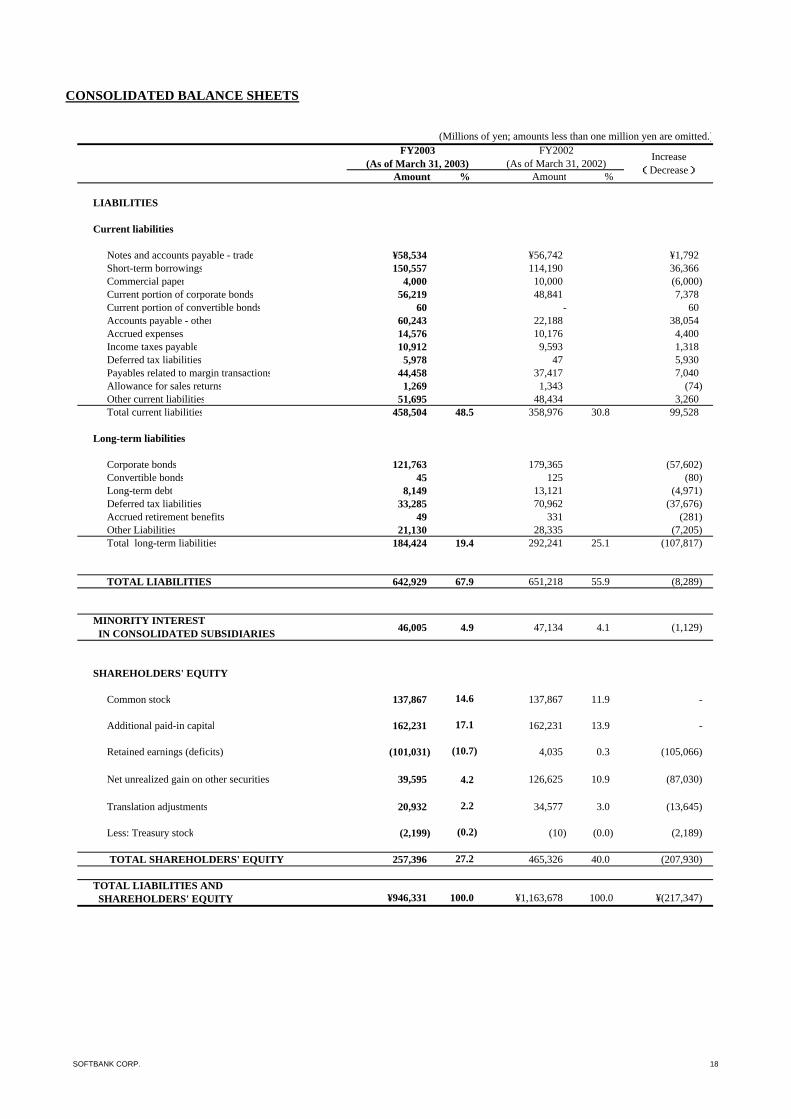
CONSOLIDATED BALANCE SHEETS
(Millions of yen; amounts less than one million yen are omitted.)
Amount % Amount %
LIABILITIES
Current liabilities
Notes and accounts payable - trade ¥58,534 ¥56,742 ¥1,792Short-term borrowings 150,557 114,190 36,366Commercial paper 4,000 10,000 (6,000)Current portion of corporate bonds 56,219 48,841 7,378Current portion of convertible bonds 60 - 60Accounts payable - other 60,243 22,188 38,054Accrued expenses 14,576 10,176 4,400Income taxes payable 10,912 9,593 1,318Deferred tax liabilities 5,978 47 5,930Payables related to margin transactions 44,458 37,417 7,040Allowance for sales returns 1,269 1,343 (74)Other current liabilities 51,695 48,434 3,260Total current liabilities 458,504 48.5 358,976 30.8 99,528
Long-term liabilities
Corporate bonds 121,763 179,365 (57,602)Convertible bonds 45 125 (80)Long-term debt 8,149 13,121 (4,971)Deferred tax liabilities 33,285 70,962 (37,676)Accrued retirement benefits 49 331 (281)Other Liabilities 21,130 28,335 (7,205)Total long-term liabilities 184,424 19.4 292,241 25.1 (107,817)
TOTAL LIABILITIES 642,929 67.9 651,218 55.9 (8,289)
46,005 4.9 47,134 4.1 (1,129)
SHAREHOLDERS' EQUITY
Common stock 137,867 14.6 137,867 11.9 -
Additional paid-in capital 162,231 17.1 162,231 13.9 -
Retained earnings (deficits) (101,031) (10.7) 4,035 0.3 (105,066)
Net unrealized gain on other securities 39,595 4.2 126,625 10.9 (87,030)
Translation adjustments 20,932 2.2 34,577 3.0 (13,645)
Less: Treasury stock (2,199) (0.2) (10) (0.0) (2,189)
TOTAL SHAREHOLDERS' EQUITY 257,396 27.2 465,326 40.0 (207,930)
¥946,331 ¥1,163,678 ¥(217,347)
MINORITY INTEREST IN CONSOLIDATED SUBSIDIARIES
TOTAL LIABILITIES AND SHAREHOLDERS' EQUITY
Increase(Decrease)
100.0 100.0
FY2003 FY2002(As of March 31, 2003) (As of March 31, 2002)
SOFTBANK CORP. 18
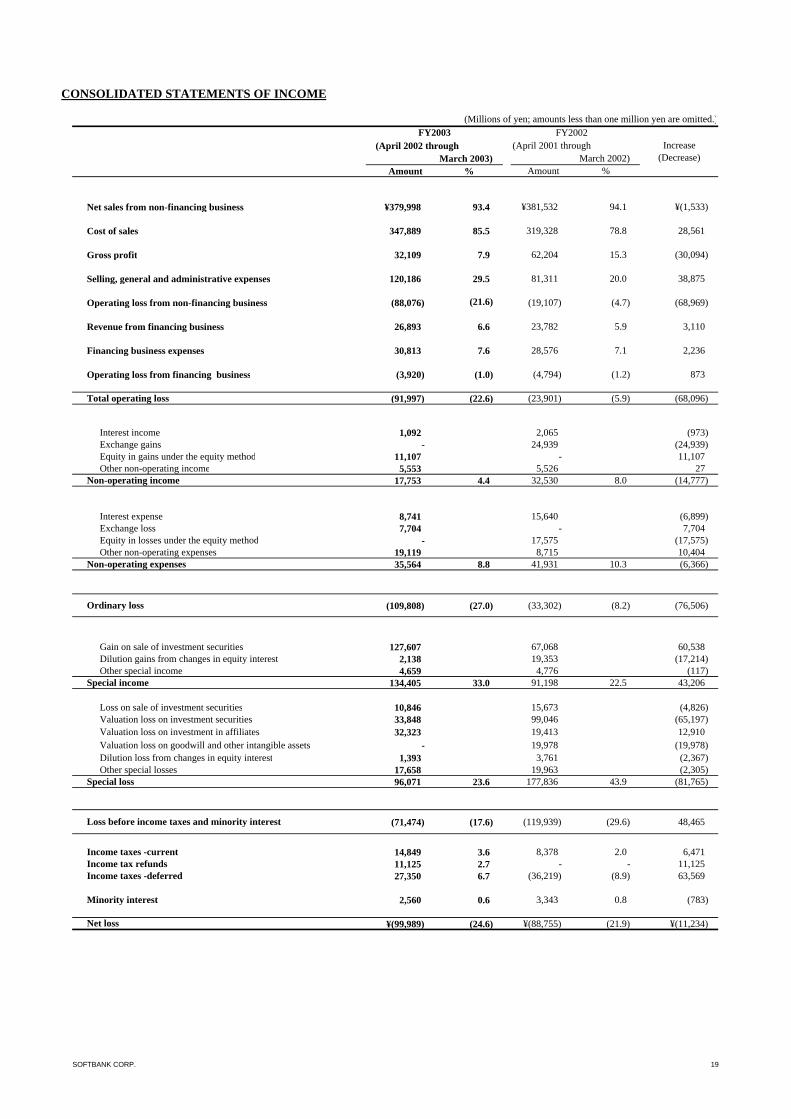
CONSOLIDATED STATEMENTS OF INCOME
(Millions of yen; amounts less than one million yen are omitted.)
Amount % Amount %
Net sales from non-financing business ¥379,998 93.4 ¥381,532 94.1 ¥(1,533)
Cost of sales 347,889 85.5 319,328 78.8 28,561
Gross profit 32,109 7.9 62,204 15.3 (30,094)
Selling, general and administrative expenses 120,186 29.5 81,311 20.0 38,875
Operating loss from non-financing business (88,076) (21.6) (19,107) (4.7) (68,969)
Revenue from financing business 26,893 6.6 23,782 5.9 3,110
Financing business expenses 30,813 7.6 28,576 7.1 2,236
Operating loss from financing business (3,920) (1.0) (4,794) (1.2) 873
(91,997) (22.6) (23,901) (5.9) (68,096)
Interest income 1,092 2,065 (973)Exchange gains - 24,939 (24,939)Equity in gains under the equity method 11,107 - 11,107Other non-operating income 5,553 5,526 27
17,753 4.4 32,530 8.0 (14,777)
Interest expense 8,741 15,640 (6,899)Exchange loss 7,704 - 7,704Equity in losses under the equity method - 17,575 (17,575)Other non-operating expenses 19,119 8,715 10,404
35,564 8.8 41,931 10.3 (6,366)
(109,808) (27.0) (33,302) (8.2) (76,506)
Gain on sale of investment securities 127,607 67,068 60,538Dilution gains from changes in equity interest 2,138 19,353 (17,214)Other special income 4,659 4,776 (117)
134,405 33.0 91,198 22.5 43,206
Loss on sale of investment securities 10,846 15,673 (4,826)Valuation loss on investment securities 33,848 99,046 (65,197)Valuation loss on investment in affiliates 32,323 19,413 12,910Valuation loss on goodwill and other intangible assets - 19,978 (19,978)Dilution loss from changes in equity interest 1,393 3,761 (2,367)Other special losses 17,658 19,963 (2,305)
96,071 23.6 177,836 43.9 (81,765)
(71,474) (17.6) (119,939) (29.6) 48,465
14,849 3.6 8,378 2.0 6,47111,125 2.7 - - 11,12527,350 6.7 (36,219) (8.9) 63,569
2,560 0.6 3,343 0.8 (783)
¥(99,989) (24.6) ¥(88,755) (21.9) ¥(11,234)
FY2003 FY2002Increase
(Decrease)(April 2002 through
March 2003)(April 2001 through
March 2002)
Special loss
Non-operating income
Non-operating expenses
Special income
Ordinary loss
Income tax refunds
Total operating loss
Net loss
Loss before income taxes and minority interest
Income taxes -current
Income taxes -deferred
Minority interest
SOFTBANK CORP. 19
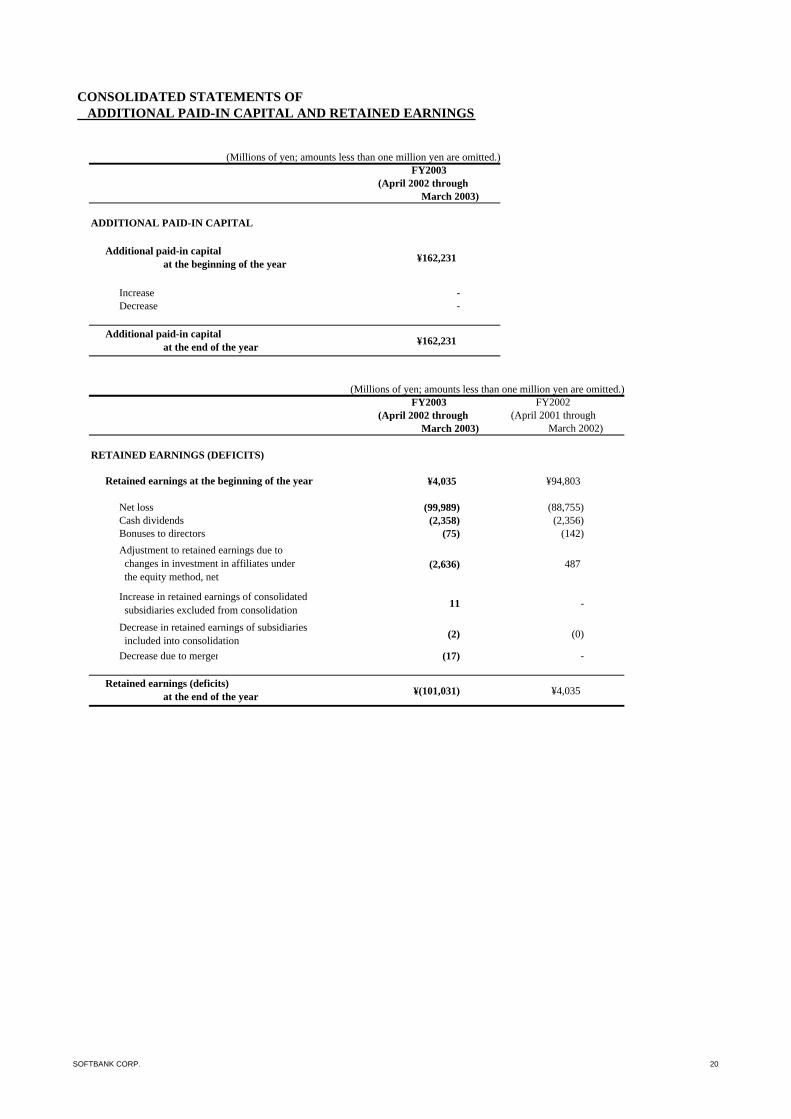
CONSOLIDATED STATEMENTS OF ADDITIONAL PAID-IN CAPITAL AND RETAINED EARNINGS
(Millions of yen; amounts less than one million yen are omitted.)
ADDITIONAL PAID-IN CAPITAL
¥162,231
Increase -Decrease -
¥162,231
(Millions of yen; amounts less than one million yen are omitted.)
RETAINED EARNINGS (DEFICITS)
¥4,035 ¥94,803
Net loss (99,989) (88,755)Cash dividends (2,358) (2,356)Bonuses to directors (75) (142)
(2,636) 487
Increase in retained earnings of consolidated subsidiaries excluded from consolidation 11 -
Decrease in retained earnings of subsidiaries included into consolidation (2) (0)
Decrease due to merger (17) -
¥(101,031) ¥4,035
Adjustment to retained earnings due to changes in investment in affiliates under the equity method, net
Retained earnings (deficits) at the end of the year
March 2003) March 2002)
Retained earnings at the beginning of the year
FY2003 FY2002(April 2002 through (April 2001 through
Additional paid-in capital at the end of the year
FY2003
Additional paid-in capital at the beginning of the year
March 2003)(April 2002 through
SOFTBANK CORP. 20

CONSOLIDATED STATEMENTS OF CASH FLOWS
(Millions of yen; amounts less than one million yen are omitted.)
I Cash flows from operating activities:¥(71,474) ¥(119,939)
20,904 11,749(11,107) 17,575
(744) (15,591)66,172 118,459
(116,839) (51,490)8,626 (20,311)
(1,311) (2,129)8,741 15,640
Valuation loss on goodwill and other intangible assets - 19,978(3,522) 16,6843,172 (10,533)8,576 (37,474)2,208 9,785
33,537 8,613(53,061) (38,983)
1,138 2,320(9,386) (17,281)
(13,202) (25,180)Refunds of income taxes 5,911 -
Net cash used for operating activities (68,600) (79,123)
II Cash flows from investing activities:(64,500) (30,272)(33,413) (71,426)171,350 157,985
(591) (18,263)(23) (33)
56,356 10,554(5,211) (12,803)1,975 8,294
(6,191) (4,283)Net cash provided by investing activities 119,749 39,751
III Cash flows from financing activities:4,842 11,039
44,104 (29,226)14,000 71,400
(20,000) (91,400)1,380 15,630
(7,758) (43,531)2,496 126,393
(52,223) (53,597)(2,354) (2,346)
Cash dividends paid to minority shareholders (122) (336)(1,980) (2,712)
Net cash (used for) provided by financing activities (17,615) 1,313
IV (5,728) 3,578
V Net increase (decrease) in cash and cash equivalents 27,805 (34,479)
VI60 2
VII(194) (4,772)
VIII Cash and cash equivalents at the beginning of the year 119,855 159,105
IX Cash and cash equivalents at the end of the year ¥147,526 ¥119,855
(April 2002 throughMarch 2003)
Effect of exchange rate changes
Additional investments in newly consolidated entities
Repayment of long-term debt
Increase in loan receivables
Proceeds from issuance of shares to minority shareholdersIncrease (decrease) in short-term borrowings, net
Collections of loans
Proceeds from sale of marketable and investment securities Purchase of marketable and investment securities
Proceeds from sale of interests in consolidated subsidiaries Proceeds from sale of interests in previously consolidated subsidiaries
Increase in cash and cash equivalents due to companies newly consolidatedDecrease in cash and cash equivalents due to exclusion of previously consolidated entities
Others, net
Others, net
Proceeds from issuance of bondsRepayment of bondsCash dividends paid
Proceeds from issuance of commercial paper Repayment of commercial paperProceeds from long-term debt
Income taxes paidInterest paidInterest and dividends received
Purchases of property and equipment and intangibles
Others, net Increase in other payables Decrease (increase) in other receivables
Loss before income taxes and minority interest
Depreciation and amortization Equity in (gains) losses under the equity method, net Dilution gains from changes in equity interest, net Valuation loss on investment securities Gains on sale of marketable and investment securities, net Exchange loss (gains), net
FY2002(April 2001 through
Increase (decrease) in payables-trade
Interest and dividend income Interest expense
(Increase) decrease in receivables- trade
March 2002)
FY2003
Adjustments to reconcile loss before income taxes and minority interest to net cash used for operating activities
SOFTBANK CORP. 21
Basis of Presentation of Consolidated Financial Statements
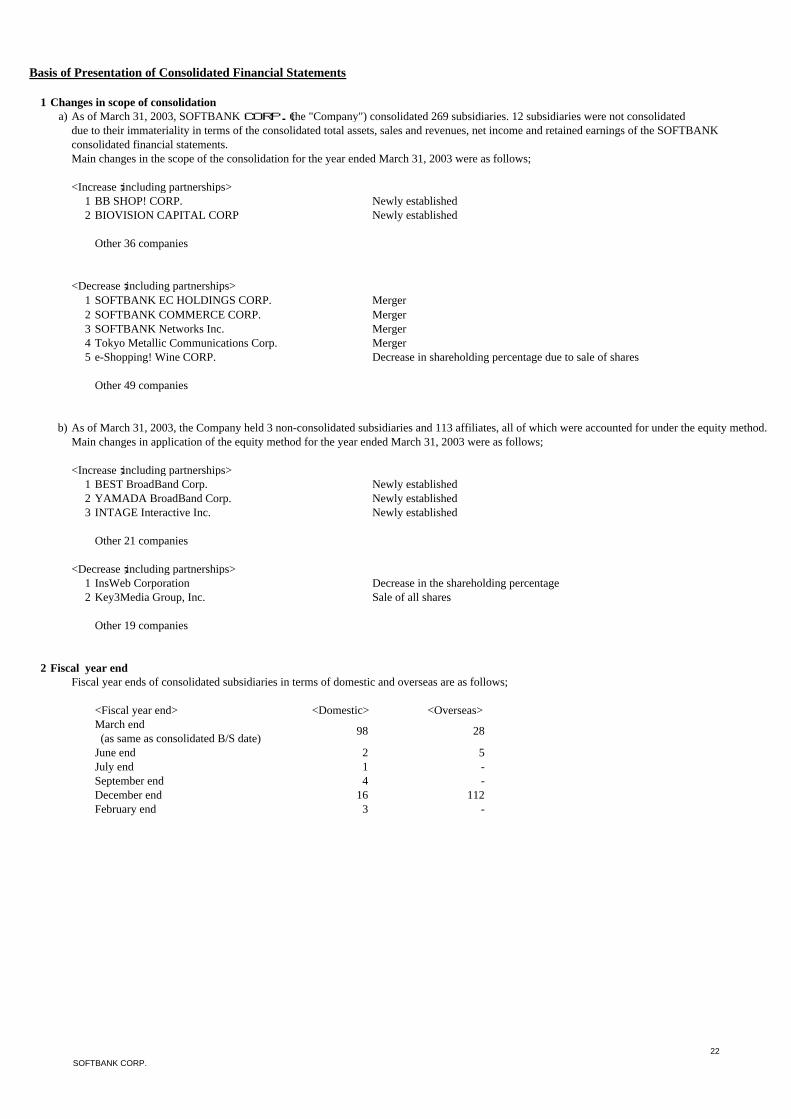
1 Changes in scope of consolidationa) As of March 31, 2003, SOFTBANK CORP.(the "Company") consolidated 269 subsidiaries. 12 subsidiaries were not consolidated
due to their immateriality in terms of the consolidated total assets, sales and revenues, net income and retained earnings of the SOFTBANK consolidated financial statements.Main changes in the scope of the consolidation for the year ended March 31, 2003 were as follows;
<Increase;including partnerships>1 BB SHOP! CORP. Newly established2 BIOVISION CAPITAL CORP Newly established
Other 36 companies
<Decrease;including partnerships>1 SOFTBANK EC HOLDINGS CORP. Merger2 SOFTBANK COMMERCE CORP. Merger3 SOFTBANK Networks Inc. Merger4 Tokyo Metallic Communications Corp. Merger5 e-Shopping! Wine CORP. Decrease in shareholding percentage due to sale of shares
Other 49 companies
b) As of March 31, 2003, the Company held 3 non-consolidated subsidiaries and 113 affiliates, all of which were accounted for under the equity method.Main changes in application of the equity method for the year ended March 31, 2003 were as follows;
<Increase;including partnerships>1 BEST BroadBand Corp. Newly established2 YAMADA BroadBand Corp. Newly established3 INTAGE Interactive Inc. Newly established
Other 21 companies
<Decrease;including partnerships>1 InsWeb Corporation Decrease in the shareholding percentage 2 Key3Media Group, Inc. Sale of all shares
Other 19 companies
2 Fiscal year endFiscal year ends of consolidated subsidiaries in terms of domestic and overseas are as follows;
<Fiscal year end> <Domestic> <Overseas>March end (as same as consolidated B/S date) June end 2 5July end 1 -September end 4 -December end 16 112February end 3 -
98 28
SOFTBANK CORP. 22
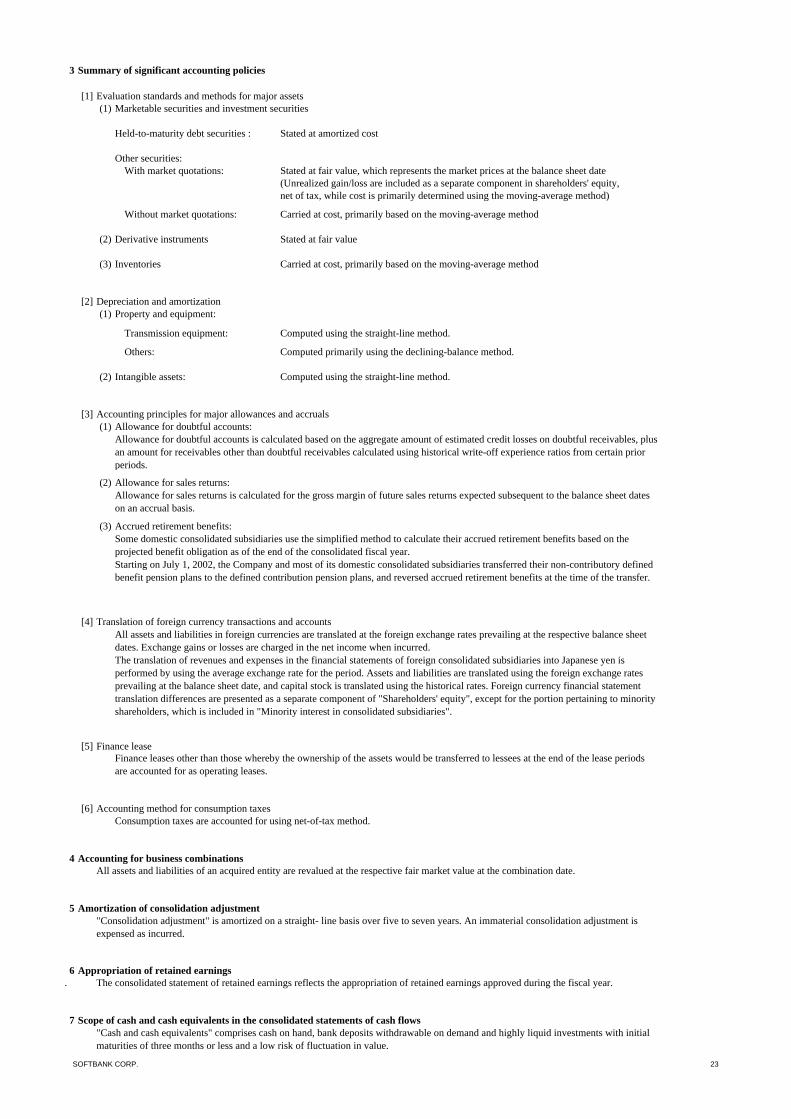
3 Summary of significant accounting policies
[1] Evaluation standards and methods for major assets(1) Marketable securities and investment securities
Held-to-maturity debt securities : Stated at amortized cost
Other securities:With market quotations: Stated at fair value, which represents the market prices at the balance sheet date
(Unrealized gain/loss are included as a separate component in shareholders' equity,net of tax, while cost is primarily determined using the moving-average method)
Without market quotations: Carried at cost, primarily based on the moving-average method
(2) Derivative instruments Stated at fair value
(3) Inventories Carried at cost, primarily based on the moving-average method
[2] Depreciation and amortization(1) Property and equipment:
Transmission equipment: Computed using the straight-line method.
Others: Computed primarily using the declining-balance method.
(2) Intangible assets: Computed using the straight-line method.
[3] Accounting principles for major allowances and accruals(1) Allowance for doubtful accounts:
(2) Allowance for sales returns:
(3) Accrued retirement benefits:
[4] Translation of foreign currency transactions and accounts
[5] Finance lease
[6] Accounting method for consumption taxesConsumption taxes are accounted for using net-of-tax method.
4 Accounting for business combinationsAll assets and liabilities of an acquired entity are revalued at the respective fair market value at the combination date.
5 Amortization of consolidation adjustment
6 Appropriation of retained earnings . The consolidated statement of retained earnings reflects the appropriation of retained earnings approved during the fiscal year.
7 Scope of cash and cash equivalents in the consolidated statements of cash flows
Allowance for sales returns is calculated for the gross margin of future sales returns expected subsequent to the balance sheet dateson an accrual basis.
"Consolidation adjustment" is amortized on a straight- line basis over five to seven years. An immaterial consolidation adjustment isexpensed as incurred.
Allowance for doubtful accounts is calculated based on the aggregate amount of estimated credit losses on doubtful receivables, plusan amount for receivables other than doubtful receivables calculated using historical write-off experience ratios from certain priorperiods.
"Cash and cash equivalents" comprises cash on hand, bank deposits withdrawable on demand and highly liquid investments with initialmaturities of three months or less and a low risk of fluctuation in value.
Some domestic consolidated subsidiaries use the simplified method to calculate their accrued retirement benefits based on theprojected benefit obligation as of the end of the consolidated fiscal year.Starting on July 1, 2002, the Company and most of its domestic consolidated subsidiaries transferred their non-contributory definedbenefit pension plans to the defined contribution pension plans, and reversed accrued retirement benefits at the time of the transfer.
All assets and liabilities in foreign currencies are translated at the foreign exchange rates prevailing at the respective balance sheetdates. Exchange gains or losses are charged in the net income when incurred.The translation of revenues and expenses in the financial statements of foreign consolidated subsidiaries into Japanese yen isperformed by using the average exchange rate for the period. Assets and liabilities are translated using the foreign exchange ratesprevailing at the balance sheet date, and capital stock is translated using the historical rates. Foreign currency financial statementtranslation differences are presented as a separate component of "Shareholders' equity", except for the portion pertaining to minorityshareholders, which is included in "Minority interest in consolidated subsidiaries".
Finance leases other than those whereby the ownership of the assets would be transferred to lessees at the end of the lease periodsare accounted for as operating leases.
SOFTBANK CORP. 23
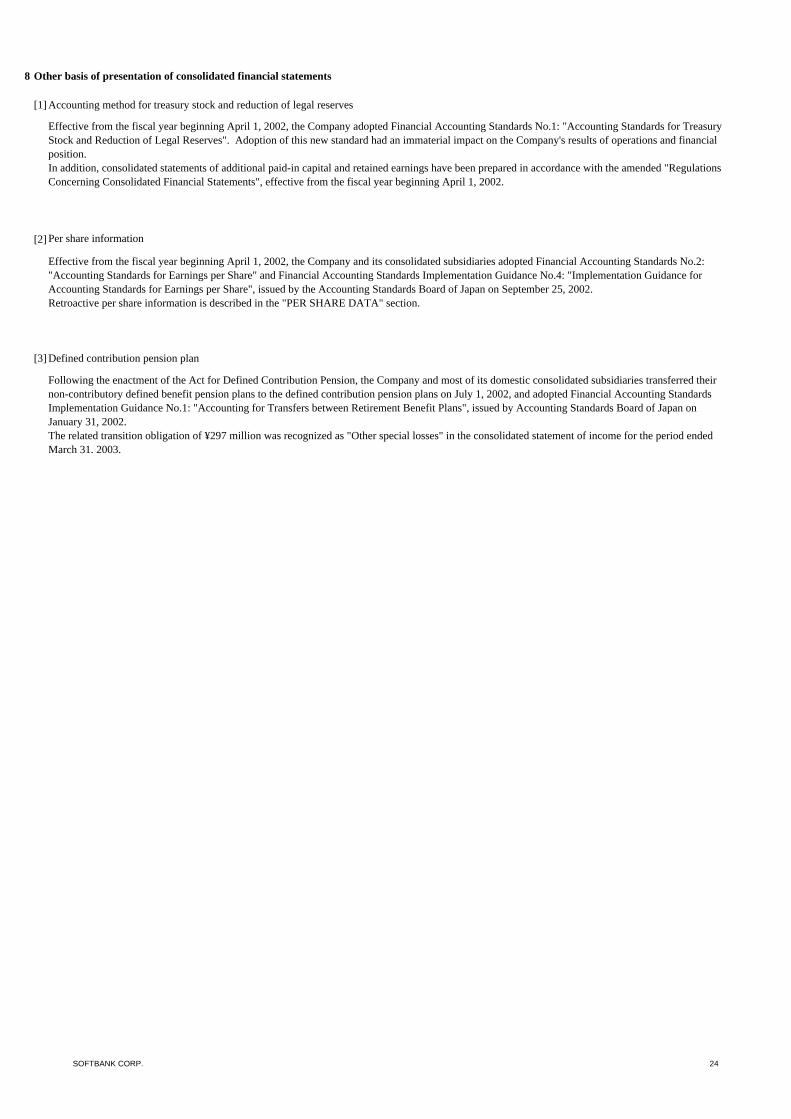
8 Other basis of presentation of consolidated financial statements
[1] Accounting method for treasury stock and reduction of legal reserves
[2]
[3] Defined contribution pension plan
Effective from the fiscal year beginning April 1, 2002, the Company and its consolidated subsidiaries adopted Financial Accounting Standards No.2:"Accounting Standards for Earnings per Share" and Financial Accounting Standards Implementation Guidance No.4: "Implementation Guidance forAccounting Standards for Earnings per Share", issued by the Accounting Standards Board of Japan on September 25, 2002.Retroactive per share information is described in the "PER SHARE DATA" section.
Per share information
Following the enactment of the Act for Defined Contribution Pension, the Company and most of its domestic consolidated subsidiaries transferred theirnon-contributory defined benefit pension plans to the defined contribution pension plans on July 1, 2002, and adopted Financial Accounting StandardsImplementation Guidance No.1: "Accounting for Transfers between Retirement Benefit Plans", issued by Accounting Standards Board of Japan onJanuary 31, 2002.The related transition obligation of ¥297 million was recognized as "Other special losses" in the consolidated statement of income for the period endedMarch 31, 2003.
Effective from the fiscal year beginning April 1, 2002, the Company adopted Financial Accounting Standards No.1: "Accounting Standards for TreasuryStock and Reduction of Legal Reserves". Adoption of this new standard had an immaterial impact on the Company's results of operations and financialposition.In addition, consolidated statements of additional paid-in capital and retained earnings have been prepared in accordance with the amended "RegulationsConcerning Consolidated Financial Statements", effective from the fiscal year beginning April 1, 2002.
SOFTBANK CORP. 24

NOTES
1 Accumulated depreciation of property and equipment
27,417 million yen 10,756 million yen
2 Number of treasury stock held by the Company and its subsidiaries
Held by the Company common stock 24,781 shares 4,484 shares
Held by consolidated subsidiaries common stock 1,558,719 shares - shares
Number of shares issued common stock 336,876,826 shares 336,876,826 shares
3 Assets and liabilities of the silent investment association
The assets and liabilities belonging to the silent investment association, net of deposits from the association members, at the end of the years are as follows:
Cash and deposits 1,956 million yen 6,804 million yen- 11,936
23 232Investment securities 763 1,491Investments in partnerships 2,903 2,726Accounts payable-other 0 163Other current liabilities (Others) - 0
5,647 23,028
4 Receivables and payables related to margin transactions
subsidiaries are as follows:
Receivables related to margin transactions -Loans receivable from customers for margin transactions 42,457 million yen 37,881 million yenCash deposits as collateral for securities borrowed from securities finance companies 6,389 4,434
Payables related to margin transactions -Loans from securities finance companies for margin transactions 27,906 24,379Proceeds from securities sold for margin transactions 16,552 13,038
As of March 31, 2003 As of March 31, 2002
Receivables and payables at each year end relating to margin transactions in securities businesses engaged by certain consolidated
As of March 31, 2003 As of March 31, 2002
Other current assets (Operational investment securities)Other current assets (Others)
Other non-current liabilities
As of March 31, 2002As of March 31, 2003
As of March 31, 2003 As of March 31, 2002
SOFTBANK CORP. 25
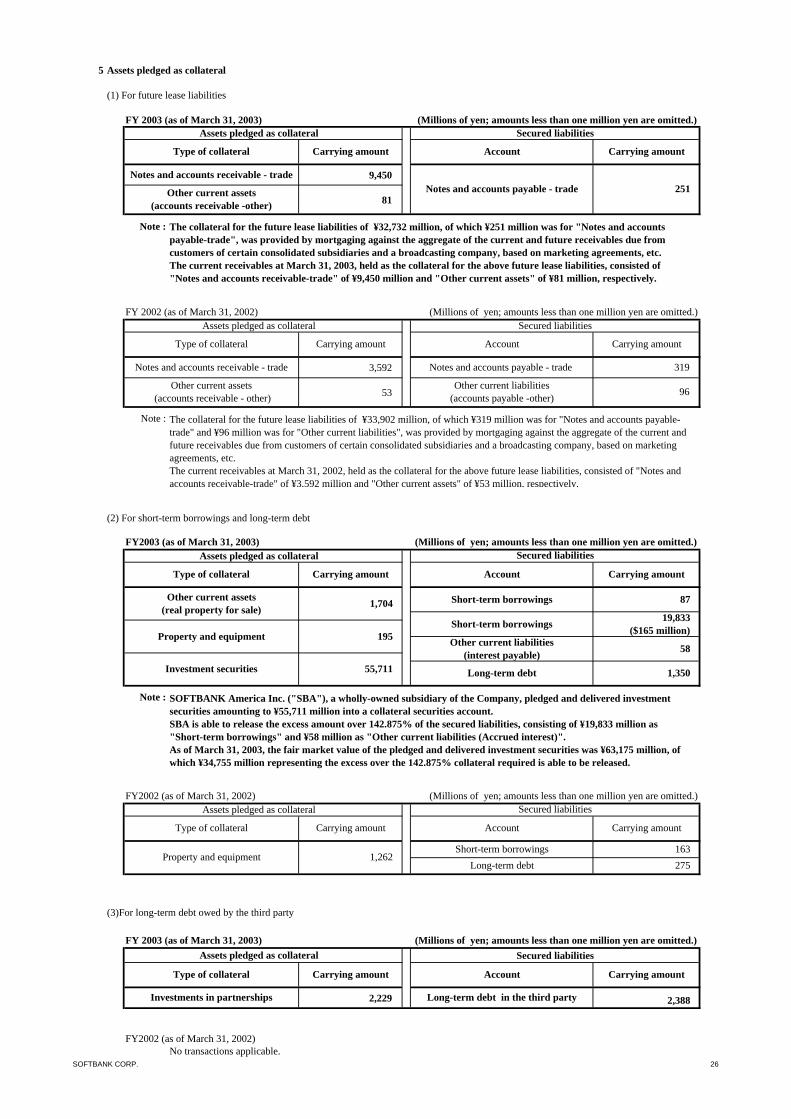
5 Assets pledged as collateral
(1) For future lease liabilities
FY 2003 (as of March 31, 2003) (Millions of yen; amounts less than one million yen are omitted.)
9,450
81
Note :
FY 2002 (as of March 31, 2002) (Millions of yen; amounts less than one million yen are omitted.)
3,592
53
Note :
(2) For short-term borrowings and long-term debt
FY2003 (as of March 31, 2003) (Millions of yen; amounts less than one million yen are omitted.)
Note :
FY2002 (as of March 31, 2002) (Millions of yen; amounts less than one million yen are omitted.)
(3)For long-term debt owed by the third party
FY 2003 (as of March 31, 2003) (Millions of yen; amounts less than one million yen are omitted.)
2,229
FY2002 (as of March 31, 2002)No transactions applicable.
SOFTBANK America Inc. ("SBA"), a wholly-owned subsidiary of the Company, pledged and delivered investmentsecurities amounting to ¥55,711 million into a collateral securities account.SBA is able to release the excess amount over 142.875% of the secured liabilities, consisting of ¥19,833 million as"Short-term borrowings" and ¥58 million as "Other current liabilities (Accrued interest)".As of March 31, 2003, the fair market value of the pledged and delivered investment securities was ¥63,175 million, ofwhich ¥34,755 million representing the excess over the 142.875% collateral required is able to be released.
Long-term debt in the third party
163275
2,388
Carrying amount
Secured liabilities
Investments in partnerships
Type of collateral Carrying amount
Secured liabilities
Type of collateral Carrying amount Account Carrying amount
Assets pledged as collateral
Notes and accounts receivable - trade
Other current assets(accounts receivable -other)
Notes and accounts payable - trade 251
Secured liabilitiesAssets pledged as collateral
Type of collateral Carrying amount Account Carrying amount
Carrying amountType of collateral
Short-term borrowings
Type of collateral Carrying amount Account
Long-term debt
Short-term borrowings
Assets pledged as collateral
Secured liabilities
Account Carrying amount
Property and equipment 1,262
Investment securities
Short-term borrowings
Assets pledged as collateral
Assets pledged as collateral
Secured liabilities
Account Carrying amount
Other current liabilities(interest payable)
Long-term debt
1,704
The collateral for the future lease liabilities of ¥33,902 million, of which ¥319 million was for "Notes and accounts payable-trade" and ¥96 million was for "Other current liabilities", was provided by mortgaging against the aggregate of the current andfuture receivables due from customers of certain consolidated subsidiaries and a broadcasting company, based on marketingagreements, etc.The current receivables at March 31, 2002, held as the collateral for the above future lease liabilities, consisted of "Notes andaccounts receivable-trade" of ¥3,592 million and "Other current assets" of ¥53 million, respectively.
The collateral for the future lease liabilities of ¥32,732 million, of which ¥251 million was for "Notes and accountspayable-trade", was provided by mortgaging against the aggregate of the current and future receivables due fromcustomers of certain consolidated subsidiaries and a broadcasting company, based on marketing agreements, etc.The current receivables at March 31, 2003, held as the collateral for the above future lease liabilities, consisted of"Notes and accounts receivable-trade" of ¥9,450 million and "Other current assets" of ¥81 million, respectively.
Other current assets(real property for sale)
Property and equipment
Notes and accounts payable - trade 319
Other current assets (accounts receivable - other)
Other current liabilities(accounts payable -other) 96
Notes and accounts receivable - trade
195
55,711
87
19,833($165 million)
58
1,350
SOFTBANK CORP. 26
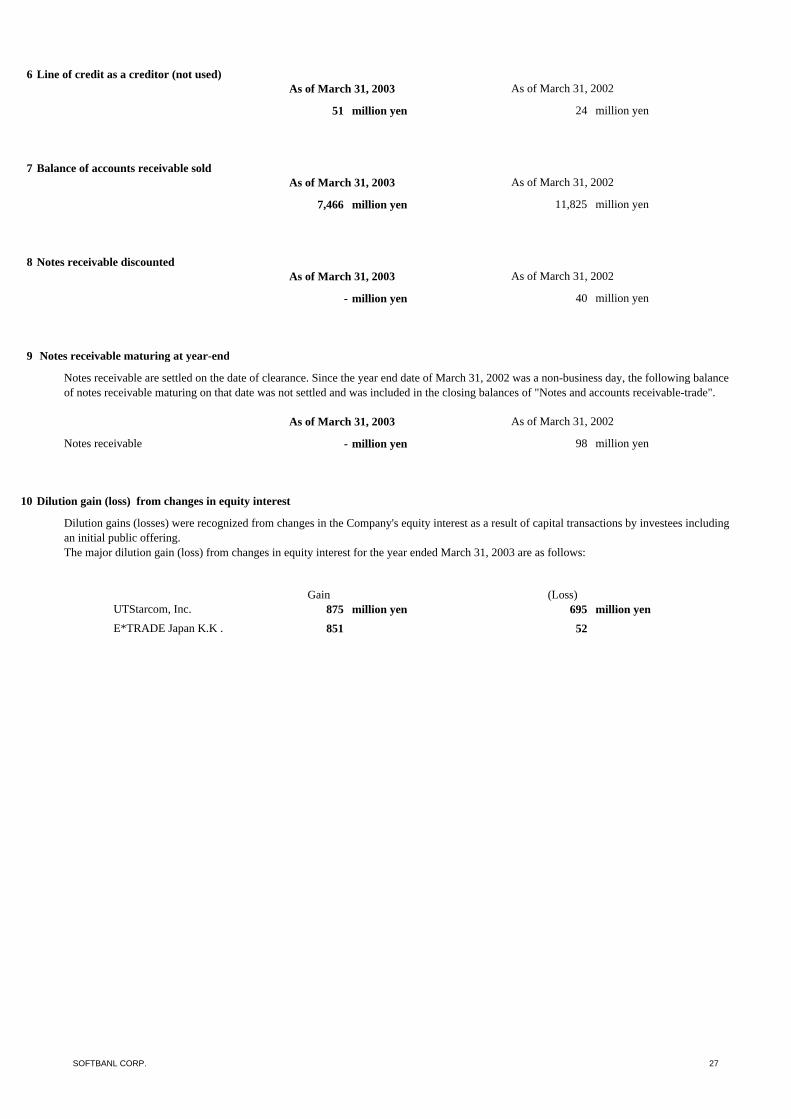
6 Line of credit as a creditor (not used)As of March 31, 2003 As of March 31, 2002
51 million yen 24 million yen
7 Balance of accounts receivable soldAs of March 31, 2003 As of March 31, 2002
7,466 million yen 11,825 million yen
8 Notes receivable discountedAs of March 31, 2003 As of March 31, 2002
- million yen 40 million yen
9 Notes receivable maturing at year-end
As of March 31, 2003 As of March 31, 2002
Notes receivable - million yen 98 million yen
10 Dilution gain (loss) from changes in equity interest
Gain (Loss)UTStarcom, Inc. 875 million yen 695 million yenE*TRADE Japan K.K . 851 52
Dilution gains (losses) were recognized from changes in the Company's equity interest as a result of capital transactions by investees includingan initial public offering.The major dilution gain (loss) from changes in equity interest for the year ended March 31, 2003 are as follows:
Notes receivable are settled on the date of clearance. Since the year end date of March 31, 2002 was a non-business day, the following balanceof notes receivable maturing on that date was not settled and was included in the closing balances of "Notes and accounts receivable-trade".
SOFTBANL CORP. 27
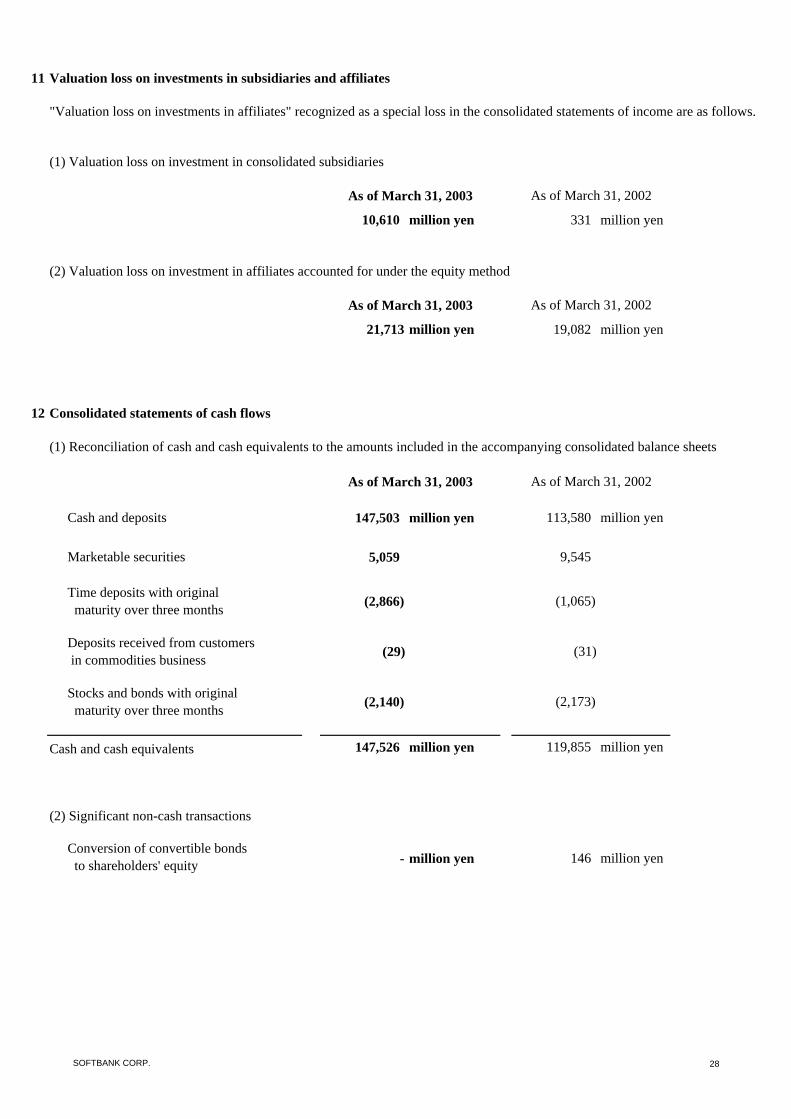
11 Valuation loss on investments in subsidiaries and affiliates
"Valuation loss on investments in affiliates" recognized as a special loss in the consolidated statements of income are as follows.
(1) Valuation loss on investment in consolidated subsidiaries
10,610 million yen 331 million yen
(2) Valuation loss on investment in affiliates accounted for under the equity method
21,713 million yen 19,082 million yen
12 Consolidated statements of cash flows
(1) Reconciliation of cash and cash equivalents to the amounts included in the accompanying consolidated balance sheets
Cash and deposits 147,503 million yen 113,580 million yen
Marketable securities 5,059 9,545
Cash and cash equivalents 147,526 million yen 119,855 million yen
(2) Significant non-cash transactions
million yen
(31)
- million yen 146
Stocks and bonds with original maturity over three months
Conversion of convertible bonds to shareholders' equity
As of March 31, 2003
Time deposits with original maturity over three months
Deposits received from customers in commodities business (29)
As of March 31, 2002
(2,866)
(2,140) (2,173)
As of March 31, 2003
As of March 31, 2003
(1,065)
As of March 31, 2002
As of March 31, 2002
SOFTBANK CORP. 28
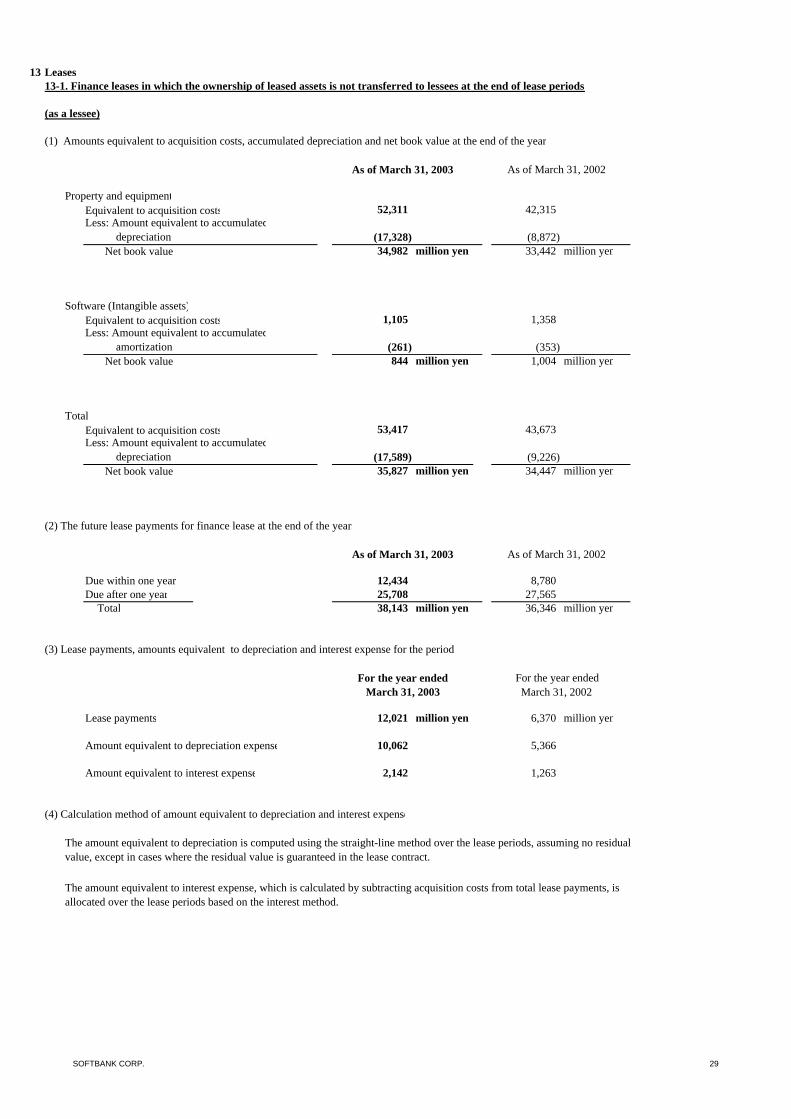
13 Leases 13-1. Finance leases in which the ownership of leased assets is not transferred to lessees at the end of lease periods
(as a lessee)
(1) Amounts equivalent to acquisition costs, accumulated depreciation and net book value at the end of the year
Property and equipmentEquivalent to acquisition costs 52,311 42,315
(17,328) (8,872)34,982 million yen 33,442 million yen
Software (Intangible assets)Equivalent to acquisition costs 1,105 1,358
(261) (353)844 million yen 1,004 million yen
TotalEquivalent to acquisition costs 53,417 43,673
(17,589) (9,226)35,827 million yen 34,447 million yen
(2) The future lease payments for finance lease at the end of the years
Due within one year 12,434 8,780Due after one year 25,708 27,565
Total 38,143 million yen 36,346 million yen
(3) Lease payments, amounts equivalent to depreciation and interest expense for the period
Lease payments 12,021 million yen 6,370 million yen
Amount equivalent to depreciation expense 10,062 5,366
Amount equivalent to interest expense 2,142 1,263
(4) Calculation method of amount equivalent to depreciation and interest expense
As of March 31, 2002As of March 31, 2003
As of March 31, 2003 As of March 31, 2002
For the year endedMarch 31, 2003
For the year endedMarch 31, 2002
The amount equivalent to depreciation is computed using the straight-line method over the lease periods, assuming no residualvalue, except in cases where the residual value is guaranteed in the lease contract.
The amount equivalent to interest expense, which is calculated by subtracting acquisition costs from total lease payments, isallocated over the lease periods based on the interest method.
Less: Amount equivalent to accumulated depreciation
Less: Amount equivalent to accumulated amortization
Less: Amount equivalent to accumulated depreciation
Net book value
Net book value
Net book value
SOFTBANK CORP. 29
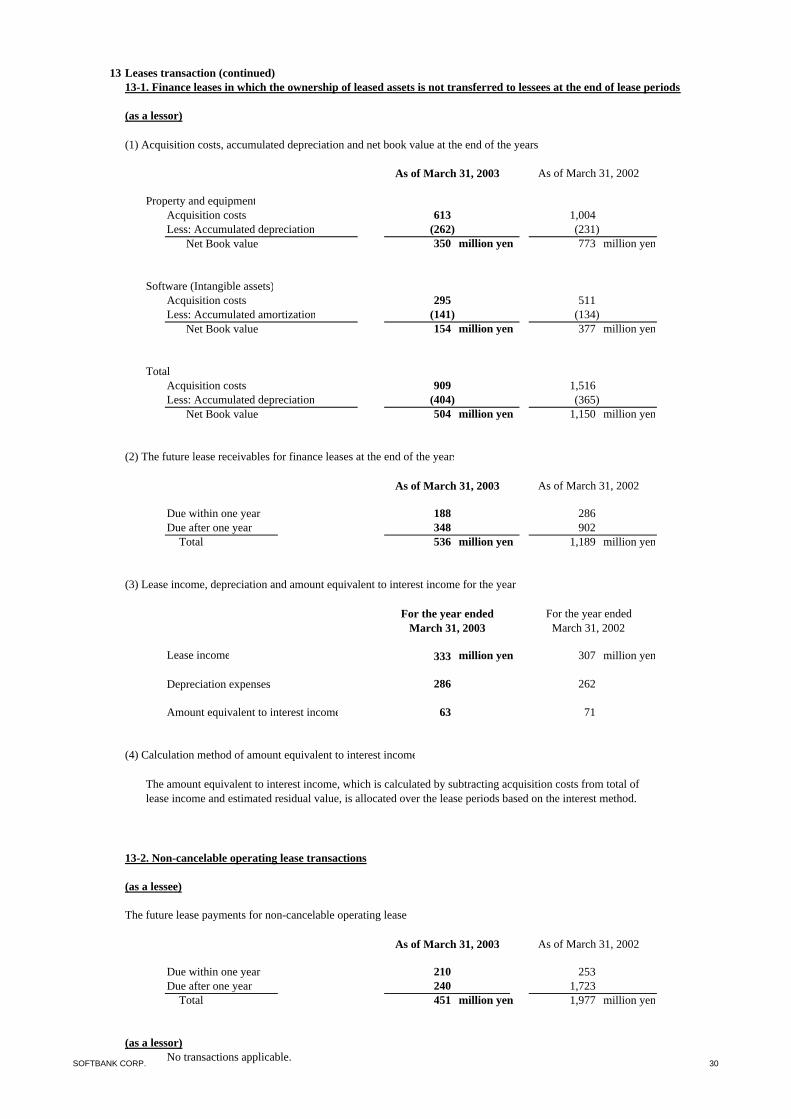
13 Leases transaction (continued)13-1. Finance leases in which the ownership of leased assets is not transferred to lessees at the end of lease periods
(as a lessor)
(1) Acquisition costs, accumulated depreciation and net book value at the end of the years
Property and equipmentAcquisition costs 613 1,004Less: Accumulated depreciation (262) (231)
350 million yen 773 million yen
Software (Intangible assets)Acquisition costs 295 511Less: Accumulated amortization (141) (134)
154 million yen 377 million yen
TotalAcquisition costs 909 1,516Less: Accumulated depreciation (404) (365)
504 million yen 1,150 million yen
(2) The future lease receivables for finance leases at the end of the years
Due within one year 188 286Due after one year 348 902
Total 536 million yen 1,189 million yen
(3) Lease income, depreciation and amount equivalent to interest income for the years
333 million yen 307 million yen
286 262
Amount equivalent to interest income 63 71
(4) Calculation method of amount equivalent to interest income
13-2. Non-cancelable operating lease transactions
(as a lessee)
The future lease payments for non-cancelable operating lease
Due within one year 210 253Due after one year 240 1,723
Total 451 million yen 1,977 million yen
(as a lessor)No transactions applicable.
As of March 31, 2002
As of March 31, 2002
The amount equivalent to interest income, which is calculated by subtracting acquisition costs from total oflease income and estimated residual value, is allocated over the lease periods based on the interest method.
Lease income
As of March 31, 2003
As of March 31, 2002
For the year endedMarch 31, 2002
As of March 31, 2003
As of March 31, 2003
For the year endedMarch 31, 2003
Net Book value
Net Book value
Net Book value
Depreciation expenses
SOFTBANK CORP. 30
14 Significant subsequent events
(1) Sale of partial shareholdings of UTStarcom, Inc.
(2) Refinancing and change of collateral
(3) SOFTBANK INVESTMENT CORP. - E*TRADE Japan K.K. Merger
In April 2003, the Company sold 8,000,000 shares of UTStarcom, Inc. through SOFTBANK America Inc., a wholly-owned subsidiary of the Company, for approximately $139 million (approximately ¥16.6 billion at the rate of ¥119 perU.S. dollar). A capital gain of approximately ¥9.0 billion on this sale will be recorded in the Company's consolidatedfinancial statements for the year ending March 2004.
In April 2003, SOFTBANK America Inc. ("SBA") repaid short-term borrowings of $165 million (¥19,833 million),which were originally borrowed in February 2003, and entered into the new agreement of $380 million long-termborrowings bearing interest at 7.75% per annum from Citibank N.A., repayable in September 2004.In connection with this refinancing, the collateral for the original $165 million loan was released, and SBA pledged anddelivered its investment securities amounting to ¥87,781 million ($920 million at market value) into a collateralsecurities account. But, SBA is able to release $374 million at market value, representing the excess amount over142.875% of the secured liabilities.(The market value was calculated based on the share price as of the contract date of the loan agreement.)
On March 7, 2003, SOFTBANK INVESTMENT CORPORATION ("SBIV") and E*TRADE Japan K.K.("ETRJ"),consolidated subsidiaries of the Company, entered into a merger agreement, which was approval at the extra-ordinaryshareholders' meetings of both companies held on March 28, 2003. The merger will be effective on June 2, 2003.
As part of the merger, SBIV, a surviving company, will issue 0.63 shares of its common stock for a share of commonstock of ETRJ to the shareholders of ETRJ on register as of June 1, 2003, the previous date of the merger date of June 2,2003.
An aim of the merger is to establish an entity group which will be able to offer "Comprehensive Financial Services" tocustomers, such as asset management services, brokerage services, investment banking services, etc. This aim is achievedby the merger between SBIV managing a significant amount of venture capital funds in Japan, and ETRJ holdingE*TRADE SECURITIES CO., LTD., which has a large number of customer accounts as an online securities broker.
SOFTBANK CORP. 31
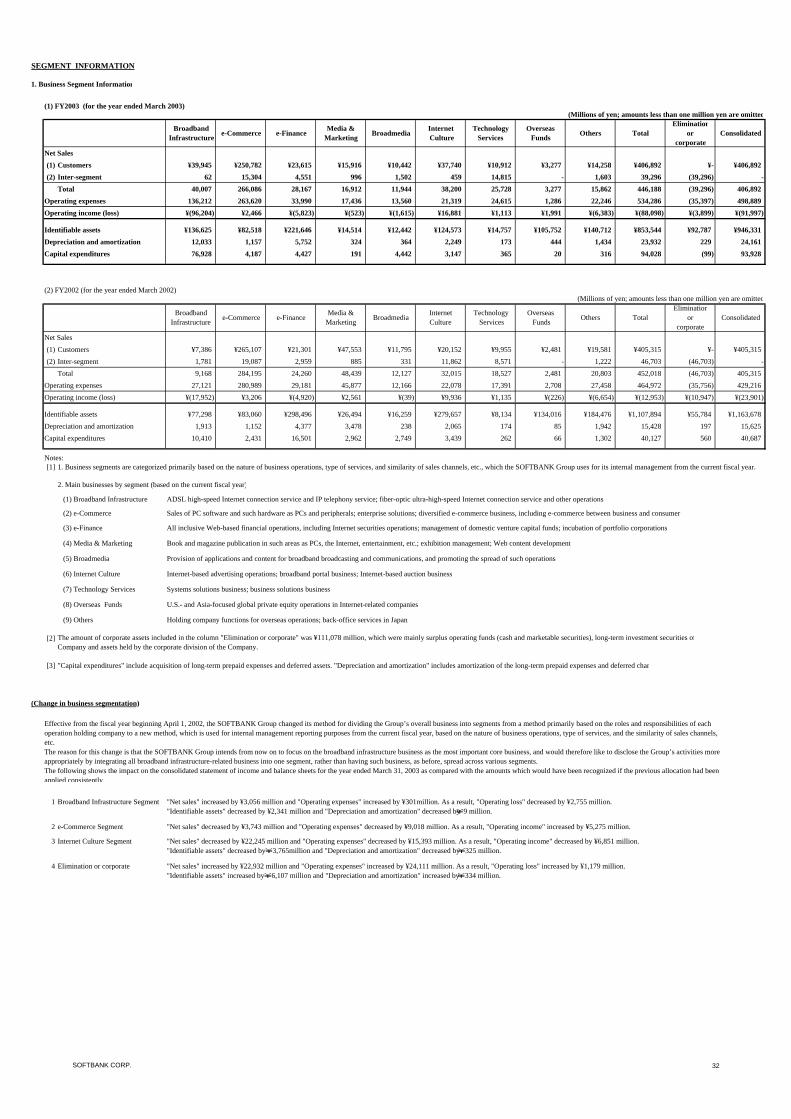
SEGMENT INFORMATION
1. Business Segment Information
(1) FY2003 (for the year ended March 2003)(Millions of yen; amounts less than one million yen are omitted
Net Sales(1) Customers ¥39,945 ¥250,782 ¥23,615 ¥15,916 ¥10,442 ¥37,740 ¥10,912 ¥3,277 ¥14,258 ¥406,892 ¥- ¥406,892(2) Inter-segment 62 15,304 4,551 996 1,502 459 14,815 - 1,603 39,296 (39,296) -
Total 40,007 266,086 28,167 16,912 11,944 38,200 25,728 3,277 15,862 446,188 (39,296) 406,892Operating expenses 136,212 263,620 33,990 17,436 13,560 21,319 24,615 1,286 22,246 534,286 (35,397) 498,889Operating income (loss) ¥(96,204) ¥2,466 ¥(5,823) ¥(523) ¥(1,615) ¥16,881 ¥1,113 ¥1,991 ¥(6,383) ¥(88,098) ¥(3,899) ¥(91,997)
Identifiable assets ¥136,625 ¥82,518 ¥221,646 ¥14,514 ¥12,442 ¥124,573 ¥14,757 ¥105,752 ¥140,712 ¥853,544 ¥92,787 ¥946,331Depreciation and amortization 12,033 1,157 5,752 324 364 2,249 173 444 1,434 23,932 229 24,161Capital expenditures 76,928 4,187 4,427 191 4,442 3,147 365 20 316 94,028 (99) 93,928
(2) FY2002 (for the year ended March 2002)(Millions of yen; amounts less than one million yen are omitted
Net Sales(1) Customers ¥7,386 ¥265,107 ¥21,301 ¥47,553 ¥11,795 ¥20,152 ¥9,955 ¥2,481 ¥19,581 ¥405,315 ¥- ¥405,315(2) Inter-segment 1,781 19,087 2,959 885 331 11,862 8,571 - 1,222 46,703 (46,703) -
Total 9,168 284,195 24,260 48,439 12,127 32,015 18,527 2,481 20,803 452,018 (46,703) 405,315Operating expenses 27,121 280,989 29,181 45,877 12,166 22,078 17,391 2,708 27,458 464,972 (35,756) 429,216Operating income (loss) ¥(17,952) ¥3,206 ¥(4,920) ¥2,561 ¥(39) ¥9,936 ¥1,135 ¥(226) ¥(6,654) ¥(12,953) ¥(10,947) ¥(23,901)
Identifiable assets ¥77,298 ¥83,060 ¥298,496 ¥26,494 ¥16,259 ¥279,657 ¥8,134 ¥134,016 ¥184,476 ¥1,107,894 ¥55,784 ¥1,163,678Depreciation and amortization 1,913 1,152 4,377 3,478 238 2,065 174 85 1,942 15,428 197 15,625Capital expenditures 10,410 2,431 16,501 2,962 2,749 3,439 262 66 1,302 40,127 560 40,687
Notes:[1] 1. Business segments are categorized primarily based on the nature of business operations, type of services, and similarity of sales channels, etc., which the SOFTBANK Group uses for its internal management from the current fiscal year.
2. Main businesses by segment (based on the current fiscal year)
(1) Broadband Infrastructure ADSL high-speed Internet connection service and IP telephony service; fiber-optic ultra-high-speed Internet connection service and other operations
(2) e-Commerce Sales of PC software and such hardware as PCs and peripherals; enterprise solutions; diversified e-commerce business, including e-commerce between business and consumer
(3) e-Finance All inclusive Web-based financial operations, including Internet securities operations; management of domestic venture capital funds; incubation of portfolio corporations
(4) Media & Marketing Book and magazine publication in such areas as PCs, the Internet, entertainment, etc.; exhibition management; Web content development
(5) Broadmedia Provision of applications and content for broadband broadcasting and communications, and promoting the spread of such operations
(6) Internet Culture Internet-based advertising operations; broadband portal business; Internet-based auction business
(7) Technology Services Systems solutions business; business solutions business
(8) Overseas Funds U.S.- and Asia-focused global private equity operations in Internet-related companies
(9) Others Holding company functions for overseas operations; back-office services in Japan
[2]
[3] "Capital expenditures" include acquisition of long-term prepaid expenses and deferred assets. "Depreciation and amortization" includes amortization of the long-term prepaid expenses and deferred char
(Change in business segmentation)
1 Broadband Infrastructure Segment
2 e-Commerce Segment
3 Internet Culture Segment
4 Elimination or corporate
BroadbandInfrastructure
BroadbandInfrastructure
OthersInternet Culture
TechnologyServices
OverseasFundse-Commerce e-Finance Media &
Marketing Broadmedia TotalElimination
orcorporate
Consolidated
e-Commerce e-Finance Media &Marketing Broadmedia Internet
CultureTechnology
Services ConsolidatedOverseas Funds Others Total
Eliminationor
corporate
The amount of corporate assets included in the column "Elimination or corporate" was ¥111,078 million, which were mainly surplus operating funds (cash and marketable securities), long-term investment securities ofCompany and assets held by the corporate division of the Company.
"Net sales" increased by ¥22,932 million and "Operating expenses" increased by ¥24,111 million. As a result, "Operating loss" increased by ¥1,179 million."Identifiable assets" increased by ¥6,107 million and "Depreciation and amortization" increased by ¥334 million.
"Net sales" decreased by ¥22,245 million and "Operating expenses" decreased by ¥15,393 million. As a result, "Operating income" decreased by ¥6,851 million."Identifiable assets" decreased by ¥3,765million and "Depreciation and amortization" decreased by ¥325 million.
"Net sales" increased by ¥3,056 million and "Operating expenses" increased by ¥301million. As a result, "Operating loss" decreased by ¥2,755 million."Identifiable assets" decreased by ¥2,341 million and "Depreciation and amortization" decreased by ¥9 million.
"Net sales" decreased by ¥3,743 million and "Operating expenses" decreased by ¥9,018 million. As a result, "Operating income" increased by ¥5,275 million.
Effective from the fiscal year beginning April 1, 2002, the SOFTBANK Group changed its method for dividing the Group’s overall business into segments from a method primarily based on the roles and responsibilities of eachoperation holding company to a new method, which is used for internal management reporting purposes from the current fiscal year, based on the nature of business operations, type of services, and the similarity of sales channels,etc.The reason for this change is that the SOFTBANK Group intends from now on to focus on the broadband infrastructure business as the most important core business, and would therefore like to disclose the Group’s activities moreappropriately by integrating all broadband infrastructure-related business into one segment, rather than having such business, as before, spread across various segments.The following shows the impact on the consolidated statement of income and balance sheets for the year ended March 31, 2003 as compared with the amounts which would have been recognized if the previous allocation had beenapplied consistently
SOFTBANK CORP. 32
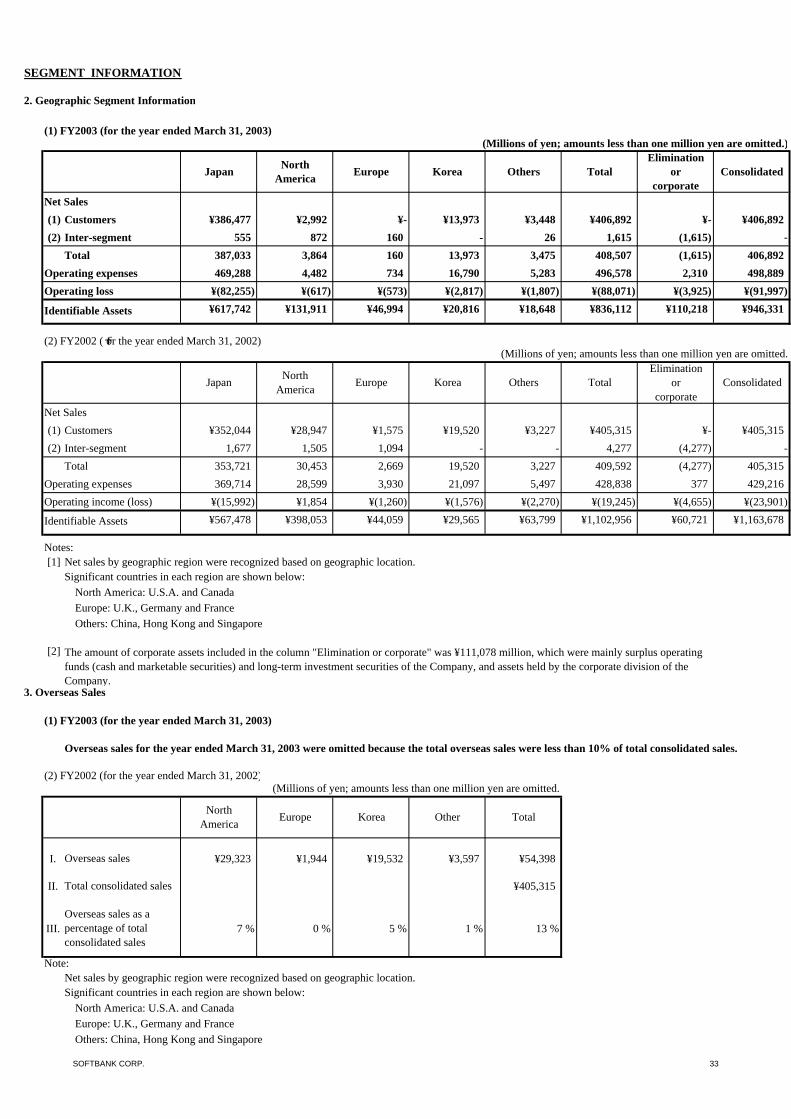
SEGMENT INFORMATION
2. Geographic Segment Information
(1) FY2003 (for the year ended March 31, 2003)(Millions of yen; amounts less than one million yen are omitted.)
Net Sales(1) Customers ¥386,477 ¥2,992 ¥- ¥13,973 ¥3,448 ¥406,892 ¥- ¥406,892(2) Inter-segment 555 872 160 - 26 1,615 (1,615) -
Total 387,033 3,864 160 13,973 3,475 408,507 (1,615) 406,892Operating expenses 469,288 4,482 734 16,790 5,283 496,578 2,310 498,889Operating loss ¥(82,255) ¥(617) ¥(573) ¥(2,817) ¥(1,807) ¥(88,071) ¥(3,925) ¥(91,997)
Identifiable Assets ¥617,742 ¥131,911 ¥46,994 ¥20,816 ¥18,648 ¥836,112 ¥110,218 ¥946,331
(2) FY2002 (for the year ended March 31, 2002)(Millions of yen; amounts less than one million yen are omitted.
Net Sales(1) Customers ¥352,044 ¥28,947 ¥1,575 ¥19,520 ¥3,227 ¥405,315 ¥- ¥405,315(2) Inter-segment 1,677 1,505 1,094 - - 4,277 (4,277) -
Total 353,721 30,453 2,669 19,520 3,227 409,592 (4,277) 405,315Operating expenses 369,714 28,599 3,930 21,097 5,497 428,838 377 429,216Operating income (loss) ¥(15,992) ¥1,854 ¥(1,260) ¥(1,576) ¥(2,270) ¥(19,245) ¥(4,655) ¥(23,901)
Identifiable Assets ¥567,478 ¥398,053 ¥44,059 ¥29,565 ¥63,799 ¥1,102,956 ¥60,721 ¥1,163,678
Notes:[1] Net sales by geographic region were recognized based on geographic location.
Significant countries in each region are shown below:North America: U.S.A. and CanadaEurope: U.K., Germany and FranceOthers: China, Hong Kong and Singapore
[2]
3. Overseas Sales
(1) FY2003 (for the year ended March 31, 2003)
Overseas sales for the year ended March 31, 2003 were omitted because the total overseas sales were less than 10% of total consolidated sales.
(2) FY2002 (for the year ended March 31, 2002)(Millions of yen; amounts less than one million yen are omitted.
I. ¥29,323 ¥1,944 ¥19,532 ¥3,597 ¥54,398
II. ¥405,315
III. 7 % 0 % 5 % 1 % 13 %
Note:Net sales by geographic region were recognized based on geographic location.Significant countries in each region are shown below:
North America: U.S.A. and CanadaEurope: U.K., Germany and FranceOthers: China, Hong Kong and Singapore
Total
Overseas sales
Total consolidated sales
Overseas sales as apercentage of totalconsolidated sales
NorthAmerica Europe Korea Other
The amount of corporate assets included in the column "Elimination or corporate" was ¥111,078 million, which were mainly surplus operatingfunds (cash and marketable securities) and long-term investment securities of the Company, and assets held by the corporate division of theCompany.
Japan NorthAmerica Europe Korea Others Total
Eliminationor
corporateConsolidated
Japan TotalElimination
orcorporate
ConsolidatedNorthAmerica Europe Korea Others
SOFTBANK CORP. 33

PER SHARE DATA
FY2003 Calculation
undernew standards
Calculationunder
new standards
Calculationunder
previous standards
Net loss per share - primary (yen) ¥(296.94) ¥(264.04) ¥(263.53)Net loss per share - diluted (note 1) - - -Shareholders' equity per share (yen) 767.56 1,380.80 1,381.31
Basic data for computation of the per share data
1. Average number of common stock outstandingduring each fiscal year (unit: shares) (note 2) 336,857,133 336,798,168 336,798,168
2. Net loss allocated to common stock outstanding (in millions of yen) ¥(100,027) ¥(88,926) ¥(88,755)
3. Net loss not allocated to common stock holders (in millions of yen) (note 3) 38 171 N/A
Notes:1. Diluted net income per share is not disclosed due to the loss position.2. There were no potential dilutive securities in respect of the common stock outstanding at each fiscal year end.3. The component is "Bonuses to Directors".
Effective from the fiscal year beginning April 1, 2002, the Company and its consolidated subsidiaries adopted Financial Accounting Standards No.2: "Accounting Standards for Earnings per Share" and Financial Accounting Standards Implementation Guidance No.4: "Implementation Guidance forAccounting Standards for Earnings per Share", which was issued by Accounting Standards Board of Japan on September 25,2002.Retroactive per share information is as follows.
FY2002
SOFTBANK CORP. 34
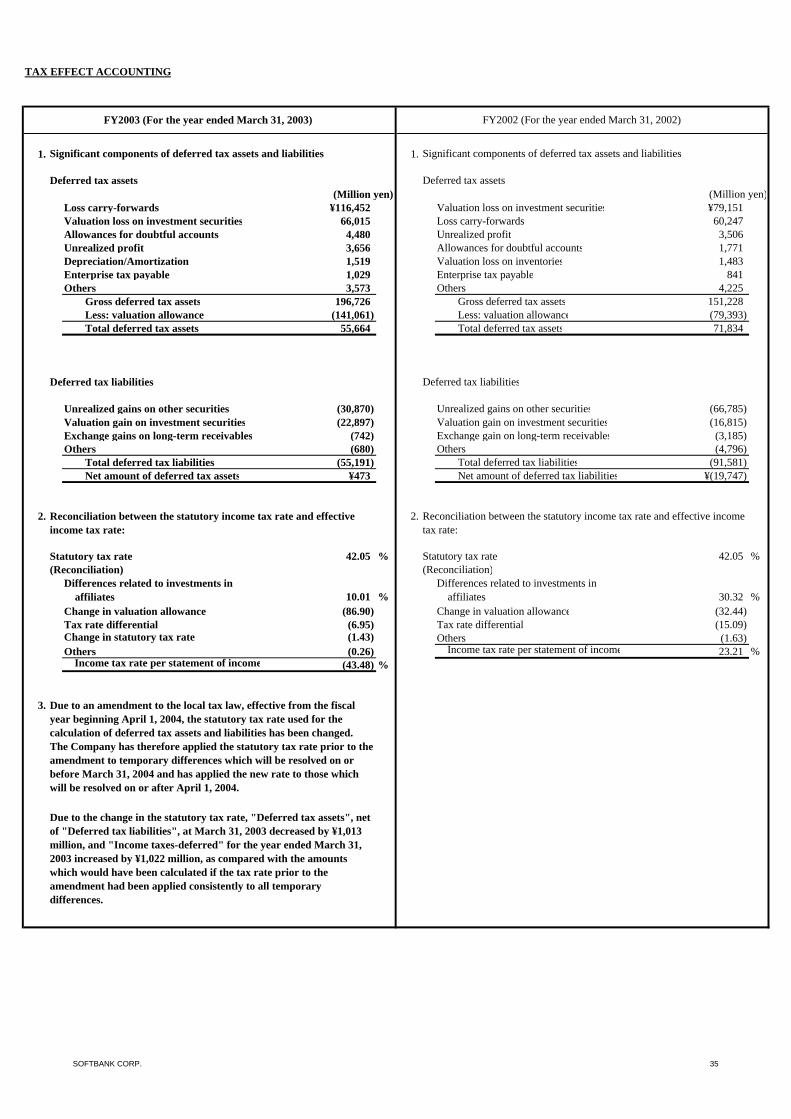
TAX EFFECT ACCOUNTING
1. 1.
(Million yen) (Million yen)Loss carry-forwards ¥116,452 Valuation loss on investment securities ¥79,151Valuation loss on investment securities 66,015 Loss carry-forwards 60,247Allowances for doubtful accounts 4,480 Unrealized profit 3,506Unrealized profit 3,656 Allowances for doubtful accounts 1,771Depreciation/Amortization 1,519 Valuation loss on inventories 1,483Enterprise tax payable 1,029 Enterprise tax payable 841Others 3,573 Others 4,225
Gross deferred tax assets 196,726 Gross deferred tax assets 151,228Less: valuation allowance (141,061) Less: valuation allowance (79,393)Total deferred tax assets 55,664 Total deferred tax assets 71,834
Deferred tax liabilities Deferred tax liabilities
Unrealized gains on other securities (30,870) Unrealized gains on other securities (66,785)Valuation gain on investment securities (22,897) Valuation gain on investment securities (16,815)Exchange gains on long-term receivables (742) Exchange gain on long-term receivables (3,185)Others (680) Others (4,796)
Total deferred tax liabilities (55,191) Total deferred tax liabilities (91,581)Net amount of deferred tax assets ¥473 Net amount of deferred tax liabilities ¥(19,747)
2. 2.
Statutory tax rate 42.05 % Statutory tax rate 42.05 %(Reconciliation) (Reconciliation)
Differences related to investments in affiliates 10.01 %
Differences related to investments in affiliates 30.32 %
Change in valuation allowance (86.90) Change in valuation allowance (32.44)Tax rate differential (6.95) Tax rate differential (15.09)Change in statutory tax rate (1.43) Others (1.63)Others (0.26) Income tax rate per statement of income 23.21 %
Income tax rate per statement of income (43.48) %
3. Due to an amendment to the local tax law, effective from the fiscalyear beginning April 1, 2004, the statutory tax rate used for thecalculation of deferred tax assets and liabilities has been changed.The Company has therefore applied the statutory tax rate prior to theamendment to temporary differences which will be resolved on orbefore March 31, 2004 and has applied the new rate to those whichwill be resolved on or after April 1, 2004.
Due to the change in the statutory tax rate, "Deferred tax assets", netof "Deferred tax liabilities", at March 31, 2003 decreased by ¥1,013million, and "Income taxes-deferred" for the year ended March 31,2003 increased by ¥1,022 million, as compared with the amountswhich would have been calculated if the tax rate prior to theamendment had been applied consistently to all temporarydifferences.
Deferred tax assets
FY2002 (For the year ended March 31, 2002)
Significant components of deferred tax assets and liabilities
Reconciliation between the statutory income tax rate and effective incometax rate:
FY2003 (For the year ended March 31, 2003)
Deferred tax assets
Significant components of deferred tax assets and liabilities
Reconciliation between the statutory income tax rate and effectiveincome tax rate:
SOFTBANK CORP. 35
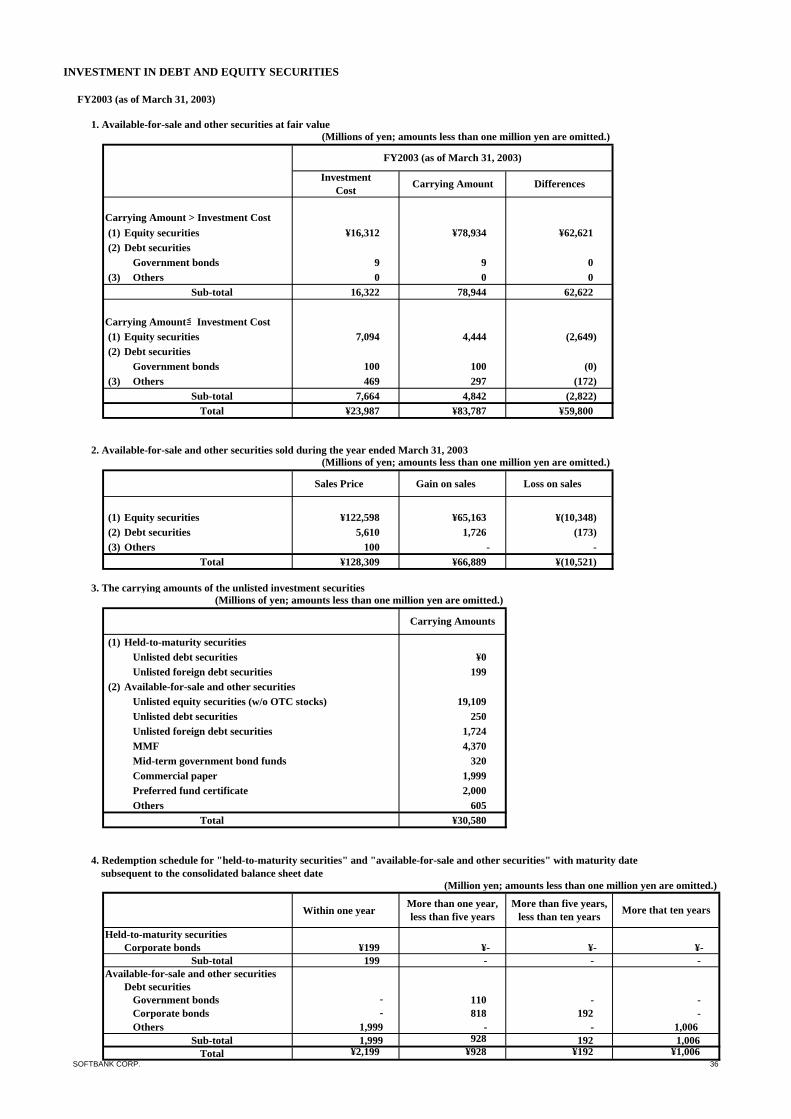
INVESTMENT IN DEBT AND EQUITY SECURITIES
FY2003 (as of March 31, 2003)
1. Available-for-sale and other securities at fair value(Millions of yen; amounts less than one million yen are omitted.)
(1) Equity securities ¥16,312 ¥78,934 ¥62,621(2) Debt securities
Government bonds 9 9 0(3) Others 0 0 0
Sub-total 16,322 78,944 62,622
Carrying Amount≦Investment Cost(1) Equity securities 7,094 4,444 (2,649)(2) Debt securities
Government bonds 100 100 (0)(3) Others 469 297 (172)
Sub-total 7,664 4,842 (2,822)Total ¥23,987 ¥83,787 ¥59,800
2. Available-for-sale and other securities sold during the year ended March 31, 2003(Millions of yen; amounts less than one million yen are omitted.)
Sales Price Gain on sales Loss on sales
(1) Equity securities ¥122,598 ¥65,163 ¥(10,348)(2) Debt securities 5,610 1,726 (173)(3) Others 100 - -
Total ¥128,309 ¥66,889 ¥(10,521)
3. The carrying amounts of the unlisted investment securities (Millions of yen; amounts less than one million yen are omitted.)
(1) Held-to-maturity securitiesUnlisted debt securities ¥0Unlisted foreign debt securities 199
(2) Available-for-sale and other securitiesUnlisted equity securities (w/o OTC stocks) 19,109Unlisted debt securities 250Unlisted foreign debt securities 1,724MMF 4,370Mid-term government bond funds 320Commercial paper 1,999Preferred fund certificate 2,000Others 605
Total ¥30,580
4. Redemption schedule for "held-to-maturity securities" and "available-for-sale and other securities" with maturity datesubsequent to the consolidated balance sheet date
(Million yen; amounts less than one million yen are omitted.)
Within one year
Held-to-maturity securitiesCorporate bonds ¥199 ¥- ¥- ¥-
Sub-total 199 - - - Available-for-sale and other securities
Debt securitiesGovernment bonds - 110 - - Corporate bonds - 818 192 - Others 1,999 - - 1,006
Sub-total 1,999 928 192 1,006Total ¥2,199 ¥928 ¥192 ¥1,006
More that ten yearsMore than one year,less than five years
More than five years,less than ten years
Carrying Amount > Investment Cost
Carrying Amounts
FY2003 (as of March 31, 2003)
InvestmentCost Carrying Amount Differences
SOFTBANK CORP. 36

INVESTMENT IN DEBT AND EQUITY SECURITIES (Continued)FY2002 (as of March 31, 2002)
1. Available-for-sale and other securities at fair value(Millions of yen; amounts less than one million yen are omitted.)
(1) Equity securities ¥79,171 ¥268,420 ¥189,249Sub-total 79,171 268,420 189,249
Carrying Amount≦Investment Cost(1) Equity securities 27,935 25,530 (2,405)(2) Debt securities
Government bonds 301 300 (0)(3) Others 2 2 -
Sub-total 28,239 25,833 (2,405)Total ¥107,410 ¥294,254 ¥186,843
2. Available-for-sale and other securities sold during the year ended March 31, 2002(Millions of yen; amounts less than one million yen are omitted.)
Sales Price Gain on sales Loss on sales
(1) Equity securities ¥48,068 ¥9,496 ¥11,357(2) Debt securities 6,044 7 39(3) Others 236 0 -
Total ¥54,348 ¥9,505 ¥11,396
3. The carrying amounts of the unlisted investment securities (Millions of yen; amounts less than one million yen are omitted.)
(1) Held-to-maturity securitiesUnlisted debt securities ¥0Unlisted foreign debt securities 99
(2) Available-for-sale and other securitiesUnlisted equity securities (w/o OTC stocks) 42,375Unlisted debt securities 1,742Unlisted foreign debt securities 2,797MMF 11,520Mid-term government bond funds 323Beneficial interest in trusts 1,000Preferred fund certificate 2,000Others 30
Total ¥61,889
4. Redemption schedule for "held-to-maturity securities" and "available-for-sale and other securities" with maturity datesubsequent to the consolidated balance sheet date
(Million yen; amounts less than one million yen are omitted.)
Within one year
Held-to-maturity securitiesCorporate bonds ¥100 ¥- ¥-
Sub-total 100 - - Available-for-sale and other securities(1) Debt securities
Government bonds 300 12 - Corporate bonds 1,772 1,645 1,109
(2) Others 30 - - Sub-total 2,102 1,657 1,109
Total ¥2,203 ¥1,657 ¥1,109
More than five years,less than ten years
Carrying Amount > Investment Cost
FY2002 (as of March 31, 2002)
InvestmentCost Carrying Amount Differences
Carrying Amounts
More than one year,less than five years
37
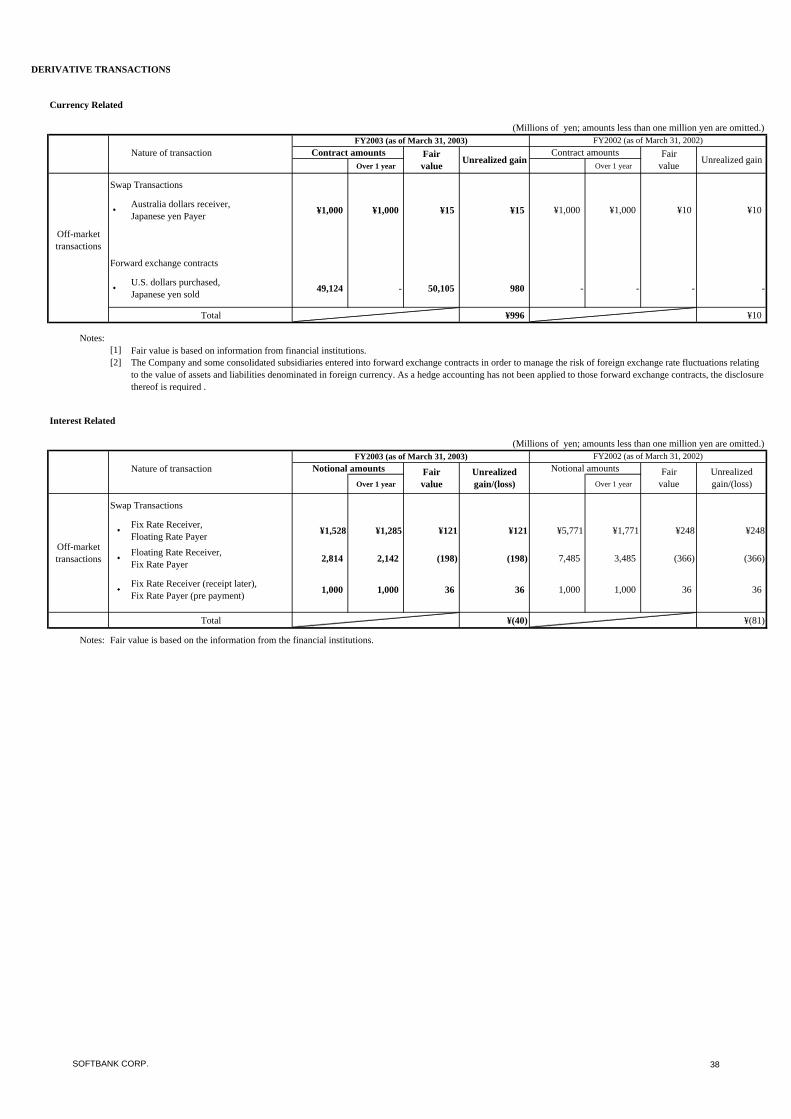
DERIVATIVE TRANSACTIONS
Currency Related
(Millions of yen; amounts less than one million yen are omitted.)
Nature of transactionOver 1 year Over 1 year
Swap Transactions
・Australia dollars receiver,Japanese yen Payer ¥1,000 ¥1,000 ¥15 ¥15 ¥1,000 ¥1,000 ¥10 ¥10
Forward exchange contracts
・U.S. dollars purchased,Japanese yen sold 49,124 - 50,105 980 - - - -
Total ¥996 ¥10
Notes: [1] Fair value is based on information from financial institutions.[2]
Interest Related
(Millions of yen; amounts less than one million yen are omitted.)
Nature of transactionOver 1 year Over 1 year
Swap Transactions
・Fix Rate Receiver,Floating Rate Payer ¥1,528 ¥1,285 ¥121 ¥121 ¥5,771 ¥1,771 ¥248 ¥248
・Floating Rate Receiver,Fix Rate Payer 2,814 2,142 (198) (198) 7,485 3,485 (366) (366)
・Fix Rate Receiver (receipt later),Fix Rate Payer (pre payment) 1,000 1,000 36 36 1,000 1,000 36 36
Total ¥(40) ¥(81)
Notes: Fair value is based on the information from the financial institutions.
Off-markettransactions
Off-markettransactions
FY2003 (as of March 31, 2003)
The Company and some consolidated subsidiaries entered into forward exchange contracts in order to manage the risk of foreign exchange rate fluctuations relatingto the value of assets and liabilities denominated in foreign currency. As a hedge accounting has not been applied to those forward exchange contracts, the disclosurethereof is required .
Unrealized gain
FY2002 (as of March 31, 2002)Notional amounts Fair
valueUnrealizedgain/(loss)
Notional amounts Fairvalue
Unrealizedgain/(loss)
FY2003 (as of March 31, 2003) FY2002 (as of March 31, 2002)Contract amounts Fair
value Unrealized gainContract amounts Fair
value
SOFTBANK CORP. 38
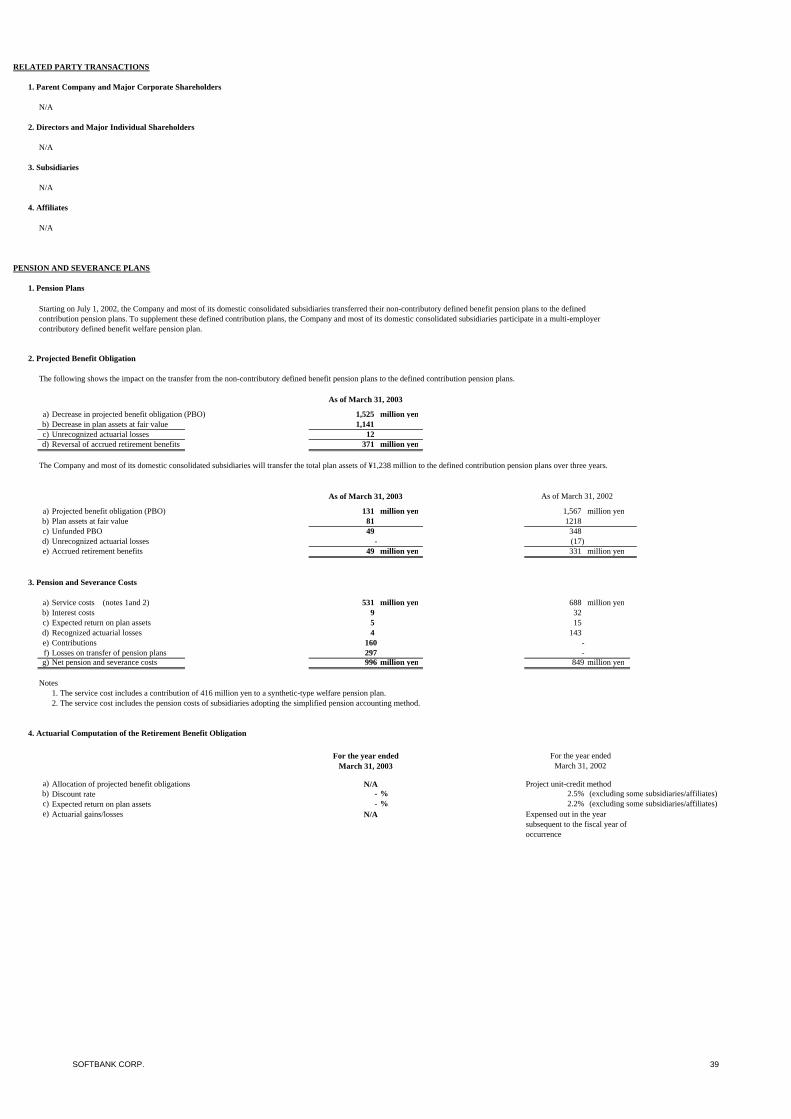
RELATED PARTY TRANSACTIONS
1. Parent Company and Major Corporate Shareholders
N/A
2. Directors and Major Individual Shareholders
N/A
3. Subsidiaries
N/A
4. Affiliates
N/A
PENSION AND SEVERANCE PLANS
1. Pension Plans
2. Projected Benefit Obligation
The following shows the impact on the transfer from the non-contributory defined benefit pension plans to the defined contribution pension plans.
a) Decrease in projected benefit obligation (PBO) 1,525 million yenb) Decrease in plan assets at fair value 1,141c) Unrecognized actuarial losses 12d) Reversal of accrued retirement benefits 371 million yen
The Company and most of its domestic consolidated subsidiaries will transfer the total plan assets of ¥1,238 million to the defined contribution pension plans over three years.
a) Projected benefit obligation (PBO) 131 million yen million yenb) Plan assets at fair value 81c) Unfunded PBO 49d) Unrecognized actuarial losses -e) Accrued retirement benefits 49 million yen million yen
3. Pension and Severance Costs
a) Service costs (notes 1and 2) 531 million yen million yenb) Interest costs 9c) Expected return on plan assets 5d) Recognized actuarial losses 4e) Contributions 160 -f) Losses on transfer of pension plans 297 -g) Net pension and severance costs 996 million yen 849 million yen
Notes1. The service cost includes a contribution of 416 million yen to a synthetic-type welfare pension plan.2. The service cost includes the pension costs of subsidiaries adopting the simplified pension accounting method.
4. Actuarial Computation of the Retirement Benefit Obligation
a) N/Ab) Discount rate - % (excluding some subsidiaries/affiliates)c) Expected return on plan assets - % (excluding some subsidiaries/affiliates)e) Actuarial gains/losses N/A
Allocation of projected benefit obligations2.5%2.2%
Project unit-credit method
Expensed out in the yearsubsequent to the fiscal year ofoccurrence
6883215
As of March 31, 2003
1218348(17)
1,567
Starting on July 1, 2002, the Company and most of its domestic consolidated subsidiaries transferred their non-contributory defined benefit pension plans to the definedcontribution pension plans. To supplement these defined contribution plans, the Company and most of its domestic consolidated subsidiaries participate in a multi-employercontributory defined benefit welfare pension plan.
As of March 31, 2003
For the year endedMarch 31, 2003
143
For the year endedMarch 31, 2002
331
As of March 31, 2002
SOFTBANK CORP. 39