Socioeconomic classifications in media research Czech ... · SE classifications in Media Research 3...
23
Socioeconomic classifications in media research Czech Republic vs. European countries Tomáš Hanzák, Nielsen Admosphere Prague, 30th November 2017
Transcript of Socioeconomic classifications in media research Czech ... · SE classifications in Media Research 3...

Socioeconomic classificationsin media researchCzech Republic vs. European countries
Tomáš Hanzák, Nielsen Admosphere
Prague, 30th November 2017

Socioeconomic (SE) classifications
2
In many surveys, a variable called “Socioeconomic classification”, “Social class”, “Social grade”, “ABCDE” or similarly is used.
The idea is to have one-dimensional, ordinal segmentation.
Objective approach dominates.
But sometimes experiments with subjective approach (self-declaration) as well.

SE classifications in Media Research
3
Media research = measurement/research of TV, radio, print,internet, cross-media… Often syndicated studies, market currencies.
SE classification enriches the demographic audience description.
SE classification is often used for ad campaigns planning and evaluation.
Sometimes a market standard is established and used across all media types.
Data users do not like changes in SE classification definition.
Thus making improvements in existing SE classifications is not easy.

Key points to decide
4
Household level vs. individual level?
Which dimension is more important - „social“ or „economic“?
Monthly income used as an input – yes or not?
What inputs can we afford? (current data, questionaire length, panel?…)
Number of SE categories and their sizes?
Capture the population evolution over time – yes or not?
Is international comparability achievable or even important?

Attempts for international standardization
5
Challenges:
• Different educational systems
• Different occupational context
• Different possession items being relevant
• How can we be sure that it is truly implemented in the same way?
Attempts:
ESOMAR Social Grade (1997) – details on the next slide
TGI Global Socio-Economic Levels (SEL) – details on the next next slide
European Socio-Economic Classification (ESeC) – EU project (2004 – 2006)

ESOMAR Social Grade (1997)
6
Defined using occupation and Terminal Education Age of Main Income Earner.
For M.I.E.s never working (small %), number of possession items is used.
8 categories: A, B, C1, C2, D1, E1, E2, E3
ESOMAR concept inspired SE classifications in several countries (CZ, SK, RO, HU, GR, BG). But as a standardization attempt it failed.

TGI Global Socio-Economic Levels (SEL)
7
Used in a standardized way in TGI surveys around the world.
Defined on person level, using a point-score system based on:
• University education (bachelor+), credit card holder, internet user,mobile phone owner, traveled by plane last year
• Plus appr. 8 household possession items (car, washing machine, laptop,digital camera etc.).
In every country and every year, it is segmentedinto 4 groups sized 10 %, 20 %, 30 % and 40 %.

Socioeconomic classificationsin media research
in Czech Rep. - ABCDE
8

Czech ABCDE story
9
From 2006, two ABCDE classifications inspired by ESOMARSocial Grade (1997) started to be used.
The biggest issue: Classification of HHs with economicallyactive ad non-active head was not balanced.Losing a job or retirement was a plus!
In 2012 Nielsen Admosphere offered their replacement by a newly developed classification. Since 2013 this new variable is part of official TV audience data.
The new ABCDE classification later appeared in the other syndicated surveys (NetMonitor, Radioprojekt and MEDIA PROJEKT) and thus become a new standard.
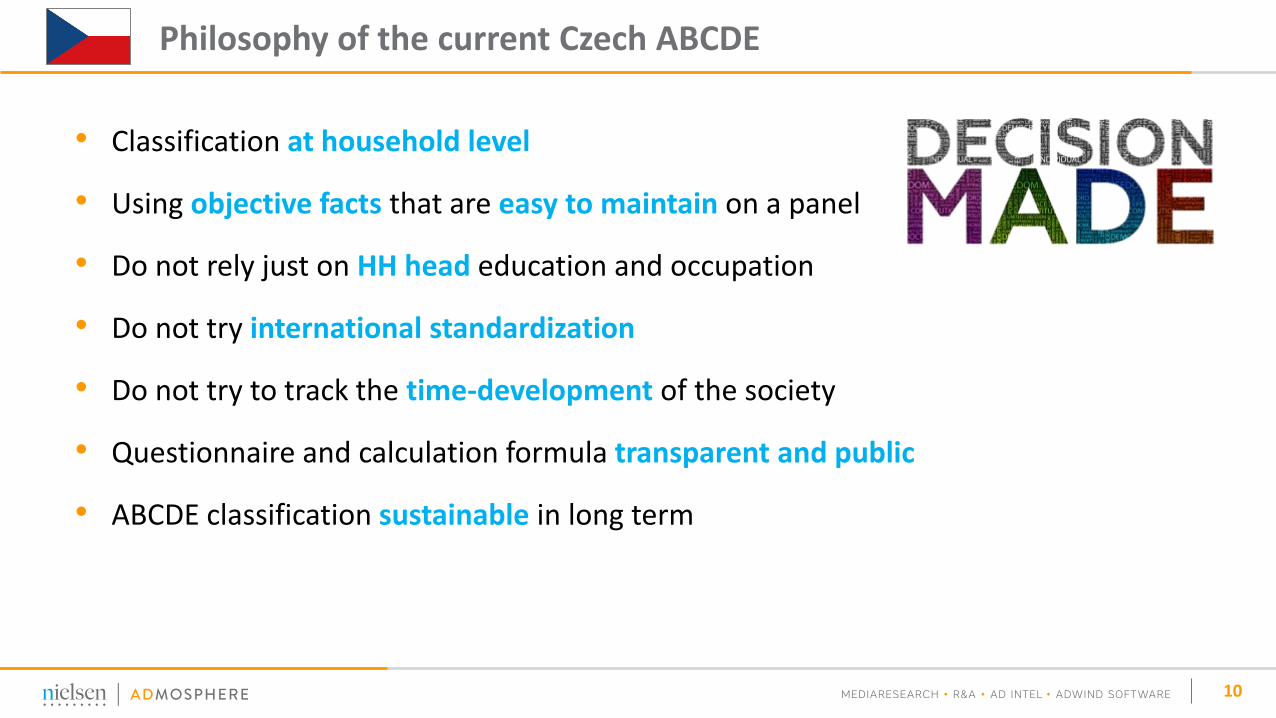
Philosophy of the current Czech ABCDE
10
• Classification at household level
• Using objective facts that are easy to maintain on a panel
• Do not rely just on HH head education and occupation
• Do not try international standardization
• Do not try to track the time-development of the society
• Questionnaire and calculation formula transparent and public
• ABCDE classification sustainable in long term

Variable’s construction
11
Do not use household income as an input.
Combine more inputs - use a score based calculation.
Build a non-linear regression model predicting “Income index”.
Income index = Household income / Reference income
Reference income = 9 000 + 9 000 × (Adults 19+) + 4 500 × (Children 0-18)

ABCDE calculation
12
HH head education andprofessional status
Number, age and economicactivity of HH members
Ownership (car, cottage, internet, microwave oven, electric drill)
Region (average salary)
Uniform distribution in population of all Czech households.
Regular annual recalibrations to keep it like this.

Correlation between ABCDE and other variables
13
* Income index = income / reference income
** Equipment index = number of possession items out of: car ≤ 10 years, cottage, home internet,tablet, smartphone, laptop, dish washer, smart TV, flat TV, HD TV
Source: ATO - Nielsen Admosphere, Continual Survey 2016, all households

ABCDE vs. Household characteristics
14
/
Source: ATO - Nielsen Admosphere, Continual Survey 2016, all households

ABCDE vs. HH head prof. status and education
15
Source: ATO - Nielsen Admosphere, Continual Survey 2016, all households

16
Socioeconomic classificationsin media research
in selected European countries

Bulgaria
17
In 2016 we developed ABCDE classification, similar to the Czech one, and launched it in our TAM data in Bulgaria.
Inputs used:
Household head education and prof. status
Number, age and economic activity of household members
Ownership (car, internet, dishwasher, air conditioning)
Settlement size, Region

18
This year I was asked to develop a new „Social Class“ variablefor Croatian TAM data.
The new variable is now under discussions with the local TAM clients.
I used concept similar to CZ and BG.
Inputs used:
Number of HH members (all and aged 0-18 years)
Education, Employment status and Profession of all HH members
Ownership of cars, 2nd house, AC, dishwasher, home internet, # of TV sets and “Multichannel” TV
County and Settlement size
Croatia

Spain
19
Developed during 2013 – 2015 to replace ESOMAR-style “Social Class” variable used from 1988.
Linear regression model predicting HH income.
Inputs used:
(M.I.E. education) × (M.I.E. profession)
Current working status of M.I.E.
(# of HH members) × (# of HH members with income)
Very similar approach is used in Mexico as well.
IA1 IA2 IB IC ID IE1 IE2
Definition 3.006 or + 2.452 to 3.005 2.146 to 2.451 1.603 to 2.145 1.313 to 1.602 745 to 1.312 Under 745
Original Size 7,5% 15,0% 15,0% 20,0% 15,0% 15,0% 7,5%

Netherlands
20
“Social Class” variable used in media research as a partof Dutch “Golden Standard” tools.
Approach a la ESOMAR Social Grade (1997):
Education of HH head
×Occupation of HH head
Grouped into 5 categories: A, B1, B2, C, D.
Similar Social Class variable is used in Belgium(but it is under revision now).

Austria
21
“Social Class Modell” used. Score point system based on:
Household income (dominant)
Profession of HH head
Education of target person
Total score is divided into 10 deciles (thresholds are calibrated every year).
A = 10 %B = 20 %C1 = 20 %C2 = 20 %D = 20 %E = 10 %
Very similar variable is used in Germany as well (Sozioökonomische Segmente).

Hungary
22
In TV audience data by AGB Nielsen, two variables are available:
“ESOMAR Social status”
• Grouped into 5 categories: A, BC1, C2, D, E
• High correlation with M.I.E. education
• Not much used
“Purchasing Power”
• Purely economic metric – HH expenditures in various fields
• Total score segmented into: A, B, C, D, E

Nielsen Admosphere, a.s. │ Českobratrská 2778/1 │ 130 00 Praha 3 │ Czech Republic │ www.nielsen-admosphere.eu
Thank you for your attention!
Tomáš Hanzák
E-mail:[email protected]@nielsen.com