Socio-Economic Considerations of the Aquaculture ... · Socio-Economic Considerations of the...
6
Socio-Economic Considerations of the Aquaculture Industries in Cebu and Siquijor, Central Visayas, Philippines Rachel Luz V. Rica Cebu Technological University- Integrated Coastal Resource Management Center, Main Campus Cebu City, Philippines e-mail: [email protected] © The Authors (s) 2015. This article is published with open Access by University Sidi Mohamed Ben Abdallah Abstract Aquaculture industry has grown globally to fill in the shortage of fish supply from the sea. A study of aquaculture industries in ICRMP sites of Central Visayas was conducted to determine the socio-cultural and economic aspects of aquaculture. Results revealed that 79% of aquaculture systems are in freshwater and brackish ponds with 50% Oreochromis niloticus and 43% Chanos chanos as common cultured species. Ponds are operated by private individuals and conform to the standard culture systems of cultured species. The individuals that were employed in aquaculture industries are those that are living near the aquaculture sites which are mostly hired as caretakers and helpers and basically non-permanent and on-call basis. In spite of their employment in the aquaculture industries, communities near aquaculture sites are considered poor since majority of households are living below the poverty thresholds. There is a periodicity of consumption of aquaculture products in the community. The frequency of consumption is high during harvest time (50%) which usually happens every 3-4 months only, thus creating high demand in the community. Keywords: Aquaculture, employment, culture systems, consumption, poverty thresholds INTRODUCTION Global aquaculture has tremendously grown to support the need to fill up the gap between wild- seafood supply and seafood demand (Chu et.al, 2010). World’s fish landings have grown very slowly at an annual average of 3.4% due to indiscriminate fishing and fisheries habitat degradation and destruction. To avert the situation, aquaculture production has expanded and has steadily increased by 15% (Chong, 1994). Since 1990s, aquaculture expanded rapidly in the Asia-Pacific in terms of area and number of people engaged in the sector. Aquaculture has been a source of livelihood, food supply and employment for the poor (Sekhar and Ortiz, 2014). To meet future global demand for seafood, it is estimated that aquaculture production will need to grow 70to 90 million tonnes by 2030 (FAO, 2010 as cited by Rubio, et al, 2010). Aquaculture in the Philippines is expanding rapidly and also becoming an important source of income and employment for the rural poor, women and youth. It shows that Aquaculture has the potential to increase the household income in rural areas where it is difficult to find other sources of employment and thus support the current consumption and meet unexpected cash needs (Sekhar & Ortiz, 2014). The aquaculture industry’s contributions to local economy and to alleviate income were not given attention until the mid 90’s (Sekhar & Ortiz, 2014). There were limited analysis on the significance of Aquaculture to alleviate poverty in the rural areas since focus were given to Fisheries and Agriculture - in which Aquaculture forms part of Fisheries. Aquaculture registered 2.58 percent production cut in 2014. All major species cultured, milkfish, tilapia, tiger prawn and seaweed, recorded poor yields during the year. These species accounted 90.18 percent of the total aquaculture production. Aquafarm operators complained of increasing cost of inputs to operation, particularly aquafeeds. Aquaculture contributed the biggest share to the total fisheries output at 49.80 percent (Fisheries Situationer, 2014). Even if the cost of production is high, aquafarms managed to sustain production at a very low rate to meet the demands locally and internationally. In this study, social and economic aspects of aquaculture were considered and how aquaculture contributed to the local economy. Social considerations include organizational structure, culture management systems, community characteristics specifically on household income and expenditure. Economic aspects tackle income, employment, production, consumption and market of aquaculture products. ORIGINAL PAPER Tropical Technology Journal ISSN: 2199-8698, Volume 19, Issue 1, Article 14 1 DOI 10.7603/s40934-015-0014-0
-
Upload
duongtuong -
Category
Documents
-
view
217 -
download
1
Transcript of Socio-Economic Considerations of the Aquaculture ... · Socio-Economic Considerations of the...
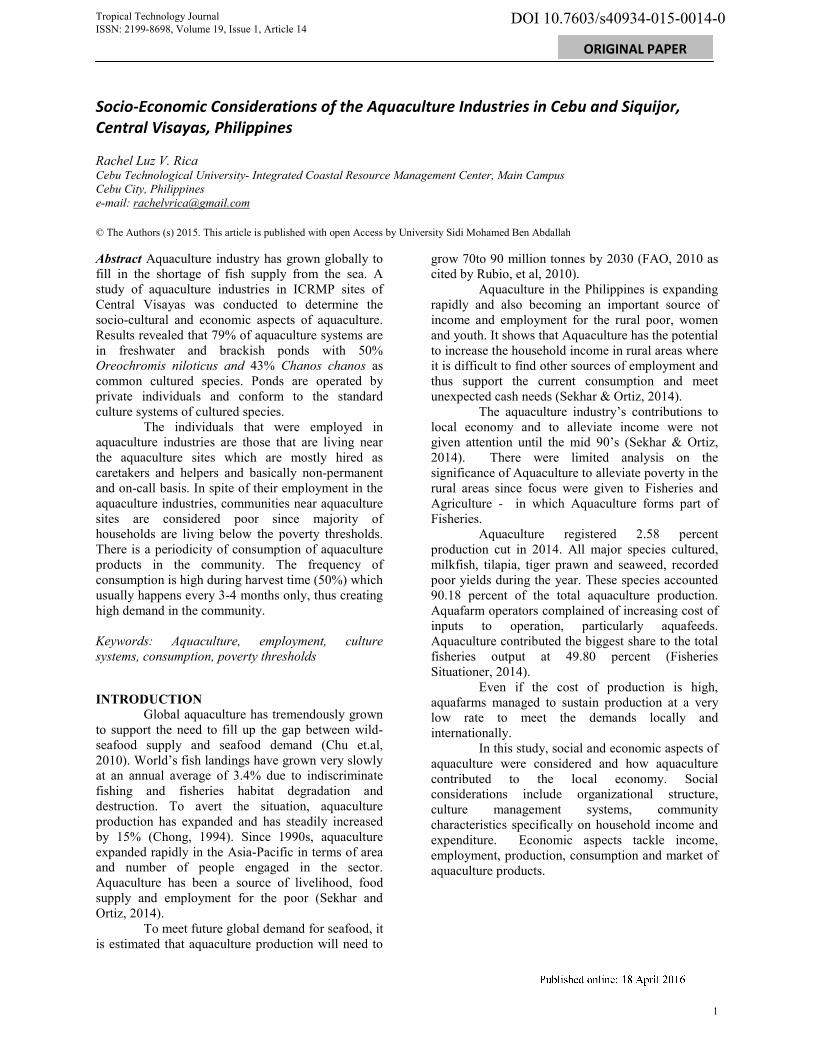
Socio-Economic Considerations of the Aquaculture Industries in Cebu and Siquijor, Central Visayas, Philippines Rachel Luz V. Rica Cebu Technological University- Integrated Coastal Resource Management Center, Main Campus Cebu City, Philippines e-mail: [email protected] © The Authors (s) 2015. This article is published with open Access by University Sidi Mohamed Ben Abdallah Abstract Aquaculture industry has grown globally to fill in the shortage of fish supply from the sea. A study of aquaculture industries in ICRMP sites of Central Visayas was conducted to determine the socio-cultural and economic aspects of aquaculture. Results revealed that 79% of aquaculture systems are in freshwater and brackish ponds with 50% Oreochromis niloticus and 43% Chanos chanos as common cultured species. Ponds are operated by private individuals and conform to the standard culture systems of cultured species.
The individuals that were employed in aquaculture industries are those that are living near the aquaculture sites which are mostly hired as caretakers and helpers and basically non-permanent and on-call basis. In spite of their employment in the aquaculture industries, communities near aquaculture sites are considered poor since majority of households are living below the poverty thresholds. There is a periodicity of consumption of aquaculture products in the community. The frequency of consumption is high during harvest time (50%) which usually happens every 3-4 months only, thus creating high demand in the community. Keywords: Aquaculture, employment, culture systems, consumption, poverty thresholds INTRODUCTION
Global aquaculture has tremendously grown to support the need to fill up the gap between wild-seafood supply and seafood demand (Chu et.al, 2010). World’s fish landings have grown very slowly at an annual average of 3.4% due to indiscriminate fishing and fisheries habitat degradation and destruction. To avert the situation, aquaculture production has expanded and has steadily increased by 15% (Chong, 1994). Since 1990s, aquaculture expanded rapidly in the Asia-Pacific in terms of area and number of people engaged in the sector. Aquaculture has been a source of livelihood, food supply and employment for the poor (Sekhar and Ortiz, 2014).
To meet future global demand for seafood, it is estimated that aquaculture production will need to
grow 70to 90 million tonnes by 2030 (FAO, 2010 as cited by Rubio, et al, 2010).
Aquaculture in the Philippines is expanding rapidly and also becoming an important source of income and employment for the rural poor, women and youth. It shows that Aquaculture has the potential to increase the household income in rural areas where it is difficult to find other sources of employment and thus support the current consumption and meet unexpected cash needs (Sekhar & Ortiz, 2014). The aquaculture industry’s contributions to local economy and to alleviate income were not given attention until the mid 90’s (Sekhar & Ortiz, 2014). There were limited analysis on the significance of Aquaculture to alleviate poverty in the rural areas since focus were given to Fisheries and Agriculture - in which Aquaculture forms part of Fisheries.
Aquaculture registered 2.58 percent production cut in 2014. All major species cultured, milkfish, tilapia, tiger prawn and seaweed, recorded poor yields during the year. These species accounted 90.18 percent of the total aquaculture production. Aquafarm operators complained of increasing cost of inputs to operation, particularly aquafeeds. Aquaculture contributed the biggest share to the total fisheries output at 49.80 percent (Fisheries Situationer, 2014).
Even if the cost of production is high, aquafarms managed to sustain production at a very low rate to meet the demands locally and internationally.
In this study, social and economic aspects of aquaculture were considered and how aquaculture contributed to the local economy. Social considerations include organizational structure, culture management systems, community characteristics specifically on household income and expenditure. Economic aspects tackle income, employment, production, consumption and market of aquaculture products.
ORIGINAL PAPER
Tropical Technology Journal ISSN: 2199-8698, Volume 19, Issue 1, Article 14
1
DOI 10.7603/s40934-015-0014-0
MATERIALS AND METHODS
Description of sites and respondents Nine municipalities in the province of Cebu
with aquaculture farms were surveyed employing a mixed method of research. The following inclusion criteria were considered: active involvement of the municipality in the ICRMP Project, recipient of the programs projects of the ICRMP, with aquaculture production, employment of family members in aquaculture farms and willingness to participate in the survey.
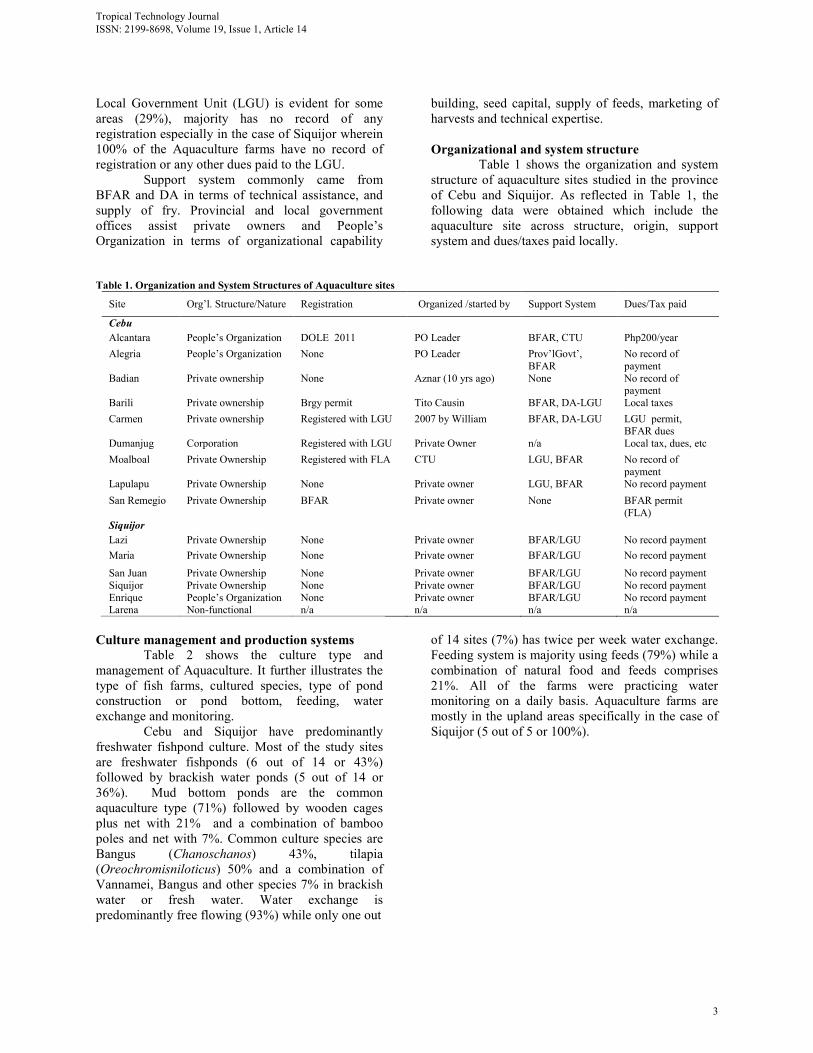
Specifically, the sites of the study in Cebu Province were located in the southern and northern part comprising the following: Barangay (Brgy.) Valencia, Alegria, Zaragosa Island in Badian, Brgy. Tuble inMoalboal, Brgy.Polo, Alcantara, Ilaya, Dumanjugand AC Tilapia in Brgy. Campangga, Barili all in South of Cebu. While in the northern part, the sites include: Brgy. Luyangin Carmen, Brgy. Argawanonin SanRemegio and Brgy. Kalawisan inLapulapu City for Cebu study sites.
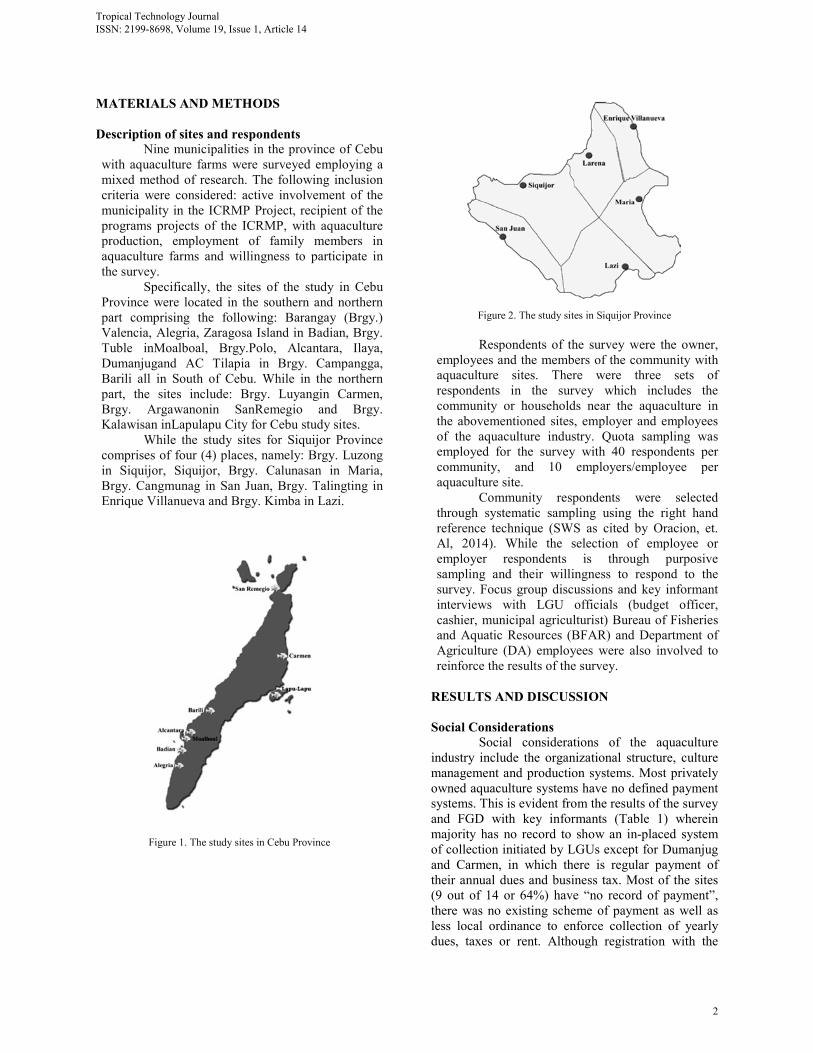
While the study sites for Siquijor Province comprises of four (4) places, namely: Brgy. Luzong in Siquijor, Siquijor, Brgy. Calunasan in Maria, Brgy. Cangmunag in San Juan, Brgy. Talingting in Enrique Villanueva and Brgy. Kimba in Lazi.
Figure 1. The study sites in Cebu Province
Figure 2. The study sites in Siquijor Province
Respondents of the survey were the owner,
employees and the members of the community with aquaculture sites. There were three sets of respondents in the survey which includes the community or households near the aquaculture in the abovementioned sites, employer and employees of the aquaculture industry. Quota sampling was employed for the survey with 40 respondents per community, and 10 employers/employee per aquaculture site.
Community respondents were selected through systematic sampling using the right hand reference technique (SWS as cited by Oracion, et. Al, 2014). While the selection of employee or employer respondents is through purposive sampling and their willingness to respond to the survey. Focus group discussions and key informant interviews with LGU officials (budget officer, cashier, municipal agriculturist) Bureau of Fisheries and Aquatic Resources (BFAR) and Department of Agriculture (DA) employees were also involved to reinforce the results of the survey.
RESULTS AND DISCUSSION Social Considerations
Social considerations of the aquaculture industry include the organizational structure, culture management and production systems. Most privately owned aquaculture systems have no defined payment systems. This is evident from the results of the survey and FGD with key informants (Table 1) wherein majority has no record to show an in-placed system of collection initiated by LGUs except for Dumanjug and Carmen, in which there is regular payment of their annual dues and business tax. Most of the sites (9 out of 14 or 64%) have “no record of payment”, there was no existing scheme of payment as well as less local ordinance to enforce collection of yearly dues, taxes or rent. Although registration with the
Tropical Technology Journal ISSN: 2199-8698, Volume 19, Issue 1, Article 14
2
Local Government Unit (LGU) is evident for some areas (29%), majority has no record of any registration especially in the case of Siquijor wherein 100% of the Aquaculture farms have no record of registration or any other dues paid to the LGU.
Support system commonly came from BFAR and DA in terms of technical assistance, and supply of fry. Provincial and local government offices assist private owners and People’s Organization in terms of organizational capability
building, seed capital, supply of feeds, marketing of harvests and technical expertise.
Organizational and system structure
Table 1 shows the organization and system structure of aquaculture sites studied in the province of Cebu and Siquijor. As reflected in Table 1, the following data were obtained which include the aquaculture site across structure, origin, support system and dues/taxes paid locally.
Table 1. Organization and System Structures of Aquaculture sites
Site Org’l. Structure/Nature Registration Organized /started by Support System Dues/Tax paid
Cebu Alcantara People’s Organization DOLE 2011 PO Leader BFAR, CTU Php200/year Alegria People’s Organization None PO Leader Prov’lGovt’,
BFAR No record of payment
Badian Private ownership None Aznar (10 yrs ago) None No record of payment
Barili Private ownership Brgy permit Tito Causin BFAR, DA-LGU Local taxes Carmen Private ownership Registered with LGU 2007 by William BFAR, DA-LGU LGU permit,
BFAR dues Dumanjug Corporation Registered with LGU Private Owner n/a Local tax, dues, etc Moalboal Private Ownership Registered with FLA CTU LGU, BFAR No record of
payment Lapulapu Private Ownership None Private owner LGU, BFAR No record payment San Remegio Private Ownership BFAR Private owner None BFAR permit
(FLA) Siquijor Lazi Private Ownership None Private owner BFAR/LGU No record payment Maria Private Ownership None Private owner BFAR/LGU No record payment
San Juan Private Ownership None Private owner BFAR/LGU No record payment Siquijor Private Ownership None Private owner BFAR/LGU No record payment Enrique People’s Organization None Private owner BFAR/LGU No record payment Larena Non-functional n/a n/a n/a n/a
Culture management and production systems Table 2 shows the culture type and management of Aquaculture. It further illustrates the type of fish farms, cultured species, type of pond construction or pond bottom, feeding, water exchange and monitoring.
Cebu and Siquijor have predominantly freshwater fishpond culture. Most of the study sites are freshwater fishponds (6 out of 14 or 43%) followed by brackish water ponds (5 out of 14 or 36%). Mud bottom ponds are the common aquaculture type (71%) followed by wooden cages plus net with 21% and a combination of bamboo poles and net with 7%. Common culture species are Bangus (Chanoschanos) 43%, tilapia (Oreochromisniloticus) 50% and a combination of Vannamei, Bangus and other species 7% in brackish water or fresh water. Water exchange is predominantly free flowing (93%) while only one out
of 14 sites (7%) has twice per week water exchange. Feeding system is majority using feeds (79%) while a combination of natural food and feeds comprises 21%. All of the farms were practicing water monitoring on a daily basis. Aquaculture farms are mostly in the upland areas specifically in the case of Siquijor (5 out of 5 or 100%).
Tropical Technology Journal ISSN: 2199-8698, Volume 19, Issue 1, Article 14
3
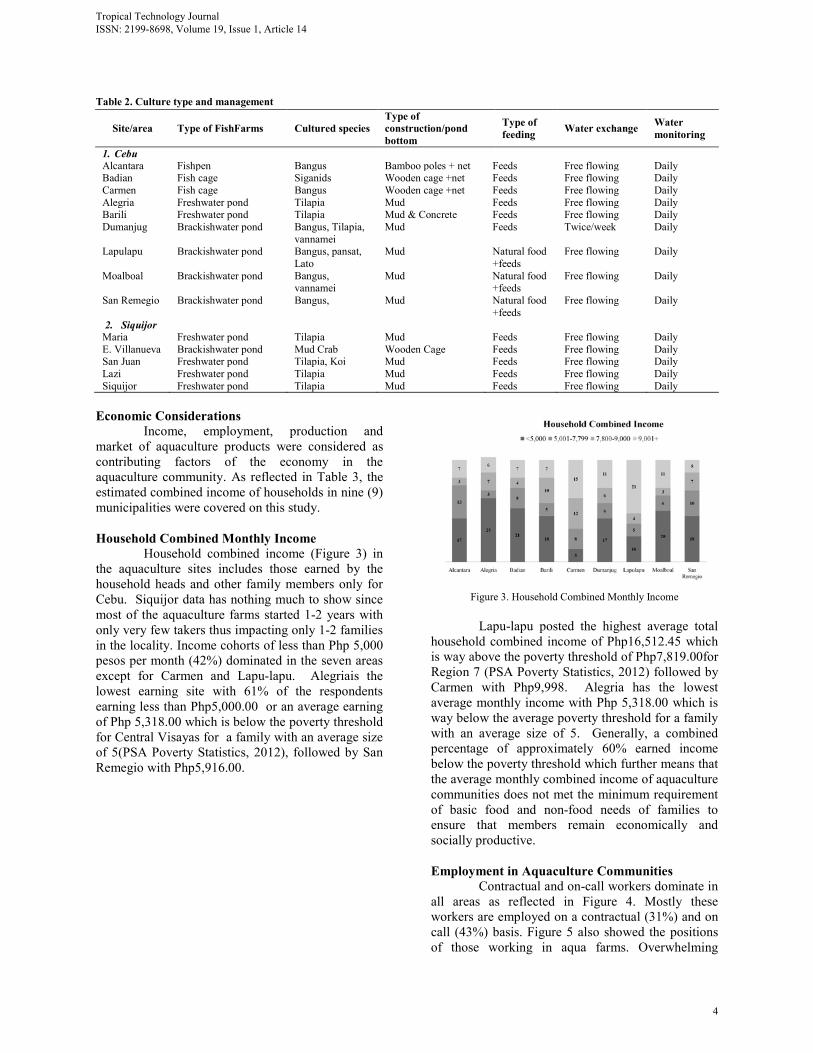
Table 2. Culture type and management
Economic Considerations
Income, employment, production and market of aquaculture products were considered as contributing factors of the economy in the aquaculture community. As reflected in Table 3, the estimated combined income of households in nine (9) municipalities were covered on this study.
Household Combined Monthly Income
Household combined income (Figure 3) in the aquaculture sites includes those earned by the household heads and other family members only for Cebu. Siquijor data has nothing much to show since most of the aquaculture farms started 1-2 years with only very few takers thus impacting only 1-2 families in the locality. Income cohorts of less than Php 5,000 pesos per month (42%) dominated in the seven areas except for Carmen and Lapu-lapu. Alegriais the lowest earning site with 61% of the respondents earning less than Php5,000.00 or an average earning of Php 5,318.00 which is below the poverty threshold for Central Visayas for a family with an average size of 5(PSA Poverty Statistics, 2012), followed by San Remegio with Php5,916.00.
Figure 3. Household Combined Monthly Income
Lapu-lapu posted the highest average total
household combined income of Php16,512.45 which is way above the poverty threshold of Php7,819.00for Region 7 (PSA Poverty Statistics, 2012) followed by Carmen with Php9,998. Alegria has the lowest average monthly income with Php 5,318.00 which is way below the average poverty threshold for a family with an average size of 5. Generally, a combined percentage of approximately 60% earned income below the poverty threshold which further means that the average monthly combined income of aquaculture communities does not met the minimum requirement of basic food and non-food needs of families to ensure that members remain economically and socially productive. Employment in Aquaculture Communities
Contractual and on-call workers dominate in all areas as reflected in Figure 4. Mostly these workers are employed on a contractual (31%) and on call (43%) basis. Figure 5 also showed the positions of those working in aqua farms. Overwhelming
Site/area Type of FishFarms Cultured species Type of construction/pond bottom
Type of feeding Water exchange Water
monitoring
1. Cebu Alcantara Fishpen Bangus Bamboo poles + net Feeds Free flowing Daily Badian Fish cage Siganids Wooden cage +net Feeds Free flowing Daily Carmen Fish cage Bangus Wooden cage +net Feeds Free flowing Daily Alegria Freshwater pond Tilapia Mud Feeds Free flowing Daily Barili Freshwater pond Tilapia Mud & Concrete Feeds Free flowing Daily Dumanjug Brackishwater pond Bangus, Tilapia,
vannamei Mud Feeds Twice/week Daily
Lapulapu Brackishwater pond Bangus, pansat, Lato
Mud Natural food +feeds
Free flowing Daily
Moalboal Brackishwater pond Bangus, vannamei
Mud Natural food +feeds
Free flowing Daily
San Remegio Brackishwater pond Bangus, Mud Natural food +feeds
Free flowing Daily
2. Siquijor Maria Freshwater pond Tilapia Mud Feeds Free flowing Daily E. Villanueva Brackishwater pond Mud Crab Wooden Cage Feeds Free flowing Daily San Juan Freshwater pond Tilapia, Koi Mud Feeds Free flowing Daily Lazi Freshwater pond Tilapia Mud Feeds Free flowing Daily Siquijor Freshwater pond Tilapia Mud Feeds Free flowing Daily
Tropical Technology Journal ISSN: 2199-8698, Volume 19, Issue 1, Article 14
4

majority are caretakers and helper-on call. This result corroborates with the tenurial status in Figure 4 where contractual and on call dominates in all sites. On- call basis are those hired per day specifically during pond preparation and harvest period. Those employed on a permanent basis live within the aquaculture premises. Benefits received for permanently employed include SSS, Philhealth, Pag-IBIG and Christmas Bonus.
Figure 4. Tenurial Status in Aquaculture (%)
Figure 5. Position in the Farm (%)
Production& Marketing In the aquaculture subsector, most of the products are either sold on site or transported to major fish ports for auctioning. On-site bidding was done by middlepersons and fish exporters. Bidding in fish ports is typically done by middlepersons, fish vendors in the local wet markets and small fish processors. Some aquaculture farms have their own processing facilities. Hence, most of their aquaculture products directly go to their processing plants (FAO fisheries and Aquaculture Dept, 2014).
In the case of Cebu and Siquijor (Figure 6), products are commonly sold in the local market, specifically those products from brackishwater ponds (Bangus, Tilapia).Another market are towns and cities like Manila and Davao. But it is worth noting that many of the respondents expressed that they do not know where the aquaculture products are being sold.
Figure 6. Market of Aquaculture Products
Figure 7. Consumption of aquaculture products
Consumption of Aquaculture Products
Consuming products from aquaculture also means that there is demand in the community. If the consumption of the product increases, the demand of it also increases. Respondents were asked if they buy products from aquaculture farms. Results show in Figure 7 shows that most of the respondents (320 out of 361 or 89%) indicated that they bought products from aquaculture farms preferably Bangus, Tilapia and shrimp, while the opposite 11% says otherwise. The frequency of consuming these products is high during harvest time (50%) which usually happens every 3-4 months.
CONCLUSIONS AND RECOMMENDATIONS The survey of different aquaculture sites in Central Visayas give a picture of how aquaculture is managed, what are the characteristics of households, communities and workers in the industry. The study reveals that most of the aquaculture sites are managed or organized by private individuals but only few have records of an in-placed payment system initiated by LGUs. Involvement of individuals in organizations is evident in the structure
Tropical Technology Journal ISSN: 2199-8698, Volume 19, Issue 1, Article 14
5
of some aquafarms wherein government and LGU support is noticeable. Aquaculture systems of production conform to the standard, with daily water monitoring and regular water exchange. Communities within aquaculture sites are basically poor wherein more than half of the households (60%) have income below the poverty threshold. Conversely, employment in aquaculture are not permanent, usually are on-calls or contractual. Although majority are not employed on a permanent basis, the industry has contributed to employment generation with 74% or 7 in every 10 families in the community are employed in aquaculture and supply of fish is available every harvest season. Consumption of aquaculture products has influenced demand of Bangus, Tilapia and other aquaculture products. There socio-cultural and economic aspects specifically on increased income and the impact of aquaculture in the well-being of individuals employed and communities around aquaculture have not been investigated deeply in this paper, hence it is highly recommended that future research endeavours shall focus in these aspects. Open Access: This article is distributed under the terms of the Creative Commons Attribution License (CC-BY 4.0) which permits any use, distribution, and reproduction in any medium, provided the original authors(s) and the source are credited. References
1. K.C. Chong, “Proceedings of the Seminar-Workshop on Aquaculture Development in Southeast Asia and Prospects for Seafarming and Searanching”, Food and Agriculture Organization/UN P.O. Box 5039, New Market, Dhaka, Bangladesh, 1994 [In: F. Lacanilao, R.M. Coloso, G.F. Quinitio, SEAFDEC Aquaculture Department, Iloilo, Philippines, Eds.: 19-23, August 1991].
2. J. Chu, J.L. Anderson, F. Asche and L. Tudur, “Stakeholder’s Perceptions of Aquaculture and Implications for its Future: A Comparison of the USA and Norwa” Marine Resource Economics, USA Vol. 25, 2010.
3. A.M.J. Rubio-Zuazo and P. C. Winberg, “Environmental and Socio-Economic Considerations for Aquaculture in Jervis Bay NSW,” Canberra: Fisheries Research and Development Corporation, 2010.
4. N. Sekhar and I. Ortiz, “Aquaculture in the Philippines: Socio-Economics, poverty and gender”, Norwegian Institute for Water Research, Gaustadalléen 21 N-0344 OSLO, Norway, 2014.
5. Fishery and Aquaculture Country Profiles, Country Profile Fact Sheets, Philippines, In: Food and Agricultural Organization Fisheries and Aquaculture Department online], Rome, Updated 2014. [Cited 21 January2016]. http://www.fao.org/fishery/facp/PHL/en.
6. Philippine Statistical Authority, Press release 2015 (http://www.nscb.gov.ph/pressreleases/2015/PSA-20150306-SS2-01_poverty.asp)
Tropical Technology Journal ISSN: 2199-8698, Volume 19, Issue 1, Article 14
6