
SOCIAL SECURITY · Dear Senator Sanders and Representative DeFazio: I am writing in response to...
21
SOCIAL SECURITY ADMINISTRATION BALTIMORE, MD 21235-0001 SOCIAL SECURITY Office of the Chief Actuary February 16, 2017 The Honorable Bernie Sanders United States Senate Washington, D.C. 20510 The Honorable Peter DeFazio United States House of Representatives Washington, D.C. 20515 Dear Senator Sanders and Representative DeFazio: I am writing in response to your request for estimates of the financial effects on Social Security of the Social Security Expansion Act, which you introduced today. The estimates provided here reflect the intermediate assumptions of the 2016 Trustees Report. These Bills (hereafter referred to as the proposal) include five provisions with direct effects on the Social Security Trust Funds. We have enjoyed working closely with Jeff Cruz and Rina Wulfing of your staffs in developing this proposal to meet your goals. The enclosed tables provide estimates of the effects of the five provisions on the cost, income, and combined trust fund reserves for the Old Age, Survivors, and Disability Insurance (OASDI) program, as well as estimated effects on retired worker benefit levels for selected hypothetical workers. In addition, tables 1b and 1b.n provide estimates of the Federal budget implications of the five provisions. Assuming enactment of the proposal, we estimate the funding for the combined OASI and DI Trust Funds would be sufficient to extend the projected year of reserve depletion from 2034 to 2078, under the intermediate assumptions of the 2016 Trustees Report. The estimates and analysis provided here reflect the combined effort of many in the Office of the Chief Actuary, but most particularly Karen Glenn, Christopher Chaplain, Daniel Nickerson, Jason Schultz, Kyle Burkhalter, Anna Kirjusina, Katie Sutton, and Tiffany Bosley. The proposal includes five basic provisions with direct effects on the OASDI program. The following list identifies each provision with the corresponding section number in the proposal: Section 2. Increase the first PIA bend point above the current law level for workers who become newly eligible for retirement or disability benefits or die after 2022. Phase in an ultimate 15-percent increase in the first bend point by raising it 1 percent above the current level for workers who becoming newly eligible or dying in 2023, 2 percent for workers
Transcript of SOCIAL SECURITY · Dear Senator Sanders and Representative DeFazio: I am writing in response to...
SOCIAL SECURITY ADMINISTRATION BALTIMORE, MD 21235-0001
SOCIAL SECURITY
Office of the Chief Actuary
February 16, 2017
The Honorable Bernie Sanders United States Senate Washington, D.C. 20510 The Honorable Peter DeFazio United States House of Representatives Washington, D.C. 20515 Dear Senator Sanders and Representative DeFazio: I am writing in response to your request for estimates of the financial effects on Social Security of the Social Security Expansion Act, which you introduced today. The estimates provided here reflect the intermediate assumptions of the 2016 Trustees Report. These Bills (hereafter referred to as the proposal) include five provisions with direct effects on the Social Security Trust Funds. We have enjoyed working closely with Jeff Cruz and Rina Wulfing of your staffs in developing this proposal to meet your goals. The enclosed tables provide estimates of the effects of the five provisions on the cost, income, and combined trust fund reserves for the Old Age, Survivors, and Disability Insurance (OASDI) program, as well as estimated effects on retired worker benefit levels for selected hypothetical workers. In addition, tables 1b and 1b.n provide estimates of the Federal budget implications of the five provisions. Assuming enactment of the proposal, we estimate the funding for the combined OASI and DI Trust Funds would be sufficient to extend the projected year of reserve depletion from 2034 to 2078, under the intermediate assumptions of the 2016 Trustees Report. The estimates and analysis provided here reflect the combined effort of many in the Office of the Chief Actuary, but most particularly Karen Glenn, Christopher Chaplain, Daniel Nickerson, Jason Schultz, Kyle Burkhalter, Anna Kirjusina, Katie Sutton, and Tiffany Bosley. The proposal includes five basic provisions with direct effects on the OASDI program. The following list identifies each provision with the corresponding section number in the proposal:
Section 2. Increase the first PIA bend point above the current law level for workers who become newly eligible for retirement or disability benefits or die after 2022. Phase in an ultimate 15-percent increase in the first bend point by raising it 1 percent above the current level for workers who becoming newly eligible or dying in 2023, 2 percent for workers
Page 2 – The Honorable Bernie Sanders and the Honorable Peter DeFazio
becoming newly eligible or dying in 2024, and so on, until it reaches 15 percent for workers becoming newly eligible or dying in 2037 and later. Section 3. Use the increase in the Consumer Price Index for the Elderly (CPI-E) rather than the increase in the Consumer Price Index for Urban Wage Earners and Clerical Workers (CPI-W) to calculate the cost-of-living adjustment (COLA), effective for December 2019 and later COLAs. We assume this change would increase the COLA by an average of 0.2 percentage point per year. Section 4. Increase the special minimum PIA for workers who become newly eligible for retirement or disability benefits or die in 2018 or later. For workers becoming newly eligible or dying in 2018, the minimum initial PIA for workers with 30 or more years of coverage (YOCs) is 125 percent of the annual poverty guideline for a single individual, as published by the Department of Health and Human Services for 2017, divided by 12. For workers becoming newly eligible or dying after 2018, the minimum initial PIA increases by the growth in the national average wage index (AWI). Sections 5 and 6. Apply the combined OASDI payroll tax rate on earnings above $250,000, effective for 2018 and later. Tax all earnings once the current-law taxable maximum exceeds $250,000. Do not credit the additional taxed earnings for benefit purposes. Section 7. Apply a separate 6.2-percent tax on investment income, as defined in the Affordable Care Act (ACA), with unindexed thresholds as in the ACA, effective for 2018 and later. The ACA thresholds are $200,000 for a single filer and $250,000 for a married couple filing jointly. Under this provision, there is no limit on the amount taxed.
The balance of this letter provides a summary of the effects of the five provisions on the actuarial status of the OASDI program, our understanding of the specifications and intent of each provision, and descriptions of our detailed financial estimates for trust fund operations, benefit levels, and implications for the Federal budget. Summary of Effects of the Proposal on OASDI Actuarial Status Figure 1 below illustrates the estimated change in the combined Old-Age and Survivors Insurance (OASI) and Disability Insurance (DI) Trust Fund reserves, expressed as a percent of annual program cost, assuming enactment of the five provisions of this proposal. Assuming enactment of the proposal, we estimate the year of depletion of the combined OASI and DI Trust Fund reserves would be extended from 2034 under current law to 2078, under the intermediate assumptions of the 2016 Trustees Report.

Page 3 – The Honorable Bernie Sanders and the Honorable Peter DeFazio
Note: Trust Fund Ratio for a given year is the ratio of reserves in the combined OASI and DI Trust Funds at the beginning of the year to the cost of the program for the year. Under current law, 79 percent of scheduled benefits are projected to be payable in 2034 after depletion of the combined trust fund reserves, with the percentage payable declining to 75 percent for 2078 and to 74 percent for 2090. Under the proposal, 89 percent of scheduled benefits are projected to be payable in 2078 after depletion of the combined trust fund reserves, with this percentage declining to 88 percent for 2090. Enactment of the five provisions of this proposal would reduce the long-range OASDI actuarial deficit of 2.66 percent of taxable payroll under current law to 0.41 percent of payroll for the long-range period. Figure 2 illustrates annual projected levels of cost, expenditures, and non-interest income as a percent of the present-law taxable payroll. The projected level of cost reflects the full cost of scheduled benefits under both present law and the proposal. Under the proposal, projected expenditures equal the full cost of scheduled benefits through 2077, the year prior to trust fund reserve depletion.
0
50
100
150
200
250
300
350
400
2016 2020 2030 2040 2050 2060 2070 2080 2090
Trus
t Fun
d Ra
tioFigure 1. Current Law and Proposal OASDI Trust Fund Reserves as
Percent of Annual Cost: 2016 TR Intermediate Assumptions
Current Law Trust Fund Ratio
Proposal
Page 4 – The Honorable Bernie Sanders and the Honorable Peter DeFazio
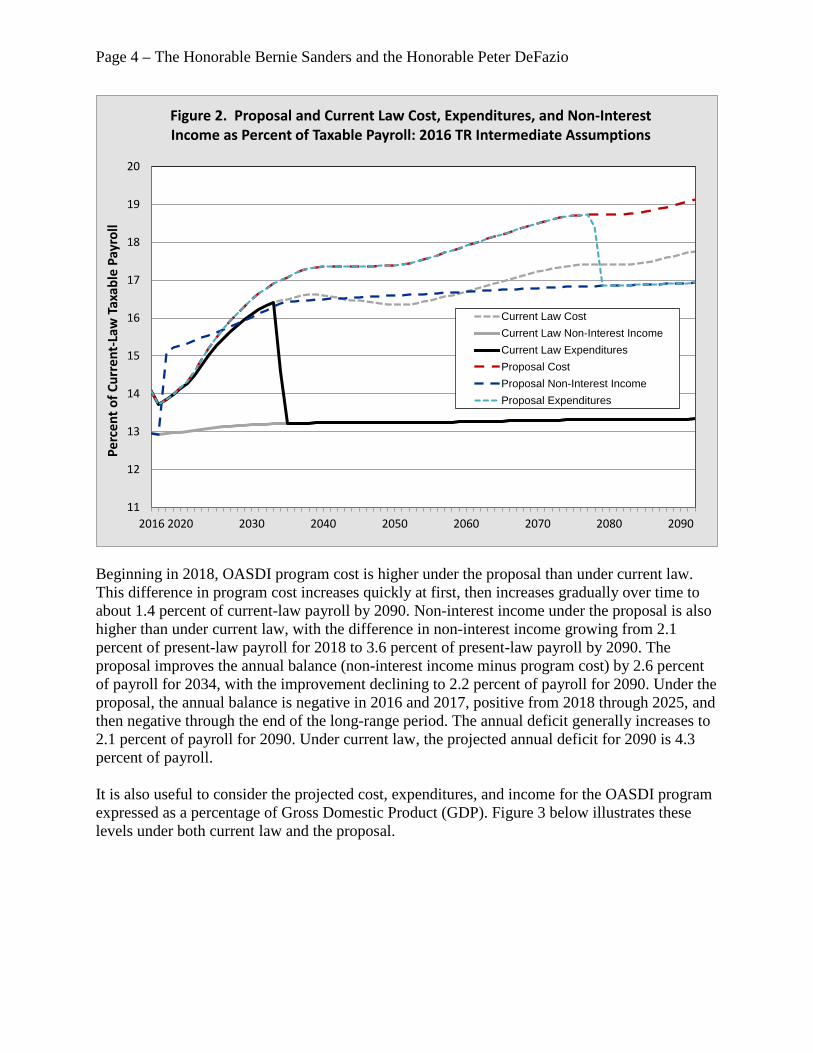
Beginning in 2018, OASDI program cost is higher under the proposal than under current law. This difference in program cost increases quickly at first, then increases gradually over time to about 1.4 percent of current-law payroll by 2090. Non-interest income under the proposal is also higher than under current law, with the difference in non-interest income growing from 2.1 percent of present-law payroll for 2018 to 3.6 percent of present-law payroll by 2090. The proposal improves the annual balance (non-interest income minus program cost) by 2.6 percent of payroll for 2034, with the improvement declining to 2.2 percent of payroll for 2090. Under the proposal, the annual balance is negative in 2016 and 2017, positive from 2018 through 2025, and then negative through the end of the long-range period. The annual deficit generally increases to 2.1 percent of payroll for 2090. Under current law, the projected annual deficit for 2090 is 4.3 percent of payroll. It is also useful to consider the projected cost, expenditures, and income for the OASDI program expressed as a percentage of Gross Domestic Product (GDP). Figure 3 below illustrates these levels under both current law and the proposal.
11
12
13
14
15
16
17
18
19
20
2016 2020 2030 2040 2050 2060 2070 2080 2090
Perc
ent o
f Cur
rent
-Law
Tax
able
Pay
roll
Figure 2. Proposal and Current Law Cost, Expenditures, and Non-Interest Income as Percent of Taxable Payroll: 2016 TR Intermediate Assumptions
Current Law CostCurrent Law Non-Interest IncomeCurrent Law ExpendituresProposal CostProposal Non-Interest IncomeProposal Expenditures

Page 5 – The Honorable Bernie Sanders and the Honorable Peter DeFazio
Specification for Provisions of the Proposal
Section 2. Increase the first PIA bend point above the current law level for workers becoming newly eligible for retirement or disability benefits or dying after 2022.
Under current law, any portion of the AIME that is below the first PIA bend point is multiplied by a factor of 0.90 in computing the PIA. The first bend point is changed (indexed) for each year by the increase or decrease in the AWI from the third prior year to the second prior year. This provision would increase the level of the first PIA bend point, from the level that would apply under current law, by 1 percent for workers becoming newly eligible or dying in 2023, by 2 percent for workers becoming newly eligible or dying in 2024, and so on, until it reaches 15 percent for workers becoming newly eligible or dying in 2037 and all subsequent years. We estimate that enactment of this provision alone would increase the long-range OASDI actuarial deficit by 0.37 percent of taxable payroll and would increase the annual deficit for the 75th projection year (2090) by 0.71 percent of payroll.
Section 3. Use the CPI-E increase rather than the CPI-W increase to calculate the COLA, effective for December 2019 and later COLAs.
4.0
4.5
5.0
5.5
6.0
6.5
7.0
2016 2020 2030 2040 2050 2060 2070 2080 2090
Perc
ent o
f GDP
Figure 3. Proposal and Current Law Cost, Expenditures, and Non-Interest Income as Percent of GDP: 2016 TR Intermediate Assumptions
Current Law CostCurrent Law Non-Interest IncomeCurrent Law ExpendituresProposal CostProposal Non-Interest IncomeProposal Expenditures
Page 6 – The Honorable Bernie Sanders and the Honorable Peter DeFazio
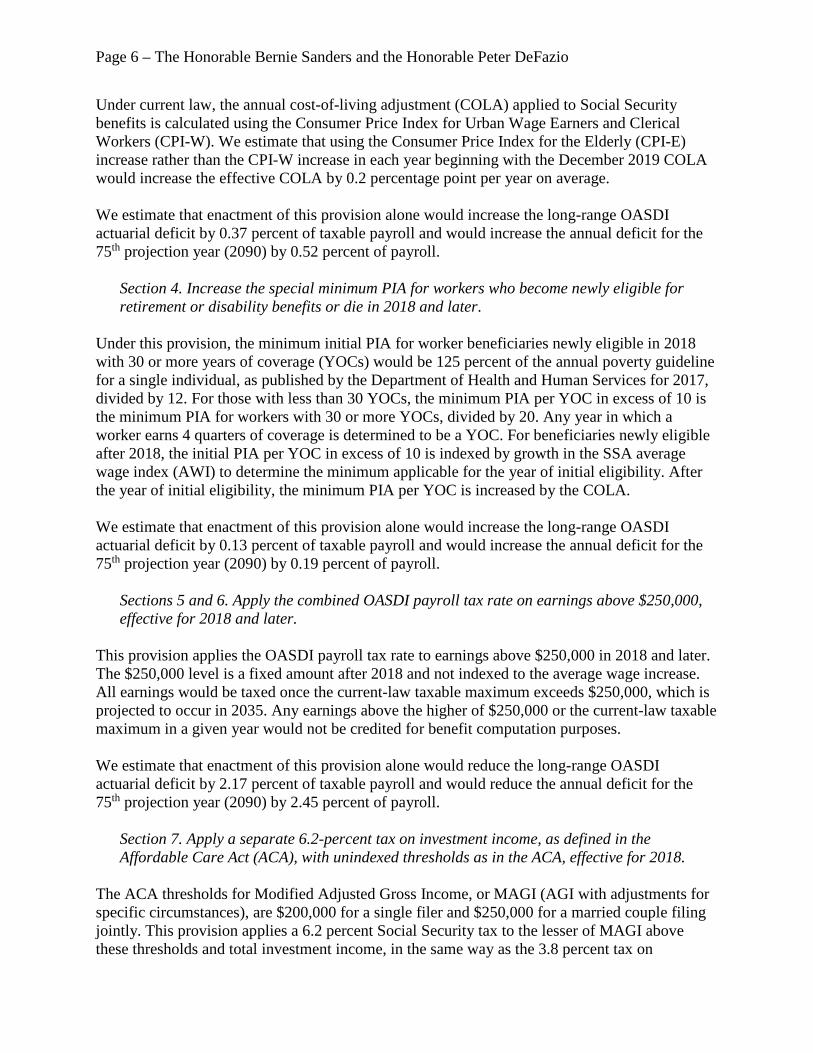
Under current law, the annual cost-of-living adjustment (COLA) applied to Social Security benefits is calculated using the Consumer Price Index for Urban Wage Earners and Clerical Workers (CPI-W). We estimate that using the Consumer Price Index for the Elderly (CPI-E) increase rather than the CPI-W increase in each year beginning with the December 2019 COLA would increase the effective COLA by 0.2 percentage point per year on average. We estimate that enactment of this provision alone would increase the long-range OASDI actuarial deficit by 0.37 percent of taxable payroll and would increase the annual deficit for the 75th projection year (2090) by 0.52 percent of payroll.
Section 4. Increase the special minimum PIA for workers who become newly eligible for retirement or disability benefits or die in 2018 and later.
Under this provision, the minimum initial PIA for worker beneficiaries newly eligible in 2018 with 30 or more years of coverage (YOCs) would be 125 percent of the annual poverty guideline for a single individual, as published by the Department of Health and Human Services for 2017, divided by 12. For those with less than 30 YOCs, the minimum PIA per YOC in excess of 10 is the minimum PIA for workers with 30 or more YOCs, divided by 20. Any year in which a worker earns 4 quarters of coverage is determined to be a YOC. For beneficiaries newly eligible after 2018, the initial PIA per YOC in excess of 10 is indexed by growth in the SSA average wage index (AWI) to determine the minimum applicable for the year of initial eligibility. After the year of initial eligibility, the minimum PIA per YOC is increased by the COLA. We estimate that enactment of this provision alone would increase the long-range OASDI actuarial deficit by 0.13 percent of taxable payroll and would increase the annual deficit for the 75th projection year (2090) by 0.19 percent of payroll.
Sections 5 and 6. Apply the combined OASDI payroll tax rate on earnings above $250,000, effective for 2018 and later.
This provision applies the OASDI payroll tax rate to earnings above $250,000 in 2018 and later. The $250,000 level is a fixed amount after 2018 and not indexed to the average wage increase. All earnings would be taxed once the current-law taxable maximum exceeds $250,000, which is projected to occur in 2035. Any earnings above the higher of $250,000 or the current-law taxable maximum in a given year would not be credited for benefit computation purposes. We estimate that enactment of this provision alone would reduce the long-range OASDI actuarial deficit by 2.17 percent of taxable payroll and would reduce the annual deficit for the 75th projection year (2090) by 2.45 percent of payroll.
Section 7. Apply a separate 6.2-percent tax on investment income, as defined in the Affordable Care Act (ACA), with unindexed thresholds as in the ACA, effective for 2018.
The ACA thresholds for Modified Adjusted Gross Income, or MAGI (AGI with adjustments for specific circumstances), are $200,000 for a single filer and $250,000 for a married couple filing jointly. This provision applies a 6.2 percent Social Security tax to the lesser of MAGI above these thresholds and total investment income, in the same way as the 3.8 percent tax on

Page 7 – The Honorable Bernie Sanders and the Honorable Peter DeFazio
investment income that went into effect in 2013 under the ACA. Under this provision, there is no limit on the amount taxed. We estimate that enactment of this provision alone would reduce the long-range OASDI actuarial deficit by 0.93 percent of taxable payroll and would reduce the annual deficit for the 75th projection year (2090) by 1.15 percent of payroll. Detailed Financial Results for the Provisions of the Proposal Summary Results by Provision
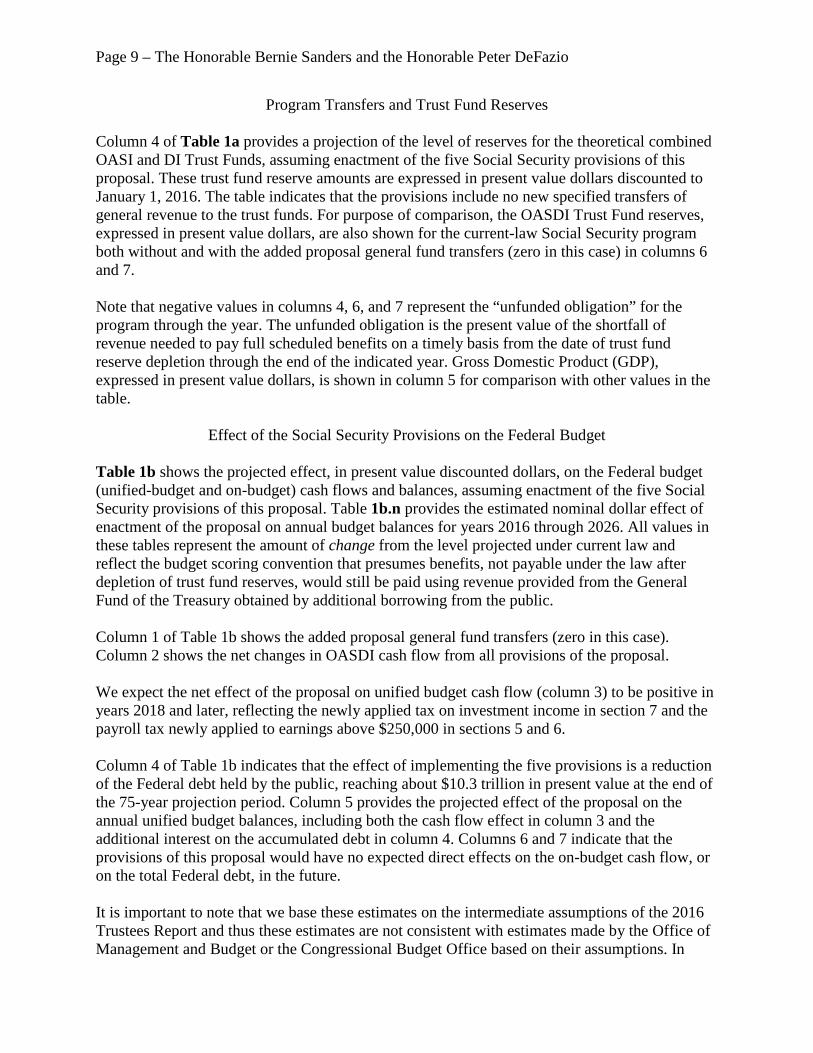
Table A provides estimates of the effects on the OASDI long-range actuarial balance for each of the five provisions of the proposal separately and on a combined basis. The table also includes estimates of the effect of each provision on the annual balance (the difference between income rate and the cost rate, expressed as a percent of present-law taxable payroll) for the 75th projection year, 2090. Interaction among individual provisions is reflected only in the total estimates for the combined provisions. Benefit Illustrations Tables B1 and B2 provide illustrative examples of the projected change in benefit levels under the three provisions that affect benefit levels for beneficiaries retiring at age 65 in future years at five selected earnings levels, with selected numbers of years of work. The “Maximum-AIME Steady Earner” is assumed to have earnings at ages 22 through 64 that equal the present-law taxable maximum level (equivalent to $118,500 for 2016). As a result, the provision to increase the taxable maximum does not affect benefit levels illustrated in these tables. Table B3 provides additional important information on characteristics of the illustrative retiring workers. Table B1 compares the initial benefit levels, assuming retirement at age 65 under the provisions of the proposal, to both scheduled and payable present-law benefit levels. All benefit amounts under the proposal are higher than those scheduled in current law, especially for the very low and low hypothetical earners with at least 30 years of earnings (due largely to the minimum benefit provision). The final two columns of this table show the level of scheduled benefits under the proposal as a percentage of present-law scheduled and present-law payable benefits, respectively. Table B2 compares the change in scheduled benefit levels at ages 65, 75, 85, and 95 under the proposal to scheduled benefits under present law, assuming retirement at age 65. Table B2 shows that projected scheduled benefits under the provisions of this proposal increase in relation to present-law scheduled benefits between ages 65 and 95, because of the change in computing the COLA. The hypothetical workers represented in these tables reflect average career-earnings patterns of workers who started receiving retirement benefits under the Social Security program in recent years. The tables subdivide workers with very low and low career-average earnings levels by their numbers of years of non-zero earnings.

Page 8 – The Honorable Bernie Sanders and the Honorable Peter DeFazio
Table B3 provides information helpful in interpreting the benefit illustrations in tables B1 and B2. Percentages in Table B3 are based on tabulations from a 10-percent sample of newly-entitled retired workers in 2007. Table B3 displays the percentages of these newly-entitled retired workers in 2007 that are closest to each of the illustrative examples and are:
1) “Dually Entitled”, meaning they received a higher spouse or widow(er) benefit based on the career earnings of their husband or wife,
2) “WEP” (Windfall Elimination Provision), meaning that they received a reduced benefit due to having a pension based on earnings that were not covered under the OASDI program (primarily certain government workers), and they had less than 30 years of substantial earnings that were taxable under the OASDI program,
3) “Foreign Born”, meaning that they entered the Social Security coverage area after birth (and generally after entering working ages), and
4) “All Others”, meaning they had none of the three characteristics listed above. The extent to which retired-worker beneficiaries represented by each of the illustrative examples has any of the characteristics listed above (dually entitled, WEP, foreign born) is important because such individuals are less dependent on the OASDI benefit that relates to their own career-average earnings level. Payroll Tax Effects Under the proposal, workers with covered earnings in excess of the higher of $250,000 and the current-law taxable maximum would, along with their employers, pay additional payroll taxes. Detailed Tables Containing Annual and Summary Projections Enclosed with this letter are tables 1, 1a, 1b, 1b.n, 1c, and 1d, which provide annual and summary projections for the proposal.
Trust Fund Operations
Table 1 provides projections of the financial operations of the OASDI program under the proposal and shows that the year of reserve depletion for the combined OASDI Trust Funds would be extended by 44 years, from 2034 under current law to 2078. The table shows the annual cost and income rates, annual balances, and trust fund ratios (reserves as percent of annual program cost) for OASDI, as well as the change from present law in these cost rates, income rates, and annual balances. Included at the bottom of this table are summarized rates for the 75-year (long-range) period. The actuarial balance for the OASDI program over the 75-year projection period is improved by 2.25 percent of taxable payroll, from an actuarial deficit of 2.66 percent of payroll under current law to an actuarial deficit of 0.41 percent of taxable payroll.
Page 9 – The Honorable Bernie Sanders and the Honorable Peter DeFazio
Program Transfers and Trust Fund Reserves Column 4 of Table 1a provides a projection of the level of reserves for the theoretical combined OASI and DI Trust Funds, assuming enactment of the five Social Security provisions of this proposal. These trust fund reserve amounts are expressed in present value dollars discounted to January 1, 2016. The table indicates that the provisions include no new specified transfers of general revenue to the trust funds. For purpose of comparison, the OASDI Trust Fund reserves, expressed in present value dollars, are also shown for the current-law Social Security program both without and with the added proposal general fund transfers (zero in this case) in columns 6 and 7. Note that negative values in columns 4, 6, and 7 represent the “unfunded obligation” for the program through the year. The unfunded obligation is the present value of the shortfall of revenue needed to pay full scheduled benefits on a timely basis from the date of trust fund reserve depletion through the end of the indicated year. Gross Domestic Product (GDP), expressed in present value dollars, is shown in column 5 for comparison with other values in the table.
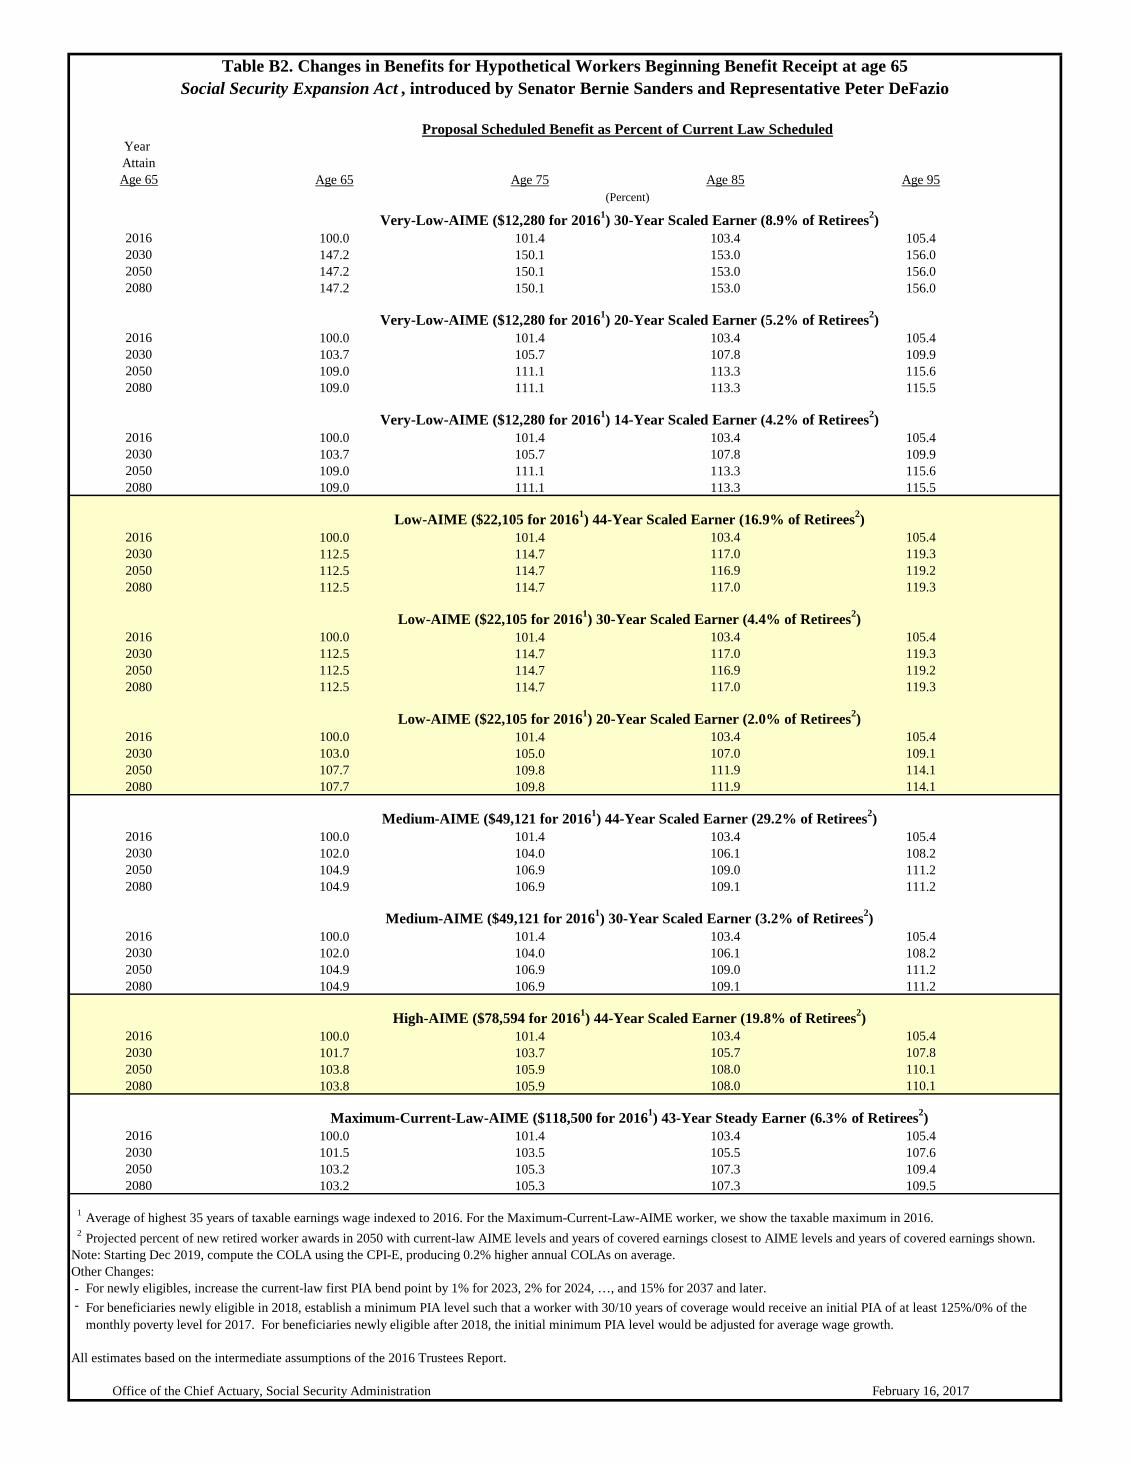
Effect of the Social Security Provisions on the Federal Budget Table 1b shows the projected effect, in present value discounted dollars, on the Federal budget (unified-budget and on-budget) cash flows and balances, assuming enactment of the five Social Security provisions of this proposal. Table 1b.n provides the estimated nominal dollar effect of enactment of the proposal on annual budget balances for years 2016 through 2026. All values in these tables represent the amount of change from the level projected under current law and reflect the budget scoring convention that presumes benefits, not payable under the law after depletion of trust fund reserves, would still be paid using revenue provided from the General Fund of the Treasury obtained by additional borrowing from the public. Column 1 of Table 1b shows the added proposal general fund transfers (zero in this case). Column 2 shows the net changes in OASDI cash flow from all provisions of the proposal. We expect the net effect of the proposal on unified budget cash flow (column 3) to be positive in years 2018 and later, reflecting the newly applied tax on investment income in section 7 and the payroll tax newly applied to earnings above $250,000 in sections 5 and 6. Column 4 of Table 1b indicates that the effect of implementing the five provisions is a reduction of the Federal debt held by the public, reaching about $10.3 trillion in present value at the end of the 75-year projection period. Column 5 provides the projected effect of the proposal on the annual unified budget balances, including both the cash flow effect in column 3 and the additional interest on the accumulated debt in column 4. Columns 6 and 7 indicate that the provisions of this proposal would have no expected direct effects on the on-budget cash flow, or on the total Federal debt, in the future. It is important to note that we base these estimates on the intermediate assumptions of the 2016 Trustees Report and thus these estimates are not consistent with estimates made by the Office of Management and Budget or the Congressional Budget Office based on their assumptions. In

Page 10 – The Honorable Bernie Sanders and the Honorable Peter DeFazio
particular, all present values are discounted using trust fund yield assumptions under the intermediate assumptions of the 2016 Trustees Report.
Annual Trust Fund Operations as a Percent of GDP Table 1c provides annual cost, annual expenditures (amount that would be payable), and annual tax income for the OASDI program expressed as a percentage of GDP for both present law and assuming enactment of the five Social Security provisions of the proposal. Showing the annual trust fund cash flows as a percent of GDP provides an additional perspective on these trust fund operations in relation to the total value of goods and services produced in the United States. The relationship between income and cost is similar when expressed as a percent of GDP to that when expressed as a percent of taxable payroll (Table 1).
Effects on Trust Fund Reserves and Unfunded Obligations Table 1d provides estimates of the changes in trust fund reserves. Values in this table are expressed in present value dollars discounted to January 1, 2016. For the 75-year (long-range) period as a whole, the present-law unfunded obligation of $11.4 trillion is reduced to $1.0 trillion in present value. This change of $10.3 trillion results from:
• A $14.1 trillion increase in revenue (column 2), primarily from additional tax revenue, minus
• A $3.8 trillion increase in cost (column 3), primarily from the special minimum PIA provision, calculating the COLA using the CPI-E rather than the CPI-W, and increasing current and future benefits by increasing the first PIA bend point by 15 percent ultimately.
We hope these estimates are helpful. Please let me know if we may provide further assistance.
Sincerely,
Stephen C. Goss Chief Actuary Enclosures

Table A--Estimated Long-Range OASDI Financial Effects of the “Social Security Expansion Act”, Introduced by Senator Sanders and Rep. DeFazio
Provision
Estimated Change in Long-Range OASDI Actuarial Balance 1
(as a percent of payroll)
Estimated Change in Annual Balance
for 75th year 2 (as a percent of payroll)
Section 2) Increase the first PIA bend point above the current law level for workers becomingly newly eligible for retirement or disability benefits or dying after 2022. Phase in an ultimate 15-percent increase in the first bend point by raising it 1 percent above the current level for workers becoming newly eligible or dying in 2023, 2 percent for workers becoming newly eligible or dying in 2024, and so on, until it reaches 15 percent for workers becoming newly eligible or dying in 2037 and later ........................................................................................
-0.37 -0.71 Section 3) Use the increase in the Consumer Price Index for the Elderly (CPI-E) rather than the increase in the Consumer Price Index for Urban Wage Earners and Clerical Workers (CPI-W) to calculate the cost-of-living adjustment (COLA), effective for December 2019 and later COLAs. We estimate this new computation would increase the effective COLA by about 0.2 percentage point, on average ........................................
-0.37
-0.52 Section 4) Beginning in 2018, reconfigure the special minimum PIA for workers becoming newly eligible or dying after 2017: (a) A year of coverage (YOC) is defined as a year in which 4 quarters of coverage are earned. (b) For workers becoming newly eligible or dying in 2018 with 30 or more YOCs, set the minimum PIA equal to 125 percent of the 2017 Department of Health and Human Services (HHS) monthly poverty level. For those with under 30 YOCs, the PIA per YOC in excess of 10 YOCs is 125 percent of the HHS monthly poverty level for 2017, divided by 20. (c) For workers becoming newly eligible or dying after 2018, index the initial PIA per YOC by growth in the national average wage index (AWI). The 30 and 10 YOC levels apply for all workers, including those who die or become disabled under age 62 ............................................................................................
-0.13
-0.19
Sections 5 and 6) Apply the combined OASDI payroll tax rate on earnings above $250,000 starting in 2018. Tax all earnings once the current-law taxable maximum exceeds $250,000. Do not provide benefit credit for additional earnings taxed ...............
2.17 2.45 Section 7) Apply a separate 6.2 percent tax on investment income as defined in the Affordable Care Act (ACA), with unindexed thresholds as in the ACA ($200,000 single filer, $250,000 for married filing joint), starting in 2018. Proceeds go to the OASDI Trust Funds .......................................................
0.93 1.15

Table A--Estimated Long-Range OASDI Financial Effects of the “Social Security Expansion Act”, Introduced by Senator Sanders and Rep. DeFazio
Provision
Estimated Change in Long-Range OASDI Actuarial Balance 1
(as a percent of payroll)
Estimated Change in Annual Balance
for 75th year 2 (as a percent of payroll)
Total for all provisions, including interaction ..........................
2.25 2.23
1Under current law, the estimated long-range OASDI actuarial balance is -2.66 percent of taxable payroll. 2Under current law, the estimated 75th year annual balance is -4.35 percent of taxable payroll. Notes: All estimates are based on the intermediate assumptions of the 2016 OASDI Trustees Report. Estimates of individual provisions appear on a stand-alone basis relative to current law, unless otherwise stated.
Social Security Administration Office of the Chief Actuary
February 16, 2017

Year Attain Increased Benefit Minimum
Age 65 (Wage-Indexed (CPI-Indexed COLA4 Formula5 Benefit6 Total Scheduled Payable2015 Dollars) 2015 Dollars)
2016 718 718 0.0 0.0 0.0 0.0 100 1002030 660 812 0.6 3.1 41.9 47.2 147 1472050 661 1,036 0.6 8.4 35.0 47.2 147 1842080 665 1,469 0.6 8.4 35.0 47.2 147 -
2016 718 718 0.0 0.0 0.0 0.0 100 1002030 660 812 0.6 3.1 0.0 3.7 104 1042050 661 1,036 0.6 8.4 0.0 9.0 109 1372080 665 1,469 0.6 8.4 0.0 9.0 109 -
2016 718 718 0.0 0.0 0.0 0.0 100 1002030 660 812 0.6 3.1 0.0 3.7 104 1042050 661 1,036 0.6 8.4 0.0 9.0 109 1372080 665 1,469 0.6 8.4 0.0 9.0 109 -
2016 940 940 0.0 0.0 0.0 0.0 100 1002030 863 1,062 0.6 2.4 9.3 12.5 112 1122050 865 1,356 0.6 7.0 4.5 12.5 112 1412080 869 1,921 0.6 7.0 4.5 12.5 112 -
2016 940 940 0.0 0.0 0.0 0.0 100 1002030 863 1,062 0.6 2.4 9.3 12.5 112 1122050 865 1,356 0.6 7.0 4.5 12.5 112 1412080 869 1,921 0.6 7.0 4.5 12.5 112 -
2016 940 940 0.0 0.0 0.0 0.0 100 1002030 863 1,062 0.6 2.4 0.0 3.0 103 1032050 865 1,356 0.6 7.0 0.0 7.7 108 1352080 869 1,921 0.6 7.0 0.0 7.7 108 -
2016 1,548 1,548 0.0 0.0 0.0 0.0 100 1002030 1,423 1,750 0.6 1.4 0.0 2.0 102 1022050 1,425 2,234 0.6 4.3 0.0 4.9 105 1312080 1,433 3,166 0.6 4.3 0.0 4.9 105 -
2016 1,548 1,548 0.0 0.0 0.0 0.0 100 1002030 1,423 1,750 0.6 1.4 0.0 2.0 102 1022050 1,425 2,234 0.6 4.3 0.0 4.9 105 1312080 1,433 3,166 0.6 4.3 0.0 4.9 105 -
2016 2,053 2,053 0.0 0.0 0.0 0.0 100 1002030 1,885 2,319 0.6 1.1 0.0 1.7 102 1022050 1,888 2,960 0.6 3.2 0.0 3.8 104 1302080 1,899 4,195 0.6 3.2 0.0 3.8 104 -
2016 2,492 2,492 0.0 0.0 0.0 0.0 100 1002030 2,308 2,839 0.6 0.9 0.0 1.5 101 1012050 2,309 3,622 0.6 2.6 0.0 3.2 103 1292080 2,317 5,119 0.6 2.6 0.0 3.2 103 -
1
2 Projected percent of new retired worker awards in 2050 with current-law AIME levels and years of covered earnings closest to AIME levels and years of covered earnings shown.3 After the trust fund reserves deplete under current law continuing taxes are expected to be enough to pay about three fourths of scheduled benefits.4
5
6
All estimates based on the intermediate assumptions of the 2016 Trustees Report.
Office of the Chief Actuary, Social Security Administration February 16, 2017
Maximum-Current-Law-AIME ($118,500 for 20161) 43-Year Steady Earner (6.3% of Retirees2)
Average of highest 35 years of taxable earnings wage indexed to 2016. For the Maximum-Current-Law-AIME worker, we show the taxable maximum in 2016.
Starting Dec 2019, compute the COLA using the CPI-E, producing 0.2% higher annual COLAs on average.For newly eligibles, increase the current-law first PIA bend point by 1% for 2023, 2% for 2024, …, and 15% for 2037 and later.For beneficiaries newly eligible in 2018, establish a minimum PIA level such that a worker with 30/10 years of coverage would receive an initial PIA of at least 125%/0% of the monthly poverty level for 2017. For beneficiaries newly eligible after 2018, the initial minimum PIA level would be adjusted for average wage growth. The Minimum Benefit Percent change is calculated after all other provisions, so that the Proposed Benefit Amount is at least the Minimum Benefit, where applicable.
High-AIME ($78,594 for 20161) 44-Year Scaled Earner (19.8% of Retirees2)
(Percent change) (Percents)
Very-Low-AIME ($12,280 for 20161) 30-Year Scaled Earner (8.9% of Retirees2)
Very-Low-AIME ($12,280 for 20161) 20-Year Scaled Earner (5.2% of Retirees2)
Very-Low-AIME ($12,280 for 20161) 14-Year Scaled Earner (4.2% of Retirees2)
Low-AIME ($22,105 for 20161) 44-Year Scaled Earner (16.9% of Retirees2)
Low-AIME ($22,105 for 20161) 30-Year Scaled Earner (4.4% of Retirees2)
Low-AIME ($22,105 for 20161) 20-Year Scaled Earner (2.0% of Retirees2)
Medium-AIME ($49,121 for 20161) 44-Year Scaled Earner (29.2% of Retirees2)
Medium-AIME ($49,121 for 20161) 30-Year Scaled Earner (3.2% of Retirees2)
Monthly Benefits3 Percent of Current Law:
Table B1. Changes in Benefits for Hypothetical Workers Beginning Benefit Receipt at age 65 Social Security Expansion Act , introduced by Senator Bernie Sanders and Representative Peter DeFazio
Scheduled Benefit Level Percent Change at age 65Current Law Scheduled Proposal Scheduled Benefit
Year AttainAge 65 Age 65 Age 75 Age 85 Age 95
2016 100.0 101.4 103.4 105.42030 147.2 150.1 153.0 156.02050 147.2 150.1 153.0 156.02080 147.2 150.1 153.0 156.0
2016 100.0 101.4 103.4 105.42030 103.7 105.7 107.8 109.92050 109.0 111.1 113.3 115.62080 109.0 111.1 113.3 115.5
2016 100.0 101.4 103.4 105.42030 103.7 105.7 107.8 109.92050 109.0 111.1 113.3 115.62080 109.0 111.1 113.3 115.5
2016 100.0 101.4 103.4 105.42030 112.5 114.7 117.0 119.32050 112.5 114.7 116.9 119.22080 112.5 114.7 117.0 119.3
2016 100.0 101.4 103.4 105.42030 112.5 114.7 117.0 119.32050 112.5 114.7 116.9 119.22080 112.5 114.7 117.0 119.3
2016 100.0 101.4 103.4 105.42030 103.0 105.0 107.0 109.12050 107.7 109.8 111.9 114.12080 107.7 109.8 111.9 114.1
2016 100.0 101.4 103.4 105.42030 102.0 104.0 106.1 108.22050 104.9 106.9 109.0 111.22080 104.9 106.9 109.1 111.2
2016 100.0 101.4 103.4 105.42030 102.0 104.0 106.1 108.22050 104.9 106.9 109.0 111.22080 104.9 106.9 109.1 111.2
2016 100.0 101.4 103.4 105.42030 101.7 103.7 105.7 107.82050 103.8 105.9 108.0 110.12080 103.8 105.9 108.0 110.1
2016 100.0 101.4 103.4 105.42030 101.5 103.5 105.5 107.62050 103.2 105.3 107.3 109.42080 103.2 105.3 107.3 109.5
1
2 Projected percent of new retired worker awards in 2050 with current-law AIME levels and years of covered earnings closest to AIME levels and years of covered earnings shown.Note: Starting Dec 2019, compute the COLA using the CPI-E, producing 0.2% higher annual COLAs on average.Other Changes: --
All estimates based on the intermediate assumptions of the 2016 Trustees Report.
Office of the Chief Actuary, Social Security Administration February 16, 2017
Very-Low-AIME ($12,280 for 20161) 14-Year Scaled Earner (4.2% of Retirees2)
Low-AIME ($22,105 for 20161) 44-Year Scaled Earner (16.9% of Retirees2)
Low-AIME ($22,105 for 20161) 30-Year Scaled Earner (4.4% of Retirees2)
Low-AIME ($22,105 for 20161) 20-Year Scaled Earner (2.0% of Retirees2)
Medium-AIME ($49,121 for 20161) 44-Year Scaled Earner (29.2% of Retirees2)
Medium-AIME ($49,121 for 20161) 30-Year Scaled Earner (3.2% of Retirees2)
High-AIME ($78,594 for 20161) 44-Year Scaled Earner (19.8% of Retirees2)
Maximum-Current-Law-AIME ($118,500 for 20161) 43-Year Steady Earner (6.3% of Retirees2)
Average of highest 35 years of taxable earnings wage indexed to 2016. For the Maximum-Current-Law-AIME worker, we show the taxable maximum in 2016.
For newly eligibles, increase the current-law first PIA bend point by 1% for 2023, 2% for 2024, …, and 15% for 2037 and later.For beneficiaries newly eligible in 2018, establish a minimum PIA level such that a worker with 30/10 years of coverage would receive an initial PIA of at least 125%/0% of the monthly poverty level for 2017. For beneficiaries newly eligible after 2018, the initial minimum PIA level would be adjusted for average wage growth.
Very-Low-AIME ($12,280 for 20161) 20-Year Scaled Earner (5.2% of Retirees2)
Table B2. Changes in Benefits for Hypothetical Workers Beginning Benefit Receipt at age 65 Social Security Expansion Act , introduced by Senator Bernie Sanders and Representative Peter DeFazio
Proposal Scheduled Benefit as Percent of Current Law Scheduled
(Percent)
Very-Low-AIME ($12,280 for 20161) 30-Year Scaled Earner (8.9% of Retirees2)

Category Dually Entitled2 WEP3 Foreign Born All Others4
Very-Low-AIME ($12,280 for 20161):
30-Year Scaled Earner (9.3% of Retirees) 47 6 11 40
20-Year Scaled Earner (5.8% of Retirees) 38 16 21 31
14-Year Scaled Earner (5.3% of Retirees) 22 21 45 20
Low-AIME ($22,105 for 20161):
44-Year Scaled Earner (13.1% of Retirees) 15 2 6 78
30-Year Scaled Earner (5.9% of Retirees) 16 9 18 59
20-Year Scaled Earner (3.1% of Retirees) 10 23 35 37
Medium-AIME ($49,121 for 20161):
44-Year Scaled Earner (23.0% of Retirees) 1 1 5 93
30-Year Scaled Earner (4.4% of Retirees) 1 8 26 67
High-AIME ($78,594 for 20161):
44-Year Scaled Earner (20.5% of Retirees) 0 0 6 93
Maximum-Current-Law-AIME ($118,500 for 20161):
Steady Earner (9.4% of Retirees) 0 0 7 93
1
2
3 Covered by pension from government employment and are subject to the windfall elimination provision (WEP).4 Neither foreign born, subject to WEP, or dually entitled.
June 22, 2016
Note 3: The sum of the percentages for each category (sum across rows) could be greater than 100 percent because some beneficiaries can be classified in more than one of the following groups: dually entitled, WEP, and foreign born.
Average of highest 35 years of taxable earnings wage indexed to 2016. For the Maximum-Current-Law-AIME worker, we show the taxable maximum in 2016.Under current law, entitled to an additional benefit based on someone else's account. The dually entitled percent is a minimum value. Some beneficiaries that are not currently dually entitled could become dually entitled in the future.
Office of the Chief Actuary, Social Security Administration
Table B3. Important Characteristics of Hypothetical Workers in 2007
Percent of Beneficiaries Within Each Category That Are:
Note 1:Table B3 displays the percentages of these newly-entitled retired workers in 2007 that are closest to each of the illustrative examples.Note 2: Percents based on tabulations of a 10-percent sample of newly entitled retired-worker beneficiaries in 2007 (169,725 records). We can be 95 percent confident that each of the values shown above is within 1.4 percentage points of the value we would find using 100 percent of the retirees in 2007.

Table 1 - OASDI Cost Rate, Income Rate, Annual Balance, and Trust Fund RatioSocial Security Expansion Act, introduced by Senator Bernie Sanders and Representative Peter DeFazio
Year Cost RateIncome
RateAnnual
Balance Cost RateIncome
RateAnnual
Balance2016 14.05 12.94 -1.10 303 0.00 0.00 0.002017 13.72 12.92 -0.80 293 0.00 0.00 0.002018 13.86 15.08 1.22 277 0.00 2.12 2.122019 13.99 15.21 1.22 276 0.00 2.24 2.242020 14.17 15.27 1.10 275 0.03 2.29 2.252021 14.34 15.34 1.00 274 0.07 2.33 2.272022 14.59 15.41 0.82 272 0.10 2.38 2.282023 14.89 15.47 0.58 268 0.13 2.42 2.282024 15.19 15.55 0.36 264 0.17 2.46 2.292025 15.49 15.61 0.12 258 0.21 2.50 2.292026 15.71 15.69 -0.02 254 0.24 2.56 2.322027 15.92 15.77 -0.15 250 0.28 2.63 2.352028 16.13 15.85 -0.27 246 0.31 2.70 2.392029 16.32 15.94 -0.38 243 0.35 2.77 2.422030 16.49 16.02 -0.46 240 0.39 2.84 2.462031 16.64 16.11 -0.53 238 0.42 2.92 2.502032 16.79 16.20 -0.59 235 0.46 3.00 2.542033 16.91 16.29 -0.61 233 0.50 3.09 2.592034 17.00 16.39 -0.62 230 0.54 3.17 2.642035 17.07 16.42 -0.65 228 0.57 3.21 2.632036 17.17 16.44 -0.73 226 0.61 3.22 2.612037 17.25 16.46 -0.79 223 0.65 3.23 2.582038 17.30 16.47 -0.83 220 0.69 3.24 2.552039 17.34 16.49 -0.85 217 0.73 3.26 2.532040 17.35 16.50 -0.86 214 0.76 3.27 2.502041 17.36 16.51 -0.85 212 0.80 3.28 2.482042 17.36 16.52 -0.84 209 0.83 3.29 2.462043 17.36 16.53 -0.83 206 0.86 3.30 2.442044 17.36 16.54 -0.82 203 0.89 3.31 2.422045 17.37 16.55 -0.82 201 0.92 3.32 2.402046 17.37 16.56 -0.81 198 0.94 3.33 2.382047 17.37 16.57 -0.81 195 0.97 3.34 2.372048 17.38 16.58 -0.80 193 0.99 3.34 2.352049 17.39 16.58 -0.80 190 1.02 3.35 2.342050 17.40 16.59 -0.80 187 1.04 3.36 2.322051 17.42 16.60 -0.81 185 1.06 3.37 2.312052 17.45 16.61 -0.84 182 1.08 3.38 2.302053 17.49 16.62 -0.87 178 1.10 3.38 2.292054 17.54 16.63 -0.91 175 1.11 3.39 2.282055 17.59 16.64 -0.95 171 1.13 3.40 2.272056 17.65 16.65 -1.00 167 1.15 3.41 2.262057 17.72 16.66 -1.05 163 1.16 3.41 2.252058 17.78 16.67 -1.11 158 1.18 3.42 2.252059 17.85 16.69 -1.16 153 1.19 3.43 2.242060 17.91 16.70 -1.21 148 1.20 3.43 2.232061 17.97 16.71 -1.26 143 1.21 3.44 2.232062 18.03 16.72 -1.32 137 1.22 3.45 2.222063 18.09 16.73 -1.36 131 1.23 3.45 2.222064 18.15 16.74 -1.41 125 1.24 3.46 2.222065 18.21 16.74 -1.46 118 1.25 3.47 2.212066 18.27 16.75 -1.51 111 1.26 3.47 2.212067 18.33 16.76 -1.57 104 1.27 3.48 2.212068 18.39 16.77 -1.62 97 1.28 3.48 2.212069 18.45 16.78 -1.67 89 1.28 3.49 2.212070 18.51 16.79 -1.72 81 1.29 3.49 2.202071 18.56 16.80 -1.76 72 1.30 3.50 2.202072 18.60 16.81 -1.80 64 1.30 3.50 2.202073 18.65 16.81 -1.83 55 1.31 3.51 2.202074 18.68 16.82 -1.86 46 1.31 3.51 2.202075 18.71 16.83 -1.88 37 1.31 3.52 2.212076 18.72 16.84 -1.89 27 1.32 3.52 2.212077 18.73 16.84 -1.89 18 1.32 3.53 2.212078 18.73 16.85 -1.88 8 1.32 3.53 2.212079 18.73 16.85 -1.88 ---- 1.32 3.54 2.222080 18.73 16.85 -1.87 ---- 1.32 3.54 2.222081 18.73 16.86 -1.87 ---- 1.33 3.55 2.222082 18.73 16.86 -1.87 ---- 1.33 3.55 2.222083 18.75 16.87 -1.88 ---- 1.33 3.56 2.232084 18.77 16.87 -1.90 ---- 1.33 3.56 2.232085 18.80 16.88 -1.92 ---- 1.33 3.57 2.232086 18.84 16.89 -1.95 ---- 1.34 3.57 2.232087 18.88 16.89 -1.99 ---- 1.34 3.57 2.232088 18.93 16.90 -2.03 ---- 1.34 3.58 2.232089 18.98 16.91 -2.07 ---- 1.35 3.58 2.232090 19.03 16.91 -2.11 ---- 1.35 3.59 2.232091 19.08 16.92 -2.16 ---- 1.36 3.59 2.23
Summarized Rates: OASDI Summarized Rates: OASDI
Cost Rate Income RateActuarial Balance
Change in Cost rate
Change in Income Rate
Change in ActuarialBalance
2016 - 2090 17.35% 16.94% -0.41% 2078 0.84% 3.09% 2.25%
Based on Intermediate Assumptions of the 2016 Trustees Report. Social Security Administration1Under present law the year of combined Trust Fund reserve depletion is 2034.
Year of reserve depletion1
Office of the Chief Actuary
February 16, 2017
Proposal Change from Current LawExpressed as a percentage of current-law
taxable payroll Trust FundRatio
1-1-year
Expressed as a percentage of current-lawtaxable payroll

Table 1a - General Fund Transfers, OASDI Trust Fund Reserves, and Theoretical OASDI ReservesSocial Security Expansion Act, introduced by Senator Bernie Sanders and Representative Peter DeFazio
Percentageof Payroll
AnnualAmounts
Accumulated as of End of Year
Gross Domestic Product
Without GeneralFund Transfers
With Plan GeneralFund Transfers
(1) (2) (3) (4) (5) (6) (7)2016 0.0 0.0 0.0 2,741.0 18,368.5 2,741.0 2,741.02017 0.0 0.0 0.0 2,687.5 18,780.3 2,687.5 2,687.52018 0.0 0.0 0.0 2,772.4 19,199.4 2,625.9 2,625.92019 0.0 0.0 0.0 2,859.3 19,590.0 2,554.4 2,554.42020 0.0 0.0 0.0 2,939.5 19,948.3 2,471.7 2,471.72021 0.0 0.0 0.0 3,013.9 20,275.2 2,378.9 2,378.92022 0.0 0.0 0.0 3,076.1 20,546.2 2,270.6 2,270.62023 0.0 0.0 0.0 3,121.0 20,765.2 2,142.4 2,142.42024 0.0 0.0 0.0 3,149.3 20,965.2 1,994.9 1,994.92025 0.0 0.0 0.0 3,159.5 21,141.0 1,827.2 1,827.22026 0.0 0.0 0.0 3,158.9 21,283.5 1,645.4 1,645.42027 0.0 0.0 0.0 3,148.1 21,355.9 1,450.6 1,450.62028 0.0 0.0 0.0 3,128.2 21,346.6 1,244.3 1,244.32029 0.0 0.0 0.0 3,100.4 21,259.6 1,028.4 1,028.42030 0.0 0.0 0.0 3,066.2 21,099.1 804.8 804.82031 0.0 0.0 0.0 3,027.1 20,898.2 575.3 575.32032 0.0 0.0 0.0 2,984.4 20,696.5 341.0 341.02033 0.0 0.0 0.0 2,940.1 20,500.4 103.7 103.72034 0.0 0.0 0.0 2,896.2 20,306.0 -134.7 -134.72035 0.0 0.0 0.0 2,850.5 20,116.5 -372.8 -372.82036 0.0 0.0 0.0 2,799.5 19,925.6 -612.3 -612.32037 0.0 0.0 0.0 2,744.3 19,743.3 -852.1 -852.12038 0.0 0.0 0.0 2,686.9 19,571.8 -1,090.4 -1,090.42039 0.0 0.0 0.0 2,628.8 19,401.7 -1,326.1 -1,326.12040 0.0 0.0 0.0 2,570.8 19,234.9 -1,558.1 -1,558.12041 0.0 0.0 0.0 2,513.7 19,071.7 -1,786.1 -1,786.12042 0.0 0.0 0.0 2,457.6 18,908.8 -2,010.0 -2,010.02043 0.0 0.0 0.0 2,402.8 18,751.3 -2,229.8 -2,229.82044 0.0 0.0 0.0 2,349.3 18,594.5 -2,445.4 -2,445.42045 0.0 0.0 0.0 2,296.3 18,429.9 -2,657.8 -2,657.82046 0.0 0.0 0.0 2,244.1 18,269.6 -2,866.7 -2,866.72047 0.0 0.0 0.0 2,193.0 18,107.9 -3,072.2 -3,072.22048 0.0 0.0 0.0 2,142.5 17,944.3 -3,274.5 -3,274.52049 0.0 0.0 0.0 2,092.6 17,781.3 -3,473.9 -3,473.92050 0.0 0.0 0.0 2,043.2 17,618.6 -3,670.6 -3,670.62051 0.0 0.0 0.0 1,993.5 17,454.0 -3,865.4 -3,865.42052 0.0 0.0 0.0 1,942.8 17,289.8 -4,059.0 -4,059.02053 0.0 0.0 0.0 1,890.7 17,125.7 -4,251.9 -4,251.92054 0.0 0.0 0.0 1,836.9 16,960.9 -4,444.5 -4,444.52055 0.0 0.0 0.0 1,780.9 16,796.5 -4,637.2 -4,637.22056 0.0 0.0 0.0 1,722.5 16,631.9 -4,830.5 -4,830.52057 0.0 0.0 0.0 1,661.6 16,467.6 -5,024.3 -5,024.32058 0.0 0.0 0.0 1,598.3 16,304.7 -5,218.8 -5,218.82059 0.0 0.0 0.0 1,532.6 16,142.6 -5,413.9 -5,413.92060 0.0 0.0 0.0 1,464.5 15,981.3 -5,609.6 -5,609.62061 0.0 0.0 0.0 1,394.3 15,821.7 -5,805.8 -5,805.82062 0.0 0.0 0.0 1,322.0 15,664.2 -6,002.5 -6,002.52063 0.0 0.0 0.0 1,247.8 15,508.7 -6,199.6 -6,199.62064 0.0 0.0 0.0 1,171.7 15,355.7 -6,397.1 -6,397.12065 0.0 0.0 0.0 1,093.7 15,204.5 -6,595.0 -6,595.02066 0.0 0.0 0.0 1,013.8 15,055.3 -6,793.3 -6,793.32067 0.0 0.0 0.0 932.1 14,907.9 -6,992.1 -6,992.12068 0.0 0.0 0.0 848.6 14,762.2 -7,191.4 -7,191.42069 0.0 0.0 0.0 763.4 14,618.0 -7,391.0 -7,391.02070 0.0 0.0 0.0 676.5 14,476.2 -7,591.0 -7,591.02071 0.0 0.0 0.0 588.3 14,336.4 -7,791.2 -7,791.22072 0.0 0.0 0.0 499.2 14,198.6 -7,991.1 -7,991.12073 0.0 0.0 0.0 409.3 14,062.2 -8,190.5 -8,190.52074 0.0 0.0 0.0 319.2 13,927.2 -8,389.1 -8,389.12075 0.0 0.0 0.0 229.0 13,793.7 -8,586.7 -8,586.72076 0.0 0.0 0.0 139.4 13,661.5 -8,782.6 -8,782.62077 0.0 0.0 0.0 50.6 13,530.3 -8,976.7 -8,976.72078 0.0 0.0 0.0 -37.1 13,399.9 -9,168.8 -9,168.82079 0.0 0.0 0.0 -123.6 13,271.0 -9,358.6 -9,358.62080 0.0 0.0 0.0 -208.8 13,143.2 -9,546.2 -9,546.22081 0.0 0.0 0.0 -292.9 13,016.0 -9,731.8 -9,731.82082 0.0 0.0 0.0 -376.3 12,889.1 -9,915.6 -9,915.62083 0.0 0.0 0.0 -459.2 12,762.3 -10,098.0 -10,098.02084 0.0 0.0 0.0 -542.0 12,635.6 -10,279.3 -10,279.32085 0.0 0.0 0.0 -625.0 12,509.3 -10,459.9 -10,459.92086 0.0 0.0 0.0 -708.4 12,383.5 -10,639.8 -10,639.82087 0.0 0.0 0.0 -792.5 12,258.4 -10,819.4 -10,819.42088 0.0 0.0 0.0 -877.3 12,134.0 -10,998.8 -10,998.82089 0.0 0.0 0.0 -963.0 12,010.4 -11,177.9 -11,177.92090 0.0 0.0 0.0 -1,049.5 11,887.6 -11,356.8 -11,356.82091 0.0 0.0 0.0 -1,136.8 11,765.8 -11,535.6 -11,535.6
Total 2016-2090 0.0
Based on the Intermediate Assumptions of the 2016 Trustees Report.Ultimate Real Trust Fund Yield of 2.7%.
Office of the Chief Actuary1 Theoretical Social Security is the current Social Security program with the assumption Social Security Administration
that the law is modified to permit borrowing from the General Fund of the Treasury. February 16, 2017
CalendarYear
Proposal General Fund Transfers Present Value in Billions as of 1-1-2016
ProposalTotal OASDI
Trust FundReserves
at End of Year
Theoretical Social Security1
with Borrowing Authority
Present Value in Billions as of 1-1- 2016 Net OASDI Trust Fund Reserves at End of Year
Table 1b - OASDI Changes & Implications for Federal Budget and Debt of Specified Plan Provision Effects on OASDI1 (Present Value Dollars)Social Security Expansion Act, introduced by Senator Bernie Sanders and Representative Peter DeFazio
Year
Specified General Fund
Transfers
Basic Changesin OASDI
Cash Flow
Changein Annual
Unified BudgetCash Flow
Change inDebt Held
by Public atEnd of Year
Changein Annual
Unified BudgetBalance
Changein Total
Federal DebtEnd Of Year
Changein Annual
On BudgetBalance
(1) (2) (3) (4) (5) (6) (7)2016 0.0 0.0 0.0 0.0 0.0 0.0 0.02017 0.0 0.0 0.0 0.0 0.0 0.0 0.02018 0.0 146.5 146.5 -146.5 146.5 0.0 0.02019 0.0 158.4 158.4 -304.9 162.9 0.0 0.02020 0.0 163.0 163.0 -467.8 172.5 0.0 0.02021 0.0 167.1 167.1 -635.0 181.9 0.0 0.02022 0.0 170.5 170.5 -805.5 190.9 0.0 0.02023 0.0 173.1 173.1 -978.6 199.6 0.0 0.02024 0.0 175.7 175.7 -1,154.3 208.9 0.0 0.02025 0.0 178.0 178.0 -1,332.3 218.3 0.0 0.02026 0.0 181.2 181.2 -1,513.5 231.9 0.0 0.02027 0.0 184.0 184.0 -1,697.5 246.4 0.0 0.02028 0.0 186.4 186.4 -1,883.9 261.7 0.0 0.02029 0.0 188.1 188.1 -2,072.0 277.8 0.0 0.02030 0.0 189.4 189.4 -2,261.4 295.0 0.0 0.02031 0.0 190.4 190.4 -2,451.8 305.6 0.0 0.02032 0.0 191.6 191.6 -2,643.4 316.5 0.0 0.02033 0.0 193.0 193.0 -2,836.3 327.7 0.0 0.02034 0.0 194.6 194.6 -3,030.9 339.2 0.0 0.02035 0.0 192.4 192.4 -3,223.3 346.9 0.0 0.02036 0.0 188.4 188.4 -3,411.8 352.7 0.0 0.02037 0.0 184.6 184.6 -3,596.4 358.5 0.0 0.02038 0.0 181.0 181.0 -3,777.3 364.3 0.0 0.02039 0.0 177.5 177.5 -3,954.8 370.0 0.0 0.02040 0.0 174.1 174.1 -4,128.9 375.7 0.0 0.02041 0.0 170.9 170.9 -4,299.8 381.3 0.0 0.02042 0.0 167.8 167.8 -4,467.6 387.0 0.0 0.02043 0.0 164.9 164.9 -4,632.5 392.6 0.0 0.02044 0.0 162.2 162.2 -4,794.7 398.3 0.0 0.02045 0.0 159.4 159.4 -4,954.1 403.8 0.0 0.02046 0.0 156.8 156.8 -5,110.9 409.2 0.0 0.02047 0.0 154.3 154.3 -5,265.1 414.7 0.0 0.02048 0.0 151.8 151.8 -5,417.0 420.2 0.0 0.02049 0.0 149.5 149.5 -5,566.5 425.6 0.0 0.02050 0.0 147.3 147.3 -5,713.8 431.0 0.0 0.02051 0.0 145.1 145.1 -5,858.9 436.3 0.0 0.02052 0.0 142.9 142.9 -6,001.8 441.5 0.0 0.02053 0.0 140.8 140.8 -6,142.6 446.7 0.0 0.02054 0.0 138.8 138.8 -6,281.3 451.8 0.0 0.02055 0.0 136.8 136.8 -6,418.1 456.9 0.0 0.02056 0.0 134.9 134.9 -6,553.0 462.0 0.0 0.02057 0.0 133.0 133.0 -6,685.9 466.9 0.0 0.02058 0.0 131.1 131.1 -6,817.1 471.9 0.0 0.02059 0.0 129.4 129.4 -6,946.5 476.8 0.0 0.02060 0.0 127.7 127.7 -7,074.1 481.7 0.0 0.02061 0.0 126.0 126.0 -7,200.1 486.5 0.0 0.02062 0.0 124.4 124.4 -7,324.5 491.4 0.0 0.02063 0.0 122.9 122.9 -7,447.4 496.2 0.0 0.02064 0.0 121.4 121.4 -7,568.7 500.9 0.0 0.02065 0.0 119.9 119.9 -7,688.6 505.6 0.0 0.02066 0.0 118.5 118.5 -7,807.1 510.3 0.0 0.02067 0.0 117.1 117.1 -7,924.2 515.0 0.0 0.02068 0.0 115.8 115.8 -8,039.9 519.6 0.0 0.02069 0.0 114.4 114.4 -8,154.4 524.2 0.0 0.02070 0.0 113.2 113.2 -8,267.5 528.7 0.0 0.02071 0.0 111.9 111.9 -8,379.5 533.3 0.0 0.02072 0.0 110.7 110.7 -8,490.2 537.8 0.0 0.02073 0.0 109.6 109.6 -8,599.8 542.3 0.0 0.02074 0.0 108.5 108.5 -8,708.3 546.8 0.0 0.02075 0.0 107.4 107.4 -8,815.7 551.2 0.0 0.02076 0.0 106.3 106.3 -8,922.0 555.6 0.0 0.02077 0.0 105.3 105.3 -9,027.3 560.0 0.0 0.02078 0.0 104.3 104.3 -9,131.7 564.4 0.0 0.02079 0.0 103.3 103.3 -9,235.0 568.7 0.0 0.02080 0.0 102.4 102.4 -9,337.4 573.1 0.0 0.02081 0.0 101.4 101.4 -9,438.8 577.3 0.0 0.02082 0.0 100.5 100.5 -9,539.3 581.5 0.0 0.02083 0.0 99.5 99.5 -9,638.8 585.7 0.0 0.02084 0.0 98.5 98.5 -9,737.4 589.8 0.0 0.02085 0.0 97.5 97.5 -9,834.9 593.8 0.0 0.02086 0.0 96.5 96.5 -9,931.4 597.8 0.0 0.02087 0.0 95.5 95.5 -10,026.9 601.7 0.0 0.02088 0.0 94.5 94.5 -10,121.4 605.5 0.0 0.02089 0.0 93.5 93.5 -10,214.9 609.3 0.0 0.02090 0.0 92.5 92.5 -10,307.4 613.1 0.0 0.0
Total 2016-2090 0.0 10,307.4 10,307.4
Based on Intermediate Assumptions of the 2016 Trustees Report.Ultimate Real Trust Fund Yield of 2.7%.Note: Changes reflect the budget scoring convention that presumes benefits not payable after reserve depletion would Office of the Chief Actuary nonetheless be paid, based on transfers from the General Fund of the Treasury resulting in additional borrowing from the public. Social Security Administration1 Effects of tax provisions on the On-Budget are not reflected in this table.
Billions of Present Value Dollars as of 1-1-2016
February 16, 2017

Table 1b.n - OASDI Changes & Implications for Federal Budget and Debt of Specified Plan Provision Effects on OASDI1 (Nominal Dollars)Social Security Expansion Act, introduced by Senator Bernie Sanders and Representative Peter DeFazio
Year
Specified General Fund
Transfers
Basic Changesin OASDI
Cash Flow
Changein Annual
Unified BudgetCash Flow
Change inDebt Held
by Public atEnd of Year
Changein Annual
Unified BudgetBalance
Changein Total
Federal DebtEnd of Year
Changein Annual
On BudgetBalance
(1) (2) (3) (4) (5) (6) (7)2016 0.0 0.0 0.0 0.0 0.0 0.0 0.02017 0.0 0.0 0.0 0.0 0.0 0.0 0.02018 0.0 158.2 158.2 -160.9 160.9 0.0 0.02019 0.0 176.4 176.4 -345.8 184.9 0.0 0.02020 0.0 187.4 187.4 -548.3 202.5 0.0 0.02021 0.0 198.4 198.4 -769.0 220.7 0.0 0.02022 0.0 209.0 209.0 -1,008.8 239.8 0.0 0.02023 0.0 219.3 219.3 -1,269.2 260.4 0.0 0.02024 0.0 230.3 230.3 -1,552.3 283.1 0.0 0.02025 0.0 241.5 241.5 -1,859.6 307.3 0.0 0.02026 0.0 255.2 255.2 -2,198.7 339.1 0.0 0.0
Based on Intermediate Assumptions of the 2016 Trustees Report.Note: Changes reflect the budget scoring convention that presumes benefits not payable after reserve depletion would Office of the Chief Actuary nonetheless be paid, based on transfers from the General Fund of the Treasury resulting in additional borrowing from the public. Social Security Administration1 Effects of tax provisions on the On-Budget are not reflected in this table.
Billions of Nominal Dollars
February 16, 2017

Table 1c - Current Law and Proposal Cost, Expenditures, and Income: As Percent of Gross Domestic ProductSocial Security Expansion Act, introduced by Senator Bernie Sanders and Representative Peter DeFazio
CostExpenditures
(Payable)Non-Interest
Income CostExpenditures
(Payable)Non-Interest
Income(1) (2) (3) (4) (5) (6)
2016 4.98 4.98 4.59 4.98 4.98 4.592017 4.91 4.91 4.62 4.91 4.91 4.622018 4.98 4.98 4.65 4.98 4.98 5.422019 5.05 5.05 4.68 5.05 5.05 5.492020 5.12 5.12 4.70 5.13 5.13 5.532021 5.18 5.18 4.72 5.21 5.21 5.572022 5.28 5.28 4.75 5.32 5.32 5.612023 5.39 5.39 4.77 5.44 5.44 5.652024 5.50 5.50 4.79 5.56 5.56 5.692025 5.60 5.60 4.81 5.68 5.68 5.722026 5.67 5.67 4.81 5.75 5.75 5.752027 5.73 5.73 4.81 5.83 5.83 5.772028 5.78 5.78 4.81 5.89 5.89 5.792029 5.83 5.83 4.81 5.96 5.96 5.822030 5.87 5.87 4.81 6.01 6.01 5.842031 5.91 5.91 4.80 6.06 6.06 5.872032 5.94 5.94 4.80 6.11 6.11 5.892033 5.96 5.96 4.80 6.14 6.14 5.922034 5.98 5.29 4.80 6.17 6.17 5.952035 5.98 4.79 4.79 6.19 6.19 5.952036 6.00 4.79 4.79 6.22 6.22 5.962037 6.01 4.79 4.79 6.24 6.24 5.962038 6.01 4.78 4.78 6.26 6.26 5.962039 6.00 4.78 4.78 6.26 6.26 5.962040 5.99 4.78 4.78 6.26 6.26 5.952041 5.97 4.77 4.77 6.26 6.26 5.952042 5.96 4.77 4.77 6.26 6.26 5.952043 5.94 4.77 4.77 6.25 6.25 5.952044 5.93 4.76 4.76 6.25 6.25 5.962045 5.92 4.76 4.76 6.25 6.25 5.962046 5.91 4.76 4.76 6.25 6.25 5.962047 5.90 4.76 4.76 6.25 6.25 5.962048 5.89 4.76 4.76 6.25 6.25 5.962049 5.88 4.75 4.75 6.25 6.25 5.962050 5.87 4.75 4.75 6.25 6.25 5.962051 5.87 4.75 4.75 6.25 6.25 5.962052 5.87 4.75 4.75 6.26 6.26 5.962053 5.88 4.75 4.75 6.27 6.27 5.962054 5.89 4.75 4.75 6.29 6.29 5.962055 5.90 4.74 4.74 6.30 6.30 5.962056 5.91 4.74 4.74 6.32 6.32 5.962057 5.92 4.74 4.74 6.34 6.34 5.962058 5.94 4.74 4.74 6.36 6.36 5.962059 5.95 4.74 4.74 6.38 6.38 5.962060 5.97 4.74 4.74 6.40 6.40 5.962061 5.98 4.73 4.73 6.41 6.41 5.962062 5.99 4.73 4.73 6.43 6.43 5.962063 6.01 4.73 4.73 6.45 6.45 5.962064 6.02 4.73 4.73 6.46 6.46 5.962065 6.03 4.72 4.72 6.48 6.48 5.952066 6.04 4.72 4.72 6.49 6.49 5.952067 6.06 4.72 4.72 6.51 6.51 5.952068 6.07 4.71 4.71 6.52 6.52 5.952069 6.08 4.71 4.71 6.54 6.54 5.952070 6.09 4.71 4.71 6.55 6.55 5.942071 6.10 4.70 4.70 6.56 6.56 5.942072 6.11 4.70 4.70 6.57 6.57 5.942073 6.12 4.70 4.70 6.58 6.58 5.932074 6.12 4.69 4.69 6.59 6.59 5.932075 6.13 4.69 4.69 6.59 6.59 5.932076 6.12 4.68 4.68 6.59 6.59 5.922077 6.12 4.68 4.68 6.58 6.58 5.922078 6.11 4.67 4.67 6.58 6.47 5.912079 6.11 4.67 4.67 6.57 5.91 5.912080 6.10 4.66 4.66 6.56 5.91 5.912081 6.09 4.66 4.66 6.56 5.90 5.902082 6.09 4.66 4.66 6.55 5.90 5.902083 6.09 4.65 4.65 6.55 5.89 5.892084 6.09 4.65 4.65 6.55 5.89 5.892085 6.09 4.64 4.64 6.56 5.89 5.892086 6.10 4.64 4.64 6.57 5.89 5.892087 6.11 4.64 4.64 6.58 5.88 5.882088 6.12 4.64 4.64 6.59 5.88 5.882089 6.13 4.63 4.63 6.60 5.88 5.882090 6.14 4.63 4.63 6.61 5.88 5.88
Based on Intermediate Assumptions of the 2016 Trustees Report. Office of the Chief ActuarySocial Security Administration
Current Law OASDI Proposal OASDI
CalendarYear
February 16, 2017

Table 1d - Change in Long-Range Trust Fund Reserves / Unfunded ObligationSocial Security Expansion Act, introduced by Senator Bernie Sanders and Representative Peter DeFazio
Year
Current Law OASDITrust Fund Reserves /
Unfunded ObligationThrough End of Year
Changes in OASDI
Income
Changesin OASDI
Cost
BasicChangesin OASDI
Cash Flow
Total ChangeThrough
End of Year
Proposal OASDITrust Fund Reserves /
Unfunded ObligationThrough End of Year
(1) (2) (3) (4) = (2)-(3) (5) = cumulative sum(4) (6) = (1)+(5)2016 2,741.0 0.0 0.0 0.0 0.0 2,741.02017 2,687.5 0.0 0.0 0.0 0.0 2,687.52018 2,625.9 146.6 0.1 146.5 146.5 2,772.42019 2,554.4 158.5 0.2 158.4 304.9 2,859.32020 2,471.7 165.4 2.4 163.0 467.8 2,939.52021 2,378.9 172.0 4.9 167.1 635.0 3,013.92022 2,270.6 178.0 7.5 170.5 805.5 3,076.12023 2,142.4 183.3 10.2 173.1 978.6 3,121.02024 1,994.9 188.7 13.0 175.7 1,154.3 3,149.32025 1,827.2 193.9 15.9 178.0 1,332.3 3,159.52026 1,645.4 200.0 18.8 181.2 1,513.5 3,158.92027 1,450.6 205.6 21.6 184.0 1,697.5 3,148.12028 1,244.3 210.8 24.4 186.4 1,883.9 3,128.22029 1,028.4 215.1 27.1 188.1 2,072.0 3,100.42030 804.8 219.1 29.7 189.4 2,261.4 3,066.22031 575.3 222.6 32.2 190.4 2,451.8 3,027.12032 341.0 226.3 34.7 191.6 2,643.4 2,984.42033 103.7 230.2 37.2 193.0 2,836.3 2,940.12034 -134.7 234.2 39.6 194.6 3,030.9 2,896.22035 -372.8 234.3 41.9 192.4 3,223.3 2,850.52036 -612.3 232.7 44.3 188.4 3,411.8 2,799.52037 -852.1 231.2 46.6 184.6 3,596.4 2,744.32038 -1,090.4 229.8 48.9 181.0 3,777.3 2,686.92039 -1,326.1 228.5 51.0 177.5 3,954.8 2,628.82040 -1,558.1 227.0 53.0 174.1 4,128.9 2,570.82041 -1,786.1 225.7 54.8 170.9 4,299.8 2,513.72042 -2,010.0 224.3 56.5 167.8 4,467.6 2,457.62043 -2,229.8 223.0 58.1 164.9 4,632.5 2,402.82044 -2,445.4 221.7 59.6 162.2 4,794.7 2,349.32045 -2,657.8 220.3 60.9 159.4 4,954.1 2,296.32046 -2,866.7 218.9 62.1 156.8 5,110.9 2,244.12047 -3,072.2 217.4 63.2 154.3 5,265.1 2,193.02048 -3,274.5 216.0 64.1 151.8 5,417.0 2,142.52049 -3,473.9 214.5 65.0 149.5 5,566.5 2,092.62050 -3,670.6 213.0 65.7 147.3 5,713.8 2,043.22051 -3,865.4 211.4 66.3 145.1 5,858.9 1,993.52052 -4,059.0 209.8 66.9 142.9 6,001.8 1,942.82053 -4,251.9 208.1 67.3 140.8 6,142.6 1,890.72054 -4,444.5 206.5 67.7 138.8 6,281.3 1,836.92055 -4,637.2 204.8 68.0 136.8 6,418.1 1,780.92056 -4,830.5 203.1 68.3 134.9 6,553.0 1,722.52057 -5,024.3 201.4 68.4 133.0 6,685.9 1,661.62058 -5,218.8 199.7 68.6 131.1 6,817.1 1,598.32059 -5,413.9 198.0 68.6 129.4 6,946.5 1,532.62060 -5,609.6 196.2 68.6 127.7 7,074.1 1,464.52061 -5,805.8 194.5 68.5 126.0 7,200.1 1,394.32062 -6,002.5 192.8 68.4 124.4 7,324.5 1,322.02063 -6,199.6 191.1 68.2 122.9 7,447.4 1,247.82064 -6,397.1 189.4 68.0 121.4 7,568.7 1,171.72065 -6,595.0 187.6 67.7 119.9 7,688.6 1,093.72066 -6,793.3 185.9 67.5 118.5 7,807.1 1,013.82067 -6,992.1 184.2 67.2 117.1 7,924.2 932.12068 -7,191.4 182.6 66.8 115.8 8,039.9 848.62069 -7,391.0 180.9 66.5 114.4 8,154.4 763.42070 -7,591.0 179.3 66.1 113.2 8,267.5 676.52071 -7,791.2 177.6 65.7 111.9 8,379.5 588.32072 -7,991.1 176.0 65.3 110.7 8,490.2 499.22073 -8,190.5 174.4 64.8 109.6 8,599.8 409.32074 -8,389.1 172.8 64.3 108.5 8,708.3 319.22075 -8,586.7 171.2 63.8 107.4 8,815.7 229.02076 -8,782.6 169.7 63.3 106.3 8,922.0 139.42077 -8,976.7 168.1 62.8 105.3 9,027.3 50.62078 -9,168.8 166.5 62.2 104.3 9,131.7 -37.12079 -9,358.6 165.0 61.6 103.3 9,235.0 -123.62080 -9,546.2 163.4 61.0 102.4 9,337.4 -208.82081 -9,731.8 161.9 60.4 101.4 9,438.8 -292.92082 -9,915.6 160.4 59.9 100.5 9,539.3 -376.32083 -10,098.0 158.8 59.3 99.5 9,638.8 -459.22084 -10,279.3 157.3 58.8 98.5 9,737.4 -542.02085 -10,459.9 155.8 58.3 97.5 9,834.9 -625.02086 -10,639.8 154.3 57.8 96.5 9,931.4 -708.42087 -10,819.4 152.8 57.3 95.5 10,026.9 -792.52088 -10,998.8 151.3 56.8 94.5 10,121.4 -877.32089 -11,177.9 149.8 56.3 93.5 10,214.9 -963.02090 -11,356.8 148.3 55.9 92.5 10,307.4 -1,049.5
Total 2016-2090 14091.3 3784.0 10307.4
Based on Intermediate Assumptions of the 2016 Trustees Report. Office of the Chief ActuarySocial Security Administration
Ultimate Real Trust Fund Yield of 2.7%. February 16, 2017
(Billions of Dollars, Present Value on 1-1-2016)


