Annual Statistical Report on the Social Security ... · Annual Statistical Report on the Social...
196
Annual Statistical Report on the Social Security Disability Insurance Program, 2016 Social Security Social Security Administration Office of Retirement and Disability Policy Office of Research, Evaluation, and Statistics 500 E Street, SW, 8th Floor Washington, DC 20254 SSA Publication No. 13-11826 Produced and published at U.S. taxpayer expense Released: October 2017
Transcript of Annual Statistical Report on the Social Security ... · Annual Statistical Report on the Social...
Annual Statistical Report on the Social Security Disability Insurance Program, 2016
Social Security
Social Security AdministrationOffice of Retirement and Disability PolicyOffice of Research, Evaluation, and Statistics500 E Street, SW, 8th FloorWashington, DC 20254
SSA Publication No. 13-11826Produced and published at U.S. taxpayer expense
Released: October 2017
Errata Policy
If there are any additions or corrections to the data published herein, they will be posted as errata on the web at https://www.socialsecurity.gov/policy/docs /statcomps/di_asr/2016/index.html.
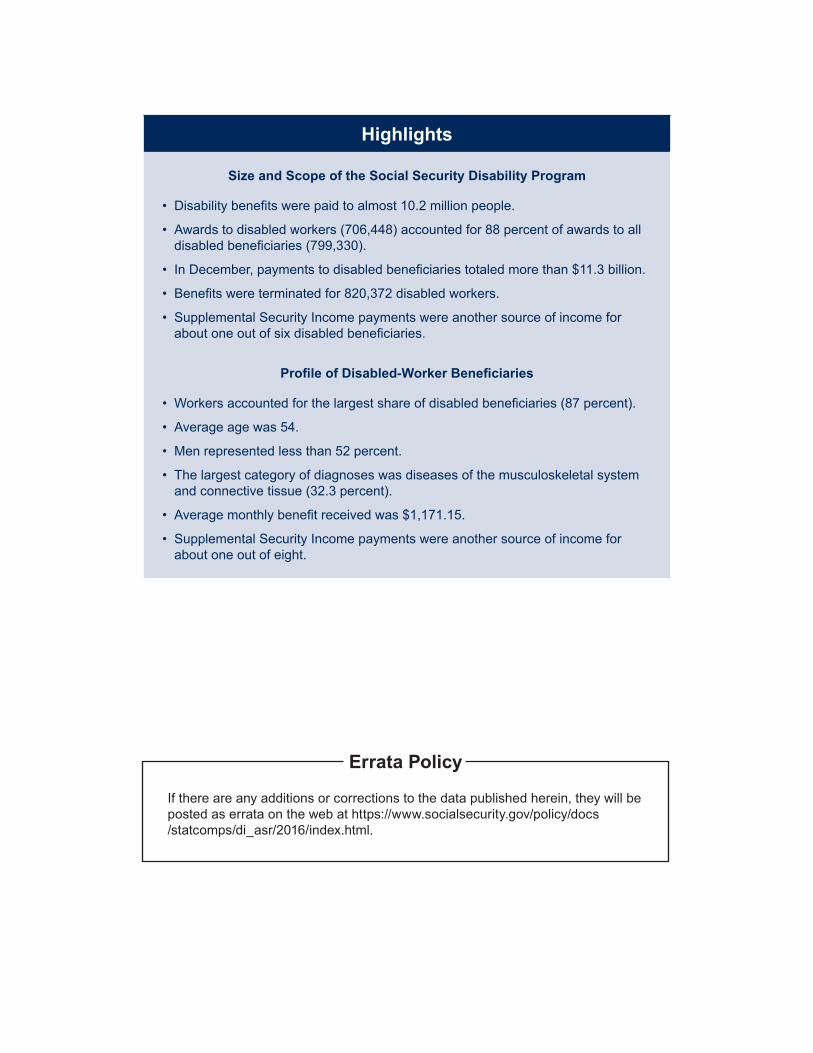
Highlights
Size and Scope of the Social Security Disability Program
• Disability benefits were paid to almost 10.2 million people.
• Awards to disabled workers (706,448) accounted for 88 percent of awards to alldisabled beneficiaries (799,330).
• In December, payments to disabled beneficiaries totaled more than $11.3 billion.
• Benefits were terminated for 820,372 disabled workers.
• Supplemental Security Income payments were another source of income forabout one out of six disabled beneficiaries.
Profile of Disabled-Worker Beneficiaries
• Workers accounted for the largest share of disabled beneficiaries (87 percent).
• Average age was 54.
• Men represented less than 52 percent.
• The largest category of diagnoses was diseases of the musculoskeletal systemand connective tissue (32.3 percent).
• Average monthly benefit received was $1,171.15.
• Supplemental Security Income payments were another source of income forabout one out of eight.
Preface
Since 1956, the Social Security program has provided cash benefits to people with dis-abilities. This annual report provides program and demographic information about the people who receive those benefits. The basic topics covered are—
• beneficiaries in current-payment status;
• workers’ compensation and public disability benefits;
• benefits awarded, withheld, and terminated;
• disabled workers who have returned to work;
• outcomes of applications for disability benefits; and
• disabled beneficiaries receiving Social Security, Supplemental Security Income, or both.
Your suggestions and comments on this report are welcome and should be directed to the Office of Statistical Analysis and Support at 410-965-0090 or [email protected]. Contact information is also provided on each table. This and other reports on the Social Security and Supplemental Security Income programs are available on our website at https://www.socialsecurity.gov/policy.
John W. R. Phillips Associate Commissioner for Research, Evaluation, and Statistics
October 2017
Notes
The Old-Age and Survivors Insurance (OASI) program provides benefits to retired work-ers and their dependent family members and to survivors of deceased workers. The Dis-ability Insurance (DI) program provides benefits to disabled workers, their spouses, and children (whether or not disabled).
Benefits are paid from the OASI and DI Trust Funds. However, not all disabled benefi-ciaries are paid from the DI Trust Fund. All disabled widow(er)s’ and most disabled adult children’s benefits are paid from the OASI Trust Fund. Persons receiving disability ben-efits from either trust fund are referred to in this report as Social Security beneficiaries.
Data for 2001 and subsequent years presented in these tables may differ slightly from other published statistics for two reasons. First, all data for those years are based on 100 percent data files. Second, beginning in 2001, the definition of an award was changed to include secondary benefit awards, subsequent periods of disability, and con-versions from one class of child’s benefit to another and to exclude reinstated benefits. Those changes resulted in a slight increase in the award counts.
In accordance with Public Law 111-256 (enacted October 2010), the terms “retardation” and “mental retardation” have been replaced by “intellectual disability.” This change in terminology does not affect the data presented, which are directly comparable with the data published in previous editions under the old terminology.
Beginning with the 2010 edition, tables and charts showing data by diagnostic group provide detail for mental disorders in these categories: autistic disorders, developmen-tal disorders, childhood and adolescent disorders not elsewhere classified, intellectual disability, mood disorders, organic mental disorders, schizophrenic and other psychotic disorders, and all other mental disorders. In a few instances, a table showing data by diagnostic group has been split into two companion tables to accommodate the addi-tional detail.
All years are calendar years unless otherwise specified.
Contents
Background History of the Social Security Disability Insurance Program. . . . . . . . . . . . . . . . . . . . . . . . . .1 Definition of Disability . . . . . . . . . . . . . . . . . . . . . . . . . . . . . . . . . . . . . . . . . . . . .2 Types of Benefits Available . . . . . . . . . . . . . . . . . . . . . . . . . . . . . . . . . . . . . . . . . .3 Initial Disability Decision-Making Process . . . . . . . . . . . . . . . . . . . . . . . . . . . . . . . . . . .3 Appeals Process. . . . . . . . . . . . . . . . . . . . . . . . . . . . . . . . . . . . . . . . . . . . . . . .4 Benefit Calculations . . . . . . . . . . . . . . . . . . . . . . . . . . . . . . . . . . . . . . . . . . . . . .4 Benefits Offset and Withheld . . . . . . . . . . . . . . . . . . . . . . . . . . . . . . . . . . . . . . . . .5 Work Incentives . . . . . . . . . . . . . . . . . . . . . . . . . . . . . . . . . . . . . . . . . . . . . . . .6 Benefit Termination . . . . . . . . . . . . . . . . . . . . . . . . . . . . . . . . . . . . . . . . . . . . . .7
Beneficiaries in Current-Payment Status
Charts
1. All Social Security disabled beneficiaries in current-payment status, December 2016 . . . . . . . . . . . 11
2. All Social Security disabled beneficiaries in current-payment status, December 1970–2016 . . . . . . . . 12
3. Disabled beneficiaries aged 18–64 in current-payment status as a percentage of state population aged 18–64, December 2016 . . . . . . . . . . . . . . . . . . . . . . . . . . . . . . . . . . . . . . . . 13
4. Age of disabled-worker beneficiaries in current-payment status, by sex, December 2016 . . . . . . . . . 14
5. Average monthly benefit of disabled beneficiaries in current-payment status, by sex, December 2016 . . 15
6. Disabled beneficiaries in current-payment status, by diagnostic group, December 2016 . . . . . . . . . . 16
Tables
Disabled Beneficiaries and Nondisabled Dependents
1. Number, December 1960–2016, selected years . . . . . . . . . . . . . . . . . . . . . . . . . . . . . . 17
2. Number and average monthly benefit, by basis of entitlement, age, and sex, December 2016. . . . . . . 18
All Disabled Beneficiaries
3. Number, average, and total monthly benefits, December 1960–2016. . . . . . . . . . . . . . . . . . . . 20
4. Number and average monthly benefit, by sex and age, December 2016 . . . . . . . . . . . . . . . . . . 22
5. Distribution, by sex and monthly benefit, December 2016 . . . . . . . . . . . . . . . . . . . . . . . . . 23
6. Distribution, by sex and diagnostic group, December 2016 . . . . . . . . . . . . . . . . . . . . . . . . . 25
7. Average monthly benefit, by sex and diagnostic group, December 2016 . . . . . . . . . . . . . . . . . . 27
8. Number aged 18–64 as a percentage of the resident population aged 18–64, by state, December 2016 . . 29
9. Distribution, by state or other area, December 2016 . . . . . . . . . . . . . . . . . . . . . . . . . . . . 31
10. Number, by state or other area and diagnostic group, December 2016 . . . . . . . . . . . . . . . . . . . 33
10.A. Number, by state or other area and mental disorders diagnostic group, December 2016 . . . . . . . . . 37
11. Number and percentage distribution, by state or other area and diagnostic group, December 2016 . . . . 39
11.A. Percentage distribution, by state or other area and mental disorders diagnostic group, December 2016 . . 43
vi ♦ Annual Statistical Report on the Social Security Disability Insurance Program, 2016
12. Number receiving Social Security disability benefits because of blindness or deafness, by state or other area, December 2016 . . . . . . . . . . . . . . . . . . . . . . . . . . . . . . . . . . . . . . . . . 45
13. Total monthly benefits, by state or other area, December 2016 . . . . . . . . . . . . . . . . . . . . . . . 47
14. Number, by type of representative payee, December 2016 . . . . . . . . . . . . . . . . . . . . . . . . . 49
15. Representative payment, by sex and diagnostic group, December 2016 . . . . . . . . . . . . . . . . . . 50
16. Number and percentage distribution of disabled workers, by state or other area and monthly benefit, December 2016 . . . . . . . . . . . . . . . . . . . . . . . . . . . . . . . . . . . . . . . . . . . . . . . 52
17. Number and percentage distribution of disabled widow(er)s, by state or other area and monthly benefit, December 2016 . . . . . . . . . . . . . . . . . . . . . . . . . . . . . . . . . . . . . . . . . . . 54
18. Number and percentage distribution of disabled adult children, by state or other area and monthly benefit, December 2016 . . . . . . . . . . . . . . . . . . . . . . . . . . . . . . . . . . . . . . . . . . . 56
Disabled Workers
19. Number and percentage distribution, by sex and age, December 1960–2016, selected years . . . . . . . 58
20. Number, average primary insurance amount, and average monthly benefit, by age and sex, December 2016 . . . . . . . . . . . . . . . . . . . . . . . . . . . . . . . . . . . . . . . . . . . . . . . 61
21. Distribution, by diagnostic group, December 1996–2016 . . . . . . . . . . . . . . . . . . . . . . . . . . 62
22. Distribution of workers under age 50, by diagnostic group, December 1996–2016 . . . . . . . . . . . . . 64
23. Distribution of workers aged 50 or older, by diagnostic group, December 1996–2016 . . . . . . . . . . . 66
24. Distribution, by diagnostic group and age, December 2016 . . . . . . . . . . . . . . . . . . . . . . . . . 68
25. Distribution of workers with a secondary benefit (dual entitlement), by worker’s smaller primary insurance amount and sex, December 2016 . . . . . . . . . . . . . . . . . . . . . . . . . . . . . . . . 70
26. Distribution of workers with a secondary benefit (dual entitlement), by type of secondary benefit and sex, December 2016. . . . . . . . . . . . . . . . . . . . . . . . . . . . . . . . . . . . . . . . . . . . . 71
27. Number, by sex, state or other area, and age, December 2016. . . . . . . . . . . . . . . . . . . . . . . 72
Disabled-Worker Families
28. Number and average monthly family benefit, by selected family composition, December 1960–2016, selected years . . . . . . . . . . . . . . . . . . . . . . . . . . . . . . . . . . . . . . . . . . . . . . . . 76
29. Number, average primary insurance amount, and average monthly family benefit, by family composition, December 2016 . . . . . . . . . . . . . . . . . . . . . . . . . . . . . . . . . . . . . . . . 78
30. Distribution, by family composition and age of worker, December 2016 . . . . . . . . . . . . . . . . . . 79
Beneficiaries Who Have Filed for Workers’ Compensation or Public Disability Benefits
Notes . . . . . . . . . . . . . . . . . . . . . . . . . . . . . . . . . . . . . . . . . . . . . . . . . . . . 82
Chart
7. Distribution of workers, by diagnostic group and sex, December 2016 . . . . . . . . . . . . . . . . . . . 83
Tables
31. Distribution of workers and dependents who have filed, by reason for having or not having an offset, December 2016 . . . . . . . . . . . . . . . . . . . . . . . . . . . . . . . . . . . . . . . . . . . . . . . 84
32. Distribution of workers and dependents who have filed, by state or other area of residence, December 2016 . . . . . . . . . . . . . . . . . . . . . . . . . . . . . . . . . . . . . . . . . . . . . . . 85
Annual Statistical Report on the Social Security Disability Insurance Program, 2016 ♦ vii
33. Distribution of workers who have filed, by diagnostic group and age, December 2016 . . . . . . . . . . . 87
34. Distribution of workers who have filed, by diagnostic group and sex, December 2016 . . . . . . . . . . . 89
Benefits Awarded, Withheld, and Terminated
Charts
8. Social Security disability awards, 1980–2016 . . . . . . . . . . . . . . . . . . . . . . . . . . . . . . . . 93
9. Average monthly benefit awards, by sex, 2016 . . . . . . . . . . . . . . . . . . . . . . . . . . . . . . . 94
10. Disabled-worker awards, by selected diagnostic group, 2016. . . . . . . . . . . . . . . . . . . . . . . . 95
Tables
Awards to Disabled Beneficiaries and Nondisabled Dependents
35. Number, selected years 1960–2016 . . . . . . . . . . . . . . . . . . . . . . . . . . . . . . . . . . . . . 96
36. Number and average monthly benefit, by basis of entitlement, age, and sex, 2016 . . . . . . . . . . . . 97
Awards to All Disabled Beneficiaries
37. Distribution, by sex and diagnostic group, 2016 . . . . . . . . . . . . . . . . . . . . . . . . . . . . . . . 99
38. Distribution and average monthly benefit, by state or other area, 2016 . . . . . . . . . . . . . . . . . . 101
Awards to Disabled Workers
39. Number and percentage distribution, by sex and age, selected years 1960–2016 . . . . . . . . . . . . 103
40. Distribution, by diagnostic group, selected years 1960–2016 . . . . . . . . . . . . . . . . . . . . . . . 106
41. Distribution of workers under age 50, by diagnostic group, selected years 1975–2016. . . . . . . . . . 114
42. Distribution of workers aged 50 or older, by diagnostic group, selected years 1975–2016 . . . . . . . . 119
43. Average primary insurance amount and average monthly benefit, by sex, selected years 1960–2016 . . 124
44. Distribution, by diagnostic group, sex, and age, 2016 . . . . . . . . . . . . . . . . . . . . . . . . . . . 125
45. Distribution, by monthly benefit and sex, 2016 . . . . . . . . . . . . . . . . . . . . . . . . . . . . . . 127
Awards to Disabled-Worker Families
46. Number, average primary insurance amount, and average monthly family benefit, by family composition, 2016 . . . . . . . . . . . . . . . . . . . . . . . . . . . . . . . . . . . . . . . . . . . . . 128
47. Distribution, by family composition and age of worker, 2016 . . . . . . . . . . . . . . . . . . . . . . . 129
Benefits Withheld from All Disabled Beneficiaries
48. Number, by reason for withholding benefit, December 2016 . . . . . . . . . . . . . . . . . . . . . . . 130
Benefits Terminated for All Disabled Beneficiaries
49. Number and rate, 1960–2016 . . . . . . . . . . . . . . . . . . . . . . . . . . . . . . . . . . . . . . . 131
50. Number, by reason for termination, 2016 . . . . . . . . . . . . . . . . . . . . . . . . . . . . . . . . . 133
51. Number and rate, by state or other area, 2016 . . . . . . . . . . . . . . . . . . . . . . . . . . . . . . 134
Disabled Workers Who Work
52. Distribution of workers with benefits withheld because of substantial work, by diagnostic group and age, December 2016 . . . . . . . . . . . . . . . . . . . . . . . . . . . . . . . . . . . . . . . . . . . 136
53. Distribution or workers with benefits terminated because of successful return to work, by diagnostic group and age, 2016. . . . . . . . . . . . . . . . . . . . . . . . . . . . . . . . . . . . . . . . . . . . 138
viii ♦ Annual Statistical Report on the Social Security Disability Insurance Program, 2016
54. Average monthly benefit for workers with benefits withheld because of substantial work, by diagnostic group and age, December 2016 . . . . . . . . . . . . . . . . . . . . . . . . . . . . . . 140
55. Average monthly benefit for workers with benefits terminated because of successful return to work, by diagnostic group and age, 2016 . . . . . . . . . . . . . . . . . . . . . . . . . . . . . . . . . . . . 141
56. Distribution, by state or other area, 2016 . . . . . . . . . . . . . . . . . . . . . . . . . . . . . . . . . 142
57. Distribution, by sex and age, 2016 . . . . . . . . . . . . . . . . . . . . . . . . . . . . . . . . . . . . 144
58. Work-incentive utilization among disabled workers, 2011–2015 . . . . . . . . . . . . . . . . . . . . . 145
Reinstatement Status for Disabled Workers
59. Number, by expedited reinstatement status, sex, and age, 2016 . . . . . . . . . . . . . . . . . . . . . 146
Outcomes of Applications for Disability Benefits Notes . . . . . . . . . . . . . . . . . . . . . . . . . . . . . . . . . . . . . . . . . . . . . . . . . . . 148
Chart
11. Final outcome of disabled-worker applications, 2006–2015. . . . . . . . . . . . . . . . . . . . . . . . 149
Tables
60. Outcomes at all adjudicative levels, by year of application, 1992–2015. . . . . . . . . . . . . . . . . . 150
61. Medical decisions at the initial adjudicative level, by year of application and program, 1992–2015 . . . 153
62. Medical decisions at the reconsideration level, by year of application and program, 1992–2015 . . . . . 155
63. Medical decisions at the hearing level or above, by year of application and program, 1992–2015 . . . . 157
64. Number and percentage distribution of final medical allowances, by year of application and reason for allowance, 1992–2015 . . . . . . . . . . . . . . . . . . . . . . . . . . . . . . . . . . . . . . . . . 159
65. Number and percentage distribution of final medical denials, by year of application and reason for denial, 1992–2015 . . . . . . . . . . . . . . . . . . . . . . . . . . . . . . . . . . . . . . . . . . . . . 161
Disabled Beneficiaries Receiving Social Security, SSI, or Both
Chart
12. Social Security and SSI beneficiaries aged 18–64 receiving benefits on the basis of disability, December 2016 . . . . . . . . . . . . . . . . . . . . . . . . . . . . . . . . . . . . . . . . . . . . . . 165
Tables
66. Number aged 18–64, by program, December 1996–2016 . . . . . . . . . . . . . . . . . . . . . . . . 166
67. Number aged 18–64 receiving Social Security benefits, and the number also receiving SSI and their average SSI benefit, by state or other area, December 2016 . . . . . . . . . . . . . . . . . . . . . . . 168
68. Number aged 18–64 as a percentage of the resident population aged 18–64, by state, December 2016 . . . . . . . . . . . . . . . . . . . . . . . . . . . . . . . . . . . . . . . . . . . . . . 170
69. Distribution of beneficiaries aged 18–64, by diagnostic group, December 2016 . . . . . . . . . . . . . 172
Appendix and GlossaryAppendix: Sampling Variability . . . . . . . . . . . . . . . . . . . . . . . . . . . . . . . . . . . . . . . . . . 177
Glossary . . . . . . . . . . . . . . . . . . . . . . . . . . . . . . . . . . . . . . . . . . . . . . . . . . . . . 179
Annual Statistical Report on the Social Security Disability Insurance Program, 2016 ♦ 1
Background
History of the Social Security Disability Insurance ProgramWhen President Franklin D. Roosevelt signed the Social Security Act into law on August 14, 1935, the original program was designed to pay benefits only to retired workers aged 65 and older. The amendments of 1939 added two new categories of benefits: pay-ments to the spouse and minor children of a retired worker (known as dependents benefits) and survivors benefits paid to the family of a deceased worker. That change transformed Social Security from a retirement program for individuals into a family based economic security program.
The Social Security Amendments of 1954 initiated the Disability Insurance (DI) program that provided the public with additional coverage against economic insecurity. Effective as of 1955, there was a disability “freeze” of workers’ Social Security records during years when they were unable to work. Although that measure offered no cash benefits, it did prevent such periods of disability from reducing or wiping out retire-ment and survivors benefits. This legislation outlined the work requirements, the definition of disability, the nature of the disability determinations, and the empha-sis on rehabilitation, which are still fundamental to the disability program.
On August 1, 1956, as he signed new disability legislation, President Eisenhower said, “We will … endeavor to administer the disability [program] effi-ciently and effectively, [and] … to help rehabilitate the disabled so that they may return to useful employment …. I am hopeful that the new law … will advance the economic security of the American people.” These amendments provided cash benefits to disabled work-ers aged 50–64 (after a 6-month waiting period) and to adult children of retired, disabled, or deceased workers, if the children had been disabled before the age of 18.
Over the next 4 years, Congress broadened the scope of the program, providing benefits to disabled workers’ dependents in 1958 and permitting disabled workers under the age of 50 to qualify for benefits in 1960. In 1967, the act was further amended to pro-vide benefits for disabled widows and widowers aged 50–64 at a reduced rate.
The Social Security Amendments of 1972 further enhanced the disability program by:
• reducing the waiting period from 6 months to 5;
• increasing from 18 to 22 the age before which a “childhood disability” must have begun;
• extending Medicare coverage to persons who had been receiving disability benefits for 24 consecutive months; and
• establishing the needs-based Supplemental Security Income (SSI) program to replace the Old-Age Assistance, Aid to the Blind, and Aid to Permanently and Totally Disabled programs. The SSI program, unlike the Social Security disability program, provided benefits to disabled children under the age of 18.
Throughout the 1970s, growth in the disability rolls was higher than expected as a result of increased applications. In addition, relatively few beneficiaries were being rehabilitated and returning to work. As a result, Congress enacted legislation in 1980 that:
• limited disability benefit levels,
• tightened administration of the Social Security and SSI disability programs by instituting a review of initial disability decisions and by establishing a periodic review of continuing disability requirements,
• enhanced rehabilitation and work incentive provisions, and
• withheld payment of benefits to incarcerated felons.
In response to concerns arising from the implemen-tation of the 1980 provision regarding the continuing disability review process, Congress passed legislation in 1982 that ensured persons, appealing decisions on the cessation of their disability claim could:
• elect to have benefits and Medicare coverage continued pending review by an administrative law judge, and
• have an opportunity for a face-to-face evidentiary hearing at the reconsideration level of appeal.
Two provisions of the Social Security Amendments of 1983 affected the disability program:
• The age at which full retirement benefits are payable was gradually increased from 65 to 67 to restore financial soundness to the Old-Age, Survivors, and Disability Insurance (OASDI) programs. The increase in full retirement age, which began in 2000, means that disabled workers and widow(er)s may remain on the DI rolls for an additional 2 years before “converting” to age-based benefits. It is also likely that more of these older workers will apply for and become entitled to disability-based benefits because of this change.
2 ♦ Annual Statistical Report on the Social Security Disability Insurance Program, 2016
• Benefits to disabled widow(er)s were improved by decreasing the benefit reduction for beneficiaries under the age of 60 and by continuing payments to certain disabled widow(er)s who remarried.
In 1984, Congress enacted a number of changes affecting the interpretation of disability, such as insti-tuting a “medical improvement standard” in the con-tinuing disability review process, revising the mental impairment listings, and considering the combined effect of all impairments when determining eligibility for benefits.
From 1984 through 1998, many relatively minor legislative changes were made in the Social Security disability program. Those changes provided addi-tional Medicare protection for the disabled, made the definition of disability for disabled widow(er)s the same as that for disabled workers, prohibited eligibility for individuals whose drug addiction or alcoholism was a contributing factor to their impairment, and modified the provisions for a trial work period.
On December 17, 1999, President Clinton signed into law the Ticket to Work and Work Incentives Improvement Act. The purpose of that legislation is to improve the disability program’s work incentives by giving beneficiaries greater choice in seeking reha-bilitation and employment services. The provisions of the act:
• create a Ticket to Work and Self-Sufficiency program that provides disabled beneficiaries with a voucher they may use to obtain vocational rehabilitation services, employment services, and other support services from an employment network of their choice;
• prohibit the Social Security Administration from initiating continuing disability reviews while the beneficiary is using a ticket;
• provide for expedited reinstatement of benefits for individuals whose prior entitlement to disability and health care benefits had been terminated as a result of earnings from work (those former beneficiaries may request reinstatement of benefits without filing a new application);
• establish a community-based work incentives planning and assistance program for the purpose of providing accurate information about work incentives to disabled beneficiaries;
• expand health care services by allowing the states to offer Medicaid buy-in for workers with disabilities even though they may no longer be eligible for disability benefits under Social Security or SSI because their medical condition has improved; and
• allow people with disabilities who return to work to continue their premium-free Medicare Part A coverage for an additional 4½ years beyond the 4 years previously provided. (Medicare Part B can also continue if premiums are paid.)
Definition of DisabilityThe definition of disability under Social Security is different from that used by other disability programs. Social Security pays benefits only for total disability; it does not pay benefits for partial disability or for short-term disability.
To be eligible for benefits a person must:
• be insured for benefits,
• be younger than full retirement age,
• have filed an application for benefits, and
• have a Social Security–defined disability.
Meeting the insured requirement means that a person must have worked long enough—and recently enough—under Social Security. The number of work credits (quarters of coverage) a person needs to qualify for benefits depends on the individual’s age when he or she becomes disabled.
Section 223(d)(1) of the Social Security Act defines disability as an—
(A) inability to engage in any substantial gain-ful activity by reason of any medically determin-able physical or mental impairment which can be expected to result in death or which has lasted or can be expected to last for a continuous period of not less than 12 months, or
(B) in the case of an individual who has attained the age of 55 and is blind (within the meaning of blindness as defined in section 216(i)(1)), inability by reason of such blindness to engage in sub-stantial gainful activity requiring skills or abilities comparable to those of any gainful activity in which the individual has previously engaged with some regularity and over a substantial period of time.
In most cases, a dollar amount is used to indicate whether a person is engaging in substantial gainful activity (SGA). For 2016, the SGA amount was $1,130 per month for a nonblind individual and $1,820 per month for a blind person. Effective January 2001, the SGA level is adjusted annually on the basis of the national average wage index.
Annual Statistical Report on the Social Security Disability Insurance Program, 2016 ♦ 3
A medically determinable physical or mental impair-ment is an impairment that results from anatomical, physiological, or psychological abnormalities that can be shown by medically acceptable clinical and labora-tory diagnostic techniques. An impairment must be established by medical evidence consisting of signs, symptoms, and laboratory findings.
Types of Benefits AvailableThe Social Security program pays benefits to disabled individuals and to certain dependents. Those benefits include the following:
1. Monthly cash benefits, after a 5-month waiting period, for a disabled worker and family. The worker and eligible family members continue to receive benefits, as long as the worker remains disabled, until the worker reaches full retirement age (at which time, the disabled-worker benefit converts to retired-worker benefits) or dies. (Eligible family members would become eligible for retirement- or survivor-based benefits.)
The spouse of a disabled worker is eligible for benefits if he or she is aged 62 or older or has in his or her care a child under the age of 16 or a dis-abled adult child who is entitled to benefits on the worker’s earnings record. Unmarried children are entitled to benefits until they reach age 18, or until age 19 if they are a full-time elementary or second-ary school student.
2. Monthly cash benefits, after a 5-month waiting period, for a disabled widow(er) or a disabled surviving divorced spouse who is aged 50 to full retirement age, referred to in this publication as disabled widow(er)s.
3. Monthly cash benefits payable to disabled adult children of disabled, retired, or deceased workers. Those children must be aged 18 or older and must have become disabled before the age of 22. The 5-month waiting period does not apply to disabled adult children.
4. Medicare benefits, which are available 2 years after the disabled worker, disabled widow(er), or disabled adult child becomes eligible for benefits.
5. Vocational rehabilitation services, which are available for disabled beneficiaries who could return to work if they were provided with some assistance.
Initial Disability Decision-Making ProcessThe disability decision-making process begins when an individual files an application for benefits at a Social Security office. An employee in the office determines if the applicant meets the nonmedical requirements for benefits such as age, work credits, performance of SGA, and relationship to the insured worker. If those requirements are met, the application is sent to the Disability Determination Services (DDS) office in the state where the applicant resides. The DDS then decides whether an individual is disabled under Social Security law.
Disability examiners and medical staff in the DDS office use medical evidence from the applicant’s doctors, hospitals, clinics, or institutions where the individual received treatment. Those medical sources are also asked for information about a person’s ability to do work-related activities, such as walking, sitting, lifting, carrying, and remembering instructions.
The DDS may need more medical information before they can decide a person’s case. If it is not available from the individual’s current medical sources, they may ask the applicant to go to a special examina-tion, called a consultative examination, that is paid for by the Social Security Administration (SSA).
A five-step sequential evaluation process is used to decide if a person is disabled. Those steps are as follows:
1. Is the individual working? If the person is working and earning more than the SGA amount, the person generally cannot be considered disabled. This decision is made by a Social Security employee. If the person is not working at the SGA level, the file goes to the DDS.
2. Is the condition “severe”? A condition must interfere with basic work-related activities for a claim to be considered. If it does not, the person is not found disabled. If it does, the DDS will go to the next step.
3. Does the individual have an impairment that meets or equals one that is described in SSA’s Listing of Impairments? SSA maintains a list of impairments for 14 major body systems: musculoskeletal, special senses and speech, respiratory, cardiovascular, digestive, genitourinary, hemic and lymphatic, skin and subcutaneous tissue, endocrine, multiple body, neurological, mental, neoplastic, and immunologic. Those impairments are so severe that they automatically mean that a person is disabled. If the condition is not on the list, the DDS will have to decide if it is
4 ♦ Annual Statistical Report on the Social Security Disability Insurance Program, 2016
of equal severity to a listed impairment. If it is, the person is found disabled. If not, the DDS goes to the next step.
4. Can the individual do the work he or she previously did? If the person’s condition is severe but not at the same or equal severity as an impairment on the list, then the DDS must determine whether it interferes with a person’s ability to do his or her past work. If it does not, the claim will be denied. If it does, the DDS goes to the next step.
5. Can the individual do any other type of work? To determine an individual’s ability to do other work, the DDS considers the person’s medical conditions, age, education, work experience, and any transferable skills. If the DDS decides the person cannot do other work, the claim will be approved. If the DDS decides that the person can do other work, the claim will be denied.
A person is considered blind if his or her vision can-not be corrected to better than 20/200 in the better eye or if his or her visual field is 20 degrees or less, even with a corrective lens. A number of special rules apply to persons who are blind. Those rules recognize the impact of blindness on a person’s ability to work. For example, the dollar amount used to determine whether a blind individual is engaging in SGA is higher than the limit for a sighted person.
Appeals ProcessIf an applicant’s claim for disability benefits is denied, he or she has the right to appeal that decision. There are four levels of appeals: (1) reconsideration by the state DDS, (2) hearing by an administrative law judge (ALJ), (3) review by the Appeals Council, and (4) federal court review. At each level of appeal, claimants or their representative must file the request for appeal in writing within 60 days from the date of the notice of denial.
Generally, the reconsideration is the first step in the appeals process. The reconsideration is a case review and is similar to the initial determination except that the case is assigned to a different disability examiner and medical team at the DDS. Claimants are given the opportunity to present additional evidence, which is considered along with the evidence that was submit-ted during the initial determination.
If the claim is again denied, the individual may request a hearing before an ALJ. Usually the ALJ will hold a hearing, although the claimant may ask that his or her case be decided on the basis of the written
record without a hearing. At the hearing, the claimant and witnesses testify under oath or affirmation, and the testimony is recorded verbatim. The ALJ, who is responsible for looking into all the issues, receives documentary evidence as well as the testimony of witnesses. The ALJ will allow the claimant, the claim-ant’s representative, or both to present arguments and examine witnesses.
The final step in the administrative appeals process is at the Appeals Council. If the claimant is dissatis-fied with the hearing decision, he or she may request that the Appeals Council review the case. The council, made up of administrative appeals judges, may also, on its own motion, review a decision within 60 days of the ALJ’s decision.
The Appeals Council considers the evidence of record, any additional evidence submitted by the claimant, and the ALJ’s findings and conclusions. The council may grant, deny, or dismiss a request for review. If it agrees to review the case, the council may uphold, modify, or reverse the ALJ’s action, or it may remand it to the ALJ so that he or she may hold another hearing and issue a new decision.
Claimants may file an action in a federal district court within 60 days after the date they receive notice of the Appeals Council’s action. If the U.S. District Court reviews the case record and does not find in favor of the claimant, the claimant can continue with the appellate process to the U.S. Circuit Court of Appeals.
Benefit CalculationsIn addition to meeting the strict medical definition of disability, an individual must also meet an insured-status requirement. To be eligible for disabled-worker benefits, a person must have worked long enough and recently enough under Social Security. A person can earn up to four work credits per year. The amount of earnings required for a credit increases each year as general wage levels rise.
The number of work credits a person needs for dis-ability benefits depends on the individual’s age when he or she becomes disabled. To be fully insured, the maximum number of credits a person needs is 40. To be currently insured, a person generally needs 20 credits earned in the last 10 years ending with the year he or she becomes disabled. However, younger work-ers may qualify with fewer credits.
Dependents of a disabled worker are eligible for benefits if the worker meets both the medical and
Annual Statistical Report on the Social Security Disability Insurance Program, 2016 ♦ 5
insured-status requirements. Disabled widow(er)s and disabled adult children do not need to meet a work requirement themselves, but the worker on whose record they are filing must be insured.
To determine the amount of a person’s monthly cash benefit, SSA uses the following four-step process:
1. Calculate each worker’s average indexed monthly earnings (AIME). First, the worker’s annual covered earnings after 1950 are indexed to reflect the general earnings level in the indexing year—the second calendar year before the year of eligibility (that is, the year a worker becomes disabled). Earnings in years after the indexing year are not indexed but instead are counted at their actual value.
The period used to calculate the AIME equals the number of full calendar years elapsing between age 21 and the year of first eligibility. The actual years used in the computation are the years of highest earnings minus dropout years equal to one-fifth of the number of elapsed years rounded to the next lower integer (to a maximum of 5 dropout years). However, the number of years of earnings used is at least 2. Effective for initial entitlement after June 1980.
Disabled workers who receive fewer than 3 dropout years under the one-fifth rule may be credited with additional dropout years based on child care, up to a total of 3 dropout years. (To receive this credit, a worker must have had no earnings in that year and must have been living with a child under age 3.) However, the number of years of earnings used is at least 2. Effective for July 1981.
The AIME is calculated as the sum of the highest year’s earnings, divided by the number of months in the computation period.
2. Compute the primary insurance amount (PIA). The formula used to compute the PIA from the AIME is weighted to provide a higher PIA-to-AIME ratio for workers with low earnings. For workers who become disabled in 2016, the PIA is equal to the sum of:
90 percent of the first $856 of AIME, plus 32 percent of the next $4,301 of AIME, plus 15 percent of AIME over $5,157.
When subsequent retirement benefits are com-puted at conversion to retired-worker benefits at the full retirement age (FRA), or at retirement for a worker who earlier recovered from a disability, the years of disability are disregarded from the
PIA calculation. That preserves insured status and benefit level.
Alternative methods of computing the PIA apply to workers who have low earnings but a steady work history over most of their adult years and to work-ers who also receive a pension based on their own noncovered work.
3. Compute the family maximum (FMAX). Monthly benefits payable to the worker and family members or to the worker’s survivors are limited to a maximum family benefit amount. The family maximum level for retired-worker families or survivors usually ranges from 150 percent to 188 percent of the worker’s PIA. The maximum benefit for disabled-worker families ranges from the smaller of 85 percent of AIME (or 100 percent of the PIA, if larger) to about 150 percent of the PIA.
Beginning with the first year of eligibility, the PIA and FMAX are increased by cost-of-living adjustments.
4. Compute the person’s monthly benefit amount (MBA). Disabled workers and persons retiring at the FRA are paid 100 percent of the PIA. The PIA is reduced for workers who retire between the age of 62 and the FRA. If a disabled worker receives reduced retirement benefits before disability entitlement, the disability benefit is reduced by the number of months for which he or she received reduced retirement benefits.
Dependents of retired or disabled workers may receive up to 50 percent of the PIA. Disabled adult children of deceased workers may receive up to 75 percent of the PIA.
Disabled widow(er)s aged 50–60 may receive up to 71.5 percent of the PIA. Disabled widow(er)s aged 60 to the FRA may receive up to 100 percent of the PIA, but benefits are reduced for age, with a maximum reduction of 28.5 percent.
All monthly benefits are limited by the family maximum, so dependents may not receive their full MBA.
Benefits Offset and WithheldDisabled-worker and dependents’ benefits may be offset if the disabled worker receives workers’ com-pensation (WC) or other public disability benefits (PDB). The Social Security Amendments of 1965 require that benefits be reduced when the worker is also eligible for periodic or lump-sum WC/PDB pay-ments, so that the combined amounts of the disabled worker’s and family’s Social Security benefits plus
6 ♦ Annual Statistical Report on the Social Security Disability Insurance Program, 2016
the WC/PDB payment do not exceed 80 percent of the worker’s average current earnings. The combined payments after reduction are never less than what the total Social Security benefits were before reduction. The reduction continues until the month the worker reaches age 65 or the month the WC/PDB payment stops, whichever comes first.
If a spouse or disabled widow(er) worked for a federal, state, or local government to which he or she did not pay Social Security taxes, the pension he or she receives from that agency may reduce his or her Social Security benefits. That provision is known as the government pension offset. The offset will reduce the amount of the Social Security benefit by two-thirds of the amount of the government pension.
The annual earnings test applies to nondisabled beneficiaries under the FRA. Benefits for those ben-eficiaries are withheld $1 for every $2 they earn above the annual earnings limit. In the calendar year a bene-ficiary attains the FRA, for months before the FRA, $1 is withheld for every $3 earned over the annual earn-ings limit for that age group. A retired worker’s earn-ings will also affect his or her dependents’ benefits, including those of disabled adult children. In addition, a spouse’s earnings may affect benefits for his or her children. (How a disabled beneficiary’s work affects his or her benefit is discussed in the next section.)
Other reasons for withholding benefits include spouses who no longer have an entitled child in their care, beneficiaries who are incarcerated, or beneficia-ries whose whereabouts are unknown.
Work IncentivesSpecial rules make it possible for disabled benefi-ciaries to work and still receive monthly benefits and Medicare or Medicaid. Those rules are known as work incentives.
Disabled beneficiaries are encouraged to return to work by providing a trial work period (TWP) and an extended period of eligibility (EPE). During the TWP, earnings are allowed to exceed the SGA dollar amount for 9 months. During the 3-year EPE that follows the TWP, benefits are withheld only for those months in which earnings exceed the SGA amount. After the end of the EPE, monthly benefits are terminated when earnings exceed the SGA amount. Certain impair-ment-related expenses that a person needs to make in order to work may be deducted when counting earnings to determine whether the work is substantial. Even if cash benefits are withheld, Medicare and Med-icaid coverage can continue.
The Ticket to Work and Work Incentives Improve-ment Act has further improved work incentives. That law substantially expands work opportunities for people with disabilities. The provisions of the law become effective at different times in different parts of the country. The provisions below apply to Social Security and SSI.
1. Ticket to Work and Self-Sufficiency Program. Starting in 2002, some Social Security and SSI disability beneficiaries received a “ticket” that they may use to obtain vocational rehabilitation and other employment-support services from an approved provider of their choice. The program is voluntary and will be phased in nationally over a 3-year period.
2. Expanded Availability of Health Care Services. As of October 1, 2000, the law expands Medicaid and Medicare coverage to more people with disabilities who work. It extends Medicare Part A premium-free coverage for 93 months after the trial work period for most disabled beneficiaries who work.
In addition, states now have the option to expand Medicaid coverage to workers with disabilities using income and resource limits set by the states.
3. Expedited Benefits. Effective January 1, 2001, if a person’s Social Security or SSI disability benefits have ended because of earnings from work and if he or she becomes unable to work again within 60 months because of his or her medical condition, the person would be able to request reinstatement of benefits, including Medicare and Medicaid, without filing a new application.
4. Disability Reviews Postponed. Effective January 1, 2001, an individual using a “ticket” does not need to undergo the regularly scheduled disability reviews. Effective January 1, 2002, people who have been receiving Social Security disability benefits for at least 24 months will not be asked to go through a disability review because of the work they are doing. However, regularly scheduled medical reviews could still be performed and benefits could be terminated if earnings were above the limits.
5. Work Incentives Outreach Program. The law directs the Social Security Administration to establish a community-based work incentives planning and assistance program to disseminate accurate information about work incentives and to give beneficiaries more choice. SSA has established a program of cooperative agreements and contracts to provide benefits planning and assistance to all disabled beneficiaries, including
Annual Statistical Report on the Social Security Disability Insurance Program, 2016 ♦ 7
information about the availability of protection and advocacy services.
6. Protection and Advocacy. The law authorizes SSA to make payments to protection and advocacy systems established in each state to provide information, advice, and legal services to disability beneficiaries.
More information about work incentives is available at https://www.socialsecurity.gov/work.
Benefit TerminationIn general, benefits continue as long as a person remains disabled. However, under Social Security law, all disability cases must be reviewed from time to time to make sure that people receiving benefits continue to meet the disability requirements. Benefits continue unless there is strong proof that a person’s impairment has medically improved and that he or she is able to return to work.
How often a case is reviewed depends on the severity of the impairment and the likelihood of improvement. The frequency can range from 6 months to 7 years. Here are general guidelines for reviews.
• Improvement expected—If medical improvement can be predicted when benefits start, the first review will be 6 to 18 months later.
• Improvement possible—If medical improvement is possible but cannot be predicted, the case will be reviewed about every 3 years.
• Improvement not expected—If medical improvement is not likely, the case will be reviewed about once every 5 to 7 years.
During a review, the disabled beneficiary is asked to provide information about any medical treatment he or she has received and any work he or she might have done. An evaluation team, which includes a disability examiner and a doctor, then requests the individual’s
medical records and carefully reviews his or her file. If the team decides a person is still disabled, ben-efits will continue. If they decide that the person is no longer disabled, the individual can file an appeal if he or she disagrees with the determination. Otherwise, benefits stop 3 months after the beneficiary is notified that his or her disability ended.
Benefits for dependents continue as long as the disabled worker continues to be entitled to benefits. However, a person’s benefits may be terminated for other reasons. The most common reasons to termi-nate benefits are the following:
• The beneficiary dies. If the deceased was the worker, eligible dependents may become entitled to survivors’ benefits.
• The disabled worker or disabled widow(er) attains the FRA, and their benefit is automatically converted to retired-worker benefits or aged widow(er) benefits, respectively.
• The disabled beneficiary is no longer disabled because of medical recovery or successful reentry to the workforce.
• A spouse and worker divorce (with some exceptions).
• Certain divorced spouses remarry.
• A spouse no longer has a child under the age of 16 or a disabled child in his or her care.
• A child reaches age 18.
• A student reaches age 19 or is no longer attending elementary or secondary school full time.
• Dependent children marry.
• Dependents become entitled to another equal or larger benefit.
Benefits usually stop effective with the month the terminating event occurred.

Beneficiaries in Current- Payment Status

Annual Statistical Report on the Social Security Disability Insurance Program, 2016 ♦ 11
Beneficiaries in Current-Payment Status
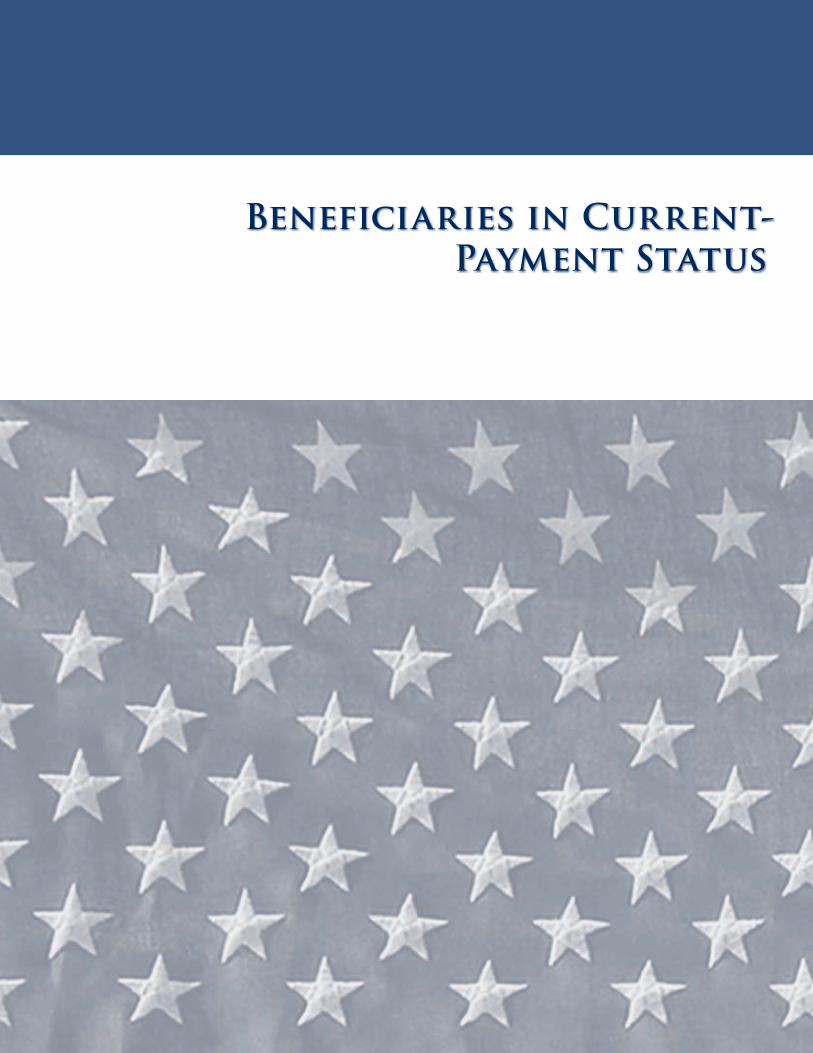
Chart 1.All Social Security disabled beneficiaries in current-payment status, December 2016
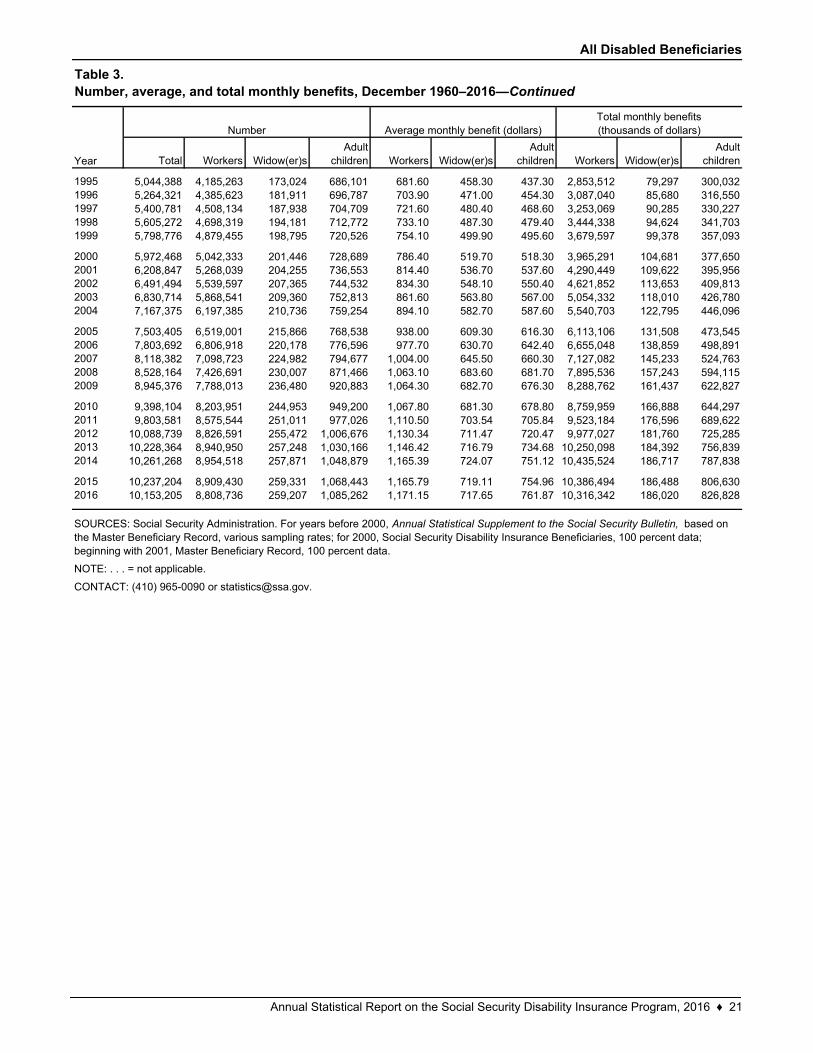
In December 2016, there were 10,153,205 people receiving Social Security disability benefits as disabled workers, disabled widow(er)s, or disabled adult children. The majority (86.8 percent) were disabled workers, 10.7 percent were disabled adult children, and 2.6 percent were disabled widow(er)s.
SOURCE: Table 3.
NOTE: Totals do not necessarily equal the sum of rounded components.
Disabled adult children
10.7%
Disabledwidow(er)s
2.6%
Disabledworkers86.8%
12 ♦ Annual Statistical Report on the Social Security Disability Insurance Program, 2016
Beneficiaries in Current-Payment Status
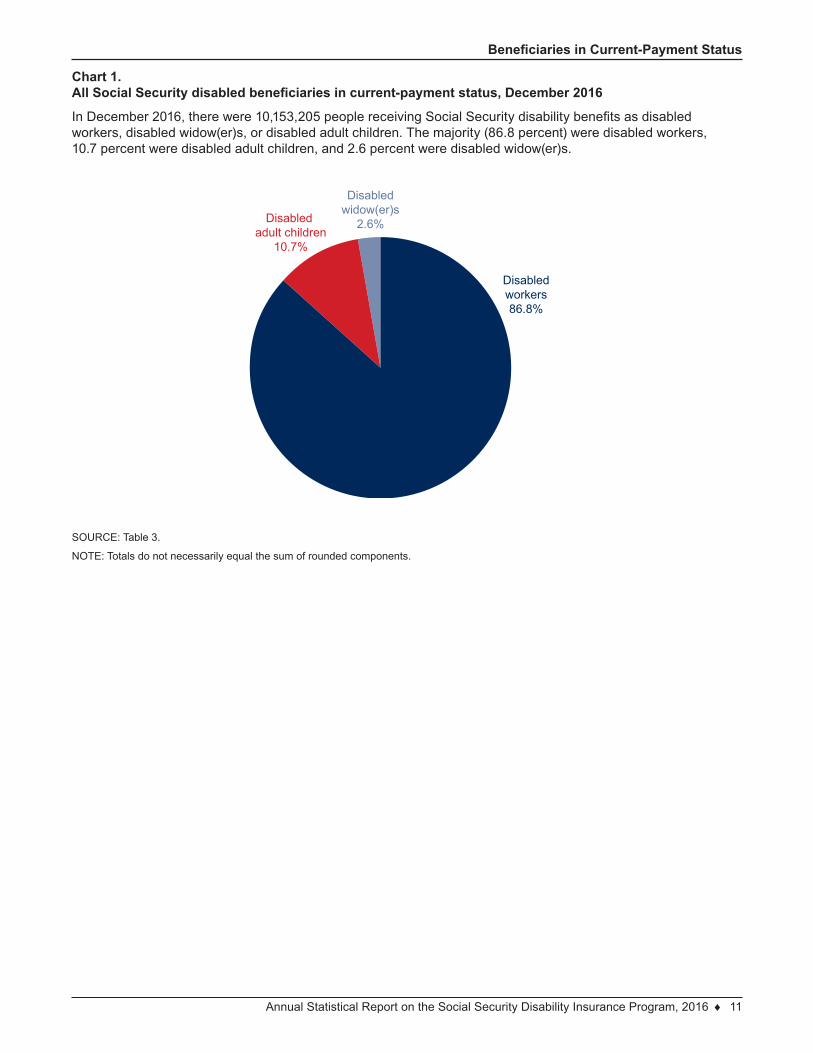
Chart 2.All Social Security disabled beneficiaries in current-payment status, December 1970–2016
The number of disabled beneficiaries has risen from 1,812,786 in 1970 to 10,153,205 in 2016, driven predominately by an increase in the number of disabled workers. The number of disabled adult children has grown slightly, and the number of disabled widow(er)s has remained fairly level. In December 2016, there were 8,808,736 disabled workers; 1,085,262 disabled adult children; and 259,207 disabled widow(er)s receiving disability benefits.
SOURCE: Table 3.
1970 1975 1980 1985 1990 1995 2000 2005 2010 20160
2
4
6
8
10
12Millions
Disabled widow(er)s
Disabled adult children
Disabled workers
Annual Statistical Report on the Social Security Disability Insurance Program, 2016 ♦ 13
Beneficiaries in Current-Payment Status
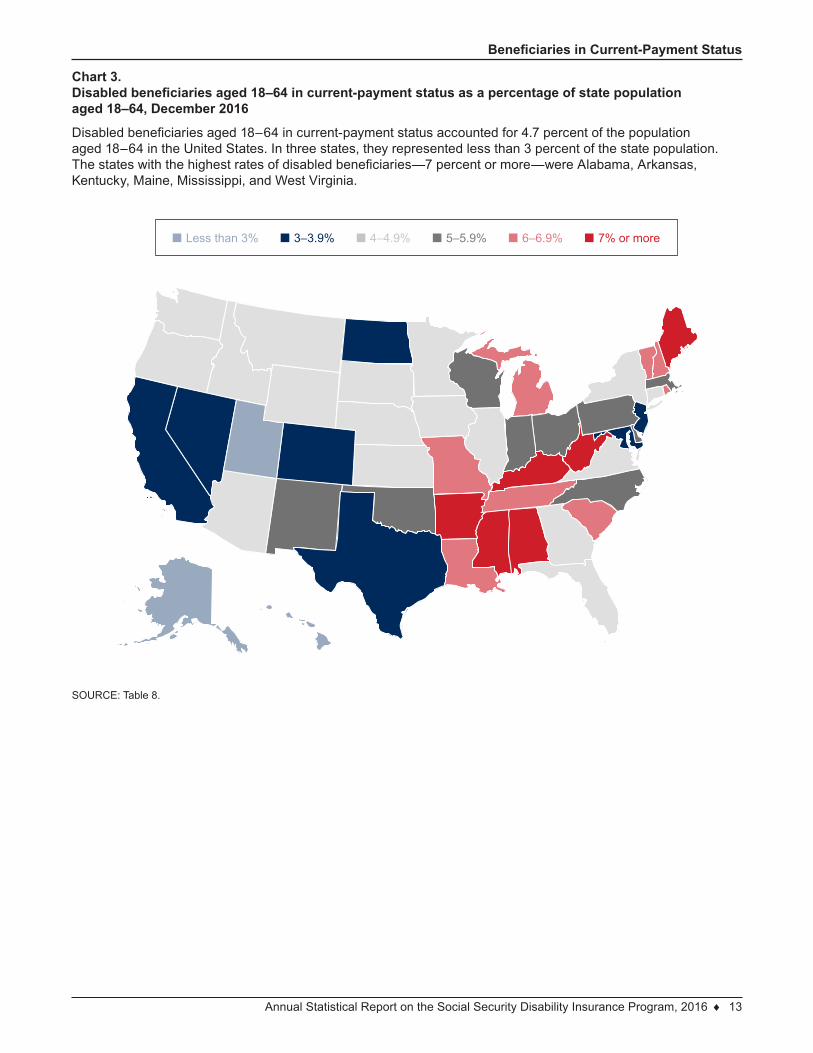
Chart 3.Disabled beneficiaries aged 18–64 in current-payment status as a percentage of state population aged 18–64, December 2016
Disabled beneficiaries aged 18–64 in current-payment status accounted for 4.7 percent of the population aged 18–64 in the United States. In three states, they represented less than 3 percent of the state population. The states with the highest rates of disabled beneficiaries—7 percent or more—were Alabama, Arkansas, Kentucky, Maine, Mississippi, and West Virginia.
SOURCE: Table 8.
■ Less than 3% ■ 3–3.9% ■ 4–4.9% ■ 5–5.9% ■ 6–6.9% ■ 7% or more
14 ♦ Annual Statistical Report on the Social Security Disability Insurance Program, 2016
Beneficiaries in Current-Payment Status
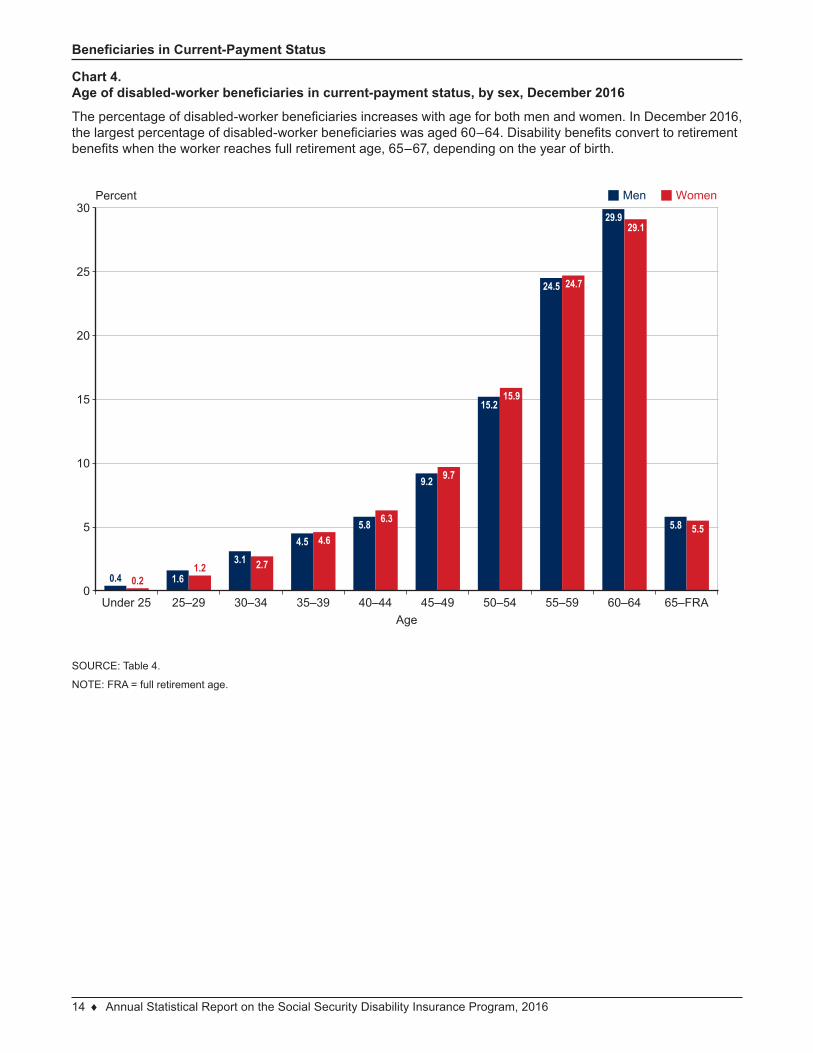
Chart 4.Age of disabled-worker beneficiaries in current-payment status, by sex, December 2016
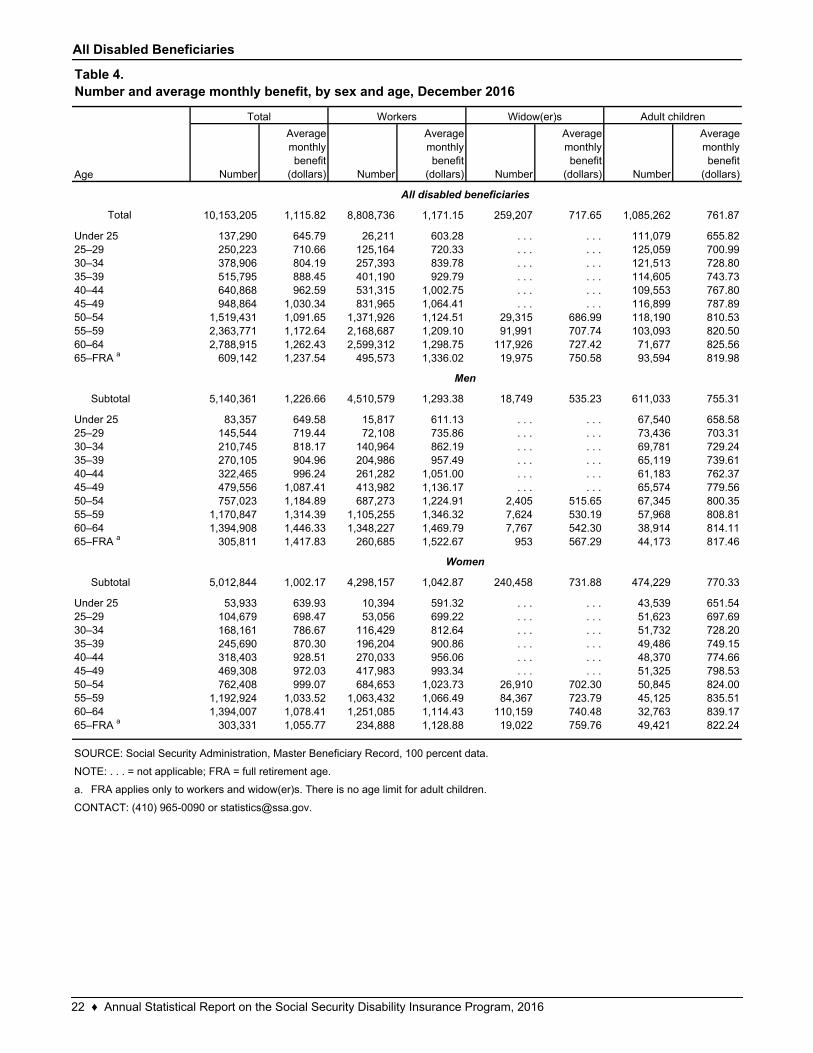
The percentage of disabled-worker beneficiaries increases with age for both men and women. In December 2016, the largest percentage of disabled-worker beneficiaries was aged 60–64. Disability benefits convert to retirement benefits when the worker reaches full retirement age, 65–67, depending on the year of birth.
0.4 0.2 1.61.2
3.1 2.7
4.5 4.65.8 6.3
9.2 9.7
15.215.9
24.5 24.7
29.929.1
5.8 5.5
0
5
10
15
20
25
30Percent
Under 25 25–29 30–34 35–39 40–44 45–49 50–54 55–59 60–64 65–FRAAge
Men Women
SOURCE: Table 4.
NOTE: FRA = full retirement age.
Annual Statistical Report on the Social Security Disability Insurance Program, 2016 ♦ 15
Beneficiaries in Current-Payment Status
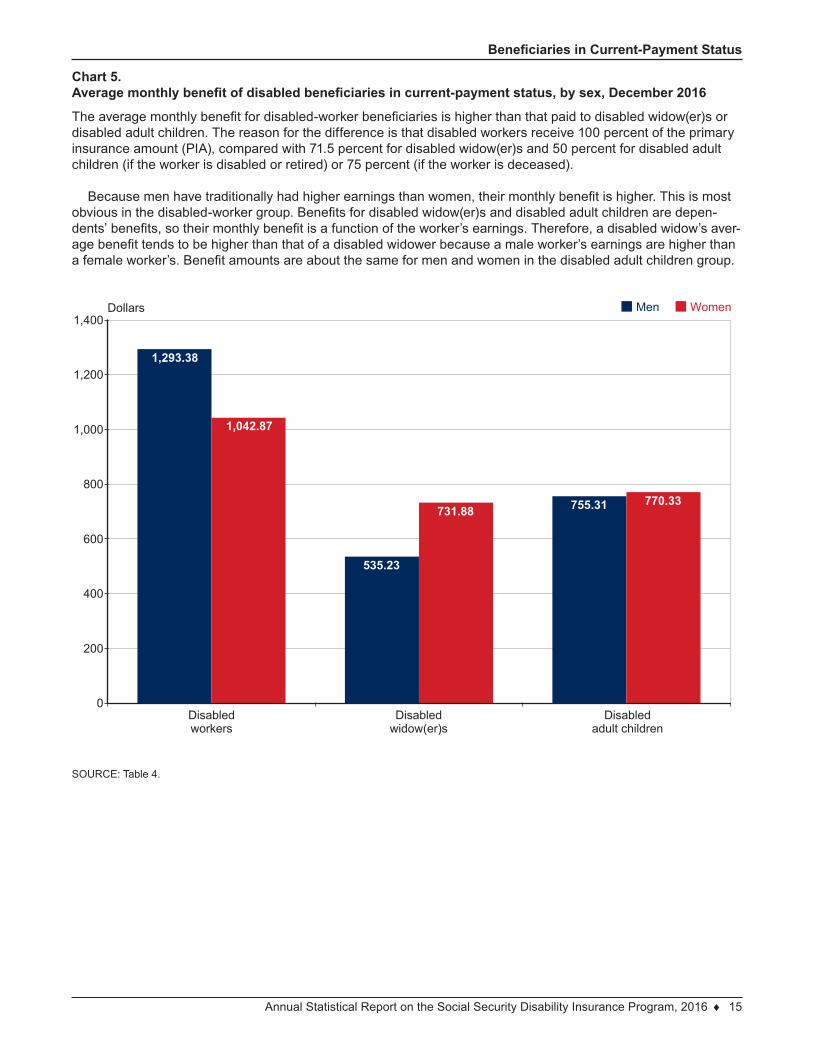
Chart 5.Average monthly benefit of disabled beneficiaries in current-payment status, by sex, December 2016
The average monthly benefit for disabled-worker beneficiaries is higher than that paid to disabled widow(er)s or disabled adult children. The reason for the difference is that disabled workers receive 100 percent of the primary insurance amount (PIA), compared with 71.5 percent for disabled widow(er)s and 50 percent for disabled adult children (if the worker is disabled or retired) or 75 percent (if the worker is deceased).
Because men have traditionally had higher earnings than women, their monthly benefit is higher. This is most obvious in the disabled-worker group. Benefits for disabled widow(er)s and disabled adult children are depen-dents’ benefits, so their monthly benefit is a function of the worker’s earnings. Therefore, a disabled widow’s aver-age benefit tends to be higher than that of a disabled widower because a male worker’s earnings are higher than a female worker’s. Benefit amounts are about the same for men and women in the disabled adult children group.
SOURCE: Table 4.
1,293.38
1,042.87
535.23
731.88 755.31 770.33
Disabledworkers
Disabledwidow(er)s
Disabledadult children
0
200
400
600
800
1,000
1,200
1,400Dollars Men Women
16 ♦ Annual Statistical Report on the Social Security Disability Insurance Program, 2016
Beneficiaries in Current-Payment Status
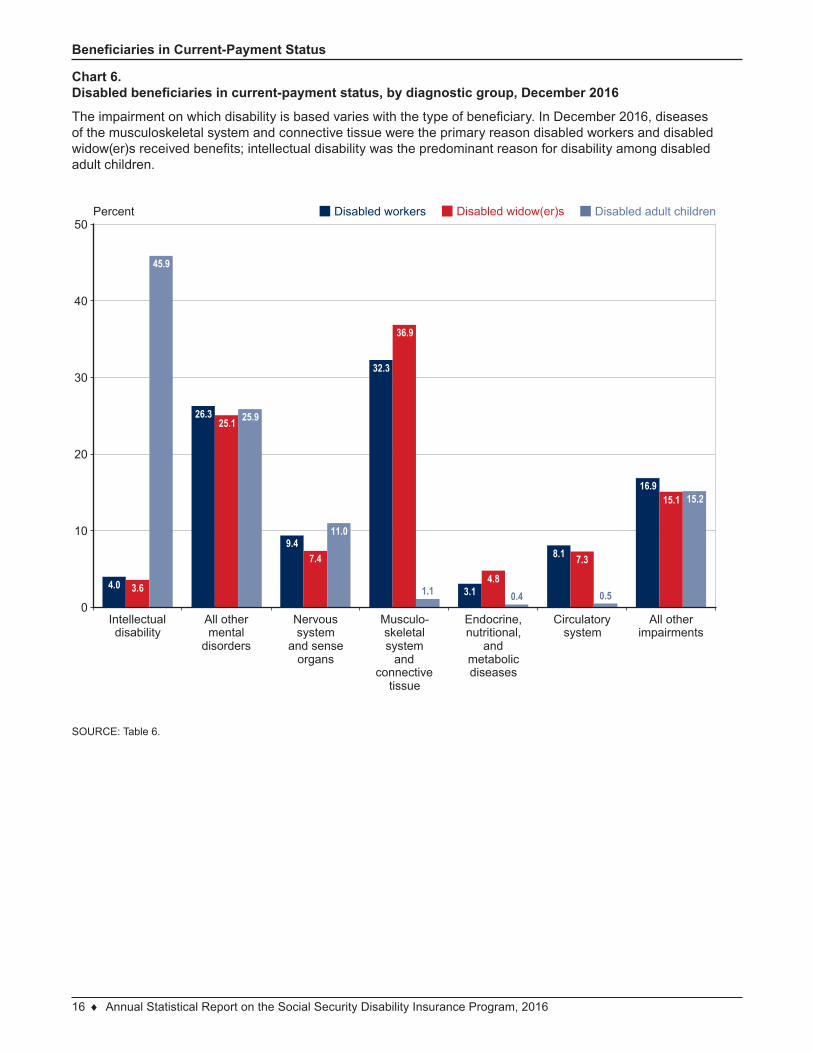
Chart 6.Disabled beneficiaries in current-payment status, by diagnostic group, December 2016
The impairment on which disability is based varies with the type of beneficiary. In December 2016, diseases of the musculoskeletal system and connective tissue were the primary reason disabled workers and disabled widow(er)s received benefits; intellectual disability was the predominant reason for disability among disabled adult children.
4.0 3.6
45.9
26.325.1 25.9
9.47.4
11.0
32.3
36.9
1.1 3.14.8
0.4
8.1 7.3
0.5
16.915.1 15.2
0
10
20
30
40
50Percent Disabled workers Disabled widow(er)s Disabled adult children
Intellectualdisability
All othermental
disorders
Nervoussystem
and senseorgans
Musculo-skeletalsystem
andconnective
tissue
Endocrine,nutritional,
andmetabolicdiseases
Circulatorysystem
All otherimpairments
SOURCE: Table 6.
Disabled Beneficiaries and Nondisabled Dependents
Workers SpousesChildren
under age 18Students
aged 18–19Retired workers
Deceased workers
Disabled workers
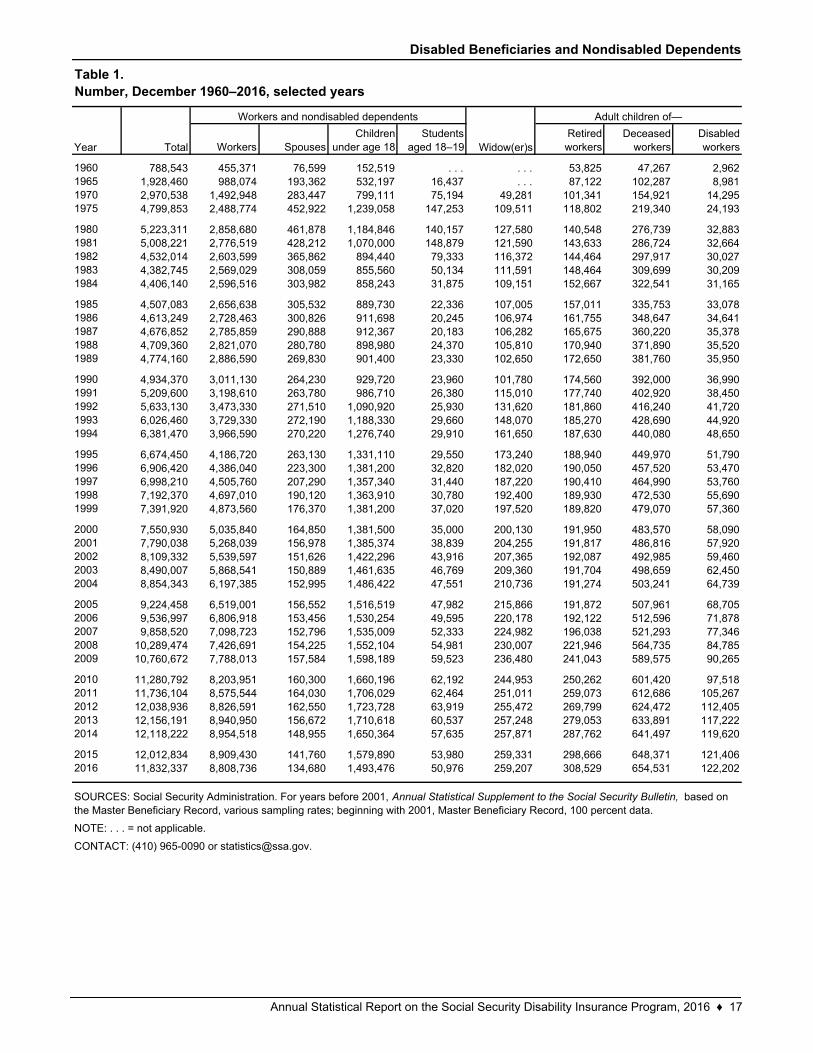
1960 788,543 455,371 76,599 152,519 . . . . . . 53,825 47,267 2,9621965 1,928,460 988,074 193,362 532,197 16,437 . . . 87,122 102,287 8,9811970 2,970,538 1,492,948 283,447 799,111 75,194 49,281 101,341 154,921 14,2951975 4,799,853 2,488,774 452,922 1,239,058 147,253 109,511 118,802 219,340 24,193
1980 5,223,311 2,858,680 461,878 1,184,846 140,157 127,580 140,548 276,739 32,8831981 5,008,221 2,776,519 428,212 1,070,000 148,879 121,590 143,633 286,724 32,6641982 4,532,014 2,603,599 365,862 894,440 79,333 116,372 144,464 297,917 30,0271983 4,382,745 2,569,029 308,059 855,560 50,134 111,591 148,464 309,699 30,2091984 4,406,140 2,596,516 303,982 858,243 31,875 109,151 152,667 322,541 31,165
1985 4,507,083 2,656,638 305,532 889,730 22,336 107,005 157,011 335,753 33,0781986 4,613,249 2,728,463 300,826 911,698 20,245 106,974 161,755 348,647 34,6411987 4,676,852 2,785,859 290,888 912,367 20,183 106,282 165,675 360,220 35,3781988 4,709,360 2,821,070 280,780 898,980 24,370 105,810 170,940 371,890 35,5201989 4,774,160 2,886,590 269,830 901,400 23,330 102,650 172,650 381,760 35,950
1990 4,934,370 3,011,130 264,230 929,720 23,960 101,780 174,560 392,000 36,9901991 5,209,600 3,198,610 263,780 986,710 26,380 115,010 177,740 402,920 38,4501992 5,633,130 3,473,330 271,510 1,090,920 25,930 131,620 181,860 416,240 41,7201993 6,026,460 3,729,330 272,190 1,188,330 29,660 148,070 185,270 428,690 44,9201994 6,381,470 3,966,590 270,220 1,276,740 29,910 161,650 187,630 440,080 48,650
1995 6,674,450 4,186,720 263,130 1,331,110 29,550 173,240 188,940 449,970 51,7901996 6,906,420 4,386,040 223,300 1,381,200 32,820 182,020 190,050 457,520 53,4701997 6,998,210 4,505,760 207,290 1,357,340 31,440 187,220 190,410 464,990 53,7601998 7,192,370 4,697,010 190,120 1,363,910 30,780 192,400 189,930 472,530 55,6901999 7,391,920 4,873,560 176,370 1,381,200 37,020 197,520 189,820 479,070 57,360
2000 7,550,930 5,035,840 164,850 1,381,500 35,000 200,130 191,950 483,570 58,0902001 7,790,038 5,268,039 156,978 1,385,374 38,839 204,255 191,817 486,816 57,9202002 8,109,332 5,539,597 151,626 1,422,296 43,916 207,365 192,087 492,985 59,4602003 8,490,007 5,868,541 150,889 1,461,635 46,769 209,360 191,704 498,659 62,4502004 8,854,343 6,197,385 152,995 1,486,422 47,551 210,736 191,274 503,241 64,739
2005 9,224,458 6,519,001 156,552 1,516,519 47,982 215,866 191,872 507,961 68,7052006 9,536,997 6,806,918 153,456 1,530,254 49,595 220,178 192,122 512,596 71,8782007 9,858,520 7,098,723 152,796 1,535,009 52,333 224,982 196,038 521,293 77,3462008 10,289,474 7,426,691 154,225 1,552,104 54,981 230,007 221,946 564,735 84,7852009 10,760,672 7,788,013 157,584 1,598,189 59,523 236,480 241,043 589,575 90,265
2010 11,280,792 8,203,951 160,300 1,660,196 62,192 244,953 250,262 601,420 97,5182011 11,736,104 8,575,544 164,030 1,706,029 62,464 251,011 259,073 612,686 105,2672012 12,038,936 8,826,591 162,550 1,723,728 63,919 255,472 269,799 624,472 112,4052013 12,156,191 8,940,950 156,672 1,710,618 60,537 257,248 279,053 633,891 117,2222014 12,118,222 8,954,518 148,955 1,650,364 57,635 257,871 287,762 641,497 119,620
2015 12,012,834 8,909,430 141,760 1,579,890 53,980 259,331 298,666 648,371 121,4062016 11,832,337 8,808,736 134,680 1,493,476 50,976 259,207 308,529 654,531 122,202
SOURCES: Social Security Administration. For years before 2001, Annual Statistical Supplement to the Social Security Bulletin, based on the Master Beneficiary Record, various sampling rates; beginning with 2001, Master Beneficiary Record, 100 percent data.
NOTE: . . . = not applicable.
CONTACT: (410) 965-0090 or [email protected].
Table 1.Number, December 1960–2016, selected years
Year Total
Workers and nondisabled dependents
Widow(er)s
Adult children of—
Annual Statistical Report on the Social Security Disability Insurance Program, 2016 ♦ 17
Disabled Beneficiaries and Nondisabled Dependents
NumberAverage monthly
benefit (dollars) NumberAverage monthly
benefit (dollars) NumberAverage monthly
benefit (dollars)
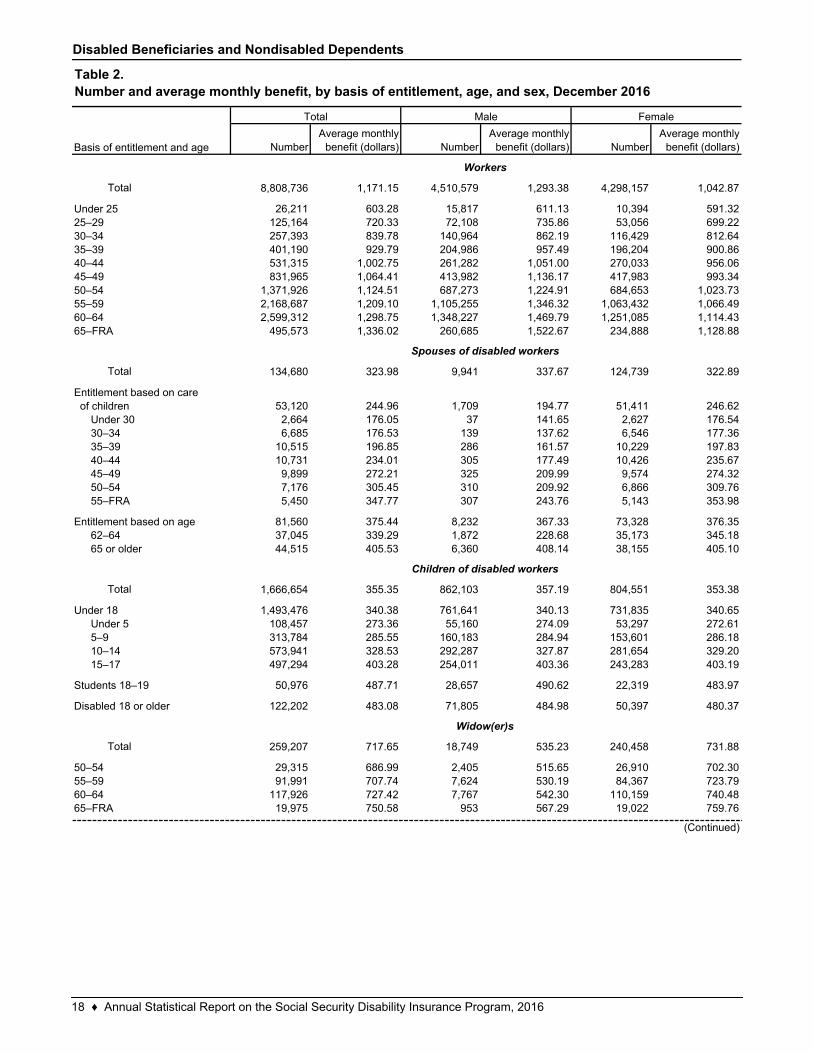
Total 8,808,736 1,171.15 4,510,579 1,293.38 4,298,157 1,042.87
26,211 603.28 15,817 611.13 10,394 591.32125,164 720.33 72,108 735.86 53,056 699.22257,393 839.78 140,964 862.19 116,429 812.64401,190 929.79 204,986 957.49 196,204 900.86531,315 1,002.75 261,282 1,051.00 270,033 956.06831,965 1,064.41 413,982 1,136.17 417,983 993.34
1,371,926 1,124.51 687,273 1,224.91 684,653 1,023.732,168,687 1,209.10 1,105,255 1,346.32 1,063,432 1,066.492,599,312 1,298.75 1,348,227 1,469.79 1,251,085 1,114.43
495,573 1,336.02 260,685 1,522.67 234,888 1,128.88
Total 134,680 323.98 9,941 337.67 124,739 322.89
53,120 244.96 1,709 194.77 51,411 246.622,664 176.05 37 141.65 2,627 176.546,685 176.53 139 137.62 6,546 177.36
10,515 196.85 286 161.57 10,229 197.8310,731 234.01 305 177.49 10,426 235.679,899 272.21 325 209.99 9,574 274.327,176 305.45 310 209.92 6,866 309.765,450 347.77 307 243.76 5,143 353.98
81,560 375.44 8,232 367.33 73,328 376.3537,045 339.29 1,872 228.68 35,173 345.1844,515 405.53 6,360 408.14 38,155 405.10
Total 1,666,654 355.35 862,103 357.19 804,551 353.38
1,493,476 340.38 761,641 340.13 731,835 340.65108,457 273.36 55,160 274.09 53,297 272.61313,784 285.55 160,183 284.94 153,601 286.18573,941 328.53 292,287 327.87 281,654 329.20497,294 403.28 254,011 403.36 243,283 403.19
50,976 487.71 28,657 490.62 22,319 483.97
122,202 483.08 71,805 484.98 50,397 480.37
Total 259,207 717.65 18,749 535.23 240,458 731.88
29,315 686.99 2,405 515.65 26,910 702.3091,991 707.74 7,624 530.19 84,367 723.79
117,926 727.42 7,767 542.30 110,159 740.4819,975 750.58 953 567.29 19,022 759.76
60–6465–FRA
45–4950–54
55–59
Entitlement based on age62–6465 or older
Under 18Under 55–910–1415–17
Students 18–19
Disabled 18 or older
50–54
Children of disabled workers
Basis of entitlement and age
Under 2525–2930–3435–39
55–FRA
50–5455–5960–6465–FRA
Entitlement based on care of children
Under 3030–3435–3940–44
Widow(er)s
Table 2.Number and average monthly benefit, by basis of entitlement, age, and sex, December 2016
Total Male Female
(Continued)
40–4445–49
Workers
Spouses of disabled workers
18 ♦ Annual Statistical Report on the Social Security Disability Insurance Program, 2016
Disabled Beneficiaries and Nondisabled Dependents
NumberAverage monthly
benefit (dollars) NumberAverage monthly
benefit (dollars) NumberAverage monthly
benefit (dollars)
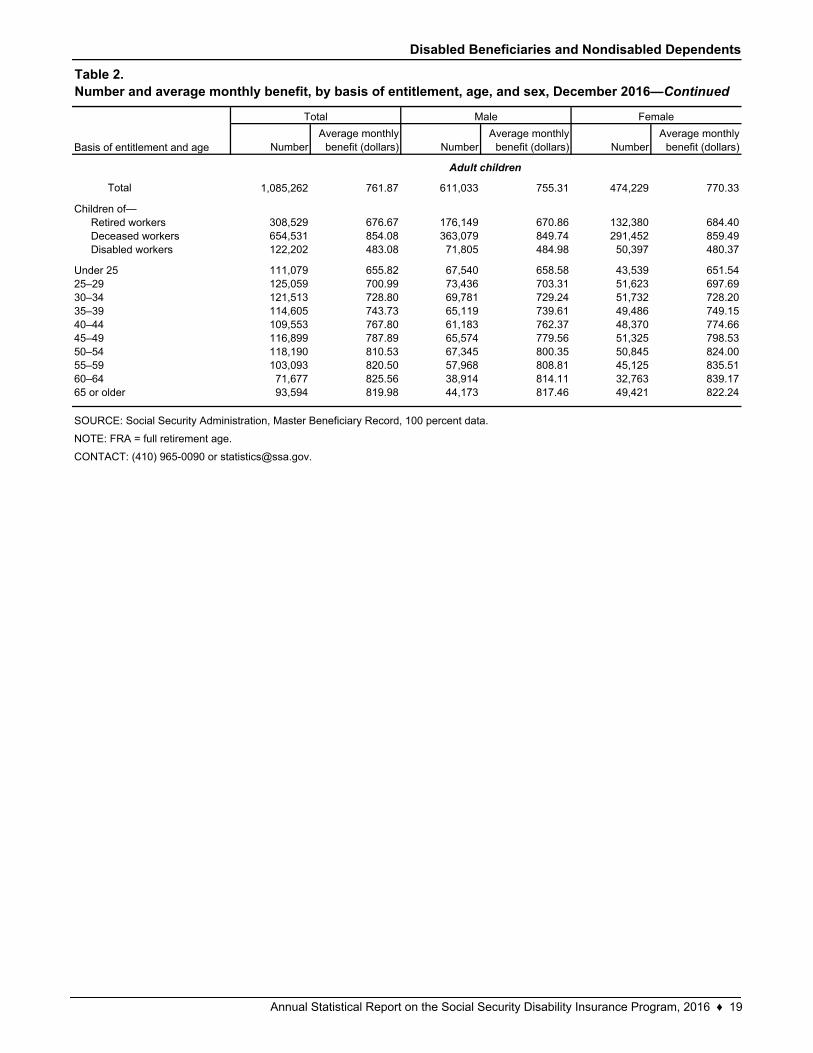
Total 1,085,262 761.87 611,033 755.31 474,229 770.33
308,529 676.67 176,149 670.86 132,380 684.40654,531 854.08 363,079 849.74 291,452 859.49122,202 483.08 71,805 484.98 50,397 480.37
111,079 655.82 67,540 658.58 43,539 651.54125,059 700.99 73,436 703.31 51,623 697.69121,513 728.80 69,781 729.24 51,732 728.20114,605 743.73 65,119 739.61 49,486 749.15109,553 767.80 61,183 762.37 48,370 774.66116,899 787.89 65,574 779.56 51,325 798.53118,190 810.53 67,345 800.35 50,845 824.00103,093 820.50 57,968 808.81 45,125 835.5171,677 825.56 38,914 814.11 32,763 839.1793,594 819.98 44,173 817.46 49,421 822.24
NOTE: FRA = full retirement age.
CONTACT: (410) 965-0090 or [email protected].
50–5455–5960–6465 or older
SOURCE: Social Security Administration, Master Beneficiary Record, 100 percent data.
45–49
Children of—Retired workersDeceased workersDisabled workers
Under 2525–2930–3435–3940–44
Adult children
Table 2.Number and average monthly benefit, by basis of entitlement, age, and sex, December 2016—Continued
Basis of entitlement and age
Total Male Female
Annual Statistical Report on the Social Security Disability Insurance Program, 2016 ♦ 19
All Disabled Beneficiaries
Total Workers Widow(er)sAdult
children Workers Widow(er)sAdult
children Workers Widow(er)sAdult
children
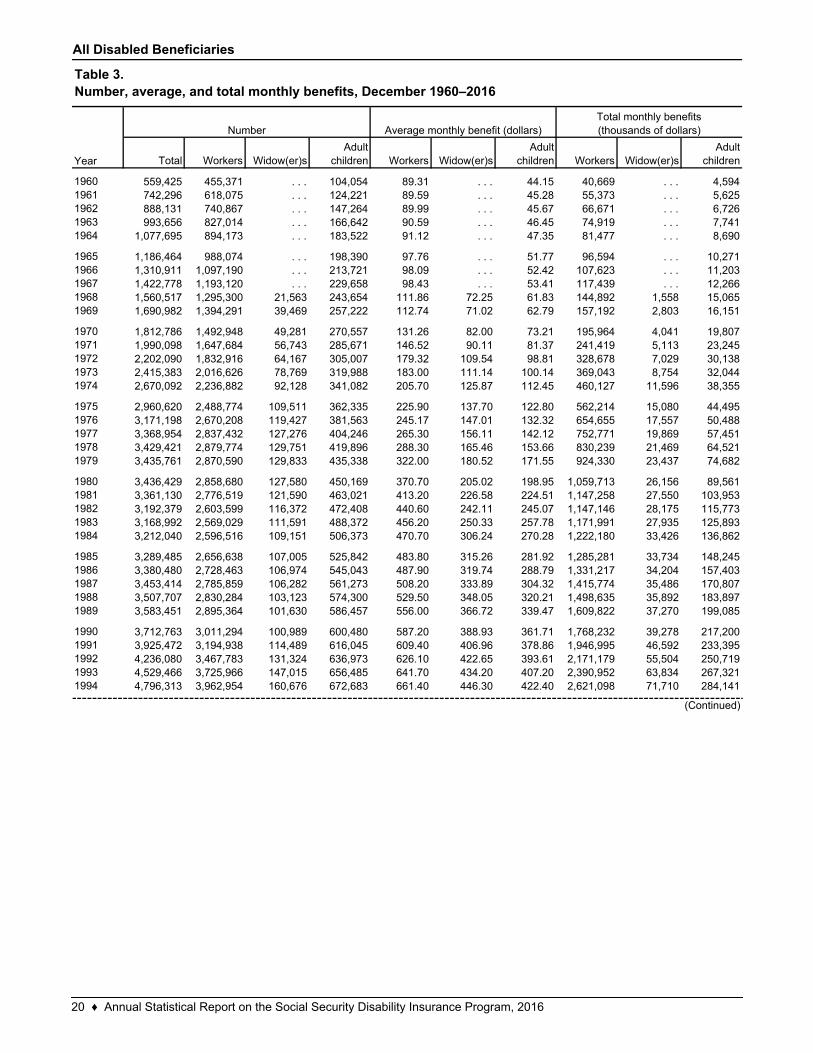
1960 559,425 455,371 . . . 104,054 89.31 . . . 44.15 40,669 . . . 4,5941961 742,296 618,075 . . . 124,221 89.59 . . . 45.28 55,373 . . . 5,6251962 888,131 740,867 . . . 147,264 89.99 . . . 45.67 66,671 . . . 6,7261963 993,656 827,014 . . . 166,642 90.59 . . . 46.45 74,919 . . . 7,7411964 1,077,695 894,173 . . . 183,522 91.12 . . . 47.35 81,477 . . . 8,690
1965 1,186,464 988,074 . . . 198,390 97.76 . . . 51.77 96,594 . . . 10,2711966 1,310,911 1,097,190 . . . 213,721 98.09 . . . 52.42 107,623 . . . 11,2031967 1,422,778 1,193,120 . . . 229,658 98.43 . . . 53.41 117,439 . . . 12,2661968 1,560,517 1,295,300 21,563 243,654 111.86 72.25 61.83 144,892 1,558 15,0651969 1,690,982 1,394,291 39,469 257,222 112.74 71.02 62.79 157,192 2,803 16,151
1970 1,812,786 1,492,948 49,281 270,557 131.26 82.00 73.21 195,964 4,041 19,8071971 1,990,098 1,647,684 56,743 285,671 146.52 90.11 81.37 241,419 5,113 23,2451972 2,202,090 1,832,916 64,167 305,007 179.32 109.54 98.81 328,678 7,029 30,1381973 2,415,383 2,016,626 78,769 319,988 183.00 111.14 100.14 369,043 8,754 32,0441974 2,670,092 2,236,882 92,128 341,082 205.70 125.87 112.45 460,127 11,596 38,355
1975 2,960,620 2,488,774 109,511 362,335 225.90 137.70 122.80 562,214 15,080 44,4951976 3,171,198 2,670,208 119,427 381,563 245.17 147.01 132.32 654,655 17,557 50,4881977 3,368,954 2,837,432 127,276 404,246 265.30 156.11 142.12 752,771 19,869 57,4511978 3,429,421 2,879,774 129,751 419,896 288.30 165.46 153.66 830,239 21,469 64,5211979 3,435,761 2,870,590 129,833 435,338 322.00 180.52 171.55 924,330 23,437 74,682
1980 3,436,429 2,858,680 127,580 450,169 370.70 205.02 198.95 1,059,713 26,156 89,5611981 3,361,130 2,776,519 121,590 463,021 413.20 226.58 224.51 1,147,258 27,550 103,9531982 3,192,379 2,603,599 116,372 472,408 440.60 242.11 245.07 1,147,146 28,175 115,7731983 3,168,992 2,569,029 111,591 488,372 456.20 250.33 257.78 1,171,991 27,935 125,8931984 3,212,040 2,596,516 109,151 506,373 470.70 306.24 270.28 1,222,180 33,426 136,862
1985 3,289,485 2,656,638 107,005 525,842 483.80 315.26 281.92 1,285,281 33,734 148,2451986 3,380,480 2,728,463 106,974 545,043 487.90 319.74 288.79 1,331,217 34,204 157,4031987 3,453,414 2,785,859 106,282 561,273 508.20 333.89 304.32 1,415,774 35,486 170,8071988 3,507,707 2,830,284 103,123 574,300 529.50 348.05 320.21 1,498,635 35,892 183,8971989 3,583,451 2,895,364 101,630 586,457 556.00 366.72 339.47 1,609,822 37,270 199,085
1990 3,712,763 3,011,294 100,989 600,480 587.20 388.93 361.71 1,768,232 39,278 217,2001991 3,925,472 3,194,938 114,489 616,045 609.40 406.96 378.86 1,946,995 46,592 233,3951992 4,236,080 3,467,783 131,324 636,973 626.10 422.65 393.61 2,171,179 55,504 250,7191993 4,529,466 3,725,966 147,015 656,485 641.70 434.20 407.20 2,390,952 63,834 267,3211994 4,796,313 3,962,954 160,676 672,683 661.40 446.30 422.40 2,621,098 71,710 284,141
Table 3.Number, average, and total monthly benefits, December 1960–2016
Year
Number Average monthly benefit (dollars)Total monthly benefits(thousands of dollars)
(Continued)
20 ♦ Annual Statistical Report on the Social Security Disability Insurance Program, 2016
All Disabled Beneficiaries
Total Workers Widow(er)sAdult
children Workers Widow(er)sAdult
children Workers Widow(er)sAdult
children
1995 5,044,388 4,185,263 173,024 686,101 681.60 458.30 437.30 2,853,512 79,297 300,0321996 5,264,321 4,385,623 181,911 696,787 703.90 471.00 454.30 3,087,040 85,680 316,5501997 5,400,781 4,508,134 187,938 704,709 721.60 480.40 468.60 3,253,069 90,285 330,2271998 5,605,272 4,698,319 194,181 712,772 733.10 487.30 479.40 3,444,338 94,624 341,7031999 5,798,776 4,879,455 198,795 720,526 754.10 499.90 495.60 3,679,597 99,378 357,093
2000 5,972,468 5,042,333 201,446 728,689 786.40 519.70 518.30 3,965,291 104,681 377,6502001 6,208,847 5,268,039 204,255 736,553 814.40 536.70 537.60 4,290,449 109,622 395,9562002 6,491,494 5,539,597 207,365 744,532 834.30 548.10 550.40 4,621,852 113,653 409,8132003 6,830,714 5,868,541 209,360 752,813 861.60 563.80 567.00 5,054,332 118,010 426,7802004 7,167,375 6,197,385 210,736 759,254 894.10 582.70 587.60 5,540,703 122,795 446,096
2005 7,503,405 6,519,001 215,866 768,538 938.00 609.30 616.30 6,113,106 131,508 473,5452006 7,803,692 6,806,918 220,178 776,596 977.70 630.70 642.40 6,655,048 138,859 498,8912007 8,118,382 7,098,723 224,982 794,677 1,004.00 645.50 660.30 7,127,082 145,233 524,7632008 8,528,164 7,426,691 230,007 871,466 1,063.10 683.60 681.70 7,895,536 157,243 594,1152009 8,945,376 7,788,013 236,480 920,883 1,064.30 682.70 676.30 8,288,762 161,437 622,827
2010 9,398,104 8,203,951 244,953 949,200 1,067.80 681.30 678.80 8,759,959 166,888 644,2972011 9,803,581 8,575,544 251,011 977,026 1,110.50 703.54 705.84 9,523,184 176,596 689,6222012 10,088,739 8,826,591 255,472 1,006,676 1,130.34 711.47 720.47 9,977,027 181,760 725,2852013 10,228,364 8,940,950 257,248 1,030,166 1,146.42 716.79 734.68 10,250,098 184,392 756,8392014 10,261,268 8,954,518 257,871 1,048,879 1,165.39 724.07 751.12 10,435,524 186,717 787,838
2015 10,237,204 8,909,430 259,331 1,068,443 1,165.79 719.11 754.96 10,386,494 186,488 806,6302016 10,153,205 8,808,736 259,207 1,085,262 1,171.15 717.65 761.87 10,316,342 186,020 826,828
SOURCES: Social Security Administration. For years before 2000, Annual Statistical Supplement to the Social Security Bulletin, based on the Master Beneficiary Record, various sampling rates; for 2000, Social Security Disability Insurance Beneficiaries, 100 percent data; beginning with 2001, Master Beneficiary Record, 100 percent data.
NOTE: . . . = not applicable.
CONTACT: (410) 965-0090 or [email protected].
Table 3.Number, average, and total monthly benefits, December 1960–2016—Continued
Year
Number Average monthly benefit (dollars)Total monthly benefits(thousands of dollars)
Annual Statistical Report on the Social Security Disability Insurance Program, 2016 ♦ 21
All Disabled Beneficiaries
Number
Average monthly benefit
(dollars) Number
Average monthly benefit
(dollars) Number
Average monthly benefit
(dollars) Number
Average monthly benefit
(dollars)
Total 10,153,205 1,115.82 8,808,736 1,171.15 259,207 717.65 1,085,262 761.87
137,290 645.79 26,211 603.28 . . . . . . 111,079 655.82250,223 710.66 125,164 720.33 . . . . . . 125,059 700.99378,906 804.19 257,393 839.78 . . . . . . 121,513 728.80515,795 888.45 401,190 929.79 . . . . . . 114,605 743.73640,868 962.59 531,315 1,002.75 . . . . . . 109,553 767.80948,864 1,030.34 831,965 1,064.41 . . . . . . 116,899 787.89
1,519,431 1,091.65 1,371,926 1,124.51 29,315 686.99 118,190 810.532,363,771 1,172.64 2,168,687 1,209.10 91,991 707.74 103,093 820.502,788,915 1,262.43 2,599,312 1,298.75 117,926 727.42 71,677 825.56
609,142 1,237.54 495,573 1,336.02 19,975 750.58 93,594 819.98
5,140,361 1,226.66 4,510,579 1,293.38 18,749 535.23 611,033 755.31
83,357 649.58 15,817 611.13 . . . . . . 67,540 658.58145,544 719.44 72,108 735.86 . . . . . . 73,436 703.31210,745 818.17 140,964 862.19 . . . . . . 69,781 729.24270,105 904.96 204,986 957.49 . . . . . . 65,119 739.61322,465 996.24 261,282 1,051.00 . . . . . . 61,183 762.37479,556 1,087.41 413,982 1,136.17 . . . . . . 65,574 779.56757,023 1,184.89 687,273 1,224.91 2,405 515.65 67,345 800.35
1,170,847 1,314.39 1,105,255 1,346.32 7,624 530.19 57,968 808.811,394,908 1,446.33 1,348,227 1,469.79 7,767 542.30 38,914 814.11
305,811 1,417.83 260,685 1,522.67 953 567.29 44,173 817.46
5,012,844 1,002.17 4,298,157 1,042.87 240,458 731.88 474,229 770.33
53,933 639.93 10,394 591.32 . . . . . . 43,539 651.54104,679 698.47 53,056 699.22 . . . . . . 51,623 697.69168,161 786.67 116,429 812.64 . . . . . . 51,732 728.20245,690 870.30 196,204 900.86 . . . . . . 49,486 749.15318,403 928.51 270,033 956.06 . . . . . . 48,370 774.66469,308 972.03 417,983 993.34 . . . . . . 51,325 798.53762,408 999.07 684,653 1,023.73 26,910 702.30 50,845 824.00
1,192,924 1,033.52 1,063,432 1,066.49 84,367 723.79 45,125 835.511,394,007 1,078.41 1,251,085 1,114.43 110,159 740.48 32,763 839.17
303,331 1,055.77 234,888 1,128.88 19,022 759.76 49,421 822.24
a.
CONTACT: (410) 965-0090 or [email protected].
65–FRA a
FRA applies only to workers and widow(er)s. There is no age limit for adult children.
30–3435–3940–4445–4950–5455–59
60–6465–FRA a
Subtotal
Under 25
60–64
40–4445–4950–5455–59
All disabled beneficiaries
Under 2525–2930–3435–39
Men
Women
SOURCE: Social Security Administration, Master Beneficiary Record, 100 percent data.
NOTE: . . . = not applicable; FRA = full retirement age.
60–6465–FRA a
Subtotal
Under 25
25–29
25–2930–3435–3940–4445–4950–5455–59
Table 4.Number and average monthly benefit, by sex and age, December 2016
Total Workers Widow(er)s Adult children
Age
22 ♦ Annual Statistical Report on the Social Security Disability Insurance Program, 2016
All Disabled Beneficiaries
Number Percent Number Percent Number Percent Number Percent
Total 10,153,205 100.0 8,808,736 100.0 259,207 100.0 1,085,262 100.0
292,538 2.9 124,524 1.4 43,561 16.8 124,453 11.5272,385 2.7 189,458 2.2 21,270 8.2 61,657 5.7369,560 3.6 249,356 2.8 21,810 8.4 98,394 9.1
417,409 4.1 287,812 3.3 25,607 9.9 103,990 9.6543,930 5.4 412,531 4.7 24,804 9.6 106,595 9.8900,312 8.9 775,664 8.8 22,504 8.7 102,144 9.4
1,033,779 10.2 909,525 10.3 20,569 7.9 103,685 9.6953,918 9.4 847,141 9.6 17,423 6.7 89,354 8.2
859,252 8.5 760,210 8.6 14,506 5.6 84,536 7.8755,679 7.4 673,651 7.6 11,357 4.4 70,671 6.5650,865 6.4 585,674 6.6 9,084 3.5 56,107 5.2545,245 5.4 501,448 5.7 6,533 2.5 37,264 3.4449,582 4.4 425,687 4.8 6,553 2.5 17,342 1.6
379,566 3.7 361,349 4.1 6,148 2.4 12,069 1.1312,432 3.1 300,961 3.4 3,807 1.5 7,664 0.7269,043 2.6 262,299 3.0 2,262 0.9 4,482 0.4219,015 2.2 215,082 2.4 1,202 0.5 2,731 0.3182,745 1.8 181,200 2.1 173 0.1 1,372 0.1
207,655 2.0 207,333 2.4 11 (L) 311 (L)190,105 1.9 189,980 2.2 6 (L) 119 (L)348,190 3.4 347,851 3.9 17 (L) 322 (L)
5,140,361 100.0 4,510,579 100.0 18,749 100.0 611,033 100.0
123,551 2.4 44,166 1.0 5,877 31.3 73,508 12.0104,976 2.0 67,307 1.5 1,854 9.9 35,815 5.9145,956 2.8 89,185 2.0 1,614 8.6 55,157 9.0
165,276 3.2 104,065 2.3 2,181 11.6 59,030 9.7222,427 4.3 160,417 3.6 1,829 9.8 60,181 9.8354,957 6.9 296,291 6.6 1,460 7.8 57,206 9.4424,960 8.3 366,325 8.1 1,132 6.0 57,503 9.4421,114 8.2 371,058 8.2 782 4.2 49,274 8.1
406,303 7.9 358,716 8.0 569 3.0 47,018 7.7380,377 7.4 341,140 7.6 409 2.2 38,828 6.4347,378 6.8 316,267 7.0 290 1.5 30,821 5.0308,225 6.0 287,534 6.4 199 1.1 20,492 3.4268,303 5.2 258,434 5.7 200 1.1 9,669 1.6
237,171 4.6 230,127 5.1 184 1.0 6,860 1.1202,878 3.9 198,369 4.4 96 0.5 4,413 0.7180,358 3.5 177,796 3.9 47 0.3 2,515 0.4150,968 2.9 149,375 3.3 22 0.1 1,571 0.3128,366 2.5 127,588 2.8 4 (L) 774 0.1
148,895 2.9 148,728 3.3 0 0.0 167 (L)141,296 2.7 141,229 3.1 0 0.0 67 (L)276,626 5.4 276,462 6.1 0 0.0 164 (L)
1,400.00–1,499.90
1,500.00–1,599.901,600.00–1,699.901,700.00–1,799.901,800.00–1,899.901,900.00–1,999.90
2,000.00–2,099.902,100.00–2,199.902,200.00 or more
1,300.00–1,399.90
Less than 300.00300.00–399.90400.00–499.90
500.00–599.90600.00–699.90700.00–799.90800.00–899.90900.00–999.90
1,000.00–1,099.901,100.00–1,199.901,200.00–1,299.90
Subtotal
1,200.00–1,299.901,300.00–1,399.901,400.00–1,499.90
1,500.00–1,599.901,600.00–1,699.901,700.00–1,799.901,800.00–1,899.901,900.00–1,999.90
2,000.00–2,099.902,100.00–2,199.902,200.00 or more
600.00–699.90700.00–799.90800.00–899.90900.00–999.90
1,000.00–1,099.901,100.00–1,199.90
All disabled beneficiaries
Men
Less than 300.00300.00–399.90400.00–499.90
500.00–599.90
(Continued)
Table 5.Distribution, by sex and monthly benefit, December 2016
Total Workers Widow(er)s Adult children
Monthly benefit (dollars)
Annual Statistical Report on the Social Security Disability Insurance Program, 2016 ♦ 23
All Disabled Beneficiaries
Number Percent Number Percent Number Percent Number Percent
5,012,844 100.0 4,298,157 100.0 240,458 100.0 474,229 100.0
168,987 3.4 80,358 1.9 37,684 15.7 50,945 10.7167,409 3.3 122,151 2.8 19,416 8.1 25,842 5.4223,604 4.5 160,171 3.7 20,196 8.4 43,237 9.1
252,133 5.0 183,747 4.3 23,426 9.7 44,960 9.5321,503 6.4 252,114 5.9 22,975 9.6 46,414 9.8545,355 10.9 479,373 11.2 21,044 8.8 44,938 9.5608,819 12.1 543,200 12.6 19,437 8.1 46,182 9.7532,804 10.6 476,083 11.1 16,641 6.9 40,080 8.5
452,949 9.0 401,494 9.3 13,937 5.8 37,518 7.9375,302 7.5 332,511 7.7 10,948 4.6 31,843 6.7303,487 6.1 269,407 6.3 8,794 3.7 25,286 5.3237,020 4.7 213,914 5.0 6,334 2.6 16,772 3.5181,279 3.6 167,253 3.9 6,353 2.6 7,673 1.6
142,395 2.8 131,222 3.1 5,964 2.5 5,209 1.1109,554 2.2 102,592 2.4 3,711 1.5 3,251 0.788,685 1.8 84,503 2.0 2,215 0.9 1,967 0.468,047 1.4 65,707 1.5 1,180 0.5 1,160 0.254,379 1.1 53,612 1.2 169 0.1 598 0.1
58,760 1.2 58,605 1.4 11 (L) 144 (L)48,809 1.0 48,751 1.1 6 (L) 52 (L)71,564 1.4 71,389 1.7 17 (L) 158 (L)
NOTE: (L) = less than 0.05 percent.
CONTACT: (410) 965-0090 or [email protected].
2,200.00 or more
1,600.00–1,699.901,700.00–1,799.901,800.00–1,899.901,900.00–1,999.90
2,000.00–2,099.902,100.00–2,199.90
1,500.00–1,599.90
400.00–499.90
500.00–599.90600.00–699.90700.00–799.90800.00–899.90900.00–999.90
1,000.00–1,099.901,100.00–1,199.901,200.00–1,299.901,300.00–1,399.901,400.00–1,499.90
300.00–399.90
Subtotal
Less than 300.00
Women
SOURCE: Social Security Administration, Master Beneficiary Record, 100 percent data.
Table 5.Distribution, by sex and monthly benefit, December 2016—Continued
Monthly benefit (dollars)
Total Workers Widow(er)s Adult children
24 ♦ Annual Statistical Report on the Social Security Disability Insurance Program, 2016
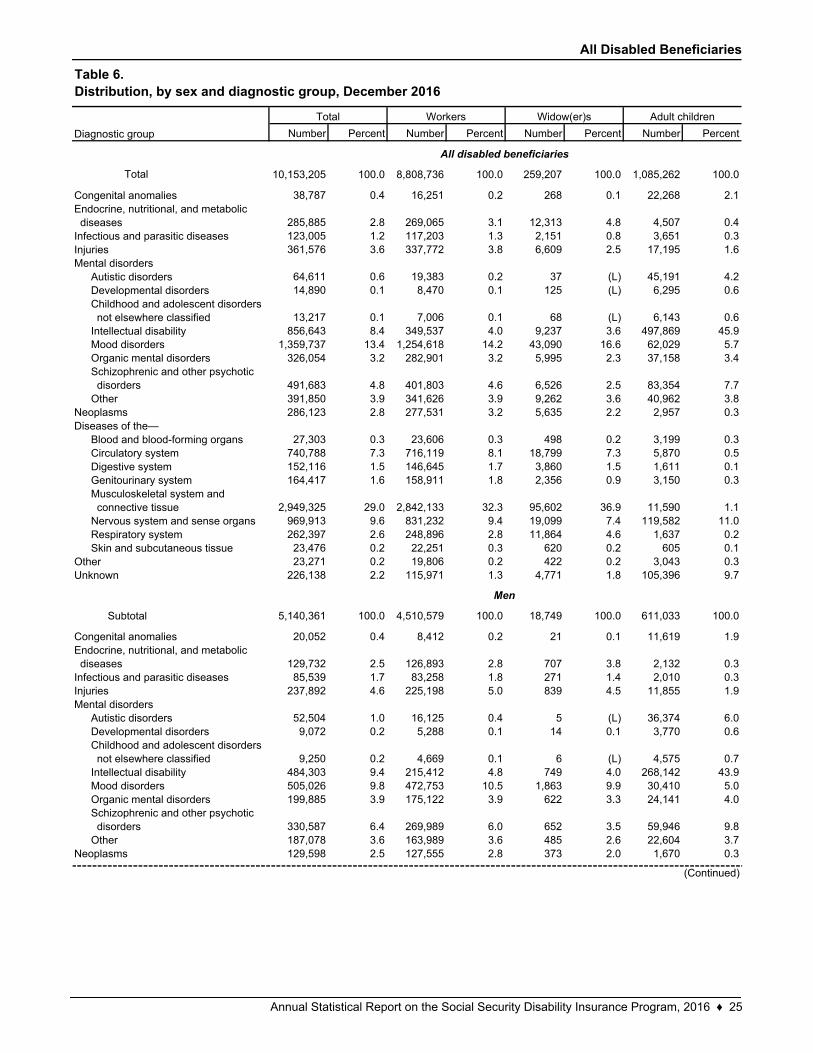
All Disabled Beneficiaries
Number Percent Number Percent Number Percent Number Percent
Total 10,153,205 100.0 8,808,736 100.0 259,207 100.0 1,085,262 100.0
38,787 0.4 16,251 0.2 268 0.1 22,268 2.1
285,885 2.8 269,065 3.1 12,313 4.8 4,507 0.4123,005 1.2 117,203 1.3 2,151 0.8 3,651 0.3361,576 3.6 337,772 3.8 6,609 2.5 17,195 1.6
64,611 0.6 19,383 0.2 37 (L) 45,191 4.214,890 0.1 8,470 0.1 125 (L) 6,295 0.6
13,217 0.1 7,006 0.1 68 (L) 6,143 0.6856,643 8.4 349,537 4.0 9,237 3.6 497,869 45.9
1,359,737 13.4 1,254,618 14.2 43,090 16.6 62,029 5.7326,054 3.2 282,901 3.2 5,995 2.3 37,158 3.4
491,683 4.8 401,803 4.6 6,526 2.5 83,354 7.7391,850 3.9 341,626 3.9 9,262 3.6 40,962 3.8286,123 2.8 277,531 3.2 5,635 2.2 2,957 0.3
27,303 0.3 23,606 0.3 498 0.2 3,199 0.3740,788 7.3 716,119 8.1 18,799 7.3 5,870 0.5152,116 1.5 146,645 1.7 3,860 1.5 1,611 0.1164,417 1.6 158,911 1.8 2,356 0.9 3,150 0.3
2,949,325 29.0 2,842,133 32.3 95,602 36.9 11,590 1.1969,913 9.6 831,232 9.4 19,099 7.4 119,582 11.0262,397 2.6 248,896 2.8 11,864 4.6 1,637 0.223,476 0.2 22,251 0.3 620 0.2 605 0.123,271 0.2 19,806 0.2 422 0.2 3,043 0.3
226,138 2.2 115,971 1.3 4,771 1.8 105,396 9.7
5,140,361 100.0 4,510,579 100.0 18,749 100.0 611,033 100.0
20,052 0.4 8,412 0.2 21 0.1 11,619 1.9
129,732 2.5 126,893 2.8 707 3.8 2,132 0.385,539 1.7 83,258 1.8 271 1.4 2,010 0.3
237,892 4.6 225,198 5.0 839 4.5 11,855 1.9
52,504 1.0 16,125 0.4 5 (L) 36,374 6.09,072 0.2 5,288 0.1 14 0.1 3,770 0.6
9,250 0.2 4,669 0.1 6 (L) 4,575 0.7484,303 9.4 215,412 4.8 749 4.0 268,142 43.9505,026 9.8 472,753 10.5 1,863 9.9 30,410 5.0199,885 3.9 175,122 3.9 622 3.3 24,141 4.0
330,587 6.4 269,989 6.0 652 3.5 59,946 9.8187,078 3.6 163,989 3.6 485 2.6 22,604 3.7129,598 2.5 127,555 2.8 373 2.0 1,670 0.3
OtherNeoplasms
(Continued)
Schizophrenic and other psychotic disorders
Congenital anomaliesEndocrine, nutritional, and metabolic diseasesInfectious and parasitic diseasesInjuriesMental disorders
Autistic disordersDevelopmental disordersChildhood and adolescent disorders not elsewhere classifiedIntellectual disabilityMood disordersOrganic mental disorders
Subtotal
Diseases of the—Blood and blood-forming organsCirculatory systemDigestive systemGenitourinary systemMusculoskeletal system and connective tissueNervous system and sense organsRespiratory systemSkin and subcutaneous tissue
OtherUnknown
Diagnostic group
Congenital anomaliesEndocrine, nutritional, and metabolic diseasesInfectious and parasitic diseasesInjuriesMental disorders
Autistic disordersDevelopmental disordersChildhood and adolescent disorders not elsewhere classifiedIntellectual disability
All disabled beneficiaries
Men
Table 6.Distribution, by sex and diagnostic group, December 2016
Total Workers Widow(er)s Adult children
Neoplasms
Mood disordersOrganic mental disordersSchizophrenic and other psychotic disordersOther
Annual Statistical Report on the Social Security Disability Insurance Program, 2016 ♦ 25
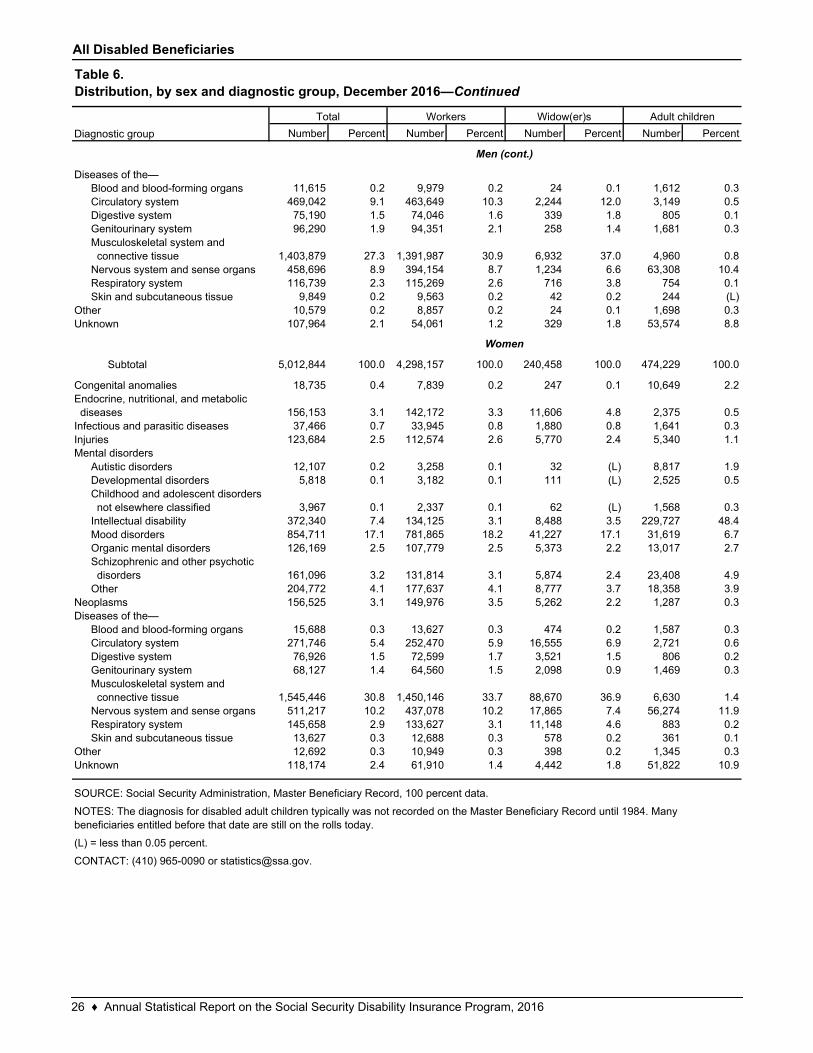
All Disabled Beneficiaries
Number Percent Number Percent Number Percent Number Percent
11,615 0.2 9,979 0.2 24 0.1 1,612 0.3469,042 9.1 463,649 10.3 2,244 12.0 3,149 0.575,190 1.5 74,046 1.6 339 1.8 805 0.196,290 1.9 94,351 2.1 258 1.4 1,681 0.3
1,403,879 27.3 1,391,987 30.9 6,932 37.0 4,960 0.8458,696 8.9 394,154 8.7 1,234 6.6 63,308 10.4116,739 2.3 115,269 2.6 716 3.8 754 0.1
9,849 0.2 9,563 0.2 42 0.2 244 (L)10,579 0.2 8,857 0.2 24 0.1 1,698 0.3
107,964 2.1 54,061 1.2 329 1.8 53,574 8.8
5,012,844 100.0 4,298,157 100.0 240,458 100.0 474,229 100.0
18,735 0.4 7,839 0.2 247 0.1 10,649 2.2
156,153 3.1 142,172 3.3 11,606 4.8 2,375 0.537,466 0.7 33,945 0.8 1,880 0.8 1,641 0.3
123,684 2.5 112,574 2.6 5,770 2.4 5,340 1.1
12,107 0.2 3,258 0.1 32 (L) 8,817 1.95,818 0.1 3,182 0.1 111 (L) 2,525 0.5
3,967 0.1 2,337 0.1 62 (L) 1,568 0.3372,340 7.4 134,125 3.1 8,488 3.5 229,727 48.4854,711 17.1 781,865 18.2 41,227 17.1 31,619 6.7126,169 2.5 107,779 2.5 5,373 2.2 13,017 2.7
161,096 3.2 131,814 3.1 5,874 2.4 23,408 4.9204,772 4.1 177,637 4.1 8,777 3.7 18,358 3.9156,525 3.1 149,976 3.5 5,262 2.2 1,287 0.3
15,688 0.3 13,627 0.3 474 0.2 1,587 0.3271,746 5.4 252,470 5.9 16,555 6.9 2,721 0.676,926 1.5 72,599 1.7 3,521 1.5 806 0.268,127 1.4 64,560 1.5 2,098 0.9 1,469 0.3
1,545,446 30.8 1,450,146 33.7 88,670 36.9 6,630 1.4511,217 10.2 437,078 10.2 17,865 7.4 56,274 11.9145,658 2.9 133,627 3.1 11,148 4.6 883 0.213,627 0.3 12,688 0.3 578 0.2 361 0.112,692 0.3 10,949 0.3 398 0.2 1,345 0.3
118,174 2.4 61,910 1.4 4,442 1.8 51,822 10.9
Respiratory systemSkin and subcutaneous tissue
OtherUnknown
Circulatory systemDigestive systemGenitourinary systemMusculoskeletal system and connective tissueNervous system and sense organs
Organic mental disordersSchizophrenic and other psychotic disordersOther
Diseases of the—Blood and blood-forming organs
Musculoskeletal system and connective tissueNervous system and sense organsRespiratory systemSkin and subcutaneous tissue
Neoplasms
Unknown
Subtotal
Congenital anomaliesEndocrine, nutritional, and metabolic diseasesInfectious and parasitic diseasesInjuries
Autistic disordersDevelopmental disordersChildhood and adolescent disorders not elsewhere classifiedIntellectual disabilityMood disorders
Other
Diseases of the—Blood and blood-forming organsCirculatory systemDigestive system
Table 6.Distribution, by sex and diagnostic group, December 2016—Continued
Diagnostic group
Total Workers Widow(er)s Adult children
Men (cont.)
Genitourinary system
CONTACT: (410) 965-0090 or [email protected].
Women
SOURCE: Social Security Administration, Master Beneficiary Record, 100 percent data.
NOTES: The diagnosis for disabled adult children typically was not recorded on the Master Beneficiary Record until 1984. Many beneficiaries entitled before that date are still on the rolls today.
(L) = less than 0.05 percent.
Mental disorders
26 ♦ Annual Statistical Report on the Social Security Disability Insurance Program, 2016
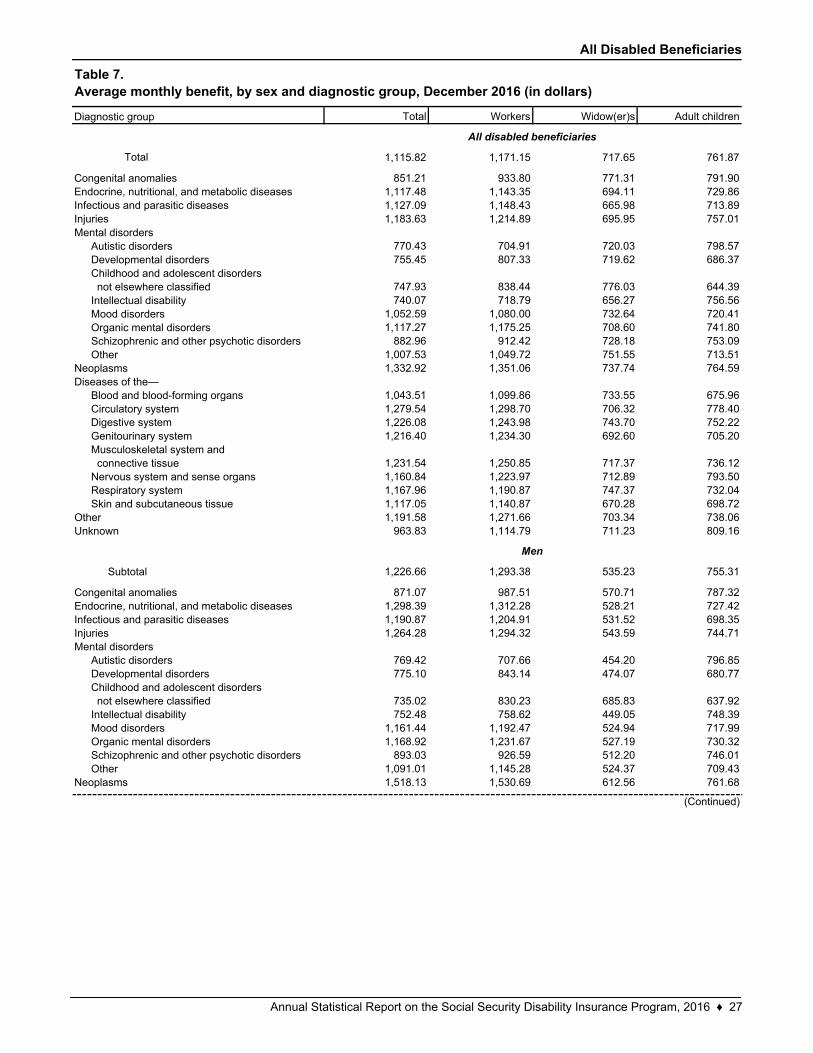
All Disabled Beneficiaries
Total Workers Widow(er)s Adult children
Total 1,115.82 1,171.15 717.65 761.87
851.21 933.80 771.31 791.901,117.48 1,143.35 694.11 729.861,127.09 1,148.43 665.98 713.891,183.63 1,214.89 695.95 757.01
770.43 704.91 720.03 798.57755.45 807.33 719.62 686.37
747.93 838.44 776.03 644.39740.07 718.79 656.27 756.56
1,052.59 1,080.00 732.64 720.411,117.27 1,175.25 708.60 741.80
882.96 912.42 728.18 753.091,007.53 1,049.72 751.55 713.511,332.92 1,351.06 737.74 764.59
1,043.51 1,099.86 733.55 675.961,279.54 1,298.70 706.32 778.401,226.08 1,243.98 743.70 752.221,216.40 1,234.30 692.60 705.20
1,231.54 1,250.85 717.37 736.121,160.84 1,223.97 712.89 793.501,167.96 1,190.87 747.37 732.041,117.05 1,140.87 670.28 698.721,191.58 1,271.66 703.34 738.06
963.83 1,114.79 711.23 809.16
1,226.66 1,293.38 535.23 755.31
871.07 987.51 570.71 787.321,298.39 1,312.28 528.21 727.421,190.87 1,204.91 531.52 698.351,264.28 1,294.32 543.59 744.71
769.42 707.66 454.20 796.85775.10 843.14 474.07 680.77
735.02 830.23 685.83 637.92752.48 758.62 449.05 748.39
1,161.44 1,192.47 524.94 717.991,168.92 1,231.67 527.19 730.32
893.03 926.59 512.20 746.011,091.01 1,145.28 524.37 709.431,518.13 1,530.69 612.56 761.68
Mental disordersAutistic disordersDevelopmental disordersChildhood and adolescent disorders not elsewhere classifiedIntellectual disabilityMood disordersOrganic mental disordersSchizophrenic and other psychotic disordersOther
Neoplasms
Circulatory system
Injuries
Genitourinary systemMusculoskeletal system and connective tissueNervous system and sense organsRespiratory systemSkin and subcutaneous tissue
OtherUnknown
Subtotal
Congenital anomaliesEndocrine, nutritional, and metabolic diseasesInfectious and parasitic diseases
Schizophrenic and other psychotic disordersOther
NeoplasmsDiseases of the—
Blood and blood-forming organs
Developmental disordersChildhood and adolescent disorders not elsewhere classifiedIntellectual disabilityMood disordersOrganic mental disorders
Mental disordersAutistic disorders
Men
Table 7.Average monthly benefit, by sex and diagnostic group, December 2016 (in dollars)
All disabled beneficiaries
(Continued)
Diagnostic group
Congenital anomaliesEndocrine, nutritional, and metabolic diseasesInfectious and parasitic diseasesInjuries
Digestive system
Annual Statistical Report on the Social Security Disability Insurance Program, 2016 ♦ 27
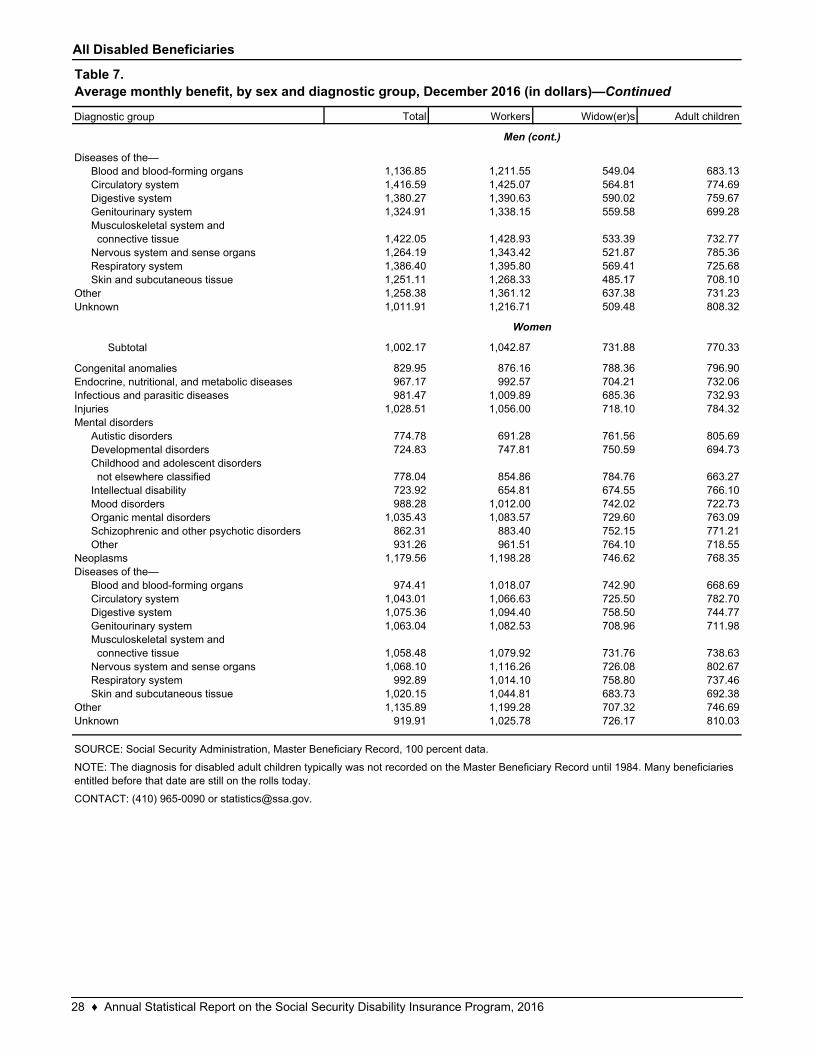
All Disabled Beneficiaries
Total Workers Widow(er)s Adult children
1,136.85 1,211.55 549.04 683.131,416.59 1,425.07 564.81 774.691,380.27 1,390.63 590.02 759.671,324.91 1,338.15 559.58 699.28
1,422.05 1,428.93 533.39 732.771,264.19 1,343.42 521.87 785.361,386.40 1,395.80 569.41 725.681,251.11 1,268.33 485.17 708.101,258.38 1,361.12 637.38 731.231,011.91 1,216.71 509.48 808.32
1,002.17 1,042.87 731.88 770.33
829.95 876.16 788.36 796.90967.17 992.57 704.21 732.06981.47 1,009.89 685.36 732.93
1,028.51 1,056.00 718.10 784.32
774.78 691.28 761.56 805.69724.83 747.81 750.59 694.73
778.04 854.86 784.76 663.27723.92 654.81 674.55 766.10988.28 1,012.00 742.02 722.73
1,035.43 1,083.57 729.60 763.09862.31 883.40 752.15 771.21931.26 961.51 764.10 718.55
1,179.56 1,198.28 746.62 768.35
974.41 1,018.07 742.90 668.691,043.01 1,066.63 725.50 782.701,075.36 1,094.40 758.50 744.771,063.04 1,082.53 708.96 711.98
1,058.48 1,079.92 731.76 738.631,068.10 1,116.26 726.08 802.67
992.89 1,014.10 758.80 737.461,020.15 1,044.81 683.73 692.381,135.89 1,199.28 707.32 746.69
919.91 1,025.78 726.17 810.03
Musculoskeletal system and connective tissue
SOURCE: Social Security Administration, Master Beneficiary Record, 100 percent data.
NOTE: The diagnosis for disabled adult children typically was not recorded on the Master Beneficiary Record until 1984. Many beneficiaries entitled before that date are still on the rolls today.
CONTACT: (410) 965-0090 or [email protected].
Nervous system and sense organsRespiratory systemSkin and subcutaneous tissue
OtherUnknown
Diseases of the—Blood and blood-forming organsCirculatory systemDigestive systemGenitourinary system
Neoplasms
Infectious and parasitic diseasesInjuriesMental disorders
Autistic disordersDevelopmental disordersChildhood and adolescent disorders not elsewhere classifiedIntellectual disabilityMood disordersOrganic mental disordersSchizophrenic and other psychotic disordersOther
Endocrine, nutritional, and metabolic diseases
Circulatory systemDigestive systemGenitourinary systemMusculoskeletal system and connective tissueNervous system and sense organsRespiratory systemSkin and subcutaneous tissue
OtherUnknown
Subtotal
Congenital anomalies
Blood and blood-forming organsDiseases of the—
Women
Table 7.Average monthly benefit, by sex and diagnostic group, December 2016 (in dollars)—Continued
Diagnostic group
Men (cont.)
28 ♦ Annual Statistical Report on the Social Security Disability Insurance Program, 2016
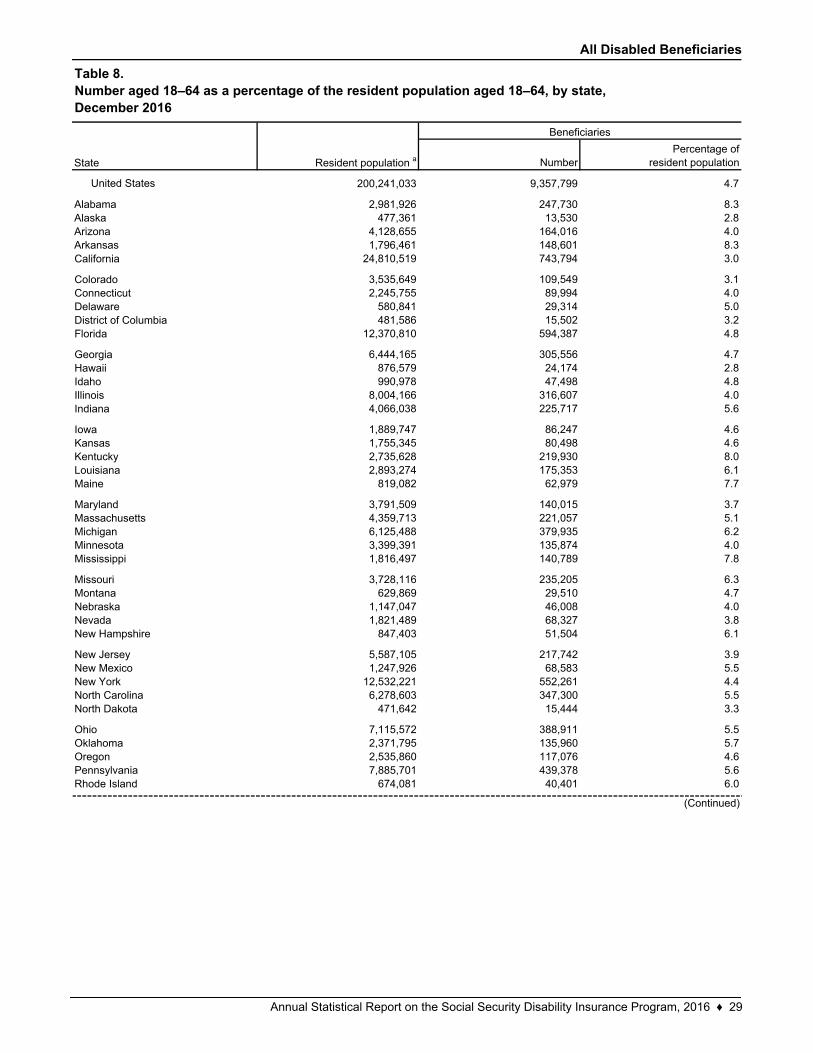
All Disabled Beneficiaries
NumberPercentage of
resident population
United States 200,241,033 9,357,799 4.7
2,981,926 247,730 8.3477,361 13,530 2.8
4,128,655 164,016 4.01,796,461 148,601 8.3
24,810,519 743,794 3.0
3,535,649 109,549 3.12,245,755 89,994 4.0
580,841 29,314 5.0481,586 15,502 3.2
12,370,810 594,387 4.8
6,444,165 305,556 4.7876,579 24,174 2.8990,978 47,498 4.8
8,004,166 316,607 4.04,066,038 225,717 5.6
1,889,747 86,247 4.61,755,345 80,498 4.62,735,628 219,930 8.02,893,274 175,353 6.1
819,082 62,979 7.7
3,791,509 140,015 3.74,359,713 221,057 5.16,125,488 379,935 6.23,399,391 135,874 4.01,816,497 140,789 7.8
3,728,116 235,205 6.3629,869 29,510 4.7
1,147,047 46,008 4.01,821,489 68,327 3.8
847,403 51,504 6.1
5,587,105 217,742 3.91,247,926 68,583 5.5
12,532,221 552,261 4.46,278,603 347,300 5.5
471,642 15,444 3.3
7,115,572 388,911 5.52,371,795 135,960 5.72,535,860 117,076 4.67,885,701 439,378 5.6
674,081 40,401 6.0Rhode Island
New Hampshire
New JerseyNew MexicoNew YorkNorth CarolinaNorth Dakota
(Continued)
OhioOklahomaOregonPennsylvania
Nevada
KentuckyLouisianaMaine
MarylandMassachusettsMichiganMinnesotaMississippi
MissouriMontanaNebraska
Kansas
ColoradoConnecticutDelawareDistrict of ColumbiaFlorida
GeorgiaHawaiiIdahoIllinoisIndiana
Iowa
California
Table 8.Number aged 18–64 as a percentage of the resident population aged 18–64, by state,December 2016
Resident population a
Beneficiaries
State
AlabamaAlaskaArizonaArkansas
Annual Statistical Report on the Social Security Disability Insurance Program, 2016 ♦ 29
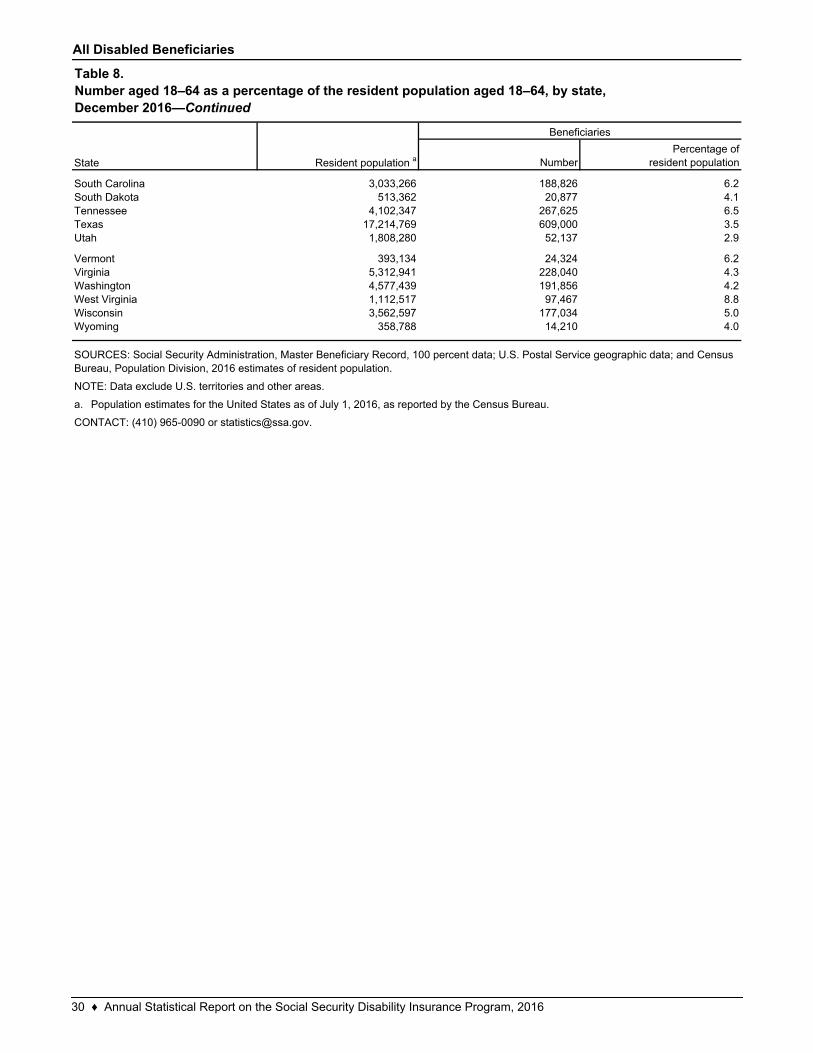
All Disabled Beneficiaries
NumberPercentage of
resident population
3,033,266 188,826 6.2513,362 20,877 4.1
4,102,347 267,625 6.517,214,769 609,000 3.51,808,280 52,137 2.9
393,134 24,324 6.25,312,941 228,040 4.34,577,439 191,856 4.21,112,517 97,467 8.83,562,597 177,034 5.0
358,788 14,210 4.0
a.
VermontVirginia
SOURCES: Social Security Administration, Master Beneficiary Record, 100 percent data; U.S. Postal Service geographic data; and Census Bureau, Population Division, 2016 estimates of resident population.
NOTE: Data exclude U.S. territories and other areas.
CONTACT: (410) 965-0090 or [email protected].
WashingtonWest VirginiaWisconsinWyoming
Population estimates for the United States as of July 1, 2016, as reported by the Census Bureau.
South DakotaTennesseeTexasUtah
South Carolina
Table 8.Number aged 18–64 as a percentage of the resident population aged 18–64, by state,December 2016—Continued
State Resident population a
Beneficiaries
30 ♦ Annual Statistical Report on the Social Security Disability Insurance Program, 2016
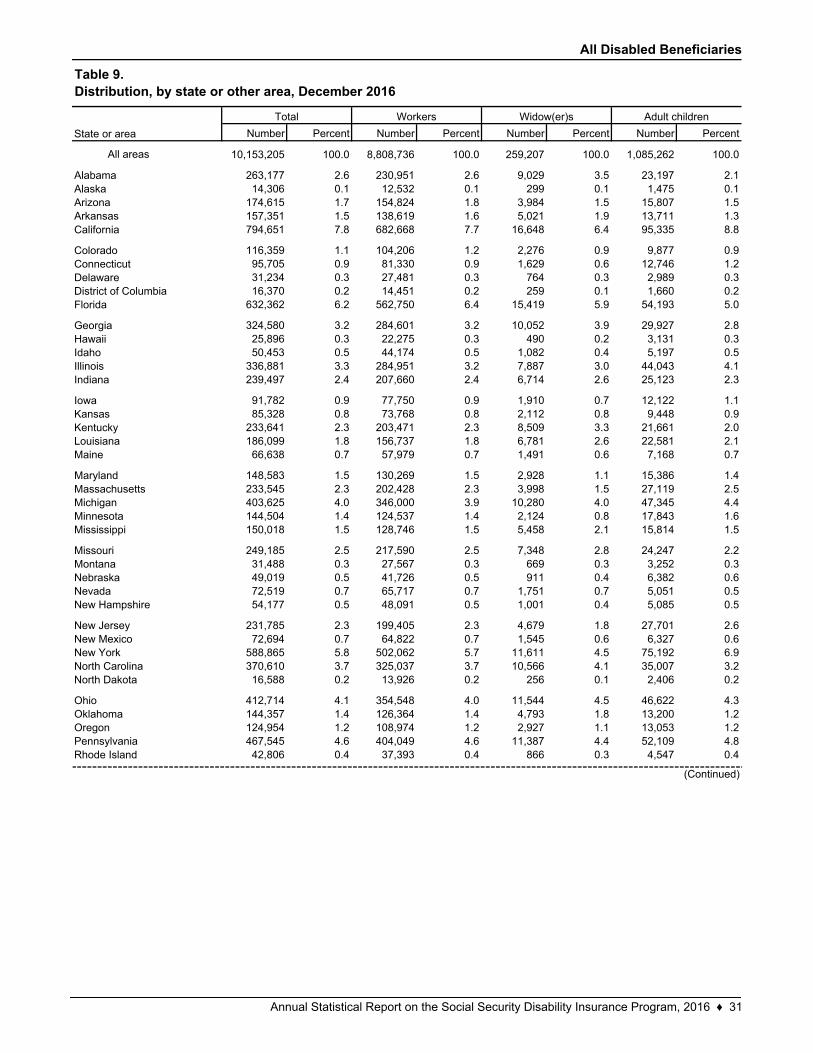
All Disabled Beneficiaries
Number Percent Number Percent Number Percent Number Percent
All areas 10,153,205 100.0 8,808,736 100.0 259,207 100.0 1,085,262 100.0
263,177 2.6 230,951 2.6 9,029 3.5 23,197 2.114,306 0.1 12,532 0.1 299 0.1 1,475 0.1
174,615 1.7 154,824 1.8 3,984 1.5 15,807 1.5157,351 1.5 138,619 1.6 5,021 1.9 13,711 1.3794,651 7.8 682,668 7.7 16,648 6.4 95,335 8.8
116,359 1.1 104,206 1.2 2,276 0.9 9,877 0.995,705 0.9 81,330 0.9 1,629 0.6 12,746 1.231,234 0.3 27,481 0.3 764 0.3 2,989 0.316,370 0.2 14,451 0.2 259 0.1 1,660 0.2
632,362 6.2 562,750 6.4 15,419 5.9 54,193 5.0
324,580 3.2 284,601 3.2 10,052 3.9 29,927 2.825,896 0.3 22,275 0.3 490 0.2 3,131 0.350,453 0.5 44,174 0.5 1,082 0.4 5,197 0.5
336,881 3.3 284,951 3.2 7,887 3.0 44,043 4.1239,497 2.4 207,660 2.4 6,714 2.6 25,123 2.3
91,782 0.9 77,750 0.9 1,910 0.7 12,122 1.185,328 0.8 73,768 0.8 2,112 0.8 9,448 0.9
233,641 2.3 203,471 2.3 8,509 3.3 21,661 2.0186,099 1.8 156,737 1.8 6,781 2.6 22,581 2.166,638 0.7 57,979 0.7 1,491 0.6 7,168 0.7
148,583 1.5 130,269 1.5 2,928 1.1 15,386 1.4233,545 2.3 202,428 2.3 3,998 1.5 27,119 2.5403,625 4.0 346,000 3.9 10,280 4.0 47,345 4.4144,504 1.4 124,537 1.4 2,124 0.8 17,843 1.6150,018 1.5 128,746 1.5 5,458 2.1 15,814 1.5
249,185 2.5 217,590 2.5 7,348 2.8 24,247 2.231,488 0.3 27,567 0.3 669 0.3 3,252 0.349,019 0.5 41,726 0.5 911 0.4 6,382 0.672,519 0.7 65,717 0.7 1,751 0.7 5,051 0.554,177 0.5 48,091 0.5 1,001 0.4 5,085 0.5
231,785 2.3 199,405 2.3 4,679 1.8 27,701 2.672,694 0.7 64,822 0.7 1,545 0.6 6,327 0.6
588,865 5.8 502,062 5.7 11,611 4.5 75,192 6.9370,610 3.7 325,037 3.7 10,566 4.1 35,007 3.216,588 0.2 13,926 0.2 256 0.1 2,406 0.2
412,714 4.1 354,548 4.0 11,544 4.5 46,622 4.3144,357 1.4 126,364 1.4 4,793 1.8 13,200 1.2124,954 1.2 108,974 1.2 2,927 1.1 13,053 1.2467,545 4.6 404,049 4.6 11,387 4.4 52,109 4.842,806 0.4 37,393 0.4 866 0.3 4,547 0.4
OregonPennsylvaniaRhode Island
New Hampshire
New JerseyNew MexicoNew YorkNorth CarolinaNorth Dakota
(Continued)
OhioOklahoma
Nevada
KentuckyLouisianaMaine
MarylandMassachusettsMichiganMinnesotaMississippi
MissouriMontanaNebraska
Kansas
ColoradoConnecticutDelawareDistrict of ColumbiaFlorida
GeorgiaHawaiiIdahoIllinoisIndiana
Iowa
California
Table 9.Distribution, by state or other area, December 2016
Total Workers Widow(er)s Adult children
State or area
AlabamaAlaskaArizonaArkansas
Annual Statistical Report on the Social Security Disability Insurance Program, 2016 ♦ 31
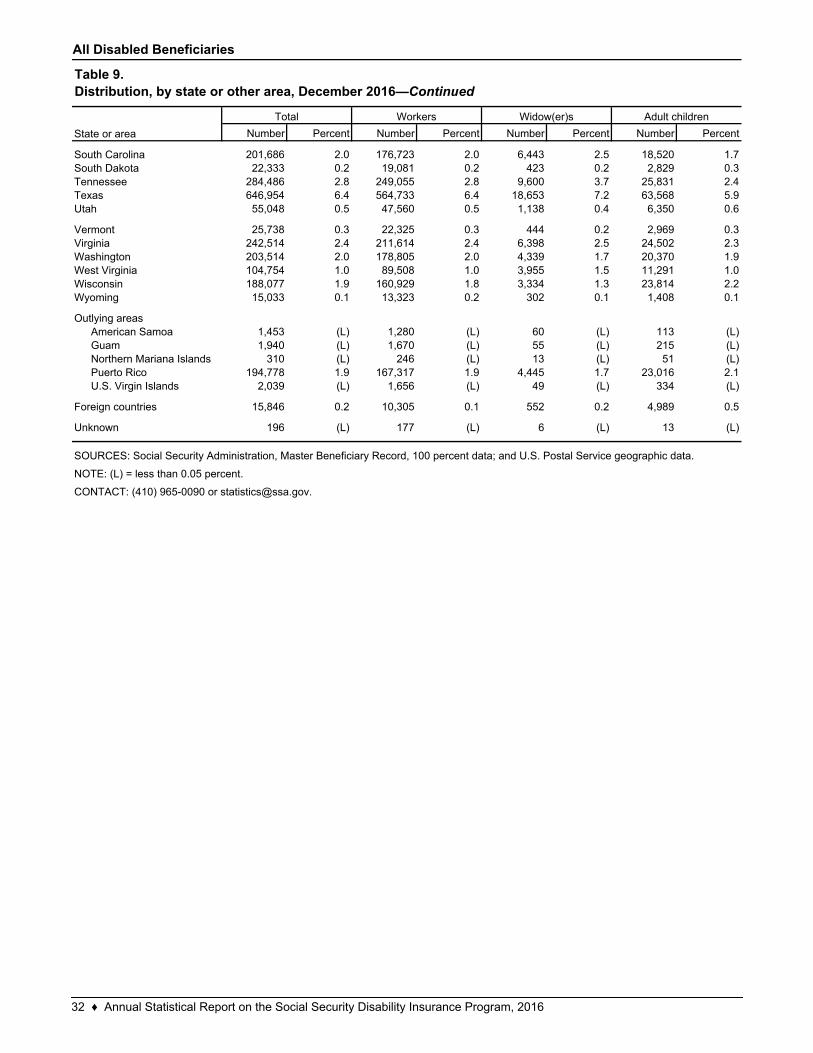
All Disabled Beneficiaries
Number Percent Number Percent Number Percent Number Percent
201,686 2.0 176,723 2.0 6,443 2.5 18,520 1.722,333 0.2 19,081 0.2 423 0.2 2,829 0.3
284,486 2.8 249,055 2.8 9,600 3.7 25,831 2.4646,954 6.4 564,733 6.4 18,653 7.2 63,568 5.955,048 0.5 47,560 0.5 1,138 0.4 6,350 0.6
25,738 0.3 22,325 0.3 444 0.2 2,969 0.3242,514 2.4 211,614 2.4 6,398 2.5 24,502 2.3203,514 2.0 178,805 2.0 4,339 1.7 20,370 1.9104,754 1.0 89,508 1.0 3,955 1.5 11,291 1.0188,077 1.9 160,929 1.8 3,334 1.3 23,814 2.215,033 0.1 13,323 0.2 302 0.1 1,408 0.1
1,453 (L) 1,280 (L) 60 (L) 113 (L)1,940 (L) 1,670 (L) 55 (L) 215 (L)
310 (L) 246 (L) 13 (L) 51 (L)194,778 1.9 167,317 1.9 4,445 1.7 23,016 2.1
2,039 (L) 1,656 (L) 49 (L) 334 (L)
15,846 0.2 10,305 0.1 552 0.2 4,989 0.5
196 (L) 177 (L) 6 (L) 13 (L)Unknown
SOURCES: Social Security Administration, Master Beneficiary Record, 100 percent data; and U.S. Postal Service geographic data.
NOTE: (L) = less than 0.05 percent.
CONTACT: (410) 965-0090 or [email protected].
GuamNorthern Mariana IslandsPuerto RicoU.S. Virgin Islands
Foreign countries
American Samoa
South DakotaTennesseeTexasUtah
VermontVirginiaWashingtonWest VirginiaWisconsinWyoming
Outlying areas
South Carolina
Table 9.Distribution, by state or other area, December 2016—Continued
State or area
Total Workers Widow(er)s Adult children
32 ♦ Annual Statistical Report on the Social Security Disability Insurance Program, 2016
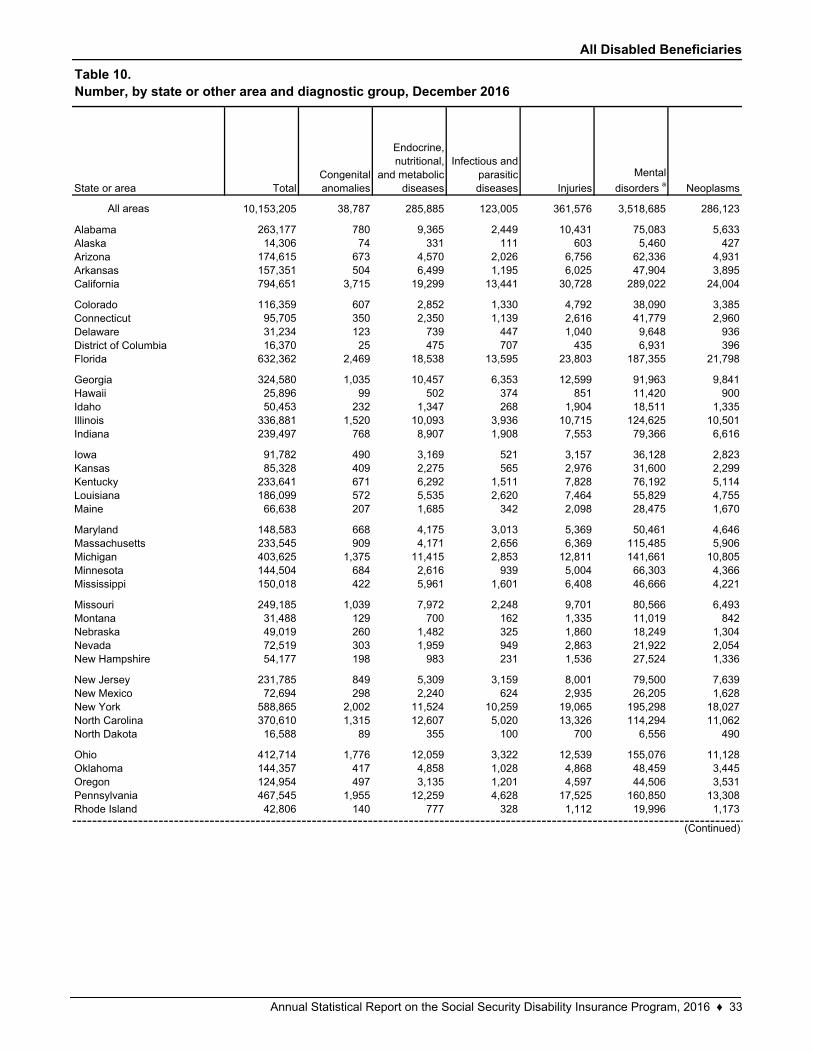
All Disabled Beneficiaries
All areas 10,153,205 38,787 285,885 123,005 361,576 3,518,685 286,123
263,177 780 9,365 2,449 10,431 75,083 5,63314,306 74 331 111 603 5,460 427
174,615 673 4,570 2,026 6,756 62,336 4,931157,351 504 6,499 1,195 6,025 47,904 3,895794,651 3,715 19,299 13,441 30,728 289,022 24,004
116,359 607 2,852 1,330 4,792 38,090 3,38595,705 350 2,350 1,139 2,616 41,779 2,96031,234 123 739 447 1,040 9,648 93616,370 25 475 707 435 6,931 396
632,362 2,469 18,538 13,595 23,803 187,355 21,798
324,580 1,035 10,457 6,353 12,599 91,963 9,84125,896 99 502 374 851 11,420 90050,453 232 1,347 268 1,904 18,511 1,335
336,881 1,520 10,093 3,936 10,715 124,625 10,501239,497 768 8,907 1,908 7,553 79,366 6,616
91,782 490 3,169 521 3,157 36,128 2,82385,328 409 2,275 565 2,976 31,600 2,299
233,641 671 6,292 1,511 7,828 76,192 5,114186,099 572 5,535 2,620 7,464 55,829 4,75566,638 207 1,685 342 2,098 28,475 1,670
148,583 668 4,175 3,013 5,369 50,461 4,646233,545 909 4,171 2,656 6,369 115,485 5,906403,625 1,375 11,415 2,853 12,811 141,661 10,805144,504 684 2,616 939 5,004 66,303 4,366150,018 422 5,961 1,601 6,408 46,666 4,221
249,185 1,039 7,972 2,248 9,701 80,566 6,49331,488 129 700 162 1,335 11,019 84249,019 260 1,482 325 1,860 18,249 1,30472,519 303 1,959 949 2,863 21,922 2,05454,177 198 983 231 1,536 27,524 1,336
231,785 849 5,309 3,159 8,001 79,500 7,63972,694 298 2,240 624 2,935 26,205 1,628
588,865 2,002 11,524 10,259 19,065 195,298 18,027370,610 1,315 12,607 5,020 13,326 114,294 11,06216,588 89 355 100 700 6,556 490
412,714 1,776 12,059 3,322 12,539 155,076 11,128144,357 417 4,858 1,028 4,868 48,459 3,445124,954 497 3,135 1,201 4,597 44,506 3,531467,545 1,955 12,259 4,628 17,525 160,850 13,30842,806 140 777 328 1,112 19,996 1,173Rhode Island
Pennsylvania
NebraskaNevadaNew Hampshire
New JerseyNew MexicoNew YorkNorth CarolinaNorth Dakota
OhioOklahomaOregon
Colorado
Florida
GeorgiaHawaiiIdahoIllinois
Montana
IowaKansasKentuckyLouisianaMaine
MarylandMassachusettsMichiganMinnesotaMississippi
Missouri
Indiana
State or area
AlabamaAlaskaArizonaArkansasCalifornia
Neoplasms
ConnecticutDelawareDistrict of Columbia
TotalCongenital anomalies
Endocrine, nutritional,
and metabolic diseases
Infectious and parasitic diseases Injuries
Mental
disorders a
Table 10.Number, by state or other area and diagnostic group, December 2016
(Continued)
Annual Statistical Report on the Social Security Disability Insurance Program, 2016 ♦ 33
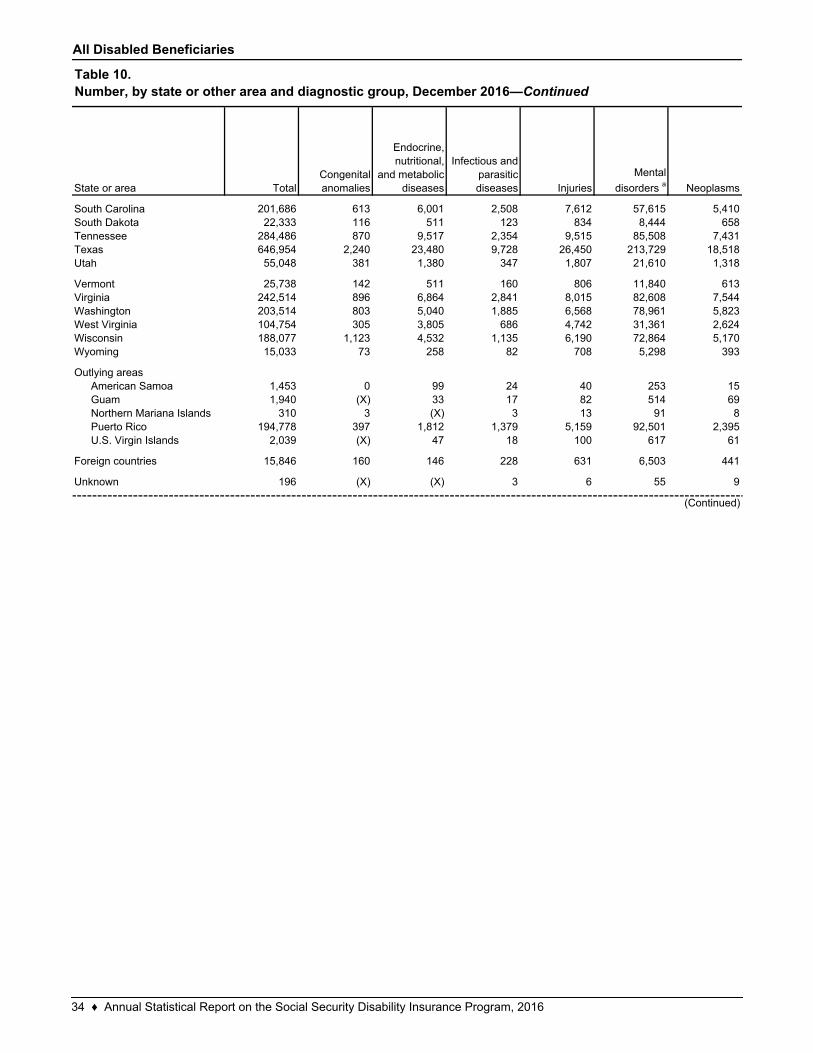
All Disabled Beneficiaries
201,686 613 6,001 2,508 7,612 57,615 5,41022,333 116 511 123 834 8,444 658
284,486 870 9,517 2,354 9,515 85,508 7,431646,954 2,240 23,480 9,728 26,450 213,729 18,51855,048 381 1,380 347 1,807 21,610 1,318
25,738 142 511 160 806 11,840 613242,514 896 6,864 2,841 8,015 82,608 7,544203,514 803 5,040 1,885 6,568 78,961 5,823104,754 305 3,805 686 4,742 31,361 2,624188,077 1,123 4,532 1,135 6,190 72,864 5,17015,033 73 258 82 708 5,298 393
1,453 0 99 24 40 253 151,940 (X) 33 17 82 514 69
310 3 (X) 3 13 91 8194,778 397 1,812 1,379 5,159 92,501 2,395
2,039 (X) 47 18 100 617 61
15,846 160 146 228 631 6,503 441
196 (X) (X) 3 6 55 9Unknown
Outlying areasAmerican SamoaGuamNorthern Mariana IslandsPuerto RicoU.S. Virgin Islands
South CarolinaSouth DakotaTennesseeTexasUtah
VermontVirginiaWashington
(Continued)
Table 10.Number, by state or other area and diagnostic group, December 2016—Continued
State or area TotalCongenital anomalies
Endocrine, nutritional,
and metabolic diseases
Infectious and parasitic diseases Injuries
Mental
disorders a Neoplasms
Wyoming
West VirginiaWisconsin
Foreign countries
34 ♦ Annual Statistical Report on the Social Security Disability Insurance Program, 2016
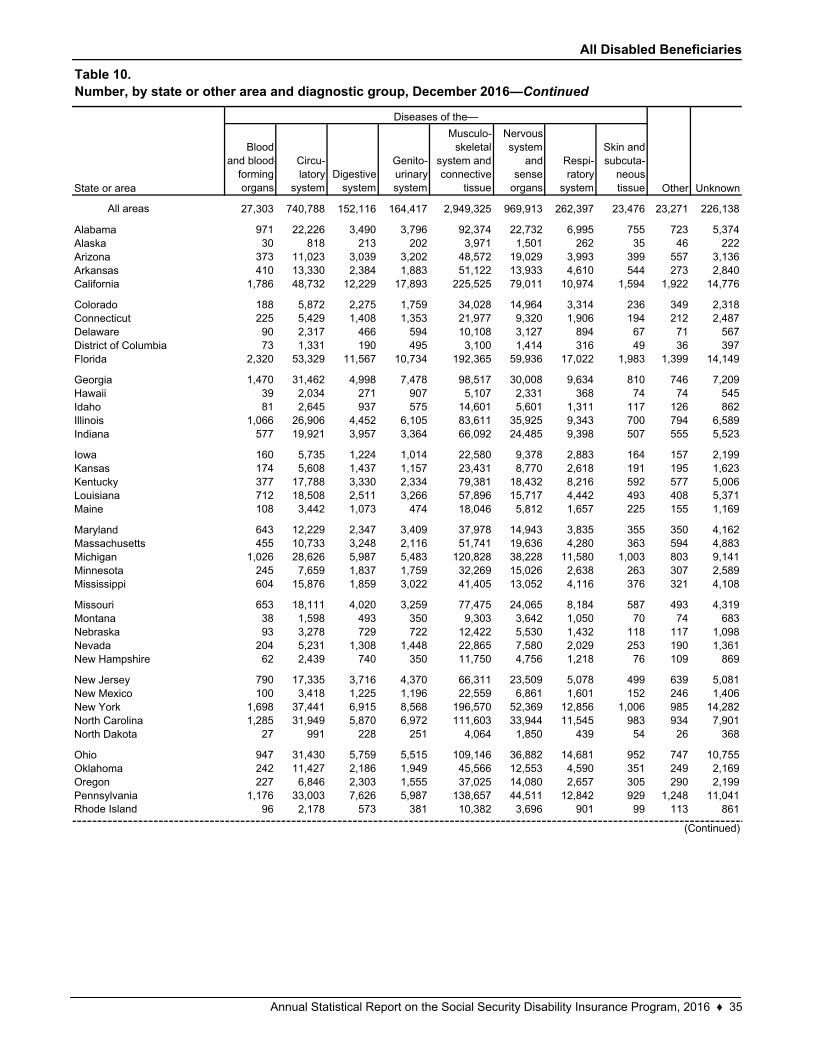
All Disabled Beneficiaries
Blood and blood-
forming organs
Circu-latory
systemDigestive
system
Genito-urinary system
Musculo-skeletal
system and connective
tissue
Nervous system
and sense
organs
Respi-ratory
system
Skin and subcuta-
neous tissue
All areas 27,303 740,788 152,116 164,417 2,949,325 969,913 262,397 23,476 23,271 226,138
971 22,226 3,490 3,796 92,374 22,732 6,995 755 723 5,37430 818 213 202 3,971 1,501 262 35 46 222
373 11,023 3,039 3,202 48,572 19,029 3,993 399 557 3,136410 13,330 2,384 1,883 51,122 13,933 4,610 544 273 2,840
1,786 48,732 12,229 17,893 225,525 79,011 10,974 1,594 1,922 14,776
188 5,872 2,275 1,759 34,028 14,964 3,314 236 349 2,318225 5,429 1,408 1,353 21,977 9,320 1,906 194 212 2,48790 2,317 466 594 10,108 3,127 894 67 71 56773 1,331 190 495 3,100 1,414 316 49 36 397
2,320 53,329 11,567 10,734 192,365 59,936 17,022 1,983 1,399 14,149
1,470 31,462 4,998 7,478 98,517 30,008 9,634 810 746 7,20939 2,034 271 907 5,107 2,331 368 74 74 54581 2,645 937 575 14,601 5,601 1,311 117 126 862
1,066 26,906 4,452 6,105 83,611 35,925 9,343 700 794 6,589577 19,921 3,957 3,364 66,092 24,485 9,398 507 555 5,523
160 5,735 1,224 1,014 22,580 9,378 2,883 164 157 2,199174 5,608 1,437 1,157 23,431 8,770 2,618 191 195 1,623377 17,788 3,330 2,334 79,381 18,432 8,216 592 577 5,006712 18,508 2,511 3,266 57,896 15,717 4,442 493 408 5,371108 3,442 1,073 474 18,046 5,812 1,657 225 155 1,169
643 12,229 2,347 3,409 37,978 14,943 3,835 355 350 4,162455 10,733 3,248 2,116 51,741 19,636 4,280 363 594 4,883
1,026 28,626 5,987 5,483 120,828 38,228 11,580 1,003 803 9,141245 7,659 1,837 1,759 32,269 15,026 2,638 263 307 2,589604 15,876 1,859 3,022 41,405 13,052 4,116 376 321 4,108
653 18,111 4,020 3,259 77,475 24,065 8,184 587 493 4,31938 1,598 493 350 9,303 3,642 1,050 70 74 68393 3,278 729 722 12,422 5,530 1,432 118 117 1,098
204 5,231 1,308 1,448 22,865 7,580 2,029 253 190 1,36162 2,439 740 350 11,750 4,756 1,218 76 109 869
790 17,335 3,716 4,370 66,311 23,509 5,078 499 639 5,081100 3,418 1,225 1,196 22,559 6,861 1,601 152 246 1,406
1,698 37,441 6,915 8,568 196,570 52,369 12,856 1,006 985 14,2821,285 31,949 5,870 6,972 111,603 33,944 11,545 983 934 7,901
27 991 228 251 4,064 1,850 439 54 26 368
947 31,430 5,759 5,515 109,146 36,882 14,681 952 747 10,755242 11,427 2,186 1,949 45,566 12,553 4,590 351 249 2,169227 6,846 2,303 1,555 37,025 14,080 2,657 305 290 2,199
1,176 33,003 7,626 5,987 138,657 44,511 12,842 929 1,248 11,04196 2,178 573 381 10,382 3,696 901 99 113 861
Other Unknown
Diseases of the—
California
ColoradoConnecticutDelawareDistrict of Columbia
State or area
AlabamaAlaskaArizonaArkansas
Indiana
IowaKansasKentuckyLouisiana
Florida
GeorgiaHawaiiIdahoIllinois
Mississippi
MissouriMontanaNebraskaNevada
Maine
MarylandMassachusettsMichiganMinnesota
North Dakota
OhioOklahomaOregonPennsylvania
New Hampshire
New JerseyNew MexicoNew YorkNorth Carolina
Table 10.Number, by state or other area and diagnostic group, December 2016—Continued
Rhode Island
(Continued)
Annual Statistical Report on the Social Security Disability Insurance Program, 2016 ♦ 35
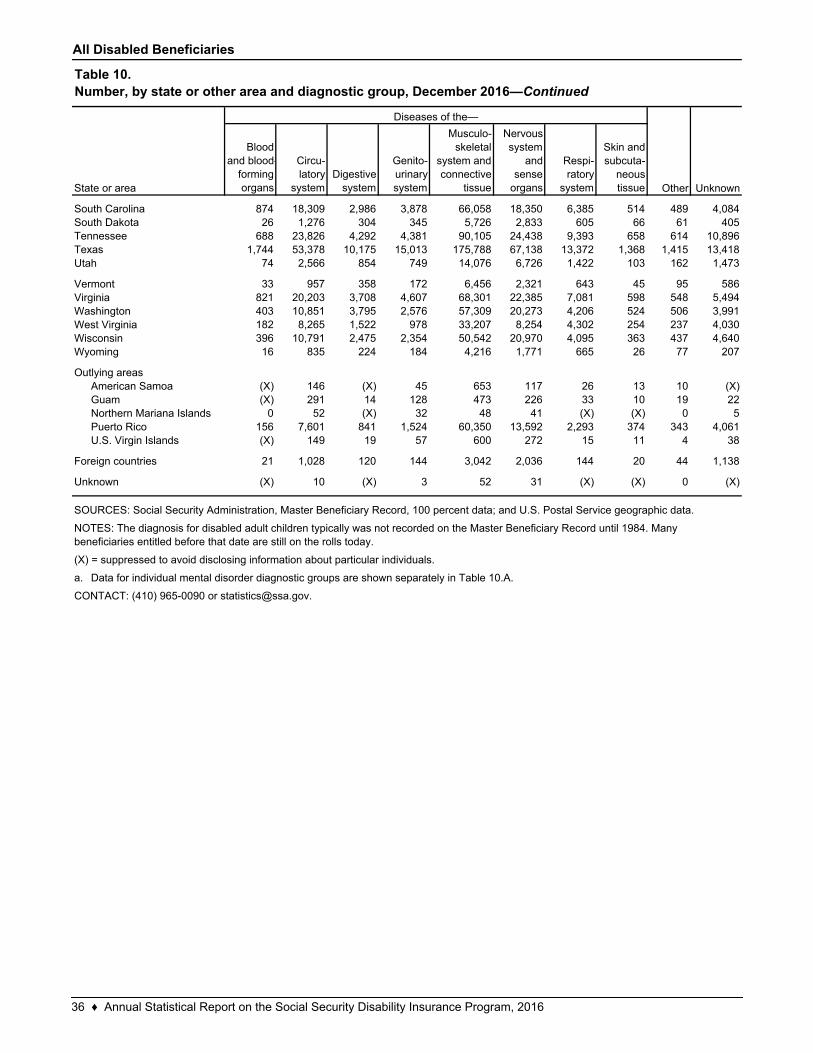
All Disabled Beneficiaries
Blood and blood-
forming organs
Circu-latory
systemDigestive
system
Genito-urinary system
Musculo-skeletal
system and connective
tissue
Nervous system
and sense
organs
Respi-ratory
system
Skin and subcuta-
neous tissue
874 18,309 2,986 3,878 66,058 18,350 6,385 514 489 4,08426 1,276 304 345 5,726 2,833 605 66 61 405
688 23,826 4,292 4,381 90,105 24,438 9,393 658 614 10,8961,744 53,378 10,175 15,013 175,788 67,138 13,372 1,368 1,415 13,418
74 2,566 854 749 14,076 6,726 1,422 103 162 1,473
33 957 358 172 6,456 2,321 643 45 95 586821 20,203 3,708 4,607 68,301 22,385 7,081 598 548 5,494403 10,851 3,795 2,576 57,309 20,273 4,206 524 506 3,991182 8,265 1,522 978 33,207 8,254 4,302 254 237 4,030396 10,791 2,475 2,354 50,542 20,970 4,095 363 437 4,64016 835 224 184 4,216 1,771 665 26 77 207
(X) 146 (X) 45 653 117 26 13 10 (X)(X) 291 14 128 473 226 33 10 19 22
0 52 (X) 32 48 41 (X) (X) 0 5156 7,601 841 1,524 60,350 13,592 2,293 374 343 4,061(X) 149 19 57 600 272 15 11 4 38
21 1,028 120 144 3,042 2,036 144 20 44 1,138
(X) 10 (X) 3 52 31 (X) (X) 0 (X)
a.
SOURCES: Social Security Administration, Master Beneficiary Record, 100 percent data; and U.S. Postal Service geographic data.
NOTES: The diagnosis for disabled adult children typically was not recorded on the Master Beneficiary Record until 1984. Many beneficiaries entitled before that date are still on the rolls today.
Diseases of the—
Other Unknown
Northern Mariana IslandsPuerto RicoU.S. Virgin Islands
Foreign countries
Unknown
WisconsinWyoming
Outlying areasAmerican SamoaGuam
Utah
VermontVirginiaWashingtonWest Virginia
(X) = suppressed to avoid disclosing information about particular individuals.
Data for individual mental disorder diagnostic groups are shown separately in Table 10.A.
CONTACT: (410) 965-0090 or [email protected].
Table 10.Number, by state or other area and diagnostic group, December 2016—Continued
State or area
South CarolinaSouth DakotaTennesseeTexas
36 ♦ Annual Statistical Report on the Social Security Disability Insurance Program, 2016
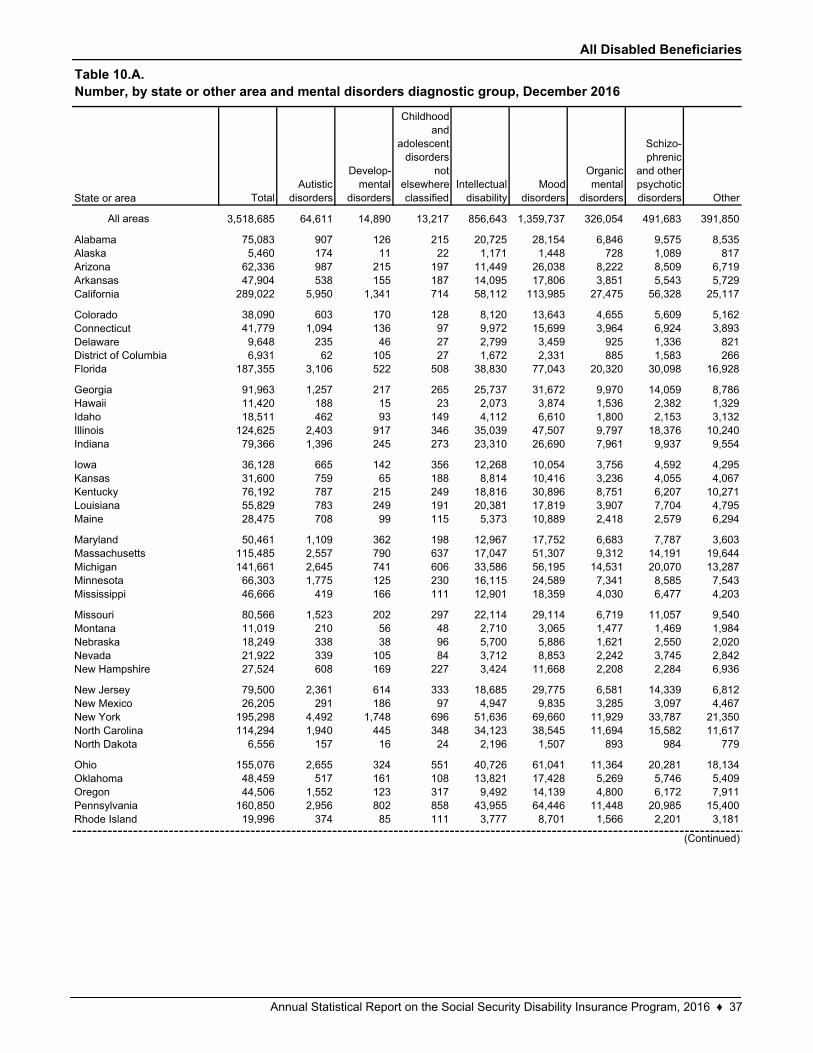
All Disabled Beneficiaries
TotalAutistic
disorders
Develop-mental
disorders
Childhood and
adolescent disorders
not elsewhere classified
Intellectual disability
Mood disorders
Organic mental
disorders
Schizo-phrenic
and other psychotic disorders Other
All areas 3,518,685 64,611 14,890 13,217 856,643 1,359,737 326,054 491,683 391,850
75,083 907 126 215 20,725 28,154 6,846 9,575 8,5355,460 174 11 22 1,171 1,448 728 1,089 817
62,336 987 215 197 11,449 26,038 8,222 8,509 6,71947,904 538 155 187 14,095 17,806 3,851 5,543 5,729
289,022 5,950 1,341 714 58,112 113,985 27,475 56,328 25,117
38,090 603 170 128 8,120 13,643 4,655 5,609 5,16241,779 1,094 136 97 9,972 15,699 3,964 6,924 3,8939,648 235 46 27 2,799 3,459 925 1,336 8216,931 62 105 27 1,672 2,331 885 1,583 266
187,355 3,106 522 508 38,830 77,043 20,320 30,098 16,928
91,963 1,257 217 265 25,737 31,672 9,970 14,059 8,78611,420 188 15 23 2,073 3,874 1,536 2,382 1,32918,511 462 93 149 4,112 6,610 1,800 2,153 3,132
124,625 2,403 917 346 35,039 47,507 9,797 18,376 10,24079,366 1,396 245 273 23,310 26,690 7,961 9,937 9,554
36,128 665 142 356 12,268 10,054 3,756 4,592 4,29531,600 759 65 188 8,814 10,416 3,236 4,055 4,06776,192 787 215 249 18,816 30,896 8,751 6,207 10,27155,829 783 249 191 20,381 17,819 3,907 7,704 4,79528,475 708 99 115 5,373 10,889 2,418 2,579 6,294
50,461 1,109 362 198 12,967 17,752 6,683 7,787 3,603115,485 2,557 790 637 17,047 51,307 9,312 14,191 19,644141,661 2,645 741 606 33,586 56,195 14,531 20,070 13,28766,303 1,775 125 230 16,115 24,589 7,341 8,585 7,54346,666 419 166 111 12,901 18,359 4,030 6,477 4,203
80,566 1,523 202 297 22,114 29,114 6,719 11,057 9,54011,019 210 56 48 2,710 3,065 1,477 1,469 1,98418,249 338 38 96 5,700 5,886 1,621 2,550 2,02021,922 339 105 84 3,712 8,853 2,242 3,745 2,84227,524 608 169 227 3,424 11,668 2,208 2,284 6,936
79,500 2,361 614 333 18,685 29,775 6,581 14,339 6,81226,205 291 186 97 4,947 9,835 3,285 3,097 4,467
195,298 4,492 1,748 696 51,636 69,660 11,929 33,787 21,350114,294 1,940 445 348 34,123 38,545 11,694 15,582 11,617
6,556 157 16 24 2,196 1,507 893 984 779
155,076 2,655 324 551 40,726 61,041 11,364 20,281 18,13448,459 517 161 108 13,821 17,428 5,269 5,746 5,40944,506 1,552 123 317 9,492 14,139 4,800 6,172 7,911
160,850 2,956 802 858 43,955 64,446 11,448 20,985 15,40019,996 374 85 111 3,777 8,701 1,566 2,201 3,181
OklahomaOregonPennsylvaniaRhode Island
Michigan
Ohio
Mississippi
MissouriMontanaNebraskaNevadaNew Hampshire
New JerseyNew MexicoNew YorkNorth CarolinaNorth Dakota
California
ColoradoConnecticutDelaware
Table 10.A.Number, by state or other area and mental disorders diagnostic group, December 2016
State or area
AlabamaAlaskaArizonaArkansas
District of ColumbiaFlorida
GeorgiaHawaii
(Continued)
Minnesota
IdahoIllinoisIndiana
IowaKansasKentuckyLouisianaMaine
MarylandMassachusetts
Annual Statistical Report on the Social Security Disability Insurance Program, 2016 ♦ 37
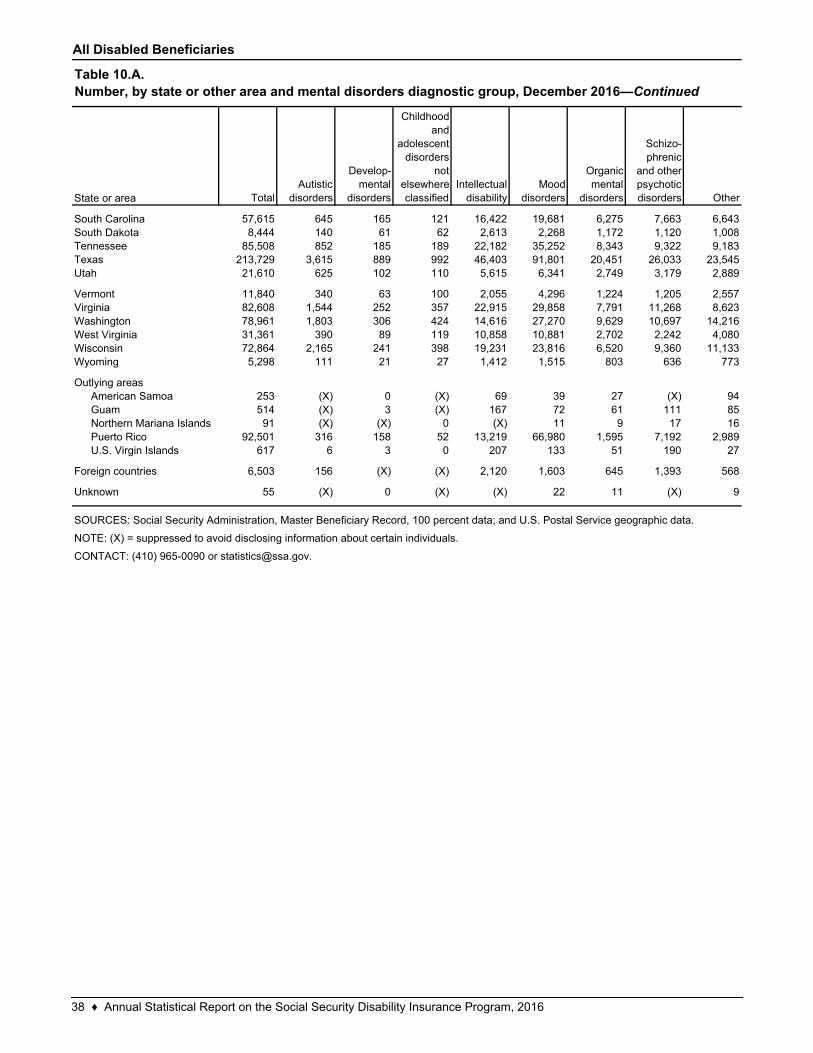
All Disabled Beneficiaries
TotalAutistic
disorders
Develop-mental
disorders
Childhood and
adolescent disorders
not elsewhere classified
Intellectual disability
Mood disorders
Organic mental
disorders
Schizo-phrenic
and other psychotic disorders Other
57,615 645 165 121 16,422 19,681 6,275 7,663 6,6438,444 140 61 62 2,613 2,268 1,172 1,120 1,008
85,508 852 185 189 22,182 35,252 8,343 9,322 9,183213,729 3,615 889 992 46,403 91,801 20,451 26,033 23,54521,610 625 102 110 5,615 6,341 2,749 3,179 2,889
11,840 340 63 100 2,055 4,296 1,224 1,205 2,55782,608 1,544 252 357 22,915 29,858 7,791 11,268 8,62378,961 1,803 306 424 14,616 27,270 9,629 10,697 14,21631,361 390 89 119 10,858 10,881 2,702 2,242 4,08072,864 2,165 241 398 19,231 23,816 6,520 9,360 11,1335,298 111 21 27 1,412 1,515 803 636 773
253 (X) 0 (X) 69 39 27 (X) 94514 (X) 3 (X) 167 72 61 111 8591 (X) (X) 0 (X) 11 9 17 16
92,501 316 158 52 13,219 66,980 1,595 7,192 2,989617 6 3 0 207 133 51 190 27
6,503 156 (X) (X) 2,120 1,603 645 1,393 568
55 (X) 0 (X) (X) 22 11 (X) 9
Guam
CONTACT: (410) 965-0090 or [email protected].
SOURCES: Social Security Administration, Master Beneficiary Record, 100 percent data; and U.S. Postal Service geographic data.
NOTE: (X) = suppressed to avoid disclosing information about certain individuals.
Northern Mariana IslandsPuerto RicoU.S. Virgin Islands
Foreign countries
Unknown
West VirginiaWisconsinWyoming
Outlying areasAmerican Samoa
Washington
South CarolinaSouth Dakota
Table 10.A.Number, by state or other area and mental disorders diagnostic group, December 2016—Continued
State or area
TennesseeTexasUtah
VermontVirginia
38 ♦ Annual Statistical Report on the Social Security Disability Insurance Program, 2016
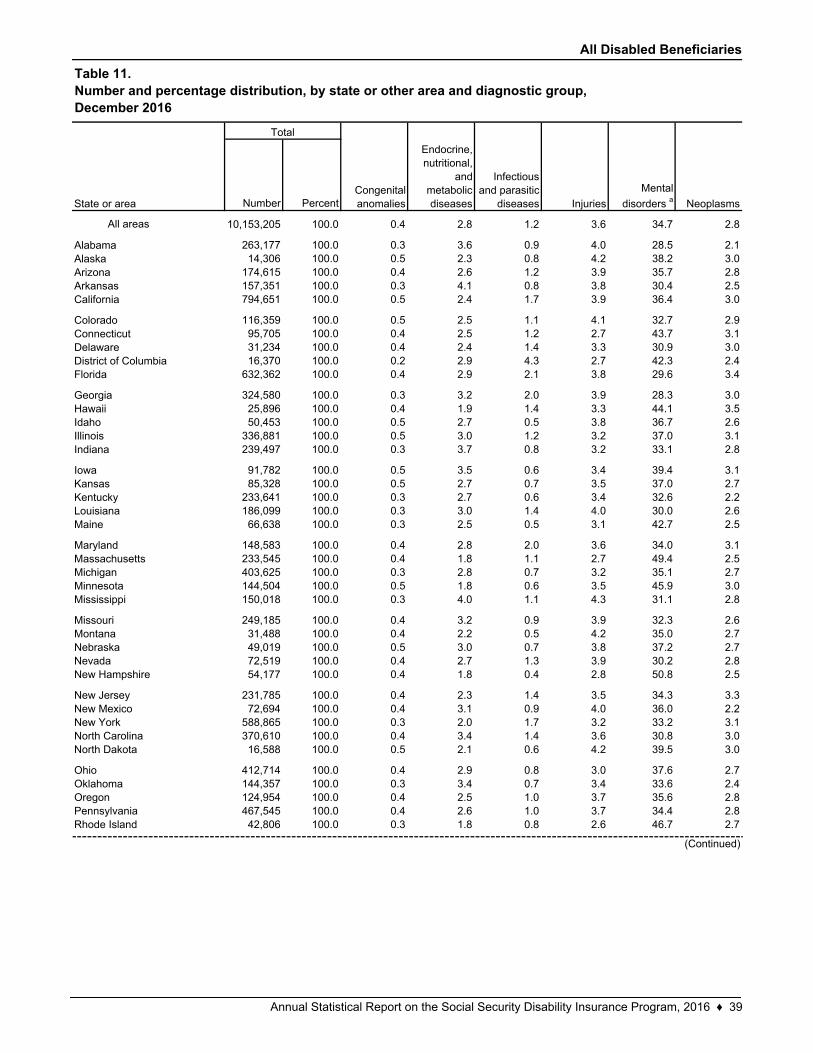
All Disabled Beneficiaries
Number Percent
All areas 10,153,205 100.0 0.4 2.8 1.2 3.6 34.7 2.8
263,177 100.0 0.3 3.6 0.9 4.0 28.5 2.114,306 100.0 0.5 2.3 0.8 4.2 38.2 3.0
174,615 100.0 0.4 2.6 1.2 3.9 35.7 2.8157,351 100.0 0.3 4.1 0.8 3.8 30.4 2.5794,651 100.0 0.5 2.4 1.7 3.9 36.4 3.0
116,359 100.0 0.5 2.5 1.1 4.1 32.7 2.995,705 100.0 0.4 2.5 1.2 2.7 43.7 3.131,234 100.0 0.4 2.4 1.4 3.3 30.9 3.016,370 100.0 0.2 2.9 4.3 2.7 42.3 2.4
632,362 100.0 0.4 2.9 2.1 3.8 29.6 3.4
324,580 100.0 0.3 3.2 2.0 3.9 28.3 3.025,896 100.0 0.4 1.9 1.4 3.3 44.1 3.550,453 100.0 0.5 2.7 0.5 3.8 36.7 2.6
336,881 100.0 0.5 3.0 1.2 3.2 37.0 3.1239,497 100.0 0.3 3.7 0.8 3.2 33.1 2.8
91,782 100.0 0.5 3.5 0.6 3.4 39.4 3.185,328 100.0 0.5 2.7 0.7 3.5 37.0 2.7
233,641 100.0 0.3 2.7 0.6 3.4 32.6 2.2186,099 100.0 0.3 3.0 1.4 4.0 30.0 2.666,638 100.0 0.3 2.5 0.5 3.1 42.7 2.5
148,583 100.0 0.4 2.8 2.0 3.6 34.0 3.1233,545 100.0 0.4 1.8 1.1 2.7 49.4 2.5403,625 100.0 0.3 2.8 0.7 3.2 35.1 2.7144,504 100.0 0.5 1.8 0.6 3.5 45.9 3.0150,018 100.0 0.3 4.0 1.1 4.3 31.1 2.8
249,185 100.0 0.4 3.2 0.9 3.9 32.3 2.631,488 100.0 0.4 2.2 0.5 4.2 35.0 2.749,019 100.0 0.5 3.0 0.7 3.8 37.2 2.772,519 100.0 0.4 2.7 1.3 3.9 30.2 2.854,177 100.0 0.4 1.8 0.4 2.8 50.8 2.5
231,785 100.0 0.4 2.3 1.4 3.5 34.3 3.372,694 100.0 0.4 3.1 0.9 4.0 36.0 2.2
588,865 100.0 0.3 2.0 1.7 3.2 33.2 3.1370,610 100.0 0.4 3.4 1.4 3.6 30.8 3.016,588 100.0 0.5 2.1 0.6 4.2 39.5 3.0
412,714 100.0 0.4 2.9 0.8 3.0 37.6 2.7144,357 100.0 0.3 3.4 0.7 3.4 33.6 2.4124,954 100.0 0.4 2.5 1.0 3.7 35.6 2.8467,545 100.0 0.4 2.6 1.0 3.7 34.4 2.842,806 100.0 0.3 1.8 0.8 2.6 46.7 2.7Rhode Island
Pennsylvania
NebraskaNevadaNew Hampshire
New JerseyNew MexicoNew YorkNorth CarolinaNorth Dakota
OhioOklahomaOregon
Colorado
Florida
GeorgiaHawaiiIdahoIllinois
Montana
IowaKansasKentuckyLouisianaMaine
MarylandMassachusettsMichiganMinnesotaMississippi
Missouri
Indiana
State or area
AlabamaAlaskaArizonaArkansasCalifornia
Neoplasms
ConnecticutDelawareDistrict of Columbia
Total
Congenital anomalies
Endocrine, nutritional,
and metabolic diseases
Infectious and parasitic
diseases Injuries
Mental
disorders a
Table 11.Number and percentage distribution, by state or other area and diagnostic group,December 2016
(Continued)
Annual Statistical Report on the Social Security Disability Insurance Program, 2016 ♦ 39
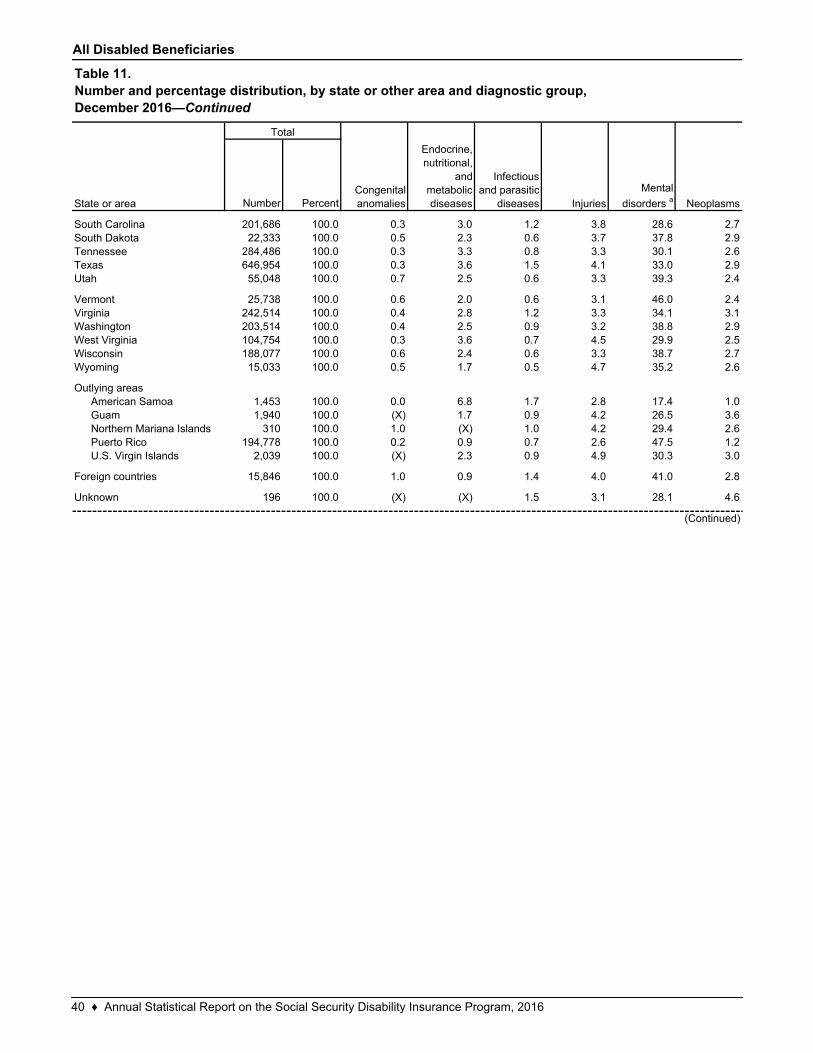
All Disabled Beneficiaries
Number Percent
201,686 100.0 0.3 3.0 1.2 3.8 28.6 2.722,333 100.0 0.5 2.3 0.6 3.7 37.8 2.9
284,486 100.0 0.3 3.3 0.8 3.3 30.1 2.6646,954 100.0 0.3 3.6 1.5 4.1 33.0 2.955,048 100.0 0.7 2.5 0.6 3.3 39.3 2.4
25,738 100.0 0.6 2.0 0.6 3.1 46.0 2.4242,514 100.0 0.4 2.8 1.2 3.3 34.1 3.1203,514 100.0 0.4 2.5 0.9 3.2 38.8 2.9104,754 100.0 0.3 3.6 0.7 4.5 29.9 2.5188,077 100.0 0.6 2.4 0.6 3.3 38.7 2.715,033 100.0 0.5 1.7 0.5 4.7 35.2 2.6
1,453 100.0 0.0 6.8 1.7 2.8 17.4 1.01,940 100.0 (X) 1.7 0.9 4.2 26.5 3.6
310 100.0 1.0 (X) 1.0 4.2 29.4 2.6194,778 100.0 0.2 0.9 0.7 2.6 47.5 1.2
2,039 100.0 (X) 2.3 0.9 4.9 30.3 3.0
15,846 100.0 1.0 0.9 1.4 4.0 41.0 2.8
196 100.0 (X) (X) 1.5 3.1 28.1 4.6Unknown
Outlying areasAmerican SamoaGuamNorthern Mariana IslandsPuerto RicoU.S. Virgin Islands
South CarolinaSouth DakotaTennesseeTexasUtah
VermontVirginiaWashington
(Continued)
Table 11.Number and percentage distribution, by state or other area and diagnostic group,December 2016—Continued
State or area
Total
Congenital anomalies
Endocrine, nutritional,
and metabolic diseases
Infectious and parasitic
diseases Injuries
Mental
disorders a Neoplasms
Wyoming
West VirginiaWisconsin
Foreign countries
40 ♦ Annual Statistical Report on the Social Security Disability Insurance Program, 2016
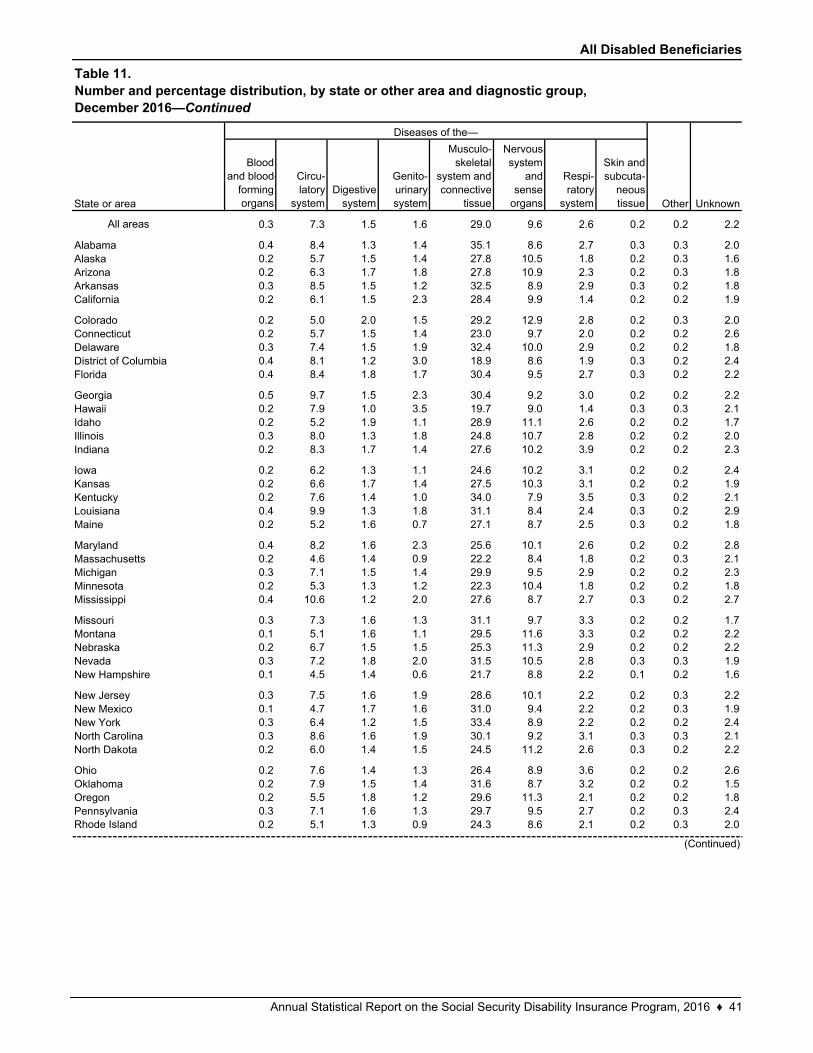
All Disabled Beneficiaries
Blood and blood-
forming organs
Circu-latory
systemDigestive
system
Genito-urinary system
Musculo-skeletal
system and connective
tissue
Nervous system
and sense
organs
Respi-ratory
system
Skin and subcuta-
neous tissue
All areas 0.3 7.3 1.5 1.6 29.0 9.6 2.6 0.2 0.2 2.2
0.4 8.4 1.3 1.4 35.1 8.6 2.7 0.3 0.3 2.00.2 5.7 1.5 1.4 27.8 10.5 1.8 0.2 0.3 1.60.2 6.3 1.7 1.8 27.8 10.9 2.3 0.2 0.3 1.80.3 8.5 1.5 1.2 32.5 8.9 2.9 0.3 0.2 1.80.2 6.1 1.5 2.3 28.4 9.9 1.4 0.2 0.2 1.9
0.2 5.0 2.0 1.5 29.2 12.9 2.8 0.2 0.3 2.00.2 5.7 1.5 1.4 23.0 9.7 2.0 0.2 0.2 2.60.3 7.4 1.5 1.9 32.4 10.0 2.9 0.2 0.2 1.80.4 8.1 1.2 3.0 18.9 8.6 1.9 0.3 0.2 2.40.4 8.4 1.8 1.7 30.4 9.5 2.7 0.3 0.2 2.2
0.5 9.7 1.5 2.3 30.4 9.2 3.0 0.2 0.2 2.20.2 7.9 1.0 3.5 19.7 9.0 1.4 0.3 0.3 2.10.2 5.2 1.9 1.1 28.9 11.1 2.6 0.2 0.2 1.70.3 8.0 1.3 1.8 24.8 10.7 2.8 0.2 0.2 2.00.2 8.3 1.7 1.4 27.6 10.2 3.9 0.2 0.2 2.3
0.2 6.2 1.3 1.1 24.6 10.2 3.1 0.2 0.2 2.40.2 6.6 1.7 1.4 27.5 10.3 3.1 0.2 0.2 1.90.2 7.6 1.4 1.0 34.0 7.9 3.5 0.3 0.2 2.10.4 9.9 1.3 1.8 31.1 8.4 2.4 0.3 0.2 2.90.2 5.2 1.6 0.7 27.1 8.7 2.5 0.3 0.2 1.8
0.4 8.2 1.6 2.3 25.6 10.1 2.6 0.2 0.2 2.80.2 4.6 1.4 0.9 22.2 8.4 1.8 0.2 0.3 2.10.3 7.1 1.5 1.4 29.9 9.5 2.9 0.2 0.2 2.30.2 5.3 1.3 1.2 22.3 10.4 1.8 0.2 0.2 1.80.4 10.6 1.2 2.0 27.6 8.7 2.7 0.3 0.2 2.7
0.3 7.3 1.6 1.3 31.1 9.7 3.3 0.2 0.2 1.70.1 5.1 1.6 1.1 29.5 11.6 3.3 0.2 0.2 2.20.2 6.7 1.5 1.5 25.3 11.3 2.9 0.2 0.2 2.20.3 7.2 1.8 2.0 31.5 10.5 2.8 0.3 0.3 1.90.1 4.5 1.4 0.6 21.7 8.8 2.2 0.1 0.2 1.6
0.3 7.5 1.6 1.9 28.6 10.1 2.2 0.2 0.3 2.20.1 4.7 1.7 1.6 31.0 9.4 2.2 0.2 0.3 1.90.3 6.4 1.2 1.5 33.4 8.9 2.2 0.2 0.2 2.40.3 8.6 1.6 1.9 30.1 9.2 3.1 0.3 0.3 2.10.2 6.0 1.4 1.5 24.5 11.2 2.6 0.3 0.2 2.2
0.2 7.6 1.4 1.3 26.4 8.9 3.6 0.2 0.2 2.60.2 7.9 1.5 1.4 31.6 8.7 3.2 0.2 0.2 1.50.2 5.5 1.8 1.2 29.6 11.3 2.1 0.2 0.2 1.80.3 7.1 1.6 1.3 29.7 9.5 2.7 0.2 0.3 2.40.2 5.1 1.3 0.9 24.3 8.6 2.1 0.2 0.3 2.0
Other Unknown
Diseases of the—
California
ColoradoConnecticutDelawareDistrict of Columbia
State or area
AlabamaAlaskaArizonaArkansas
Indiana
IowaKansasKentuckyLouisiana
Florida
GeorgiaHawaiiIdahoIllinois
Mississippi
MissouriMontanaNebraskaNevada
Maine
MarylandMassachusettsMichiganMinnesota
North Dakota
OhioOklahomaOregonPennsylvania
New Hampshire
New JerseyNew MexicoNew YorkNorth Carolina
Table 11.Number and percentage distribution, by state or other area and diagnostic group,December 2016—Continued
Rhode Island
(Continued)
Annual Statistical Report on the Social Security Disability Insurance Program, 2016 ♦ 41
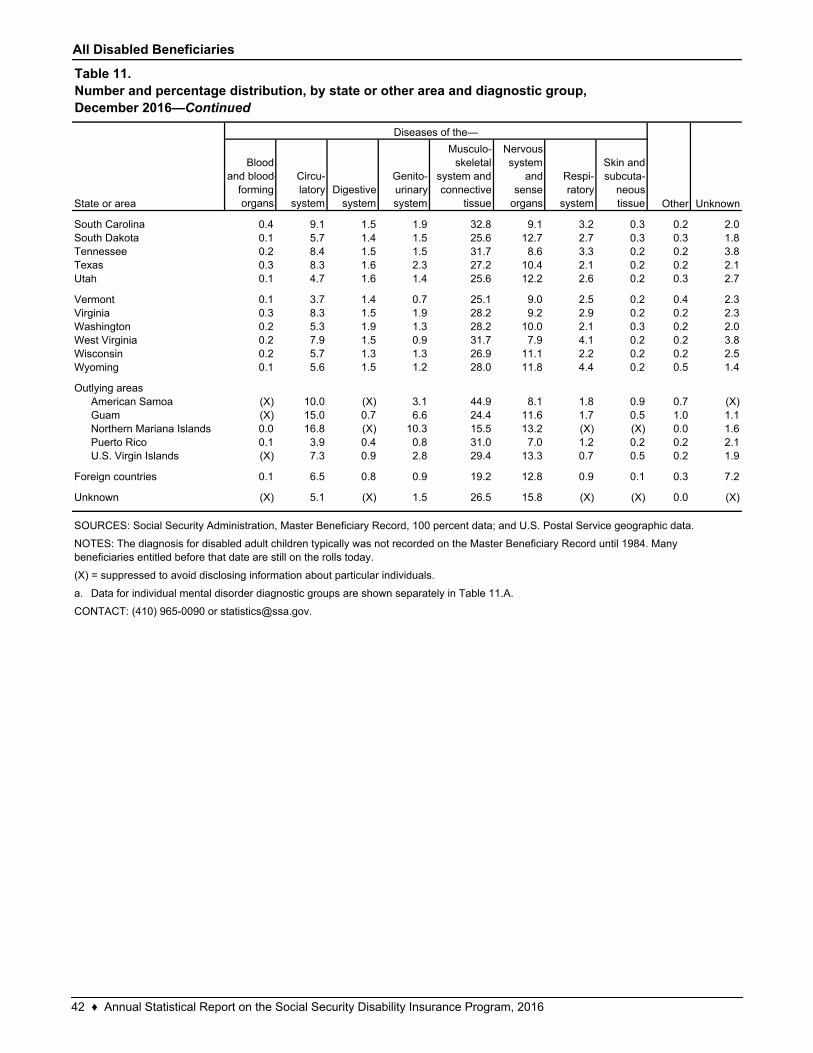
All Disabled Beneficiaries
Blood and blood-
forming organs
Circu-latory
systemDigestive
system
Genito-urinary system
Musculo-skeletal
system and connective
tissue
Nervous system
and sense
organs
Respi-ratory
system
Skin and subcuta-
neous tissue
0.4 9.1 1.5 1.9 32.8 9.1 3.2 0.3 0.2 2.00.1 5.7 1.4 1.5 25.6 12.7 2.7 0.3 0.3 1.80.2 8.4 1.5 1.5 31.7 8.6 3.3 0.2 0.2 3.80.3 8.3 1.6 2.3 27.2 10.4 2.1 0.2 0.2 2.10.1 4.7 1.6 1.4 25.6 12.2 2.6 0.2 0.3 2.7
0.1 3.7 1.4 0.7 25.1 9.0 2.5 0.2 0.4 2.30.3 8.3 1.5 1.9 28.2 9.2 2.9 0.2 0.2 2.30.2 5.3 1.9 1.3 28.2 10.0 2.1 0.3 0.2 2.00.2 7.9 1.5 0.9 31.7 7.9 4.1 0.2 0.2 3.80.2 5.7 1.3 1.3 26.9 11.1 2.2 0.2 0.2 2.50.1 5.6 1.5 1.2 28.0 11.8 4.4 0.2 0.5 1.4
(X) 10.0 (X) 3.1 44.9 8.1 1.8 0.9 0.7 (X)(X) 15.0 0.7 6.6 24.4 11.6 1.7 0.5 1.0 1.10.0 16.8 (X) 10.3 15.5 13.2 (X) (X) 0.0 1.60.1 3.9 0.4 0.8 31.0 7.0 1.2 0.2 0.2 2.1(X) 7.3 0.9 2.8 29.4 13.3 0.7 0.5 0.2 1.9
0.1 6.5 0.8 0.9 19.2 12.8 0.9 0.1 0.3 7.2
(X) 5.1 (X) 1.5 26.5 15.8 (X) (X) 0.0 (X)
a.
SOURCES: Social Security Administration, Master Beneficiary Record, 100 percent data; and U.S. Postal Service geographic data.
NOTES: The diagnosis for disabled adult children typically was not recorded on the Master Beneficiary Record until 1984. Many beneficiaries entitled before that date are still on the rolls today.
Diseases of the—
Other Unknown
Northern Mariana IslandsPuerto RicoU.S. Virgin Islands
Foreign countries
Unknown
WisconsinWyoming
Outlying areasAmerican SamoaGuam
Utah
VermontVirginiaWashingtonWest Virginia
(X) = suppressed to avoid disclosing information about particular individuals.
Data for individual mental disorder diagnostic groups are shown separately in Table 11.A.
CONTACT: (410) 965-0090 or [email protected].
Table 11.Number and percentage distribution, by state or other area and diagnostic group,December 2016—Continued
State or area
South CarolinaSouth DakotaTennesseeTexas
42 ♦ Annual Statistical Report on the Social Security Disability Insurance Program, 2016
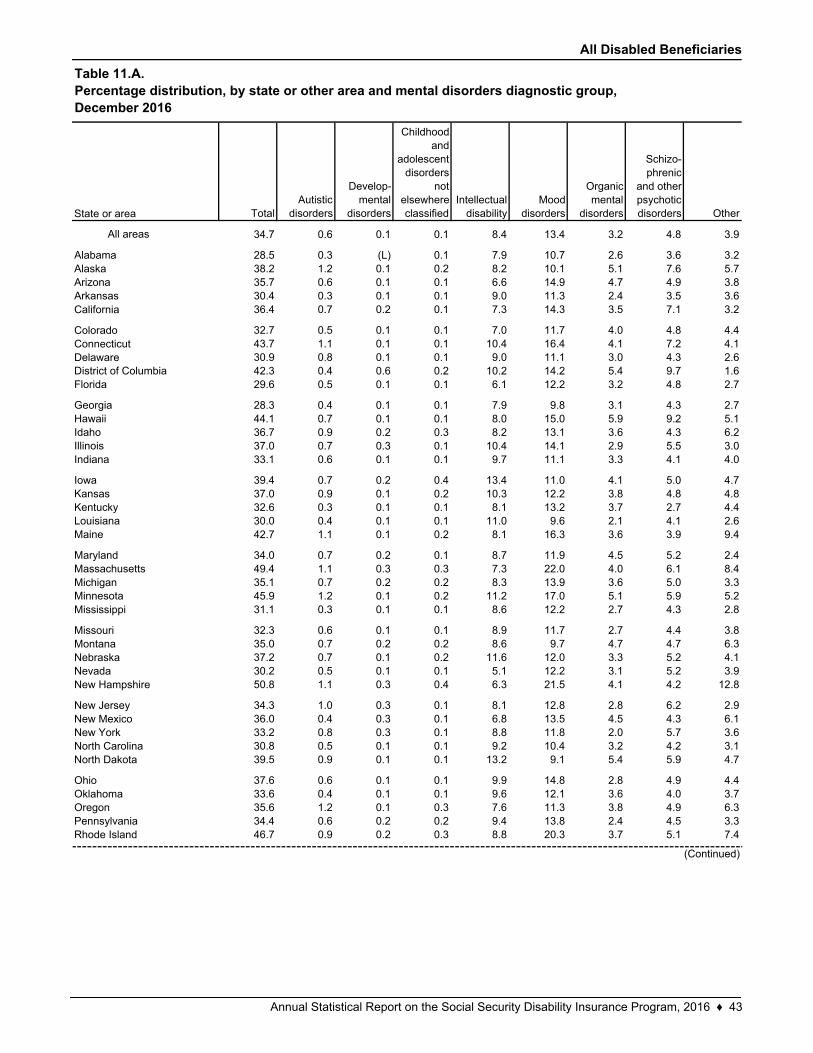
All Disabled Beneficiaries
TotalAutistic
disorders
Develop-mental
disorders
Childhood and
adolescent disorders
not elsewhere classified
Intellectual disability
Mood disorders
Organic mental
disorders
Schizo-phrenic
and other psychotic disorders Other
All areas 34.7 0.6 0.1 0.1 8.4 13.4 3.2 4.8 3.9
28.5 0.3 (L) 0.1 7.9 10.7 2.6 3.6 3.238.2 1.2 0.1 0.2 8.2 10.1 5.1 7.6 5.735.7 0.6 0.1 0.1 6.6 14.9 4.7 4.9 3.830.4 0.3 0.1 0.1 9.0 11.3 2.4 3.5 3.636.4 0.7 0.2 0.1 7.3 14.3 3.5 7.1 3.2
32.7 0.5 0.1 0.1 7.0 11.7 4.0 4.8 4.443.7 1.1 0.1 0.1 10.4 16.4 4.1 7.2 4.130.9 0.8 0.1 0.1 9.0 11.1 3.0 4.3 2.642.3 0.4 0.6 0.2 10.2 14.2 5.4 9.7 1.629.6 0.5 0.1 0.1 6.1 12.2 3.2 4.8 2.7
28.3 0.4 0.1 0.1 7.9 9.8 3.1 4.3 2.744.1 0.7 0.1 0.1 8.0 15.0 5.9 9.2 5.136.7 0.9 0.2 0.3 8.2 13.1 3.6 4.3 6.237.0 0.7 0.3 0.1 10.4 14.1 2.9 5.5 3.033.1 0.6 0.1 0.1 9.7 11.1 3.3 4.1 4.0
39.4 0.7 0.2 0.4 13.4 11.0 4.1 5.0 4.737.0 0.9 0.1 0.2 10.3 12.2 3.8 4.8 4.832.6 0.3 0.1 0.1 8.1 13.2 3.7 2.7 4.430.0 0.4 0.1 0.1 11.0 9.6 2.1 4.1 2.642.7 1.1 0.1 0.2 8.1 16.3 3.6 3.9 9.4
34.0 0.7 0.2 0.1 8.7 11.9 4.5 5.2 2.449.4 1.1 0.3 0.3 7.3 22.0 4.0 6.1 8.435.1 0.7 0.2 0.2 8.3 13.9 3.6 5.0 3.345.9 1.2 0.1 0.2 11.2 17.0 5.1 5.9 5.231.1 0.3 0.1 0.1 8.6 12.2 2.7 4.3 2.8
32.3 0.6 0.1 0.1 8.9 11.7 2.7 4.4 3.835.0 0.7 0.2 0.2 8.6 9.7 4.7 4.7 6.337.2 0.7 0.1 0.2 11.6 12.0 3.3 5.2 4.130.2 0.5 0.1 0.1 5.1 12.2 3.1 5.2 3.950.8 1.1 0.3 0.4 6.3 21.5 4.1 4.2 12.8
34.3 1.0 0.3 0.1 8.1 12.8 2.8 6.2 2.936.0 0.4 0.3 0.1 6.8 13.5 4.5 4.3 6.133.2 0.8 0.3 0.1 8.8 11.8 2.0 5.7 3.630.8 0.5 0.1 0.1 9.2 10.4 3.2 4.2 3.139.5 0.9 0.1 0.1 13.2 9.1 5.4 5.9 4.7
37.6 0.6 0.1 0.1 9.9 14.8 2.8 4.9 4.433.6 0.4 0.1 0.1 9.6 12.1 3.6 4.0 3.735.6 1.2 0.1 0.3 7.6 11.3 3.8 4.9 6.334.4 0.6 0.2 0.2 9.4 13.8 2.4 4.5 3.346.7 0.9 0.2 0.3 8.8 20.3 3.7 5.1 7.4
OklahomaOregonPennsylvaniaRhode Island
Michigan
Ohio
Mississippi
MissouriMontanaNebraskaNevadaNew Hampshire
New JerseyNew MexicoNew YorkNorth CarolinaNorth Dakota
California
ColoradoConnecticutDelaware
Table 11.A.Percentage distribution, by state or other area and mental disorders diagnostic group,December 2016
State or area
AlabamaAlaskaArizonaArkansas
District of ColumbiaFlorida
GeorgiaHawaii
(Continued)
Minnesota
IdahoIllinoisIndiana
IowaKansasKentuckyLouisianaMaine
MarylandMassachusetts
Annual Statistical Report on the Social Security Disability Insurance Program, 2016 ♦ 43
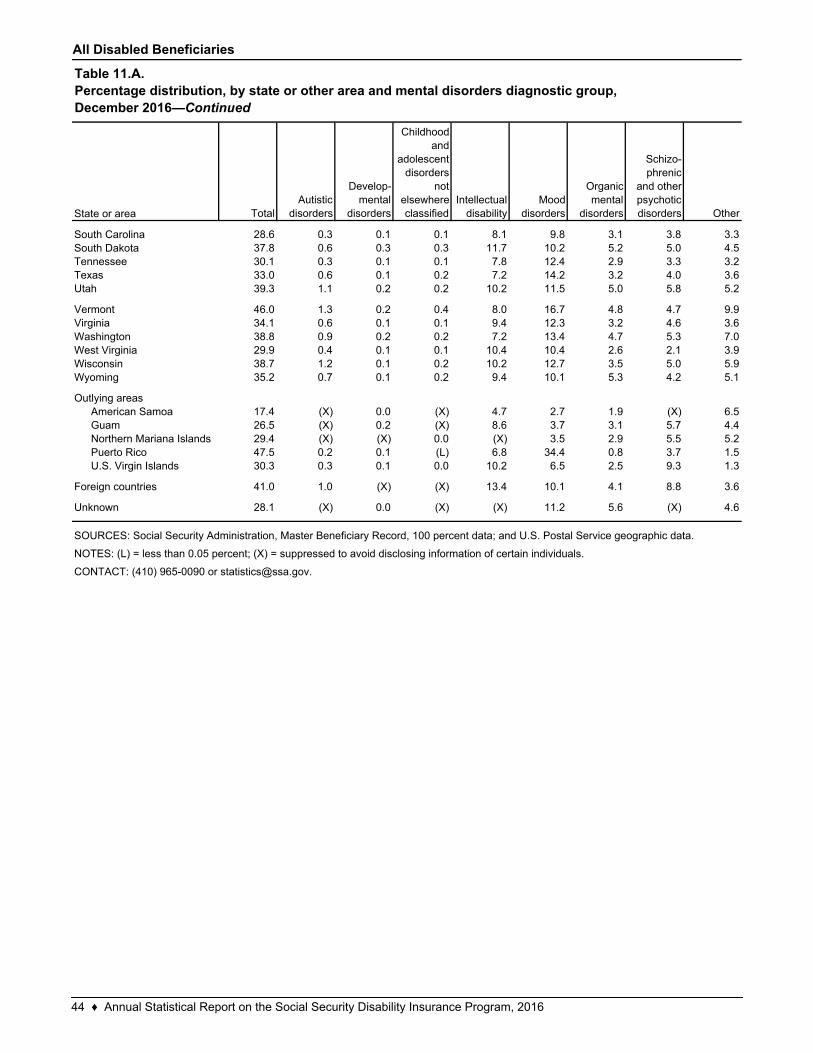
All Disabled Beneficiaries
TotalAutistic
disorders
Develop-mental
disorders
Childhood and
adolescent disorders
not elsewhere classified
Intellectual disability
Mood disorders
Organic mental
disorders
Schizo-phrenic
and other psychotic disorders Other
28.6 0.3 0.1 0.1 8.1 9.8 3.1 3.8 3.337.8 0.6 0.3 0.3 11.7 10.2 5.2 5.0 4.530.1 0.3 0.1 0.1 7.8 12.4 2.9 3.3 3.233.0 0.6 0.1 0.2 7.2 14.2 3.2 4.0 3.639.3 1.1 0.2 0.2 10.2 11.5 5.0 5.8 5.2
46.0 1.3 0.2 0.4 8.0 16.7 4.8 4.7 9.934.1 0.6 0.1 0.1 9.4 12.3 3.2 4.6 3.638.8 0.9 0.2 0.2 7.2 13.4 4.7 5.3 7.029.9 0.4 0.1 0.1 10.4 10.4 2.6 2.1 3.938.7 1.2 0.1 0.2 10.2 12.7 3.5 5.0 5.935.2 0.7 0.1 0.2 9.4 10.1 5.3 4.2 5.1
17.4 (X) 0.0 (X) 4.7 2.7 1.9 (X) 6.526.5 (X) 0.2 (X) 8.6 3.7 3.1 5.7 4.429.4 (X) (X) 0.0 (X) 3.5 2.9 5.5 5.247.5 0.2 0.1 (L) 6.8 34.4 0.8 3.7 1.530.3 0.3 0.1 0.0 10.2 6.5 2.5 9.3 1.3
41.0 1.0 (X) (X) 13.4 10.1 4.1 8.8 3.6
28.1 (X) 0.0 (X) (X) 11.2 5.6 (X) 4.6
Guam
CONTACT: (410) 965-0090 or [email protected].
SOURCES: Social Security Administration, Master Beneficiary Record, 100 percent data; and U.S. Postal Service geographic data.
NOTES: (L) = less than 0.05 percent; (X) = suppressed to avoid disclosing information of certain individuals.
Northern Mariana IslandsPuerto RicoU.S. Virgin Islands
Foreign countries
Unknown
West VirginiaWisconsinWyoming
Outlying areasAmerican Samoa
Washington
South CarolinaSouth Dakota
Table 11.A.Percentage distribution, by state or other area and mental disorders diagnostic group,December 2016—Continued
State or area
TennesseeTexasUtah
VermontVirginia
44 ♦ Annual Statistical Report on the Social Security Disability Insurance Program, 2016
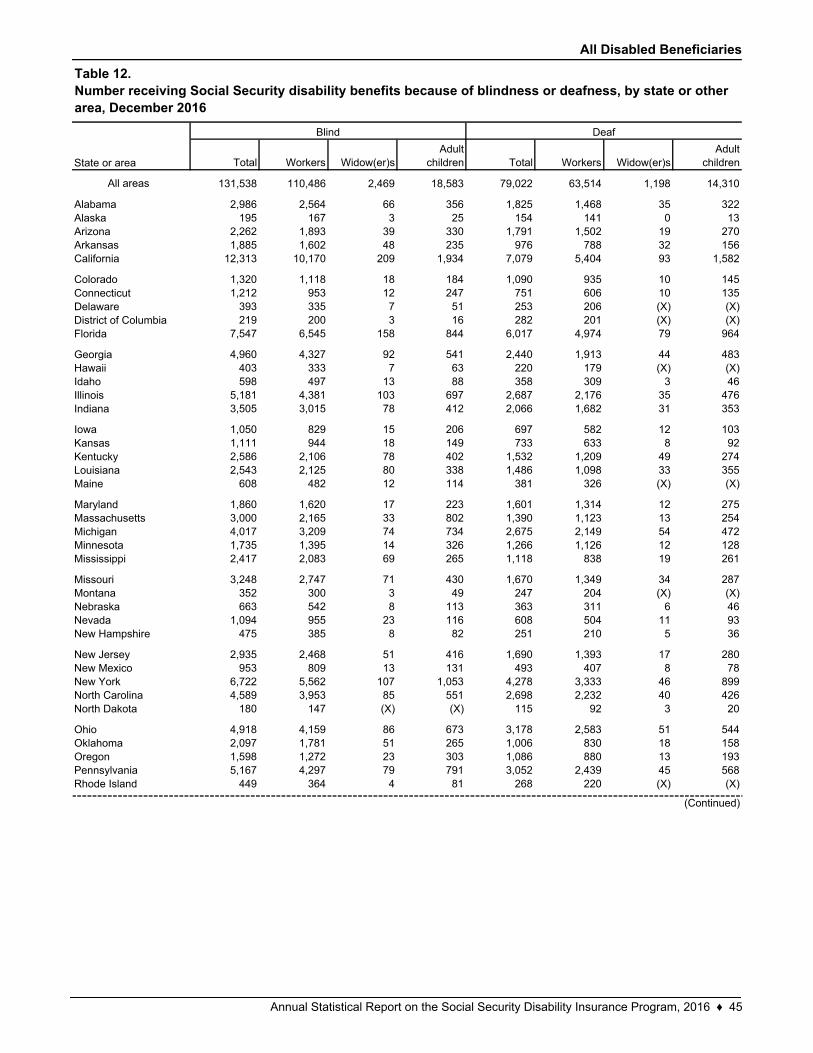
All Disabled Beneficiaries
Total Workers Widow(er)sAdult
children Total Workers Widow(er)sAdult
children
All areas 131,538 110,486 2,469 18,583 79,022 63,514 1,198 14,310
2,986 2,564 66 356 1,825 1,468 35 322195 167 3 25 154 141 0 13
2,262 1,893 39 330 1,791 1,502 19 2701,885 1,602 48 235 976 788 32 156
12,313 10,170 209 1,934 7,079 5,404 93 1,582
1,320 1,118 18 184 1,090 935 10 1451,212 953 12 247 751 606 10 135
393 335 7 51 253 206 (X) (X)219 200 3 16 282 201 (X) (X)
7,547 6,545 158 844 6,017 4,974 79 964
4,960 4,327 92 541 2,440 1,913 44 483403 333 7 63 220 179 (X) (X)598 497 13 88 358 309 3 46
5,181 4,381 103 697 2,687 2,176 35 4763,505 3,015 78 412 2,066 1,682 31 353
1,050 829 15 206 697 582 12 1031,111 944 18 149 733 633 8 922,586 2,106 78 402 1,532 1,209 49 2742,543 2,125 80 338 1,486 1,098 33 355
608 482 12 114 381 326 (X) (X)
1,860 1,620 17 223 1,601 1,314 12 2753,000 2,165 33 802 1,390 1,123 13 2544,017 3,209 74 734 2,675 2,149 54 4721,735 1,395 14 326 1,266 1,126 12 1282,417 2,083 69 265 1,118 838 19 261
3,248 2,747 71 430 1,670 1,349 34 287352 300 3 49 247 204 (X) (X)663 542 8 113 363 311 6 46
1,094 955 23 116 608 504 11 93475 385 8 82 251 210 5 36
2,935 2,468 51 416 1,690 1,393 17 280953 809 13 131 493 407 8 78
6,722 5,562 107 1,053 4,278 3,333 46 8994,589 3,953 85 551 2,698 2,232 40 426
180 147 (X) (X) 115 92 3 20
4,918 4,159 86 673 3,178 2,583 51 5442,097 1,781 51 265 1,006 830 18 1581,598 1,272 23 303 1,086 880 13 1935,167 4,297 79 791 3,052 2,439 45 568
449 364 4 81 268 220 (X) (X)Rhode Island
NevadaNew Hampshire
New JerseyNew MexicoNew YorkNorth CarolinaNorth Dakota
OhioOklahomaOregonPennsylvania
HawaiiIdahoIllinoisIndiana
Nebraska
KansasKentuckyLouisianaMaine
MarylandMassachusettsMichiganMinnesotaMississippi
MissouriMontana
ConnecticutDelawareDistrict of ColumbiaFlorida
Georgia
Table 12.Number receiving Social Security disability benefits because of blindness or deafness, by state or other area, December 2016
Blind Deaf
(Continued)
State or area
AlabamaAlaskaArizonaArkansas
Iowa
California
Colorado
Annual Statistical Report on the Social Security Disability Insurance Program, 2016 ♦ 45
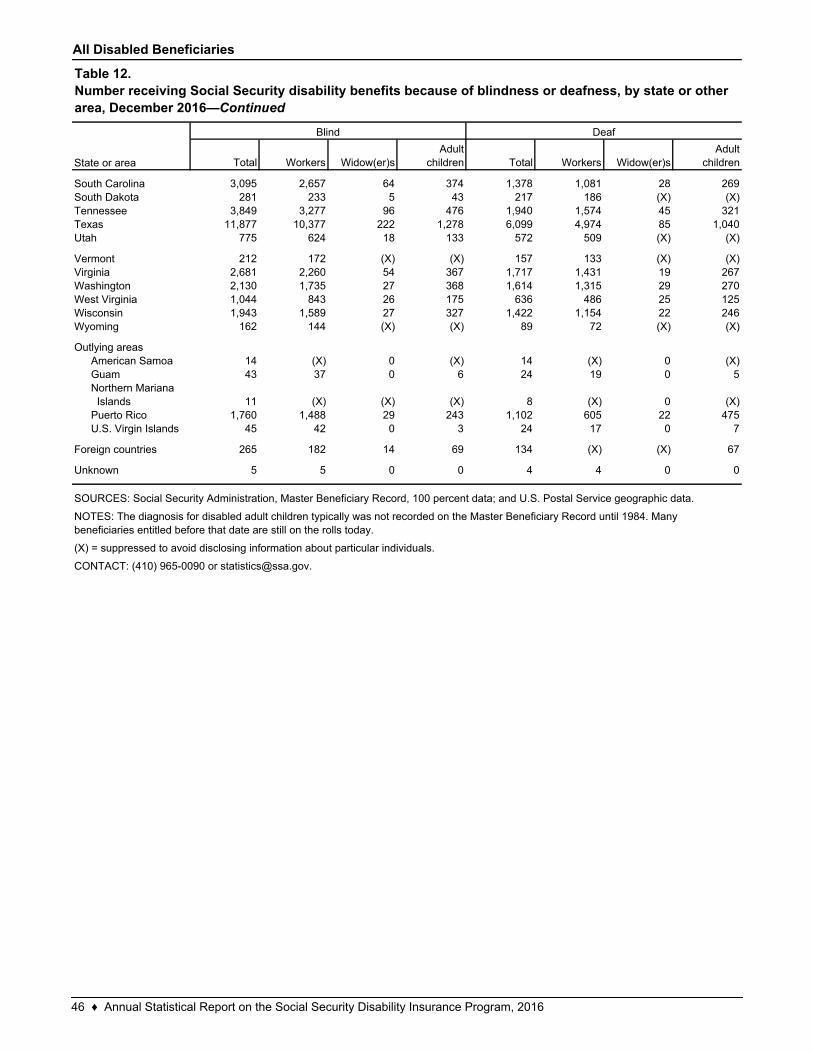
All Disabled Beneficiaries
Total Workers Widow(er)sAdult
children Total Workers Widow(er)sAdult
children
3,095 2,657 64 374 1,378 1,081 28 269281 233 5 43 217 186 (X) (X)
3,849 3,277 96 476 1,940 1,574 45 32111,877 10,377 222 1,278 6,099 4,974 85 1,040
775 624 18 133 572 509 (X) (X)
212 172 (X) (X) 157 133 (X) (X)2,681 2,260 54 367 1,717 1,431 19 2672,130 1,735 27 368 1,614 1,315 29 2701,044 843 26 175 636 486 25 1251,943 1,589 27 327 1,422 1,154 22 246
162 144 (X) (X) 89 72 (X) (X)
14 (X) 0 (X) 14 (X) 0 (X)43 37 0 6 24 19 0 5
11 (X) (X) (X) 8 (X) 0 (X)1,760 1,488 29 243 1,102 605 22 475
45 42 0 3 24 17 0 7
265 182 14 69 134 (X) (X) 67
5 5 0 0 4 4 0 0
SOURCES: Social Security Administration, Master Beneficiary Record, 100 percent data; and U.S. Postal Service geographic data.
NOTES: The diagnosis for disabled adult children typically was not recorded on the Master Beneficiary Record until 1984. Many beneficiaries entitled before that date are still on the rolls today.
(X) = suppressed to avoid disclosing information about particular individuals.
CONTACT: (410) 965-0090 or [email protected].
Unknown
American SamoaGuamNorthern Mariana IslandsPuerto RicoU.S. Virgin Islands
Foreign countries
Outlying areas
South CarolinaSouth DakotaTennesseeTexasUtah
VermontVirginiaWashingtonWest VirginiaWisconsinWyoming
Table 12.Number receiving Social Security disability benefits because of blindness or deafness, by state or other area, December 2016—Continued
State or area
Blind Deaf
46 ♦ Annual Statistical Report on the Social Security Disability Insurance Program, 2016
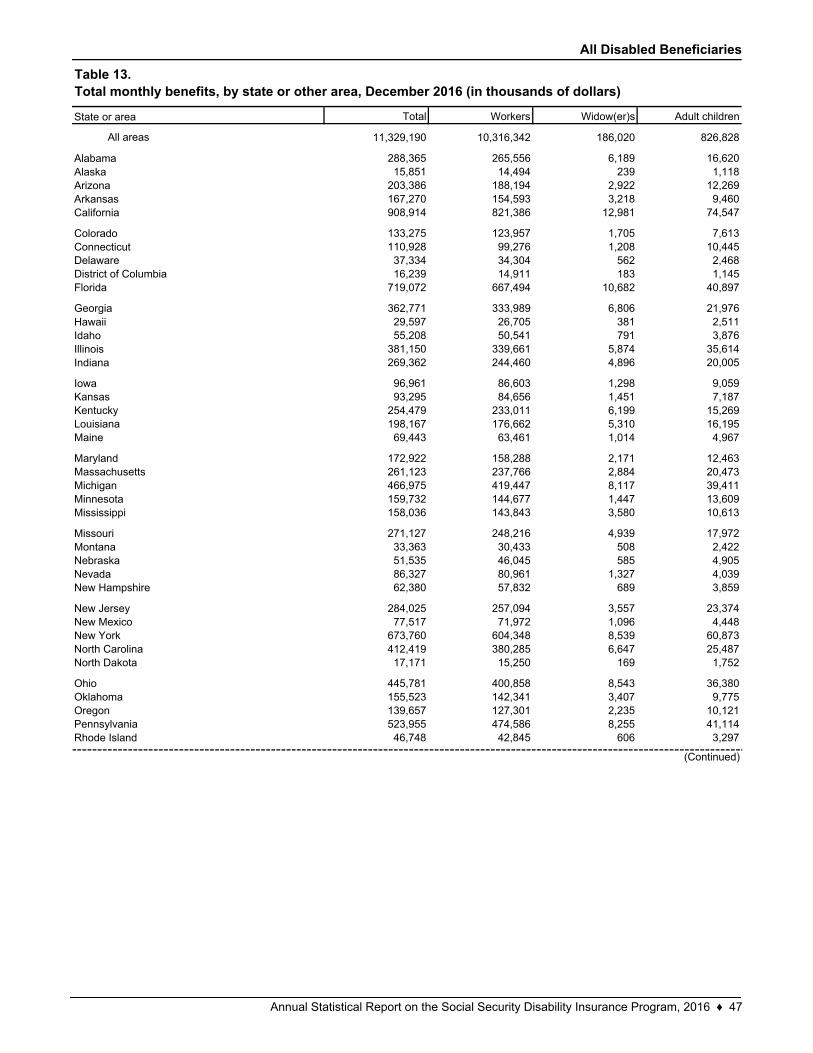
All Disabled Beneficiaries
Total Workers Widow(er)s Adult children
All areas 11,329,190 10,316,342 186,020 826,828
288,365 265,556 6,189 16,62015,851 14,494 239 1,118
203,386 188,194 2,922 12,269167,270 154,593 3,218 9,460908,914 821,386 12,981 74,547
133,275 123,957 1,705 7,613110,928 99,276 1,208 10,44537,334 34,304 562 2,46816,239 14,911 183 1,145
719,072 667,494 10,682 40,897
362,771 333,989 6,806 21,97629,597 26,705 381 2,51155,208 50,541 791 3,876
381,150 339,661 5,874 35,614269,362 244,460 4,896 20,005
96,961 86,603 1,298 9,05993,295 84,656 1,451 7,187
254,479 233,011 6,199 15,269198,167 176,662 5,310 16,19569,443 63,461 1,014 4,967
172,922 158,288 2,171 12,463261,123 237,766 2,884 20,473466,975 419,447 8,117 39,411159,732 144,677 1,447 13,609158,036 143,843 3,580 10,613
271,127 248,216 4,939 17,97233,363 30,433 508 2,42251,535 46,045 585 4,90586,327 80,961 1,327 4,03962,380 57,832 689 3,859
284,025 257,094 3,557 23,37477,517 71,972 1,096 4,448
673,760 604,348 8,539 60,873412,419 380,285 6,647 25,48717,171 15,250 169 1,752
445,781 400,858 8,543 36,380155,523 142,341 3,407 9,775139,657 127,301 2,235 10,121523,955 474,586 8,255 41,11446,748 42,845 606 3,297
Nebraska
New Hampshire
New JerseyNew MexicoNew YorkNorth CarolinaNorth Dakota
OhioOklahomaOregonPennsylvaniaRhode Island
MichiganMinnesotaMississippi
MissouriMontana
State or area
AlabamaAlaskaArizonaArkansasCalifornia
ColoradoConnecticut
HawaiiIdahoIllinoisIndiana
Iowa
Nevada
Table 13.Total monthly benefits, by state or other area, December 2016 (in thousands of dollars)
DelawareDistrict of ColumbiaFlorida
Georgia
(Continued)
KansasKentuckyLouisianaMaine
MarylandMassachusetts
Annual Statistical Report on the Social Security Disability Insurance Program, 2016 ♦ 47
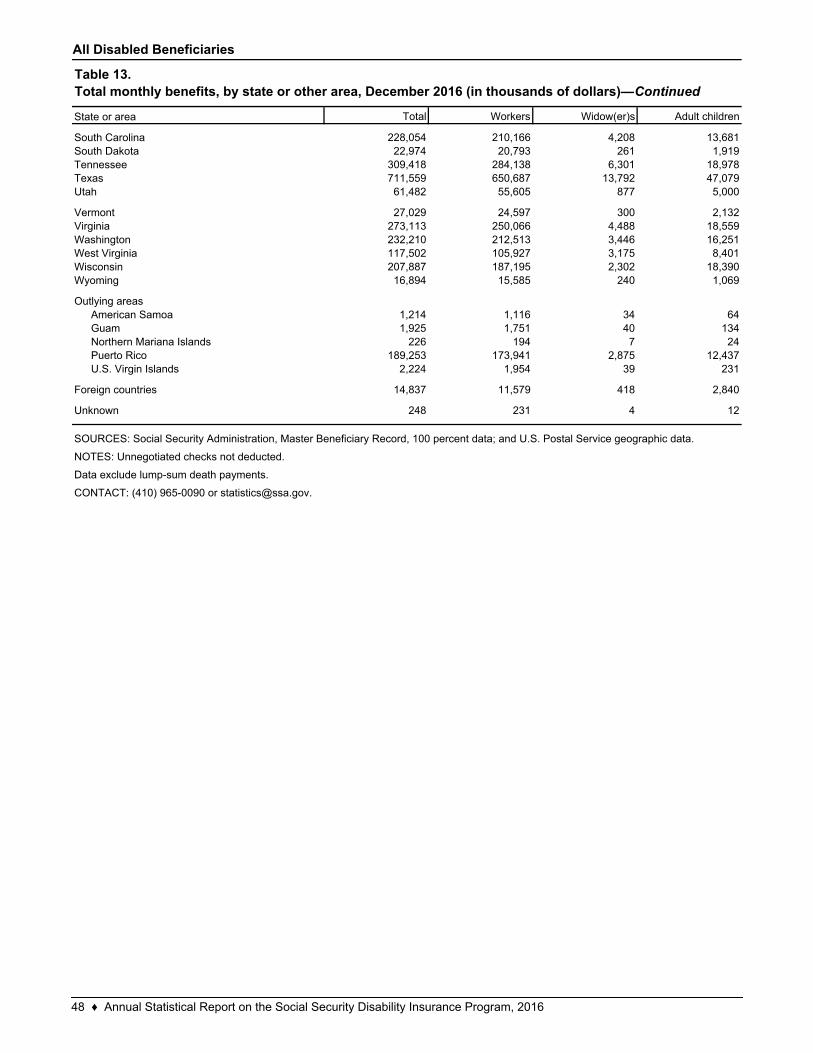
All Disabled Beneficiaries
Total Workers Widow(er)s Adult children
228,054 210,166 4,208 13,68122,974 20,793 261 1,919
309,418 284,138 6,301 18,978711,559 650,687 13,792 47,07961,482 55,605 877 5,000
27,029 24,597 300 2,132273,113 250,066 4,488 18,559232,210 212,513 3,446 16,251117,502 105,927 3,175 8,401207,887 187,195 2,302 18,39016,894 15,585 240 1,069
1,214 1,116 34 641,925 1,751 40 134
226 194 7 24189,253 173,941 2,875 12,437
2,224 1,954 39 231
14,837 11,579 418 2,840
248 231 4 12Unknown
GuamNorthern Mariana IslandsPuerto RicoU.S. Virgin Islands
Foreign countries
American Samoa
South DakotaTennesseeTexasUtah
VermontVirginiaWashingtonWest VirginiaWisconsinWyoming
Outlying areas
South Carolina
Data exclude lump-sum death payments.
CONTACT: (410) 965-0090 or [email protected].
SOURCES: Social Security Administration, Master Beneficiary Record, 100 percent data; and U.S. Postal Service geographic data.
NOTES: Unnegotiated checks not deducted.
Table 13.Total monthly benefits, by state or other area, December 2016 (in thousands of dollars)—Continued
State or area
48 ♦ Annual Statistical Report on the Social Security Disability Insurance Program, 2016
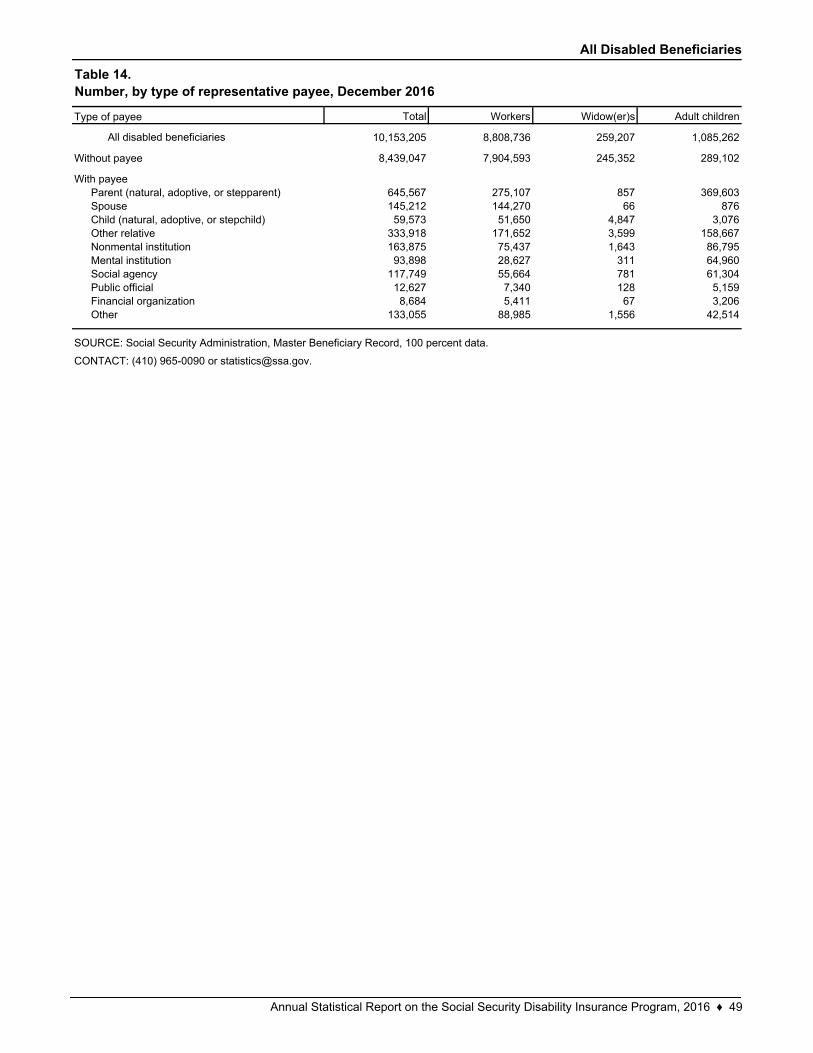
All Disabled Beneficiaries
Total Workers Widow(er)s Adult children
All disabled beneficiaries 10,153,205 8,808,736 259,207 1,085,262
8,439,047 7,904,593 245,352 289,102
645,567 275,107 857 369,603145,212 144,270 66 87659,573 51,650 4,847 3,076
333,918 171,652 3,599 158,667163,875 75,437 1,643 86,79593,898 28,627 311 64,960
117,749 55,664 781 61,30412,627 7,340 128 5,1598,684 5,411 67 3,206
133,055 88,985 1,556 42,514
Table 14.Number, by type of representative payee, December 2016
SOURCE: Social Security Administration, Master Beneficiary Record, 100 percent data.
CONTACT: (410) 965-0090 or [email protected].
Type of payee
Without payee
With payeeParent (natural, adoptive, or stepparent)
Public officialFinancial organizationOther
SpouseChild (natural, adoptive, or stepchild)Other relativeNonmental institutionMental institutionSocial agency
Annual Statistical Report on the Social Security Disability Insurance Program, 2016 ♦ 49
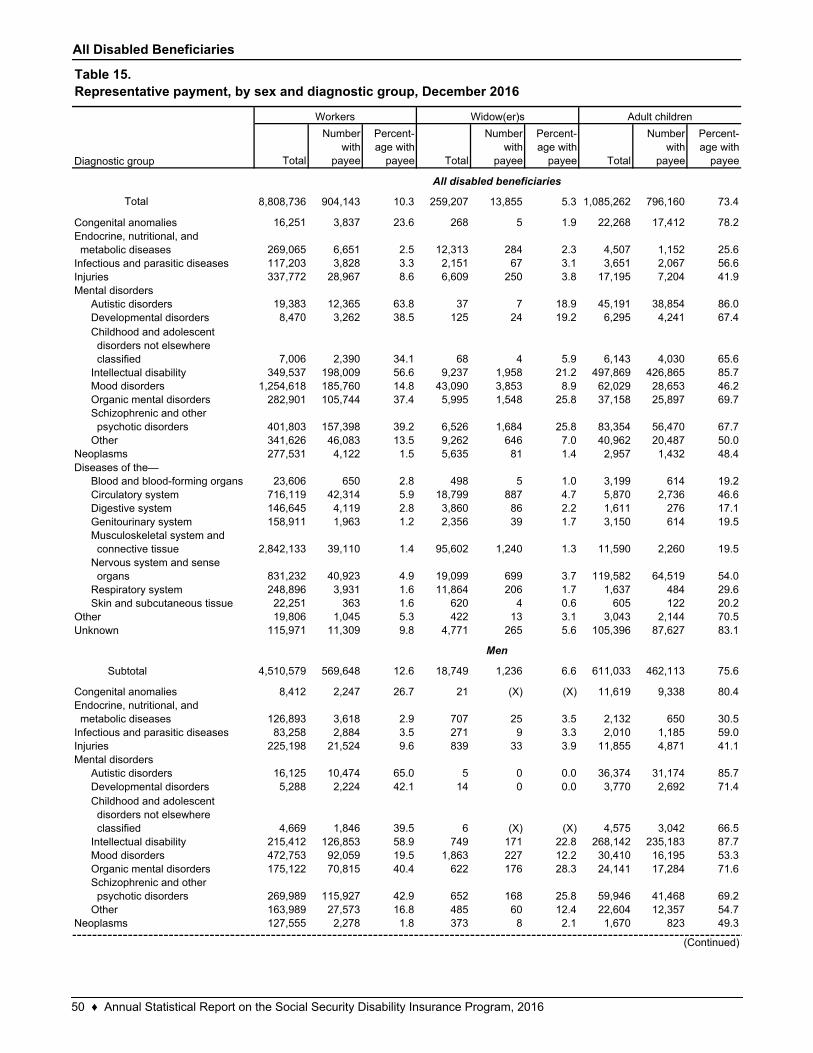
All Disabled Beneficiaries
Total
Number with
payee
Percent-age with
payee Total
Number with
payee
Percent-age with
payee Total
Number with
payee
Percent-age with
payee
Total 8,808,736 904,143 10.3 259,207 13,855 5.3 1,085,262 796,160 73.4
16,251 3,837 23.6 268 5 1.9 22,268 17,412 78.2
269,065 6,651 2.5 12,313 284 2.3 4,507 1,152 25.6117,203 3,828 3.3 2,151 67 3.1 3,651 2,067 56.6337,772 28,967 8.6 6,609 250 3.8 17,195 7,204 41.9
19,383 12,365 63.8 37 7 18.9 45,191 38,854 86.08,470 3,262 38.5 125 24 19.2 6,295 4,241 67.4
7,006 2,390 34.1 68 4 5.9 6,143 4,030 65.6349,537 198,009 56.6 9,237 1,958 21.2 497,869 426,865 85.7
1,254,618 185,760 14.8 43,090 3,853 8.9 62,029 28,653 46.2282,901 105,744 37.4 5,995 1,548 25.8 37,158 25,897 69.7
401,803 157,398 39.2 6,526 1,684 25.8 83,354 56,470 67.7341,626 46,083 13.5 9,262 646 7.0 40,962 20,487 50.0277,531 4,122 1.5 5,635 81 1.4 2,957 1,432 48.4
23,606 650 2.8 498 5 1.0 3,199 614 19.2716,119 42,314 5.9 18,799 887 4.7 5,870 2,736 46.6146,645 4,119 2.8 3,860 86 2.2 1,611 276 17.1158,911 1,963 1.2 2,356 39 1.7 3,150 614 19.5
2,842,133 39,110 1.4 95,602 1,240 1.3 11,590 2,260 19.5
831,232 40,923 4.9 19,099 699 3.7 119,582 64,519 54.0248,896 3,931 1.6 11,864 206 1.7 1,637 484 29.622,251 363 1.6 620 4 0.6 605 122 20.219,806 1,045 5.3 422 13 3.1 3,043 2,144 70.5
115,971 11,309 9.8 4,771 265 5.6 105,396 87,627 83.1
4,510,579 569,648 12.6 18,749 1,236 6.6 611,033 462,113 75.6
8,412 2,247 26.7 21 (X) (X) 11,619 9,338 80.4
126,893 3,618 2.9 707 25 3.5 2,132 650 30.583,258 2,884 3.5 271 9 3.3 2,010 1,185 59.0
225,198 21,524 9.6 839 33 3.9 11,855 4,871 41.1
16,125 10,474 65.0 5 0 0.0 36,374 31,174 85.75,288 2,224 42.1 14 0 0.0 3,770 2,692 71.4
4,669 1,846 39.5 6 (X) (X) 4,575 3,042 66.5215,412 126,853 58.9 749 171 22.8 268,142 235,183 87.7472,753 92,059 19.5 1,863 227 12.2 30,410 16,195 53.3175,122 70,815 40.4 622 176 28.3 24,141 17,284 71.6
269,989 115,927 42.9 652 168 25.8 59,946 41,468 69.2163,989 27,573 16.8 485 60 12.4 22,604 12,357 54.7127,555 2,278 1.8 373 8 2.1 1,670 823 49.3
OtherNeoplasms
(Continued)
Schizophrenic and other psychotic disorders
Congenital anomaliesEndocrine, nutritional, and metabolic diseasesInfectious and parasitic diseasesInjuriesMental disorders
Autistic disordersDevelopmental disordersChildhood and adolescent disorders not elsewhere classifiedIntellectual disabilityMood disordersOrganic mental disorders
Subtotal
Diseases of the—Blood and blood-forming organsCirculatory systemDigestive systemGenitourinary systemMusculoskeletal system and connective tissueNervous system and sense organsRespiratory systemSkin and subcutaneous tissue
OtherUnknown
Diagnostic group
Congenital anomaliesEndocrine, nutritional, and metabolic diseasesInfectious and parasitic diseasesInjuriesMental disorders
Autistic disordersDevelopmental disordersChildhood and adolescent disorders not elsewhere classifiedIntellectual disability
All disabled beneficiaries
Men
Table 15.Representative payment, by sex and diagnostic group, December 2016
Workers Widow(er)s Adult children
Neoplasms
Mood disordersOrganic mental disordersSchizophrenic and other psychotic disordersOther
50 ♦ Annual Statistical Report on the Social Security Disability Insurance Program, 2016
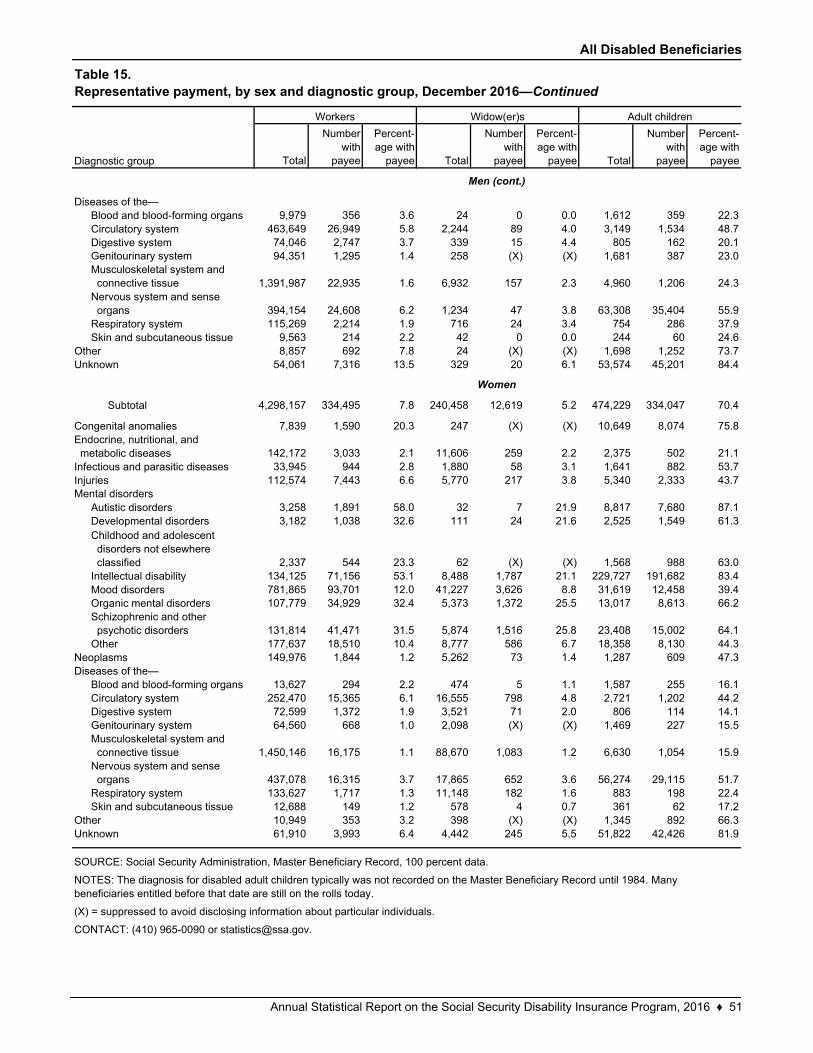
All Disabled Beneficiaries
Total
Number with
payee
Percent-age with
payee Total
Number with
payee
Percent-age with
payee Total
Number with
payee
Percent-age with
payee
9,979 356 3.6 24 0 0.0 1,612 359 22.3463,649 26,949 5.8 2,244 89 4.0 3,149 1,534 48.774,046 2,747 3.7 339 15 4.4 805 162 20.194,351 1,295 1.4 258 (X) (X) 1,681 387 23.0
1,391,987 22,935 1.6 6,932 157 2.3 4,960 1,206 24.3
394,154 24,608 6.2 1,234 47 3.8 63,308 35,404 55.9115,269 2,214 1.9 716 24 3.4 754 286 37.9
9,563 214 2.2 42 0 0.0 244 60 24.68,857 692 7.8 24 (X) (X) 1,698 1,252 73.7
54,061 7,316 13.5 329 20 6.1 53,574 45,201 84.4
4,298,157 334,495 7.8 240,458 12,619 5.2 474,229 334,047 70.4
7,839 1,590 20.3 247 (X) (X) 10,649 8,074 75.8
142,172 3,033 2.1 11,606 259 2.2 2,375 502 21.133,945 944 2.8 1,880 58 3.1 1,641 882 53.7
112,574 7,443 6.6 5,770 217 3.8 5,340 2,333 43.7
3,258 1,891 58.0 32 7 21.9 8,817 7,680 87.13,182 1,038 32.6 111 24 21.6 2,525 1,549 61.3
2,337 544 23.3 62 (X) (X) 1,568 988 63.0134,125 71,156 53.1 8,488 1,787 21.1 229,727 191,682 83.4781,865 93,701 12.0 41,227 3,626 8.8 31,619 12,458 39.4107,779 34,929 32.4 5,373 1,372 25.5 13,017 8,613 66.2
131,814 41,471 31.5 5,874 1,516 25.8 23,408 15,002 64.1177,637 18,510 10.4 8,777 586 6.7 18,358 8,130 44.3149,976 1,844 1.2 5,262 73 1.4 1,287 609 47.3
13,627 294 2.2 474 5 1.1 1,587 255 16.1252,470 15,365 6.1 16,555 798 4.8 2,721 1,202 44.272,599 1,372 1.9 3,521 71 2.0 806 114 14.164,560 668 1.0 2,098 (X) (X) 1,469 227 15.5
1,450,146 16,175 1.1 88,670 1,083 1.2 6,630 1,054 15.9
437,078 16,315 3.7 17,865 652 3.6 56,274 29,115 51.7133,627 1,717 1.3 11,148 182 1.6 883 198 22.412,688 149 1.2 578 4 0.7 361 62 17.210,949 353 3.2 398 (X) (X) 1,345 892 66.361,910 3,993 6.4 4,442 245 5.5 51,822 42,426 81.9
Skin and subcutaneous tissueOtherUnknown
Digestive systemGenitourinary systemMusculoskeletal system and connective tissueNervous system and sense organsRespiratory system
Schizophrenic and other psychotic disordersOther
Diseases of the—Blood and blood-forming organsCirculatory system
Nervous system and sense organsRespiratory systemSkin and subcutaneous tissue
Neoplasms
Unknown
Subtotal
Congenital anomaliesEndocrine, nutritional, and metabolic diseasesInfectious and parasitic diseasesInjuries
Autistic disordersDevelopmental disordersChildhood and adolescent disorders not elsewhere classifiedIntellectual disabilityMood disordersOrganic mental disorders
Other
Diseases of the—Blood and blood-forming organsCirculatory systemDigestive system
Table 15.Representative payment, by sex and diagnostic group, December 2016—Continued
Diagnostic group
Workers Widow(er)s Adult children
Men (cont.)
Genitourinary systemMusculoskeletal system and connective tissue
CONTACT: (410) 965-0090 or [email protected].
Women
SOURCE: Social Security Administration, Master Beneficiary Record, 100 percent data.
NOTES: The diagnosis for disabled adult children typically was not recorded on the Master Beneficiary Record until 1984. Many beneficiaries entitled before that date are still on the rolls today.
(X) = suppressed to avoid disclosing information about particular individuals.
Mental disorders
Annual Statistical Report on the Social Security Disability Insurance Program, 2016 ♦ 51
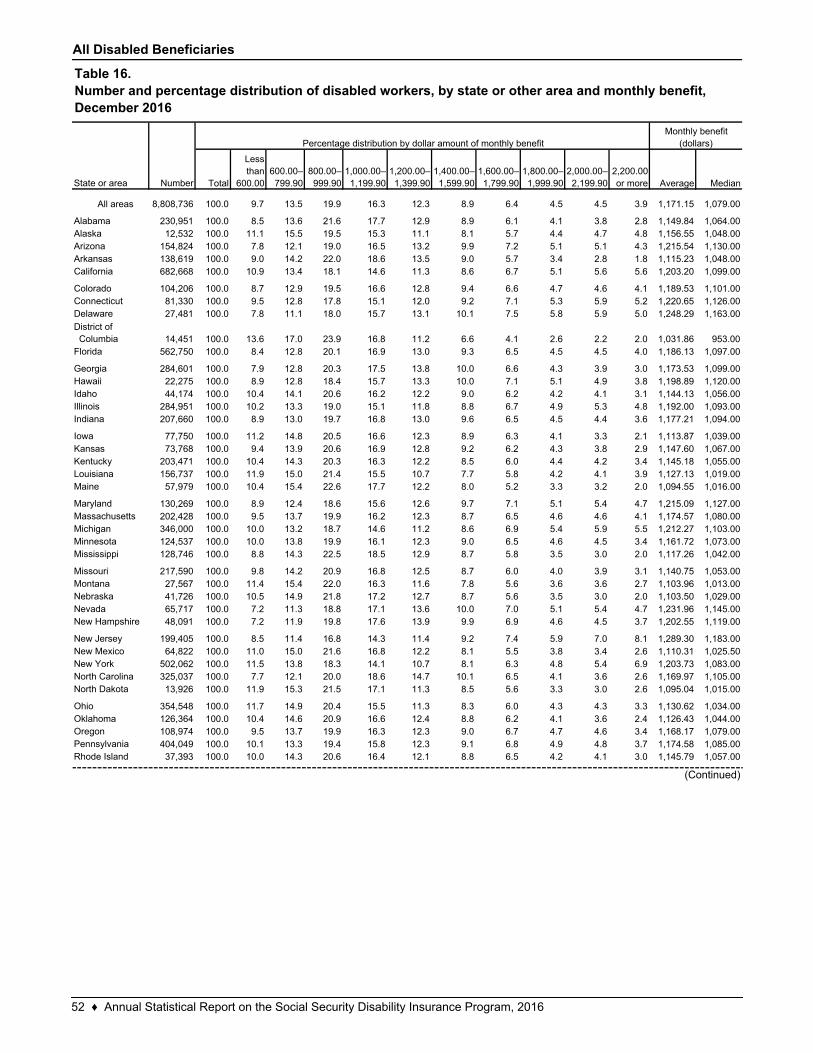
All Disabled Beneficiaries
Total
Less than
600.00600.00–799.90
800.00–999.90
1,000.00–1,199.90
1,200.00–1,399.90
1,400.00–1,599.90
1,600.00–1,799.90
1,800.00–1,999.90
2,000.00–2,199.90
2,200.00 or more Average Median
All areas 8,808,736 100.0 9.7 13.5 19.9 16.3 12.3 8.9 6.4 4.5 4.5 3.9 1,171.15 1,079.00
230,951 100.0 8.5 13.6 21.6 17.7 12.9 8.9 6.1 4.1 3.8 2.8 1,149.84 1,064.0012,532 100.0 11.1 15.5 19.5 15.3 11.1 8.1 5.7 4.4 4.7 4.8 1,156.55 1,048.00
154,824 100.0 7.8 12.1 19.0 16.5 13.2 9.9 7.2 5.1 5.1 4.3 1,215.54 1,130.00138,619 100.0 9.0 14.2 22.0 18.6 13.5 9.0 5.7 3.4 2.8 1.8 1,115.23 1,048.00682,668 100.0 10.9 13.4 18.1 14.6 11.3 8.6 6.7 5.1 5.6 5.6 1,203.20 1,099.00
104,206 100.0 8.7 12.9 19.5 16.6 12.8 9.4 6.6 4.7 4.6 4.1 1,189.53 1,101.0081,330 100.0 9.5 12.8 17.8 15.1 12.0 9.2 7.1 5.3 5.9 5.2 1,220.65 1,126.0027,481 100.0 7.8 11.1 18.0 15.7 13.1 10.1 7.5 5.8 5.9 5.0 1,248.29 1,163.00
14,451 100.0 13.6 17.0 23.9 16.8 11.2 6.6 4.1 2.6 2.2 2.0 1,031.86 953.00562,750 100.0 8.4 12.8 20.1 16.9 13.0 9.3 6.5 4.5 4.5 4.0 1,186.13 1,097.00
284,601 100.0 7.9 12.8 20.3 17.5 13.8 10.0 6.6 4.3 3.9 3.0 1,173.53 1,099.0022,275 100.0 8.9 12.8 18.4 15.7 13.3 10.0 7.1 5.1 4.9 3.8 1,198.89 1,120.0044,174 100.0 10.4 14.1 20.6 16.2 12.2 9.0 6.2 4.2 4.1 3.1 1,144.13 1,056.00
284,951 100.0 10.2 13.3 19.0 15.1 11.8 8.8 6.7 4.9 5.3 4.8 1,192.00 1,093.00207,660 100.0 8.9 13.0 19.7 16.8 13.0 9.6 6.5 4.5 4.4 3.6 1,177.21 1,094.00
77,750 100.0 11.2 14.8 20.5 16.6 12.3 8.9 6.3 4.1 3.3 2.1 1,113.87 1,039.0073,768 100.0 9.4 13.9 20.6 16.9 12.8 9.2 6.2 4.3 3.8 2.9 1,147.60 1,067.00
203,471 100.0 10.4 14.3 20.3 16.3 12.2 8.5 6.0 4.4 4.2 3.4 1,145.18 1,055.00156,737 100.0 11.9 15.0 21.4 15.5 10.7 7.7 5.8 4.2 4.1 3.9 1,127.13 1,019.0057,979 100.0 10.4 15.4 22.6 17.7 12.2 8.0 5.2 3.3 3.2 2.0 1,094.55 1,016.00
130,269 100.0 8.9 12.4 18.6 15.6 12.6 9.7 7.1 5.1 5.4 4.7 1,215.09 1,127.00202,428 100.0 9.5 13.7 19.9 16.2 12.3 8.7 6.5 4.6 4.6 4.1 1,174.57 1,080.00346,000 100.0 10.0 13.2 18.7 14.6 11.2 8.6 6.9 5.4 5.9 5.5 1,212.27 1,103.00124,537 100.0 10.0 13.8 19.9 16.1 12.3 9.0 6.5 4.6 4.5 3.4 1,161.72 1,073.00128,746 100.0 8.8 14.3 22.5 18.5 12.9 8.7 5.8 3.5 3.0 2.0 1,117.26 1,042.00
217,590 100.0 9.8 14.2 20.9 16.8 12.5 8.7 6.0 4.0 3.9 3.1 1,140.75 1,053.0027,567 100.0 11.4 15.4 22.0 16.3 11.6 7.8 5.6 3.6 3.6 2.7 1,103.96 1,013.0041,726 100.0 10.5 14.9 21.8 17.2 12.7 8.7 5.6 3.5 3.0 2.0 1,103.50 1,029.0065,717 100.0 7.2 11.3 18.8 17.1 13.6 10.0 7.0 5.1 5.4 4.7 1,231.96 1,145.0048,091 100.0 7.2 11.9 19.8 17.6 13.9 9.9 6.9 4.6 4.5 3.7 1,202.55 1,119.00
199,405 100.0 8.5 11.4 16.8 14.3 11.4 9.2 7.4 5.9 7.0 8.1 1,289.30 1,183.0064,822 100.0 11.0 15.0 21.6 16.8 12.2 8.1 5.5 3.8 3.4 2.6 1,110.31 1,025.50
502,062 100.0 11.5 13.8 18.3 14.1 10.7 8.1 6.3 4.8 5.4 6.9 1,203.73 1,083.00325,037 100.0 7.7 12.1 20.0 18.6 14.7 10.1 6.5 4.1 3.6 2.6 1,169.97 1,105.0013,926 100.0 11.9 15.3 21.5 17.1 11.3 8.5 5.6 3.3 3.0 2.6 1,095.04 1,015.00
354,548 100.0 11.7 14.9 20.4 15.5 11.3 8.3 6.0 4.3 4.3 3.3 1,130.62 1,034.00126,364 100.0 10.4 14.6 20.9 16.6 12.4 8.8 6.2 4.1 3.6 2.4 1,126.43 1,044.00108,974 100.0 9.5 13.7 19.9 16.3 12.3 9.0 6.7 4.7 4.6 3.4 1,168.17 1,079.00404,049 100.0 10.1 13.3 19.4 15.8 12.3 9.1 6.8 4.9 4.8 3.7 1,174.58 1,085.0037,393 100.0 10.0 14.3 20.6 16.4 12.1 8.8 6.5 4.2 4.1 3.0 1,145.79 1,057.00Rhode Island
NevadaNew Hampshire
New JerseyNew MexicoNew YorkNorth CarolinaNorth Dakota
OhioOklahomaOregonPennsylvania
Nebraska
KansasKentuckyLouisianaMaine
MarylandMassachusettsMichiganMinnesotaMississippi
MissouriMontana
AlabamaAlaskaArizonaArkansas
Iowa
California
ColoradoConnecticutDelaware
District of ColumbiaFlorida
GeorgiaHawaiiIdahoIllinoisIndiana
Table 16.Number and percentage distribution of disabled workers, by state or other area and monthly benefit, December 2016
Number
Percentage distribution by dollar amount of monthly benefitMonthly benefit
(dollars)
State or area
(Continued)
52 ♦ Annual Statistical Report on the Social Security Disability Insurance Program, 2016
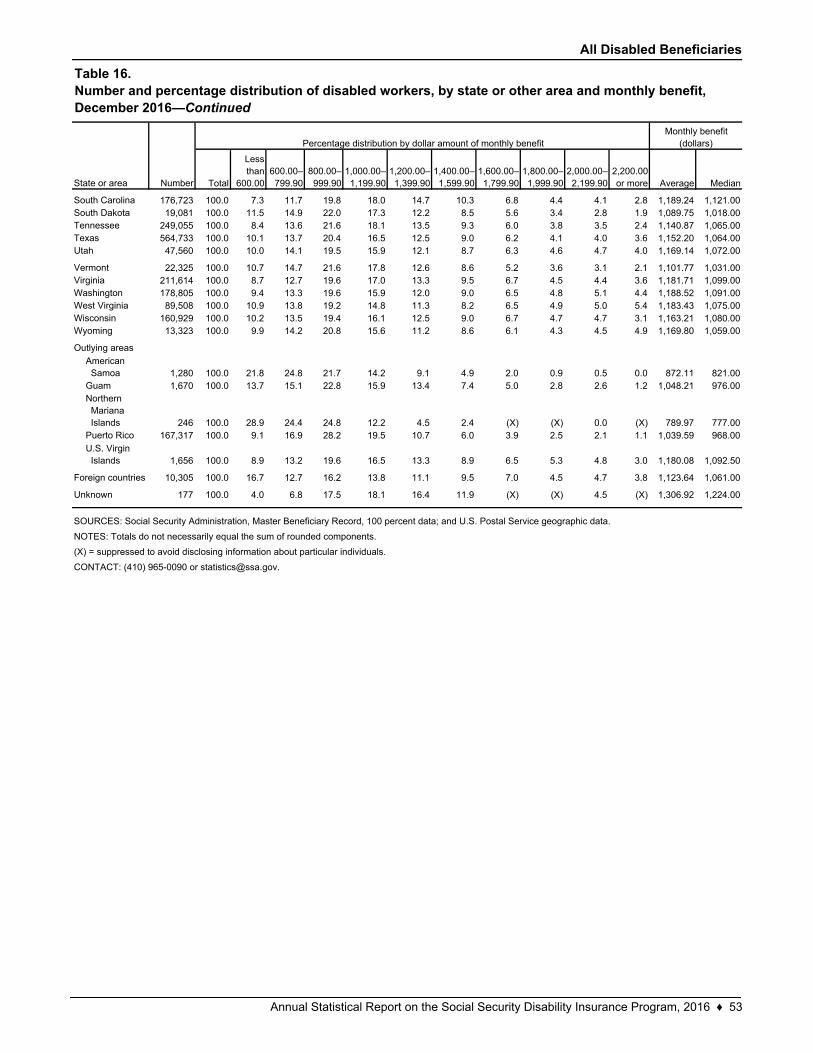
All Disabled Beneficiaries
Total
Less than
600.00600.00–799.90
800.00–999.90
1,000.00–1,199.90
1,200.00–1,399.90
1,400.00–1,599.90
1,600.00–1,799.90
1,800.00–1,999.90
2,000.00–2,199.90
2,200.00 or more Average Median
176,723 100.0 7.3 11.7 19.8 18.0 14.7 10.3 6.8 4.4 4.1 2.8 1,189.24 1,121.0019,081 100.0 11.5 14.9 22.0 17.3 12.2 8.5 5.6 3.4 2.8 1.9 1,089.75 1,018.00
249,055 100.0 8.4 13.6 21.6 18.1 13.5 9.3 6.0 3.8 3.5 2.4 1,140.87 1,065.00564,733 100.0 10.1 13.7 20.4 16.5 12.5 9.0 6.2 4.1 4.0 3.6 1,152.20 1,064.0047,560 100.0 10.0 14.1 19.5 15.9 12.1 8.7 6.3 4.6 4.7 4.0 1,169.14 1,072.00
22,325 100.0 10.7 14.7 21.6 17.8 12.6 8.6 5.2 3.6 3.1 2.1 1,101.77 1,031.00211,614 100.0 8.7 12.7 19.6 17.0 13.3 9.5 6.7 4.5 4.4 3.6 1,181.71 1,099.00178,805 100.0 9.4 13.3 19.6 15.9 12.0 9.0 6.5 4.8 5.1 4.4 1,188.52 1,091.0089,508 100.0 10.9 13.8 19.2 14.8 11.3 8.2 6.5 4.9 5.0 5.4 1,183.43 1,075.00
160,929 100.0 10.2 13.5 19.4 16.1 12.5 9.0 6.7 4.7 4.7 3.1 1,163.21 1,080.0013,323 100.0 9.9 14.2 20.8 15.6 11.2 8.6 6.1 4.3 4.5 4.9 1,169.80 1,059.00
1,280 100.0 21.8 24.8 21.7 14.2 9.1 4.9 2.0 0.9 0.5 0.0 872.11 821.001,670 100.0 13.7 15.1 22.8 15.9 13.4 7.4 5.0 2.8 2.6 1.2 1,048.21 976.00
246 100.0 28.9 24.4 24.8 12.2 4.5 2.4 (X) (X) 0.0 (X) 789.97 777.00167,317 100.0 9.1 16.9 28.2 19.5 10.7 6.0 3.9 2.5 2.1 1.1 1,039.59 968.00
1,656 100.0 8.9 13.2 19.6 16.5 13.3 8.9 6.5 5.3 4.8 3.0 1,180.08 1,092.50
10,305 100.0 16.7 12.7 16.2 13.8 11.1 9.5 7.0 4.5 4.7 3.8 1,123.64 1,061.00
177 100.0 4.0 6.8 17.5 18.1 16.4 11.9 (X) (X) 4.5 (X) 1,306.92 1,224.00
SOURCES: Social Security Administration, Master Beneficiary Record, 100 percent data; and U.S. Postal Service geographic data.
NOTES: Totals do not necessarily equal the sum of rounded components.
(X) = suppressed to avoid disclosing information about particular individuals.
CONTACT: (410) 965-0090 or [email protected].
Unknown
American SamoaGuamNorthern Mariana IslandsPuerto Rico
U.S. Virgin Islands
Foreign countries
Outlying areas
South CarolinaSouth DakotaTennesseeTexasUtah
VermontVirginiaWashingtonWest VirginiaWisconsinWyoming
Table 16.Number and percentage distribution of disabled workers, by state or other area and monthly benefit, December 2016—Continued
State or area Number
Percentage distribution by dollar amount of monthly benefitMonthly benefit
(dollars)
Annual Statistical Report on the Social Security Disability Insurance Program, 2016 ♦ 53
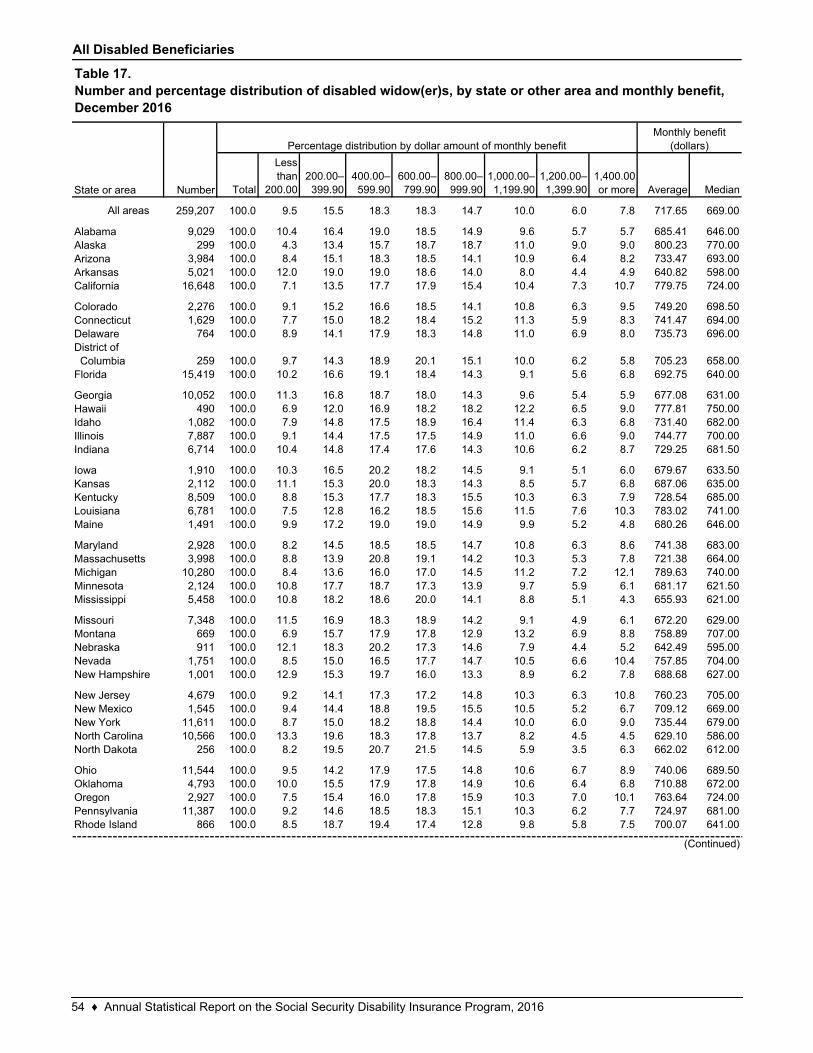
All Disabled Beneficiaries
Total
Less than
200.00200.00–399.90
400.00–599.90
600.00–799.90
800.00–999.90
1,000.00–1,199.90
1,200.00–1,399.90
1,400.00 or more Average Median
All areas 259,207 100.0 9.5 15.5 18.3 18.3 14.7 10.0 6.0 7.8 717.65 669.00
9,029 100.0 10.4 16.4 19.0 18.5 14.9 9.6 5.7 5.7 685.41 646.00299 100.0 4.3 13.4 15.7 18.7 18.7 11.0 9.0 9.0 800.23 770.00
3,984 100.0 8.4 15.1 18.3 18.5 14.1 10.9 6.4 8.2 733.47 693.005,021 100.0 12.0 19.0 19.0 18.6 14.0 8.0 4.4 4.9 640.82 598.00
16,648 100.0 7.1 13.5 17.7 17.9 15.4 10.4 7.3 10.7 779.75 724.00
2,276 100.0 9.1 15.2 16.6 18.5 14.1 10.8 6.3 9.5 749.20 698.501,629 100.0 7.7 15.0 18.2 18.4 15.2 11.3 5.9 8.3 741.47 694.00
764 100.0 8.9 14.1 17.9 18.3 14.8 11.0 6.9 8.0 735.73 696.00
259 100.0 9.7 14.3 18.9 20.1 15.1 10.0 6.2 5.8 705.23 658.0015,419 100.0 10.2 16.6 19.1 18.4 14.3 9.1 5.6 6.8 692.75 640.00
10,052 100.0 11.3 16.8 18.7 18.0 14.3 9.6 5.4 5.9 677.08 631.00490 100.0 6.9 12.0 16.9 18.2 18.2 12.2 6.5 9.0 777.81 750.00
1,082 100.0 7.9 14.8 17.5 18.9 16.4 11.4 6.3 6.8 731.40 682.007,887 100.0 9.1 14.4 17.5 17.5 14.9 11.0 6.6 9.0 744.77 700.006,714 100.0 10.4 14.8 17.4 17.6 14.3 10.6 6.2 8.7 729.25 681.50
1,910 100.0 10.3 16.5 20.2 18.2 14.5 9.1 5.1 6.0 679.67 633.502,112 100.0 11.1 15.3 20.0 18.3 14.3 8.5 5.7 6.8 687.06 635.008,509 100.0 8.8 15.3 17.7 18.3 15.5 10.3 6.3 7.9 728.54 685.006,781 100.0 7.5 12.8 16.2 18.5 15.6 11.5 7.6 10.3 783.02 741.001,491 100.0 9.9 17.2 19.0 19.0 14.9 9.9 5.2 4.8 680.26 646.00
2,928 100.0 8.2 14.5 18.5 18.5 14.7 10.8 6.3 8.6 741.38 683.003,998 100.0 8.8 13.9 20.8 19.1 14.2 10.3 5.3 7.8 721.38 664.00
10,280 100.0 8.4 13.6 16.0 17.0 14.5 11.2 7.2 12.1 789.63 740.002,124 100.0 10.8 17.7 18.7 17.3 13.9 9.7 5.9 6.1 681.17 621.505,458 100.0 10.8 18.2 18.6 20.0 14.1 8.8 5.1 4.3 655.93 621.00
7,348 100.0 11.5 16.9 18.3 18.9 14.2 9.1 4.9 6.1 672.20 629.00669 100.0 6.9 15.7 17.9 17.8 12.9 13.2 6.9 8.8 758.89 707.00911 100.0 12.1 18.3 20.2 17.3 14.6 7.9 4.4 5.2 642.49 595.00
1,751 100.0 8.5 15.0 16.5 17.7 14.7 10.5 6.6 10.4 757.85 704.001,001 100.0 12.9 15.3 19.7 16.0 13.3 8.9 6.2 7.8 688.68 627.00
4,679 100.0 9.2 14.1 17.3 17.2 14.8 10.3 6.3 10.8 760.23 705.001,545 100.0 9.4 14.4 18.8 19.5 15.5 10.5 5.2 6.7 709.12 669.00
11,611 100.0 8.7 15.0 18.2 18.8 14.4 10.0 6.0 9.0 735.44 679.0010,566 100.0 13.3 19.6 18.3 17.8 13.7 8.2 4.5 4.5 629.10 586.00
256 100.0 8.2 19.5 20.7 21.5 14.5 5.9 3.5 6.3 662.02 612.00
11,544 100.0 9.5 14.2 17.9 17.5 14.8 10.6 6.7 8.9 740.06 689.504,793 100.0 10.0 15.5 17.9 17.8 14.9 10.6 6.4 6.8 710.88 672.002,927 100.0 7.5 15.4 16.0 17.8 15.9 10.3 7.0 10.1 763.64 724.00
11,387 100.0 9.2 14.6 18.5 18.3 15.1 10.3 6.2 7.7 724.97 681.00866 100.0 8.5 18.7 19.4 17.4 12.8 9.8 5.8 7.5 700.07 641.00Rhode Island
NevadaNew Hampshire
New JerseyNew MexicoNew YorkNorth CarolinaNorth Dakota
OhioOklahomaOregonPennsylvania
Nebraska
KansasKentuckyLouisianaMaine
MarylandMassachusettsMichiganMinnesotaMississippi
MissouriMontana
AlabamaAlaskaArizonaArkansas
Iowa
California
ColoradoConnecticutDelawareDistrict of ColumbiaFlorida
GeorgiaHawaiiIdahoIllinoisIndiana
Table 17.Number and percentage distribution of disabled widow(er)s, by state or other area and monthly benefit, December 2016
Number
Percentage distribution by dollar amount of monthly benefitMonthly benefit
(dollars)
State or area
(Continued)
54 ♦ Annual Statistical Report on the Social Security Disability Insurance Program, 2016
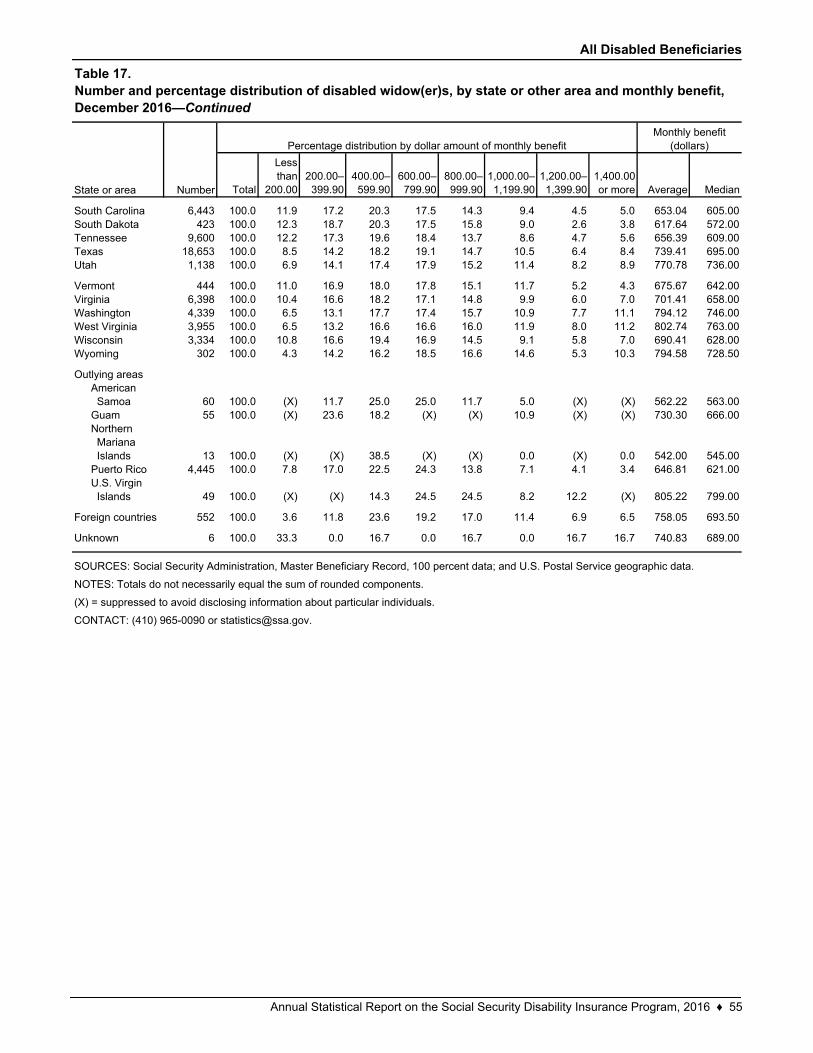
All Disabled Beneficiaries
Total
Less than
200.00200.00–399.90
400.00–599.90
600.00–799.90
800.00–999.90
1,000.00–1,199.90
1,200.00–1,399.90
1,400.00 or more Average Median
6,443 100.0 11.9 17.2 20.3 17.5 14.3 9.4 4.5 5.0 653.04 605.00423 100.0 12.3 18.7 20.3 17.5 15.8 9.0 2.6 3.8 617.64 572.00
9,600 100.0 12.2 17.3 19.6 18.4 13.7 8.6 4.7 5.6 656.39 609.0018,653 100.0 8.5 14.2 18.2 19.1 14.7 10.5 6.4 8.4 739.41 695.001,138 100.0 6.9 14.1 17.4 17.9 15.2 11.4 8.2 8.9 770.78 736.00
444 100.0 11.0 16.9 18.0 17.8 15.1 11.7 5.2 4.3 675.67 642.006,398 100.0 10.4 16.6 18.2 17.1 14.8 9.9 6.0 7.0 701.41 658.004,339 100.0 6.5 13.1 17.7 17.4 15.7 10.9 7.7 11.1 794.12 746.003,955 100.0 6.5 13.2 16.6 16.6 16.0 11.9 8.0 11.2 802.74 763.003,334 100.0 10.8 16.6 19.4 16.9 14.5 9.1 5.8 7.0 690.41 628.00
302 100.0 4.3 14.2 16.2 18.5 16.6 14.6 5.3 10.3 794.58 728.50
60 100.0 (X) 11.7 25.0 25.0 11.7 5.0 (X) (X) 562.22 563.0055 100.0 (X) 23.6 18.2 (X) (X) 10.9 (X) (X) 730.30 666.00
13 100.0 (X) (X) 38.5 (X) (X) 0.0 (X) 0.0 542.00 545.004,445 100.0 7.8 17.0 22.5 24.3 13.8 7.1 4.1 3.4 646.81 621.00
49 100.0 (X) (X) 14.3 24.5 24.5 8.2 12.2 (X) 805.22 799.00
552 100.0 3.6 11.8 23.6 19.2 17.0 11.4 6.9 6.5 758.05 693.50
6 100.0 33.3 0.0 16.7 0.0 16.7 0.0 16.7 16.7 740.83 689.00
SOURCES: Social Security Administration, Master Beneficiary Record, 100 percent data; and U.S. Postal Service geographic data.
NOTES: Totals do not necessarily equal the sum of rounded components.
(X) = suppressed to avoid disclosing information about particular individuals.
CONTACT: (410) 965-0090 or [email protected].
Unknown
American SamoaGuamNorthern Mariana IslandsPuerto RicoU.S. Virgin Islands
Foreign countries
Outlying areas
South CarolinaSouth DakotaTennesseeTexasUtah
VermontVirginiaWashingtonWest VirginiaWisconsinWyoming
Table 17.Number and percentage distribution of disabled widow(er)s, by state or other area and monthly benefit, December 2016—Continued
State or area Number
Percentage distribution by dollar amount of monthly benefitMonthly benefit
(dollars)
Annual Statistical Report on the Social Security Disability Insurance Program, 2016 ♦ 55
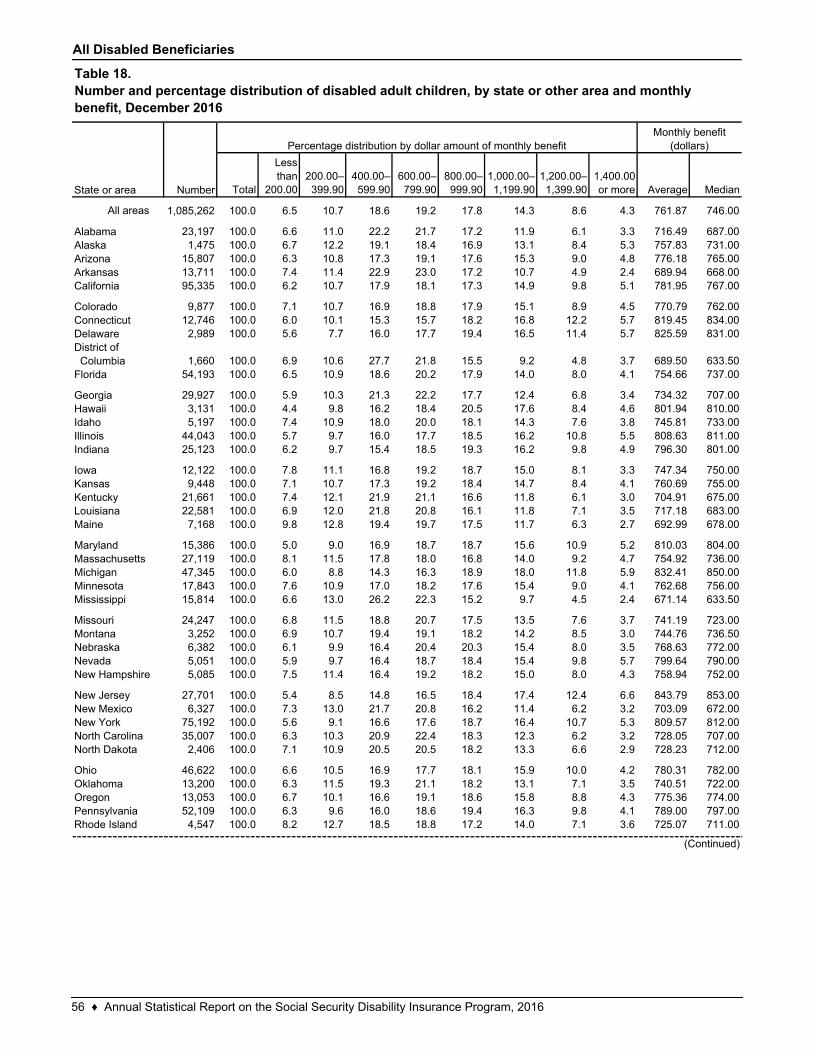
All Disabled Beneficiaries
Total
Less than
200.00200.00–399.90
400.00–599.90
600.00–799.90
800.00–999.90
1,000.00–1,199.90
1,200.00–1,399.90
1,400.00 or more Average Median
All areas 1,085,262 100.0 6.5 10.7 18.6 19.2 17.8 14.3 8.6 4.3 761.87 746.00
23,197 100.0 6.6 11.0 22.2 21.7 17.2 11.9 6.1 3.3 716.49 687.001,475 100.0 6.7 12.2 19.1 18.4 16.9 13.1 8.4 5.3 757.83 731.00
15,807 100.0 6.3 10.8 17.3 19.1 17.6 15.3 9.0 4.8 776.18 765.0013,711 100.0 7.4 11.4 22.9 23.0 17.2 10.7 4.9 2.4 689.94 668.0095,335 100.0 6.2 10.7 17.9 18.1 17.3 14.9 9.8 5.1 781.95 767.00
9,877 100.0 7.1 10.7 16.9 18.8 17.9 15.1 8.9 4.5 770.79 762.0012,746 100.0 6.0 10.1 15.3 15.7 18.2 16.8 12.2 5.7 819.45 834.002,989 100.0 5.6 7.7 16.0 17.7 19.4 16.5 11.4 5.7 825.59 831.00
1,660 100.0 6.9 10.6 27.7 21.8 15.5 9.2 4.8 3.7 689.50 633.5054,193 100.0 6.5 10.9 18.6 20.2 17.9 14.0 8.0 4.1 754.66 737.00
29,927 100.0 5.9 10.3 21.3 22.2 17.7 12.4 6.8 3.4 734.32 707.003,131 100.0 4.4 9.8 16.2 18.4 20.5 17.6 8.4 4.6 801.94 810.005,197 100.0 7.4 10.9 18.0 20.0 18.1 14.3 7.6 3.8 745.81 733.00
44,043 100.0 5.7 9.7 16.0 17.7 18.5 16.2 10.8 5.5 808.63 811.0025,123 100.0 6.2 9.7 15.4 18.5 19.3 16.2 9.8 4.9 796.30 801.00
12,122 100.0 7.8 11.1 16.8 19.2 18.7 15.0 8.1 3.3 747.34 750.009,448 100.0 7.1 10.7 17.3 19.2 18.4 14.7 8.4 4.1 760.69 755.00
21,661 100.0 7.4 12.1 21.9 21.1 16.6 11.8 6.1 3.0 704.91 675.0022,581 100.0 6.9 12.0 21.8 20.8 16.1 11.8 7.1 3.5 717.18 683.007,168 100.0 9.8 12.8 19.4 19.7 17.5 11.7 6.3 2.7 692.99 678.00
15,386 100.0 5.0 9.0 16.9 18.7 18.7 15.6 10.9 5.2 810.03 804.0027,119 100.0 8.1 11.5 17.8 18.0 16.8 14.0 9.2 4.7 754.92 736.0047,345 100.0 6.0 8.8 14.3 16.3 18.9 18.0 11.8 5.9 832.41 850.0017,843 100.0 7.6 10.9 17.0 18.2 17.6 15.4 9.0 4.1 762.68 756.0015,814 100.0 6.6 13.0 26.2 22.3 15.2 9.7 4.5 2.4 671.14 633.50
24,247 100.0 6.8 11.5 18.8 20.7 17.5 13.5 7.6 3.7 741.19 723.003,252 100.0 6.9 10.7 19.4 19.1 18.2 14.2 8.5 3.0 744.76 736.506,382 100.0 6.1 9.9 16.4 20.4 20.3 15.4 8.0 3.5 768.63 772.005,051 100.0 5.9 9.7 16.4 18.7 18.4 15.4 9.8 5.7 799.64 790.005,085 100.0 7.5 11.4 16.4 19.2 18.2 15.0 8.0 4.3 758.94 752.00
27,701 100.0 5.4 8.5 14.8 16.5 18.4 17.4 12.4 6.6 843.79 853.006,327 100.0 7.3 13.0 21.7 20.8 16.2 11.4 6.2 3.2 703.09 672.00
75,192 100.0 5.6 9.1 16.6 17.6 18.7 16.4 10.7 5.3 809.57 812.0035,007 100.0 6.3 10.3 20.9 22.4 18.3 12.3 6.2 3.2 728.05 707.002,406 100.0 7.1 10.9 20.5 20.5 18.2 13.3 6.6 2.9 728.23 712.00
46,622 100.0 6.6 10.5 16.9 17.7 18.1 15.9 10.0 4.2 780.31 782.0013,200 100.0 6.3 11.5 19.3 21.1 18.2 13.1 7.1 3.5 740.51 722.0013,053 100.0 6.7 10.1 16.6 19.1 18.6 15.8 8.8 4.3 775.36 774.0052,109 100.0 6.3 9.6 16.0 18.6 19.4 16.3 9.8 4.1 789.00 797.004,547 100.0 8.2 12.7 18.5 18.8 17.2 14.0 7.1 3.6 725.07 711.00Rhode Island
NevadaNew Hampshire
New JerseyNew MexicoNew YorkNorth CarolinaNorth Dakota
OhioOklahomaOregonPennsylvania
Nebraska
KansasKentuckyLouisianaMaine
MarylandMassachusettsMichiganMinnesotaMississippi
MissouriMontana
AlabamaAlaskaArizonaArkansas
Iowa
California
ColoradoConnecticutDelawareDistrict of ColumbiaFlorida
GeorgiaHawaiiIdahoIllinoisIndiana
Table 18.Number and percentage distribution of disabled adult children, by state or other area and monthly benefit, December 2016
Number
Percentage distribution by dollar amount of monthly benefitMonthly benefit
(dollars)
State or area
(Continued)
56 ♦ Annual Statistical Report on the Social Security Disability Insurance Program, 2016
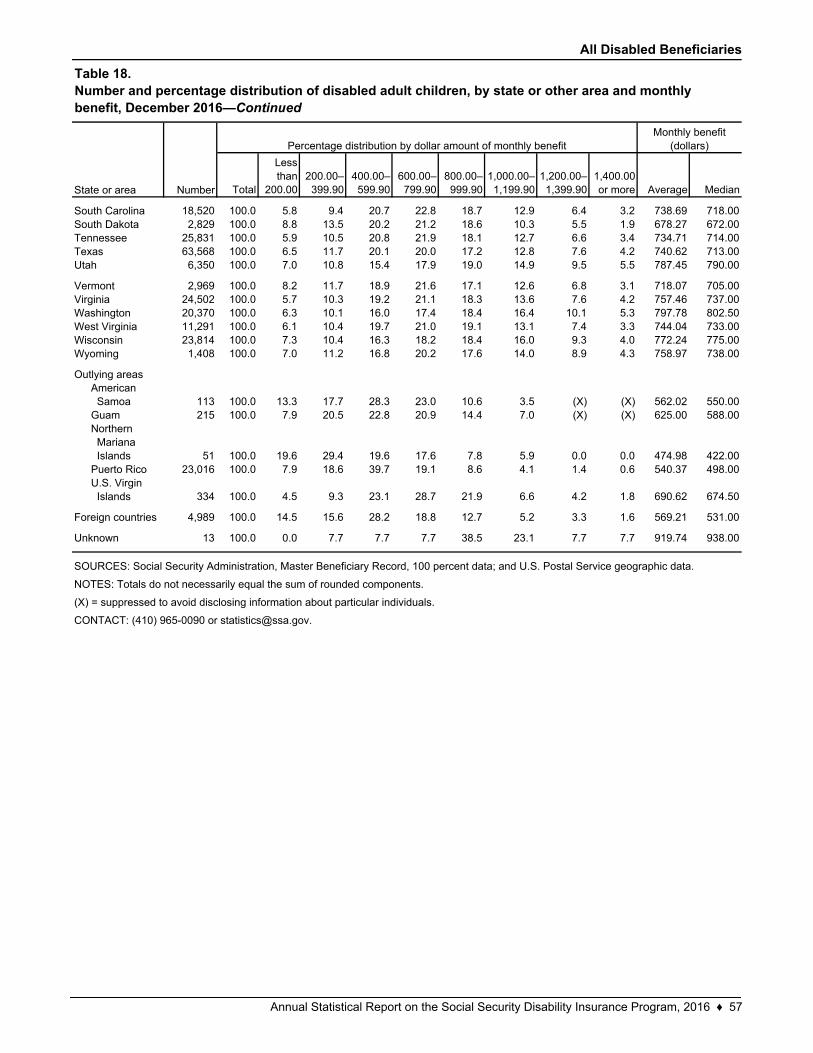
All Disabled Beneficiaries
Total
Less than
200.00200.00–399.90
400.00–599.90
600.00–799.90
800.00–999.90
1,000.00–1,199.90
1,200.00–1,399.90
1,400.00 or more Average Median
18,520 100.0 5.8 9.4 20.7 22.8 18.7 12.9 6.4 3.2 738.69 718.002,829 100.0 8.8 13.5 20.2 21.2 18.6 10.3 5.5 1.9 678.27 672.00
25,831 100.0 5.9 10.5 20.8 21.9 18.1 12.7 6.6 3.4 734.71 714.0063,568 100.0 6.5 11.7 20.1 20.0 17.2 12.8 7.6 4.2 740.62 713.006,350 100.0 7.0 10.8 15.4 17.9 19.0 14.9 9.5 5.5 787.45 790.00
2,969 100.0 8.2 11.7 18.9 21.6 17.1 12.6 6.8 3.1 718.07 705.0024,502 100.0 5.7 10.3 19.2 21.1 18.3 13.6 7.6 4.2 757.46 737.0020,370 100.0 6.3 10.1 16.0 17.4 18.4 16.4 10.1 5.3 797.78 802.5011,291 100.0 6.1 10.4 19.7 21.0 19.1 13.1 7.4 3.3 744.04 733.0023,814 100.0 7.3 10.4 16.3 18.2 18.4 16.0 9.3 4.0 772.24 775.001,408 100.0 7.0 11.2 16.8 20.2 17.6 14.0 8.9 4.3 758.97 738.00
113 100.0 13.3 17.7 28.3 23.0 10.6 3.5 (X) (X) 562.02 550.00215 100.0 7.9 20.5 22.8 20.9 14.4 7.0 (X) (X) 625.00 588.00
51 100.0 19.6 29.4 19.6 17.6 7.8 5.9 0.0 0.0 474.98 422.0023,016 100.0 7.9 18.6 39.7 19.1 8.6 4.1 1.4 0.6 540.37 498.00
334 100.0 4.5 9.3 23.1 28.7 21.9 6.6 4.2 1.8 690.62 674.50
4,989 100.0 14.5 15.6 28.2 18.8 12.7 5.2 3.3 1.6 569.21 531.00
13 100.0 0.0 7.7 7.7 7.7 38.5 23.1 7.7 7.7 919.74 938.00
SOURCES: Social Security Administration, Master Beneficiary Record, 100 percent data; and U.S. Postal Service geographic data.
NOTES: Totals do not necessarily equal the sum of rounded components.
(X) = suppressed to avoid disclosing information about particular individuals.
CONTACT: (410) 965-0090 or [email protected].
Unknown
American SamoaGuamNorthern Mariana IslandsPuerto RicoU.S. Virgin Islands
Foreign countries
Outlying areas
South CarolinaSouth DakotaTennesseeTexasUtah
VermontVirginiaWashingtonWest VirginiaWisconsinWyoming
Table 18.Number and percentage distribution of disabled adult children, by state or other area and monthly benefit, December 2016—Continued
State or area Number
Percentage distribution by dollar amount of monthly benefitMonthly benefit
(dollars)
Annual Statistical Report on the Social Security Disability Insurance Program, 2016 ♦ 57
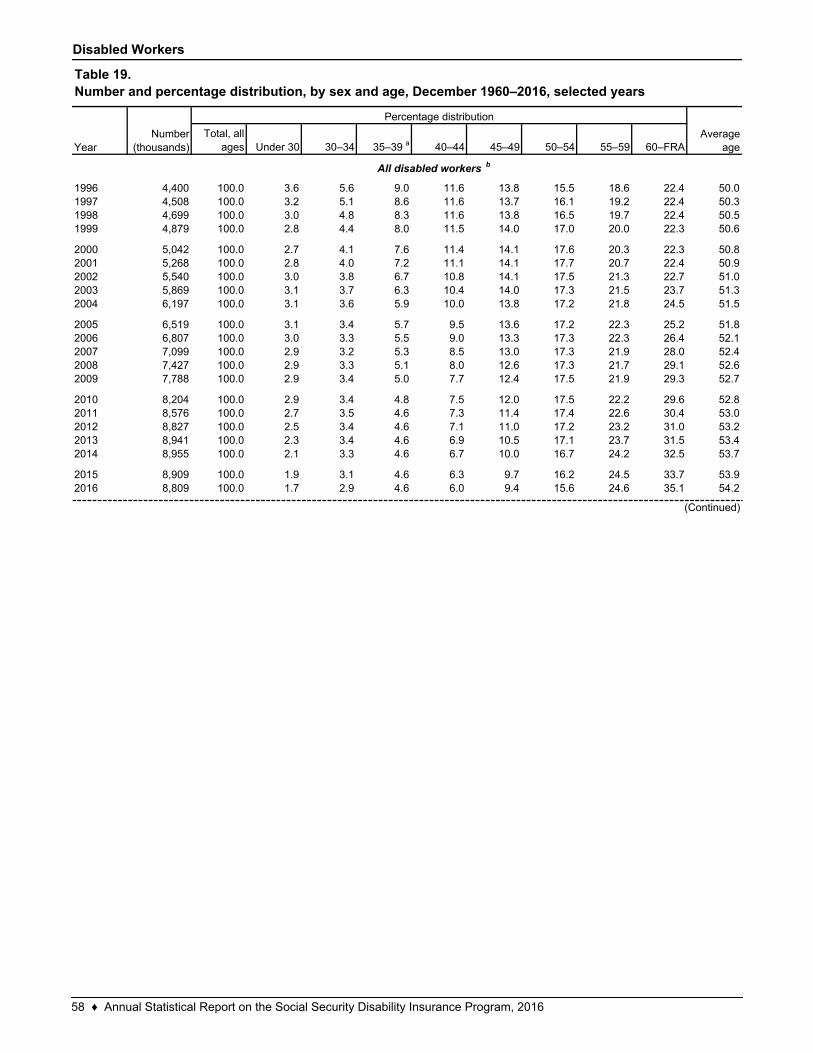
Disabled Workers
Total, all ages Under 30 30–34 35–39 a 40–44 45–49 50–54 55–59 60–FRA
4,400 100.0 3.6 5.6 9.0 11.6 13.8 15.5 18.6 22.4 50.04,508 100.0 3.2 5.1 8.6 11.6 13.7 16.1 19.2 22.4 50.34,699 100.0 3.0 4.8 8.3 11.6 13.8 16.5 19.7 22.4 50.54,879 100.0 2.8 4.4 8.0 11.5 14.0 17.0 20.0 22.3 50.6
5,042 100.0 2.7 4.1 7.6 11.4 14.1 17.6 20.3 22.3 50.85,268 100.0 2.8 4.0 7.2 11.1 14.1 17.7 20.7 22.4 50.95,540 100.0 3.0 3.8 6.7 10.8 14.1 17.5 21.3 22.7 51.05,869 100.0 3.1 3.7 6.3 10.4 14.0 17.3 21.5 23.7 51.36,197 100.0 3.1 3.6 5.9 10.0 13.8 17.2 21.8 24.5 51.5
6,519 100.0 3.1 3.4 5.7 9.5 13.6 17.2 22.3 25.2 51.86,807 100.0 3.0 3.3 5.5 9.0 13.3 17.3 22.3 26.4 52.17,099 100.0 2.9 3.2 5.3 8.5 13.0 17.3 21.9 28.0 52.47,427 100.0 2.9 3.3 5.1 8.0 12.6 17.3 21.7 29.1 52.67,788 100.0 2.9 3.4 5.0 7.7 12.4 17.5 21.9 29.3 52.7
8,204 100.0 2.9 3.4 4.8 7.5 12.0 17.5 22.2 29.6 52.88,576 100.0 2.7 3.5 4.6 7.3 11.4 17.4 22.6 30.4 53.08,827 100.0 2.5 3.4 4.6 7.1 11.0 17.2 23.2 31.0 53.28,941 100.0 2.3 3.4 4.6 6.9 10.5 17.1 23.7 31.5 53.48,955 100.0 2.1 3.3 4.6 6.7 10.0 16.7 24.2 32.5 53.7
8,909 100.0 1.9 3.1 4.6 6.3 9.7 16.2 24.5 33.7 53.98,809 100.0 1.7 2.9 4.6 6.0 9.4 15.6 24.6 35.1 54.2
Table 19.Number and percentage distribution, by sex and age, December 1960–2016, selected years
Number (thousands)
Percentage distribution
Average age
(Continued)
Year
1996199719981999
200020012002
All disabled workers b
20132014
20152016
2007
20032004
20052006
20082009
201020112012
58 ♦ Annual Statistical Report on the Social Security Disability Insurance Program, 2016
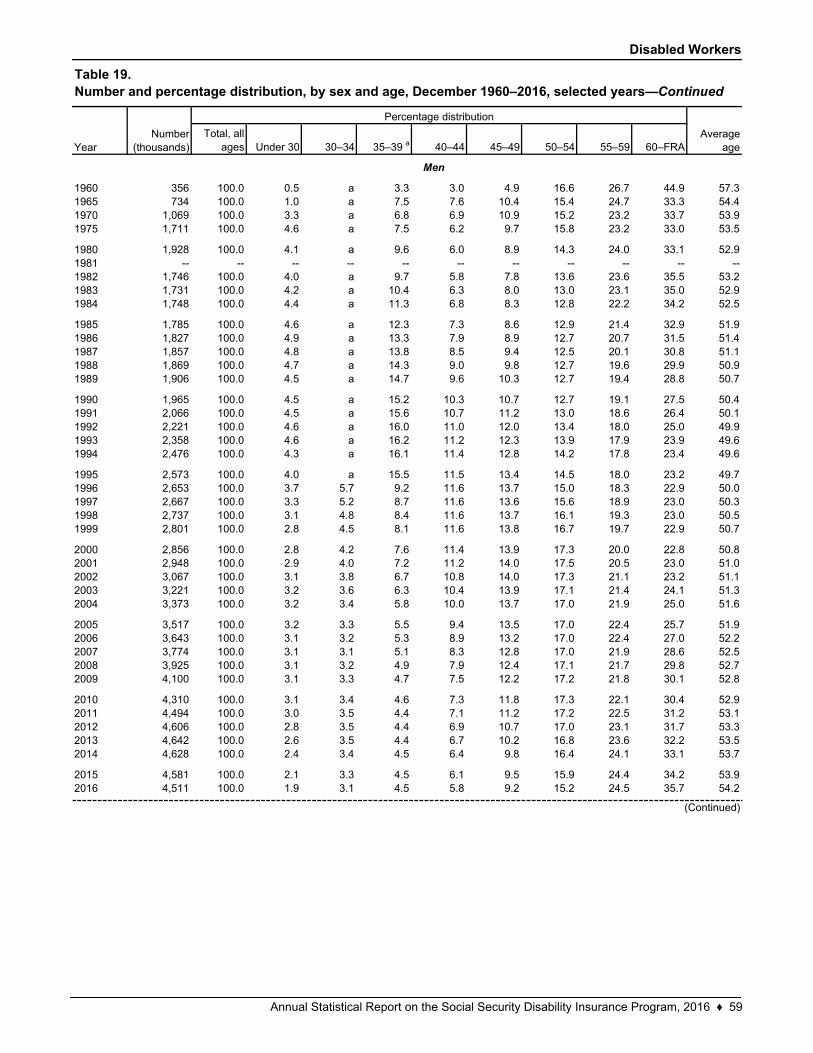
Disabled Workers
Total, all ages Under 30 30–34 35–39 a 40–44 45–49 50–54 55–59 60–FRA
356 100.0 0.5 a 3.3 3.0 4.9 16.6 26.7 44.9 57.3734 100.0 1.0 a 7.5 7.6 10.4 15.4 24.7 33.3 54.4
1,069 100.0 3.3 a 6.8 6.9 10.9 15.2 23.2 33.7 53.91,711 100.0 4.6 a 7.5 6.2 9.7 15.8 23.2 33.0 53.5
1,928 100.0 4.1 a 9.6 6.0 8.9 14.3 24.0 33.1 52.9-- -- -- -- -- -- -- -- -- -- --
1,746 100.0 4.0 a 9.7 5.8 7.8 13.6 23.6 35.5 53.21,731 100.0 4.2 a 10.4 6.3 8.0 13.0 23.1 35.0 52.91,748 100.0 4.4 a 11.3 6.8 8.3 12.8 22.2 34.2 52.5
1,785 100.0 4.6 a 12.3 7.3 8.6 12.9 21.4 32.9 51.91,827 100.0 4.9 a 13.3 7.9 8.9 12.7 20.7 31.5 51.41,857 100.0 4.8 a 13.8 8.5 9.4 12.5 20.1 30.8 51.11,869 100.0 4.7 a 14.3 9.0 9.8 12.7 19.6 29.9 50.91,906 100.0 4.5 a 14.7 9.6 10.3 12.7 19.4 28.8 50.7
1,965 100.0 4.5 a 15.2 10.3 10.7 12.7 19.1 27.5 50.42,066 100.0 4.5 a 15.6 10.7 11.2 13.0 18.6 26.4 50.12,221 100.0 4.6 a 16.0 11.0 12.0 13.4 18.0 25.0 49.92,358 100.0 4.6 a 16.2 11.2 12.3 13.9 17.9 23.9 49.62,476 100.0 4.3 a 16.1 11.4 12.8 14.2 17.8 23.4 49.6
2,573 100.0 4.0 a 15.5 11.5 13.4 14.5 18.0 23.2 49.72,653 100.0 3.7 5.7 9.2 11.6 13.7 15.0 18.3 22.9 50.02,667 100.0 3.3 5.2 8.7 11.6 13.6 15.6 18.9 23.0 50.32,737 100.0 3.1 4.8 8.4 11.6 13.7 16.1 19.3 23.0 50.52,801 100.0 2.8 4.5 8.1 11.6 13.8 16.7 19.7 22.9 50.7
2,856 100.0 2.8 4.2 7.6 11.4 13.9 17.3 20.0 22.8 50.82,948 100.0 2.9 4.0 7.2 11.2 14.0 17.5 20.5 23.0 51.03,067 100.0 3.1 3.8 6.7 10.8 14.0 17.3 21.1 23.2 51.13,221 100.0 3.2 3.6 6.3 10.4 13.9 17.1 21.4 24.1 51.33,373 100.0 3.2 3.4 5.8 10.0 13.7 17.0 21.9 25.0 51.6
3,517 100.0 3.2 3.3 5.5 9.4 13.5 17.0 22.4 25.7 51.93,643 100.0 3.1 3.2 5.3 8.9 13.2 17.0 22.4 27.0 52.23,774 100.0 3.1 3.1 5.1 8.3 12.8 17.0 21.9 28.6 52.53,925 100.0 3.1 3.2 4.9 7.9 12.4 17.1 21.7 29.8 52.74,100 100.0 3.1 3.3 4.7 7.5 12.2 17.2 21.8 30.1 52.8
4,310 100.0 3.1 3.4 4.6 7.3 11.8 17.3 22.1 30.4 52.94,494 100.0 3.0 3.5 4.4 7.1 11.2 17.2 22.5 31.2 53.14,606 100.0 2.8 3.5 4.4 6.9 10.7 17.0 23.1 31.7 53.34,642 100.0 2.6 3.5 4.4 6.7 10.2 16.8 23.6 32.2 53.54,628 100.0 2.4 3.4 4.5 6.4 9.8 16.4 24.1 33.1 53.7
4,581 100.0 2.1 3.3 4.5 6.1 9.5 15.9 24.4 34.2 53.94,511 100.0 1.9 3.1 4.5 5.8 9.2 15.2 24.5 35.7 54.2
2014
20152016
20082009
2010201120122013
200220032004
200520062007
1996199719981999
20002001
19901991199219931994
1995
198719881989
19701975
1980198119821983
Table 19.Number and percentage distribution, by sex and age, December 1960–2016, selected years—Continued
YearNumber
(thousands)
Percentage distribution
Average age
Men
(Continued)
19601965
1984
19851986
Annual Statistical Report on the Social Security Disability Insurance Program, 2016 ♦ 59
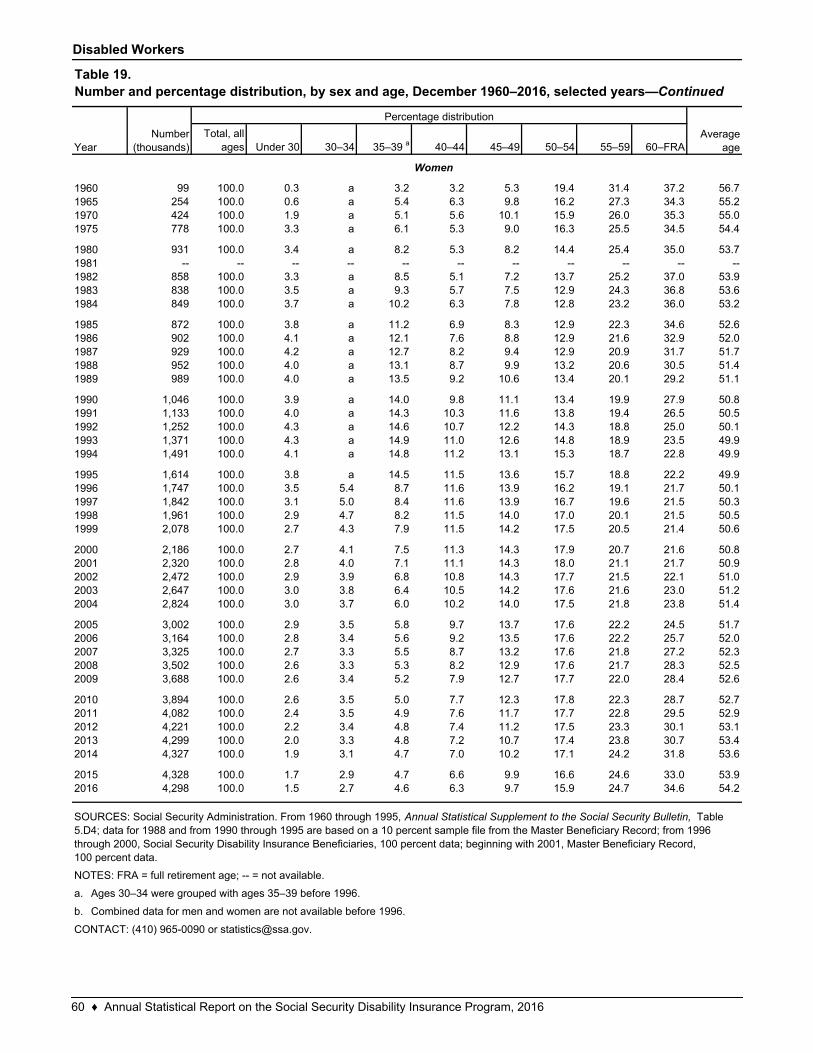
Disabled Workers
Total, all ages Under 30 30–34 35–39 a 40–44 45–49 50–54 55–59 60–FRA
99 100.0 0.3 a 3.2 3.2 5.3 19.4 31.4 37.2 56.7254 100.0 0.6 a 5.4 6.3 9.8 16.2 27.3 34.3 55.2424 100.0 1.9 a 5.1 5.6 10.1 15.9 26.0 35.3 55.0778 100.0 3.3 a 6.1 5.3 9.0 16.3 25.5 34.5 54.4
931 100.0 3.4 a 8.2 5.3 8.2 14.4 25.4 35.0 53.7-- -- -- -- -- -- -- -- -- -- --
858 100.0 3.3 a 8.5 5.1 7.2 13.7 25.2 37.0 53.9838 100.0 3.5 a 9.3 5.7 7.5 12.9 24.3 36.8 53.6849 100.0 3.7 a 10.2 6.3 7.8 12.8 23.2 36.0 53.2
872 100.0 3.8 a 11.2 6.9 8.3 12.9 22.3 34.6 52.6902 100.0 4.1 a 12.1 7.6 8.8 12.9 21.6 32.9 52.0929 100.0 4.2 a 12.7 8.2 9.4 12.9 20.9 31.7 51.7952 100.0 4.0 a 13.1 8.7 9.9 13.2 20.6 30.5 51.4989 100.0 4.0 a 13.5 9.2 10.6 13.4 20.1 29.2 51.1
1,046 100.0 3.9 a 14.0 9.8 11.1 13.4 19.9 27.9 50.81,133 100.0 4.0 a 14.3 10.3 11.6 13.8 19.4 26.5 50.51,252 100.0 4.3 a 14.6 10.7 12.2 14.3 18.8 25.0 50.11,371 100.0 4.3 a 14.9 11.0 12.6 14.8 18.9 23.5 49.91,491 100.0 4.1 a 14.8 11.2 13.1 15.3 18.7 22.8 49.9
1,614 100.0 3.8 a 14.5 11.5 13.6 15.7 18.8 22.2 49.91,747 100.0 3.5 5.4 8.7 11.6 13.9 16.2 19.1 21.7 50.11,842 100.0 3.1 5.0 8.4 11.6 13.9 16.7 19.6 21.5 50.31,961 100.0 2.9 4.7 8.2 11.5 14.0 17.0 20.1 21.5 50.52,078 100.0 2.7 4.3 7.9 11.5 14.2 17.5 20.5 21.4 50.6
2,186 100.0 2.7 4.1 7.5 11.3 14.3 17.9 20.7 21.6 50.82,320 100.0 2.8 4.0 7.1 11.1 14.3 18.0 21.1 21.7 50.92,472 100.0 2.9 3.9 6.8 10.8 14.3 17.7 21.5 22.1 51.02,647 100.0 3.0 3.8 6.4 10.5 14.2 17.6 21.6 23.0 51.22,824 100.0 3.0 3.7 6.0 10.2 14.0 17.5 21.8 23.8 51.4
3,002 100.0 2.9 3.5 5.8 9.7 13.7 17.6 22.2 24.5 51.73,164 100.0 2.8 3.4 5.6 9.2 13.5 17.6 22.2 25.7 52.03,325 100.0 2.7 3.3 5.5 8.7 13.2 17.6 21.8 27.2 52.33,502 100.0 2.6 3.3 5.3 8.2 12.9 17.6 21.7 28.3 52.53,688 100.0 2.6 3.4 5.2 7.9 12.7 17.7 22.0 28.4 52.6
3,894 100.0 2.6 3.5 5.0 7.7 12.3 17.8 22.3 28.7 52.74,082 100.0 2.4 3.5 4.9 7.6 11.7 17.7 22.8 29.5 52.94,221 100.0 2.2 3.4 4.8 7.4 11.2 17.5 23.3 30.1 53.14,299 100.0 2.0 3.3 4.8 7.2 10.7 17.4 23.8 30.7 53.44,327 100.0 1.9 3.1 4.7 7.0 10.2 17.1 24.2 31.8 53.6
4,328 100.0 1.7 2.9 4.7 6.6 9.9 16.6 24.6 33.0 53.94,298 100.0 1.5 2.7 4.6 6.3 9.7 15.9 24.7 34.6 54.2
a.
b.
CONTACT: (410) 965-0090 or [email protected].
20152016
Ages 30–34 were grouped with ages 35–39 before 1996.
Combined data for men and women are not available before 1996.
2009
20102011201220132014
20032004
2005200620072008
199719981999
200020012002
1991199219931994
19951996
19851986198719881989
1990
1975
19801981198219831984
196019651970
Average age
Women
SOURCES: Social Security Administration. From 1960 through 1995, Annual Statistical Supplement to the Social Security Bulletin, Table 5.D4; data for 1988 and from 1990 through 1995 are based on a 10 percent sample file from the Master Beneficiary Record; from 1996 through 2000, Social Security Disability Insurance Beneficiaries, 100 percent data; beginning with 2001, Master Beneficiary Record, 100 percent data.
NOTES: FRA = full retirement age; -- = not available.
Table 19.Number and percentage distribution, by sex and age, December 1960–2016, selected years—Continued
YearNumber
(thousands)
Percentage distribution
60 ♦ Annual Statistical Report on the Social Security Disability Insurance Program, 2016
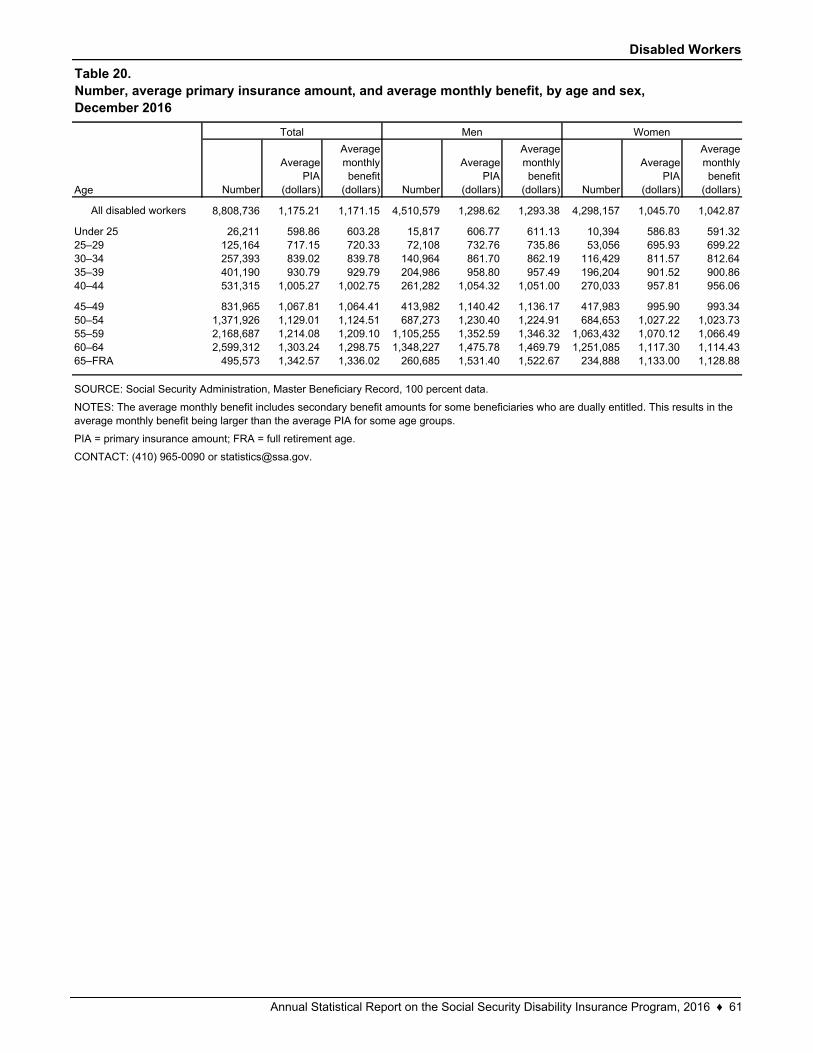
Disabled Workers
Number
Average PIA
(dollars)
Average monthly benefit
(dollars) Number
Average PIA
(dollars)
Average monthly benefit
(dollars) Number
Average PIA
(dollars)
Average monthly benefit
(dollars)
All disabled workers 8,808,736 1,175.21 1,171.15 4,510,579 1,298.62 1,293.38 4,298,157 1,045.70 1,042.87
26,211 598.86 603.28 15,817 606.77 611.13 10,394 586.83 591.32125,164 717.15 720.33 72,108 732.76 735.86 53,056 695.93 699.22257,393 839.02 839.78 140,964 861.70 862.19 116,429 811.57 812.64401,190 930.79 929.79 204,986 958.80 957.49 196,204 901.52 900.86531,315 1,005.27 1,002.75 261,282 1,054.32 1,051.00 270,033 957.81 956.06
831,965 1,067.81 1,064.41 413,982 1,140.42 1,136.17 417,983 995.90 993.341,371,926 1,129.01 1,124.51 687,273 1,230.40 1,224.91 684,653 1,027.22 1,023.732,168,687 1,214.08 1,209.10 1,105,255 1,352.59 1,346.32 1,063,432 1,070.12 1,066.492,599,312 1,303.24 1,298.75 1,348,227 1,475.78 1,469.79 1,251,085 1,117.30 1,114.43
495,573 1,342.57 1,336.02 260,685 1,531.40 1,522.67 234,888 1,133.00 1,128.88
SOURCE: Social Security Administration, Master Beneficiary Record, 100 percent data.
NOTES: The average monthly benefit includes secondary benefit amounts for some beneficiaries who are dually entitled. This results in the average monthly benefit being larger than the average PIA for some age groups.
PIA = primary insurance amount; FRA = full retirement age.
CONTACT: (410) 965-0090 or [email protected].
45–4950–5455–5960–6465–FRA
40–44
Table 20.Number, average primary insurance amount, and average monthly benefit, by age and sex, December 2016
Total Men Women
Age
Under 2525–2930–3435–39
Annual Statistical Report on the Social Security Disability Insurance Program, 2016 ♦ 61
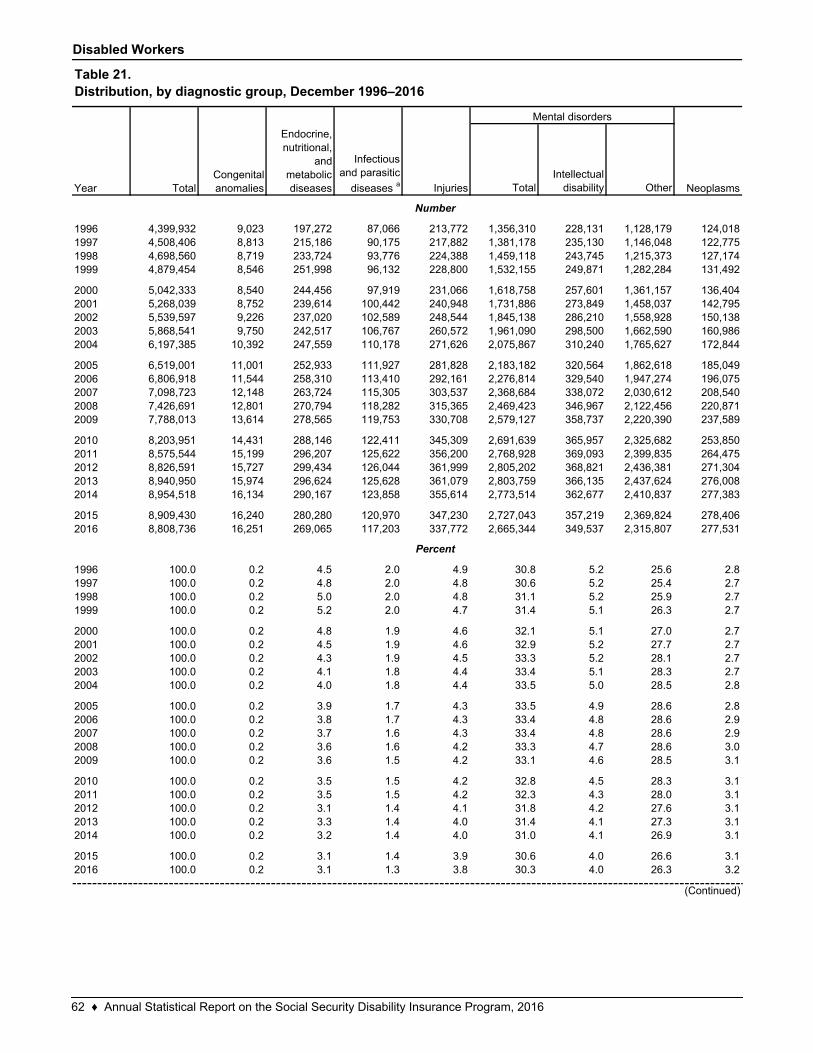
Disabled Workers
TotalIntellectual
disability Other
4,399,932 9,023 197,272 87,066 213,772 1,356,310 228,131 1,128,179 124,0184,508,406 8,813 215,186 90,175 217,882 1,381,178 235,130 1,146,048 122,7754,698,560 8,719 233,724 93,776 224,388 1,459,118 243,745 1,215,373 127,1744,879,454 8,546 251,998 96,132 228,800 1,532,155 249,871 1,282,284 131,492
5,042,333 8,540 244,456 97,919 231,066 1,618,758 257,601 1,361,157 136,4045,268,039 8,752 239,614 100,442 240,948 1,731,886 273,849 1,458,037 142,7955,539,597 9,226 237,020 102,589 248,544 1,845,138 286,210 1,558,928 150,1385,868,541 9,750 242,517 106,767 260,572 1,961,090 298,500 1,662,590 160,9866,197,385 10,392 247,559 110,178 271,626 2,075,867 310,240 1,765,627 172,844
6,519,001 11,001 252,933 111,927 281,828 2,183,182 320,564 1,862,618 185,0496,806,918 11,544 258,310 113,410 292,161 2,276,814 329,540 1,947,274 196,0757,098,723 12,148 263,724 115,305 303,537 2,368,684 338,072 2,030,612 208,5407,426,691 12,801 270,794 118,282 315,365 2,469,423 346,967 2,122,456 220,8717,788,013 13,614 278,565 119,753 330,708 2,579,127 358,737 2,220,390 237,589
8,203,951 14,431 288,146 122,411 345,309 2,691,639 365,957 2,325,682 253,8508,575,544 15,199 296,207 125,622 356,200 2,768,928 369,093 2,399,835 264,4758,826,591 15,727 299,434 126,044 361,999 2,805,202 368,821 2,436,381 271,3048,940,950 15,974 296,624 125,628 361,079 2,803,759 366,135 2,437,624 276,0088,954,518 16,134 290,167 123,858 355,614 2,773,514 362,677 2,410,837 277,383
8,909,430 16,240 280,280 120,970 347,230 2,727,043 357,219 2,369,824 278,4068,808,736 16,251 269,065 117,203 337,772 2,665,344 349,537 2,315,807 277,531
100.0 0.2 4.5 2.0 4.9 30.8 5.2 25.6 2.8100.0 0.2 4.8 2.0 4.8 30.6 5.2 25.4 2.7100.0 0.2 5.0 2.0 4.8 31.1 5.2 25.9 2.7100.0 0.2 5.2 2.0 4.7 31.4 5.1 26.3 2.7
100.0 0.2 4.8 1.9 4.6 32.1 5.1 27.0 2.7100.0 0.2 4.5 1.9 4.6 32.9 5.2 27.7 2.7100.0 0.2 4.3 1.9 4.5 33.3 5.2 28.1 2.7100.0 0.2 4.1 1.8 4.4 33.4 5.1 28.3 2.7100.0 0.2 4.0 1.8 4.4 33.5 5.0 28.5 2.8
100.0 0.2 3.9 1.7 4.3 33.5 4.9 28.6 2.8100.0 0.2 3.8 1.7 4.3 33.4 4.8 28.6 2.9100.0 0.2 3.7 1.6 4.3 33.4 4.8 28.6 2.9100.0 0.2 3.6 1.6 4.2 33.3 4.7 28.6 3.0100.0 0.2 3.6 1.5 4.2 33.1 4.6 28.5 3.1
100.0 0.2 3.5 1.5 4.2 32.8 4.5 28.3 3.1100.0 0.2 3.5 1.5 4.2 32.3 4.3 28.0 3.1100.0 0.2 3.1 1.4 4.1 31.8 4.2 27.6 3.1100.0 0.2 3.3 1.4 4.0 31.4 4.1 27.3 3.1100.0 0.2 3.2 1.4 4.0 31.0 4.1 26.9 3.1
100.0 0.2 3.1 1.4 3.9 30.6 4.0 26.6 3.1100.0 0.2 3.1 1.3 3.8 30.3 4.0 26.3 3.22016
20102011201220132014
2015
2009
19981999
20002001200220032004
2005200620072008
2001200220032004
2005
1997
200720082009
20102011201220132014
20152016
1996
2006
Year
1996199719981999
2000
NeoplasmsTotalCongenital anomalies
Endocrine, nutritional,
and metabolic diseases
Infectious and parasitic
diseases a Injuries
Mental disorders
Number
Percent
Table 21.Distribution, by diagnostic group, December 1996–2016
(Continued)
62 ♦ Annual Statistical Report on the Social Security Disability Insurance Program, 2016
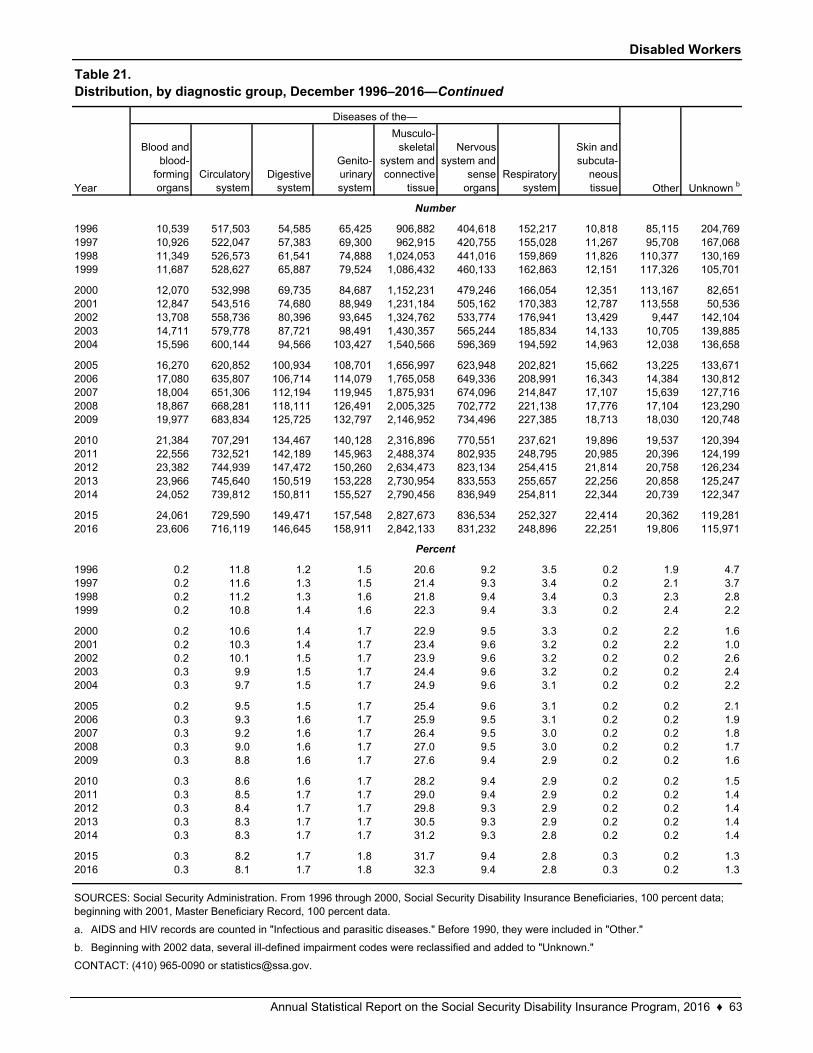
Disabled Workers
Blood and blood-
forming organs
Circulatory system
Digestive system
Genito-urinary system
Musculo-skeletal
system and connective
tissue
Nervous system and
sense organs
Respiratory system
Skin and subcuta-
neous tissue
10,539 517,503 54,585 65,425 906,882 404,618 152,217 10,818 85,115 204,76910,926 522,047 57,383 69,300 962,915 420,755 155,028 11,267 95,708 167,06811,349 526,573 61,541 74,888 1,024,053 441,016 159,869 11,826 110,377 130,16911,687 528,627 65,887 79,524 1,086,432 460,133 162,863 12,151 117,326 105,701
12,070 532,998 69,735 84,687 1,152,231 479,246 166,054 12,351 113,167 82,65112,847 543,516 74,680 88,949 1,231,184 505,162 170,383 12,787 113,558 50,53613,708 558,736 80,396 93,645 1,324,762 533,774 176,941 13,429 9,447 142,10414,711 579,778 87,721 98,491 1,430,357 565,244 185,834 14,133 10,705 139,88515,596 600,144 94,566 103,427 1,540,566 596,369 194,592 14,963 12,038 136,658
16,270 620,852 100,934 108,701 1,656,997 623,948 202,821 15,662 13,225 133,67117,080 635,807 106,714 114,079 1,765,058 649,336 208,991 16,343 14,384 130,81218,004 651,306 112,194 119,945 1,875,931 674,096 214,847 17,107 15,639 127,71618,867 668,281 118,111 126,491 2,005,325 702,772 221,138 17,776 17,104 123,29019,977 683,834 125,725 132,797 2,146,952 734,496 227,385 18,713 18,030 120,748
21,384 707,291 134,467 140,128 2,316,896 770,551 237,621 19,896 19,537 120,39422,556 732,521 142,189 145,963 2,488,374 802,935 248,795 20,985 20,396 124,19923,382 744,939 147,472 150,260 2,634,473 823,134 254,415 21,814 20,758 126,23423,966 745,640 150,519 153,228 2,730,954 833,553 255,657 22,256 20,858 125,24724,052 739,812 150,811 155,527 2,790,456 836,949 254,811 22,344 20,739 122,347
24,061 729,590 149,471 157,548 2,827,673 836,534 252,327 22,414 20,362 119,28123,606 716,119 146,645 158,911 2,842,133 831,232 248,896 22,251 19,806 115,971
0.2 11.8 1.2 1.5 20.6 9.2 3.5 0.2 1.9 4.70.2 11.6 1.3 1.5 21.4 9.3 3.4 0.2 2.1 3.70.2 11.2 1.3 1.6 21.8 9.4 3.4 0.3 2.3 2.80.2 10.8 1.4 1.6 22.3 9.4 3.3 0.2 2.4 2.2
0.2 10.6 1.4 1.7 22.9 9.5 3.3 0.2 2.2 1.60.2 10.3 1.4 1.7 23.4 9.6 3.2 0.2 2.2 1.00.2 10.1 1.5 1.7 23.9 9.6 3.2 0.2 0.2 2.60.3 9.9 1.5 1.7 24.4 9.6 3.2 0.2 0.2 2.40.3 9.7 1.5 1.7 24.9 9.6 3.1 0.2 0.2 2.2
0.2 9.5 1.5 1.7 25.4 9.6 3.1 0.2 0.2 2.10.3 9.3 1.6 1.7 25.9 9.5 3.1 0.2 0.2 1.90.3 9.2 1.6 1.7 26.4 9.5 3.0 0.2 0.2 1.80.3 9.0 1.6 1.7 27.0 9.5 3.0 0.2 0.2 1.70.3 8.8 1.6 1.7 27.6 9.4 2.9 0.2 0.2 1.6
0.3 8.6 1.6 1.7 28.2 9.4 2.9 0.2 0.2 1.50.3 8.5 1.7 1.7 29.0 9.4 2.9 0.2 0.2 1.40.3 8.4 1.7 1.7 29.8 9.3 2.9 0.2 0.2 1.40.3 8.3 1.7 1.7 30.5 9.3 2.9 0.2 0.2 1.40.3 8.3 1.7 1.7 31.2 9.3 2.8 0.2 0.2 1.4
0.3 8.2 1.7 1.8 31.7 9.4 2.8 0.3 0.2 1.30.3 8.1 1.7 1.8 32.3 9.4 2.8 0.3 0.2 1.3
a.
b.
Other Unknown b
1996
Diseases of the—
199719981999
20002001
Year
200720082009
20102011
200220032004
20052006
20032004
2005
1996199719981999
2000
201220132014
20152016
AIDS and HIV records are counted in "Infectious and parasitic diseases." Before 1990, they were included in "Other."
Beginning with 2002 data, several ill-defined impairment codes were reclassified and added to "Unknown."
CONTACT: (410) 965-0090 or [email protected].
Number
Percent
2016
Table 21.Distribution, by diagnostic group, December 1996–2016—Continued
SOURCES: Social Security Administration. From 1996 through 2000, Social Security Disability Insurance Beneficiaries, 100 percent data; beginning with 2001, Master Beneficiary Record, 100 percent data.
2011201220132014
2015
2006200720082009
2010
20012002
Annual Statistical Report on the Social Security Disability Insurance Program, 2016 ♦ 63
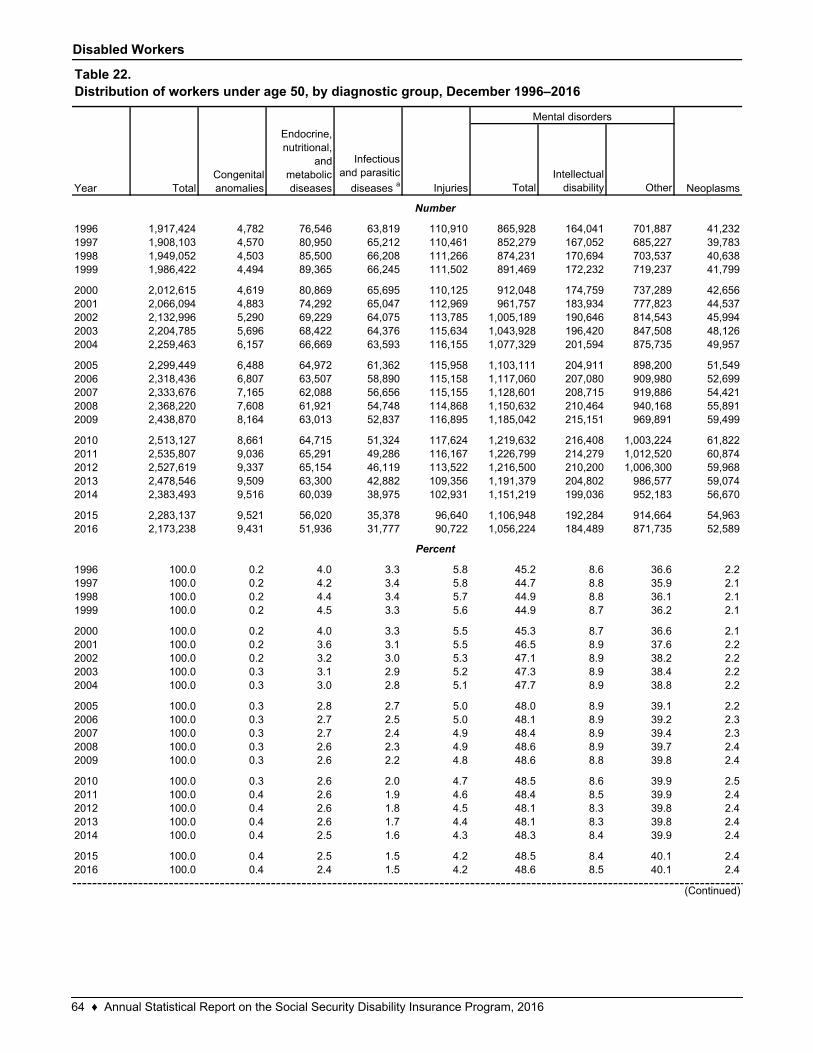
Disabled Workers
TotalIntellectual
disability Other
1,917,424 4,782 76,546 63,819 110,910 865,928 164,041 701,887 41,2321,908,103 4,570 80,950 65,212 110,461 852,279 167,052 685,227 39,7831,949,052 4,503 85,500 66,208 111,266 874,231 170,694 703,537 40,6381,986,422 4,494 89,365 66,245 111,502 891,469 172,232 719,237 41,799
2,012,615 4,619 80,869 65,695 110,125 912,048 174,759 737,289 42,6562,066,094 4,883 74,292 65,047 112,969 961,757 183,934 777,823 44,5372,132,996 5,290 69,229 64,075 113,785 1,005,189 190,646 814,543 45,9942,204,785 5,696 68,422 64,376 115,634 1,043,928 196,420 847,508 48,1262,259,463 6,157 66,669 63,593 116,155 1,077,329 201,594 875,735 49,957
2,299,449 6,488 64,972 61,362 115,958 1,103,111 204,911 898,200 51,5492,318,436 6,807 63,507 58,890 115,158 1,117,060 207,080 909,980 52,6992,333,676 7,165 62,088 56,656 115,155 1,128,601 208,715 919,886 54,4212,368,220 7,608 61,921 54,748 114,868 1,150,632 210,464 940,168 55,8912,438,870 8,164 63,013 52,837 116,895 1,185,042 215,151 969,891 59,499
2,513,127 8,661 64,715 51,324 117,624 1,219,632 216,408 1,003,224 61,8222,535,807 9,036 65,291 49,286 116,167 1,226,799 214,279 1,012,520 60,8742,527,619 9,337 65,154 46,119 113,522 1,216,500 210,200 1,006,300 59,9682,478,546 9,509 63,300 42,882 109,356 1,191,379 204,802 986,577 59,0742,383,493 9,516 60,039 38,975 102,931 1,151,219 199,036 952,183 56,670
2,283,137 9,521 56,020 35,378 96,640 1,106,948 192,284 914,664 54,9632,173,238 9,431 51,936 31,777 90,722 1,056,224 184,489 871,735 52,589
100.0 0.2 4.0 3.3 5.8 45.2 8.6 36.6 2.2100.0 0.2 4.2 3.4 5.8 44.7 8.8 35.9 2.1100.0 0.2 4.4 3.4 5.7 44.9 8.8 36.1 2.1100.0 0.2 4.5 3.3 5.6 44.9 8.7 36.2 2.1
100.0 0.2 4.0 3.3 5.5 45.3 8.7 36.6 2.1100.0 0.2 3.6 3.1 5.5 46.5 8.9 37.6 2.2100.0 0.2 3.2 3.0 5.3 47.1 8.9 38.2 2.2100.0 0.3 3.1 2.9 5.2 47.3 8.9 38.4 2.2100.0 0.3 3.0 2.8 5.1 47.7 8.9 38.8 2.2
100.0 0.3 2.8 2.7 5.0 48.0 8.9 39.1 2.2100.0 0.3 2.7 2.5 5.0 48.1 8.9 39.2 2.3100.0 0.3 2.7 2.4 4.9 48.4 8.9 39.4 2.3100.0 0.3 2.6 2.3 4.9 48.6 8.9 39.7 2.4100.0 0.3 2.6 2.2 4.8 48.6 8.8 39.8 2.4
100.0 0.3 2.6 2.0 4.7 48.5 8.6 39.9 2.5100.0 0.4 2.6 1.9 4.6 48.4 8.5 39.9 2.4100.0 0.4 2.6 1.8 4.5 48.1 8.3 39.8 2.4100.0 0.4 2.6 1.7 4.4 48.1 8.3 39.8 2.4100.0 0.4 2.5 1.6 4.3 48.3 8.4 39.9 2.4
100.0 0.4 2.5 1.5 4.2 48.5 8.4 40.1 2.4100.0 0.4 2.4 1.5 4.2 48.6 8.5 40.1 2.42016
20102011201220132014
2015
2009
19981999
20002001200220032004
2005200620072008
2001200220032004
2005
1997
200720082009
20102011201220132014
20152016
1996
2006
Year
1996199719981999
2000
NeoplasmsTotalCongenital anomalies
Endocrine, nutritional,
and metabolic diseases
Infectious and parasitic
diseases a Injuries
Mental disorders
Number
Percent
Table 22.Distribution of workers under age 50, by diagnostic group, December 1996–2016
(Continued)
64 ♦ Annual Statistical Report on the Social Security Disability Insurance Program, 2016
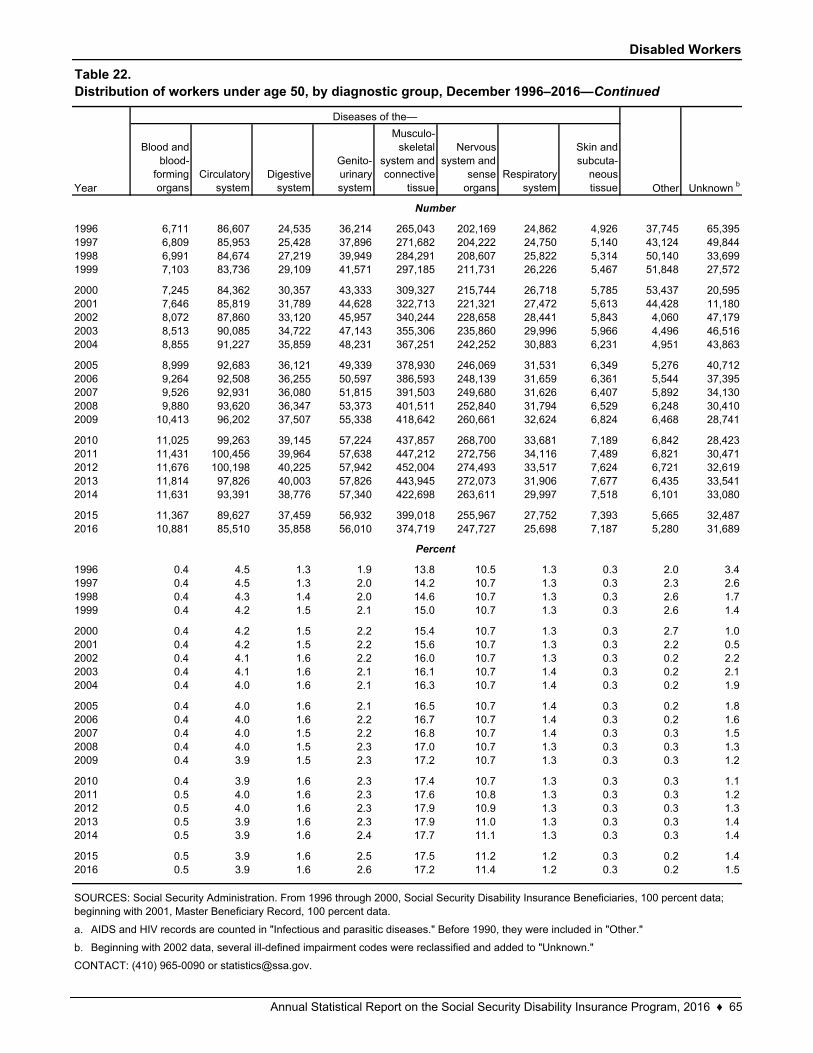
Disabled Workers
Blood and blood-
forming organs
Circulatory system
Digestive system
Genito-urinary system
Musculo-skeletal
system and connective
tissue
Nervous system and
sense organs
Respiratory system
Skin and subcuta-
neous tissue
6,711 86,607 24,535 36,214 265,043 202,169 24,862 4,926 37,745 65,3956,809 85,953 25,428 37,896 271,682 204,222 24,750 5,140 43,124 49,8446,991 84,674 27,219 39,949 284,291 208,607 25,822 5,314 50,140 33,6997,103 83,736 29,109 41,571 297,185 211,731 26,226 5,467 51,848 27,572
7,245 84,362 30,357 43,333 309,327 215,744 26,718 5,785 53,437 20,5957,646 85,819 31,789 44,628 322,713 221,321 27,472 5,613 44,428 11,1808,072 87,860 33,120 45,957 340,244 228,658 28,441 5,843 4,060 47,1798,513 90,085 34,722 47,143 355,306 235,860 29,996 5,966 4,496 46,5168,855 91,227 35,859 48,231 367,251 242,252 30,883 6,231 4,951 43,863
8,999 92,683 36,121 49,339 378,930 246,069 31,531 6,349 5,276 40,7129,264 92,508 36,255 50,597 386,593 248,139 31,659 6,361 5,544 37,3959,526 92,931 36,080 51,815 391,503 249,680 31,626 6,407 5,892 34,1309,880 93,620 36,347 53,373 401,511 252,840 31,794 6,529 6,248 30,410
10,413 96,202 37,507 55,338 418,642 260,661 32,624 6,824 6,468 28,741
11,025 99,263 39,145 57,224 437,857 268,700 33,681 7,189 6,842 28,42311,431 100,456 39,964 57,638 447,212 272,756 34,116 7,489 6,821 30,47111,676 100,198 40,225 57,942 452,004 274,493 33,517 7,624 6,721 32,61911,814 97,826 40,003 57,826 443,945 272,073 31,906 7,677 6,435 33,54111,631 93,391 38,776 57,340 422,698 263,611 29,997 7,518 6,101 33,080
11,367 89,627 37,459 56,932 399,018 255,967 27,752 7,393 5,665 32,48710,881 85,510 35,858 56,010 374,719 247,727 25,698 7,187 5,280 31,689
0.4 4.5 1.3 1.9 13.8 10.5 1.3 0.3 2.0 3.40.4 4.5 1.3 2.0 14.2 10.7 1.3 0.3 2.3 2.60.4 4.3 1.4 2.0 14.6 10.7 1.3 0.3 2.6 1.70.4 4.2 1.5 2.1 15.0 10.7 1.3 0.3 2.6 1.4
0.4 4.2 1.5 2.2 15.4 10.7 1.3 0.3 2.7 1.00.4 4.2 1.5 2.2 15.6 10.7 1.3 0.3 2.2 0.50.4 4.1 1.6 2.2 16.0 10.7 1.3 0.3 0.2 2.20.4 4.1 1.6 2.1 16.1 10.7 1.4 0.3 0.2 2.10.4 4.0 1.6 2.1 16.3 10.7 1.4 0.3 0.2 1.9
0.4 4.0 1.6 2.1 16.5 10.7 1.4 0.3 0.2 1.80.4 4.0 1.6 2.2 16.7 10.7 1.4 0.3 0.2 1.60.4 4.0 1.5 2.2 16.8 10.7 1.4 0.3 0.3 1.50.4 4.0 1.5 2.3 17.0 10.7 1.3 0.3 0.3 1.30.4 3.9 1.5 2.3 17.2 10.7 1.3 0.3 0.3 1.2
0.4 3.9 1.6 2.3 17.4 10.7 1.3 0.3 0.3 1.10.5 4.0 1.6 2.3 17.6 10.8 1.3 0.3 0.3 1.20.5 4.0 1.6 2.3 17.9 10.9 1.3 0.3 0.3 1.30.5 3.9 1.6 2.3 17.9 11.0 1.3 0.3 0.3 1.40.5 3.9 1.6 2.4 17.7 11.1 1.3 0.3 0.3 1.4
0.5 3.9 1.6 2.5 17.5 11.2 1.2 0.3 0.2 1.40.5 3.9 1.6 2.6 17.2 11.4 1.2 0.3 0.2 1.5
a.
b.
Other Unknown b
1996
Diseases of the—
199719981999
20002001
Year
200720082009
20102011
200220032004
20052006
20032004
2005
1996199719981999
2000
201220132014
20152016
AIDS and HIV records are counted in "Infectious and parasitic diseases." Before 1990, they were included in "Other."
Beginning with 2002 data, several ill-defined impairment codes were reclassified and added to "Unknown."
CONTACT: (410) 965-0090 or [email protected].
Number
Percent
2016
Table 22.Distribution of workers under age 50, by diagnostic group, December 1996–2016—Continued
SOURCES: Social Security Administration. From 1996 through 2000, Social Security Disability Insurance Beneficiaries, 100 percent data; beginning with 2001, Master Beneficiary Record, 100 percent data.
2011201220132014
2015
2006200720082009
2010
20012002
Annual Statistical Report on the Social Security Disability Insurance Program, 2016 ♦ 65
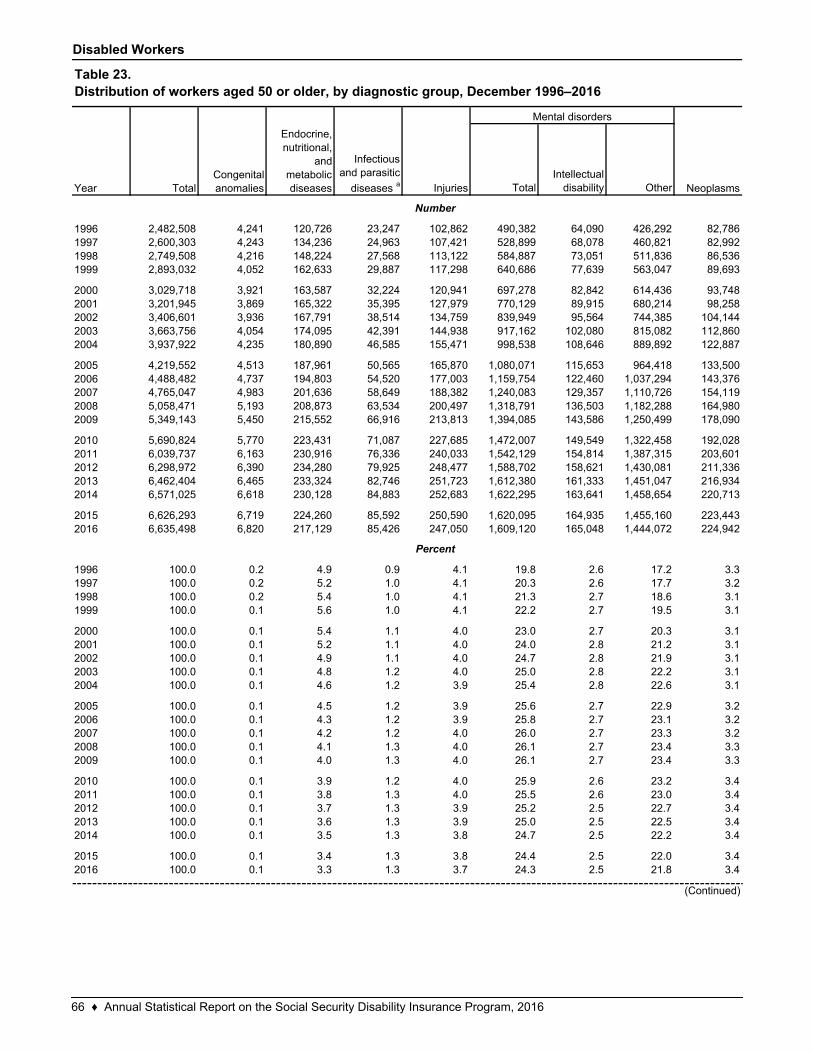
Disabled Workers
TotalIntellectual
disability Other
2,482,508 4,241 120,726 23,247 102,862 490,382 64,090 426,292 82,7862,600,303 4,243 134,236 24,963 107,421 528,899 68,078 460,821 82,9922,749,508 4,216 148,224 27,568 113,122 584,887 73,051 511,836 86,5362,893,032 4,052 162,633 29,887 117,298 640,686 77,639 563,047 89,693
3,029,718 3,921 163,587 32,224 120,941 697,278 82,842 614,436 93,7483,201,945 3,869 165,322 35,395 127,979 770,129 89,915 680,214 98,2583,406,601 3,936 167,791 38,514 134,759 839,949 95,564 744,385 104,1443,663,756 4,054 174,095 42,391 144,938 917,162 102,080 815,082 112,8603,937,922 4,235 180,890 46,585 155,471 998,538 108,646 889,892 122,887
4,219,552 4,513 187,961 50,565 165,870 1,080,071 115,653 964,418 133,5004,488,482 4,737 194,803 54,520 177,003 1,159,754 122,460 1,037,294 143,3764,765,047 4,983 201,636 58,649 188,382 1,240,083 129,357 1,110,726 154,1195,058,471 5,193 208,873 63,534 200,497 1,318,791 136,503 1,182,288 164,9805,349,143 5,450 215,552 66,916 213,813 1,394,085 143,586 1,250,499 178,090
5,690,824 5,770 223,431 71,087 227,685 1,472,007 149,549 1,322,458 192,0286,039,737 6,163 230,916 76,336 240,033 1,542,129 154,814 1,387,315 203,6016,298,972 6,390 234,280 79,925 248,477 1,588,702 158,621 1,430,081 211,3366,462,404 6,465 233,324 82,746 251,723 1,612,380 161,333 1,451,047 216,9346,571,025 6,618 230,128 84,883 252,683 1,622,295 163,641 1,458,654 220,713
6,626,293 6,719 224,260 85,592 250,590 1,620,095 164,935 1,455,160 223,4436,635,498 6,820 217,129 85,426 247,050 1,609,120 165,048 1,444,072 224,942
100.0 0.2 4.9 0.9 4.1 19.8 2.6 17.2 3.3100.0 0.2 5.2 1.0 4.1 20.3 2.6 17.7 3.2100.0 0.2 5.4 1.0 4.1 21.3 2.7 18.6 3.1100.0 0.1 5.6 1.0 4.1 22.2 2.7 19.5 3.1
100.0 0.1 5.4 1.1 4.0 23.0 2.7 20.3 3.1100.0 0.1 5.2 1.1 4.0 24.0 2.8 21.2 3.1100.0 0.1 4.9 1.1 4.0 24.7 2.8 21.9 3.1100.0 0.1 4.8 1.2 4.0 25.0 2.8 22.2 3.1100.0 0.1 4.6 1.2 3.9 25.4 2.8 22.6 3.1
100.0 0.1 4.5 1.2 3.9 25.6 2.7 22.9 3.2100.0 0.1 4.3 1.2 3.9 25.8 2.7 23.1 3.2100.0 0.1 4.2 1.2 4.0 26.0 2.7 23.3 3.2100.0 0.1 4.1 1.3 4.0 26.1 2.7 23.4 3.3100.0 0.1 4.0 1.3 4.0 26.1 2.7 23.4 3.3
100.0 0.1 3.9 1.2 4.0 25.9 2.6 23.2 3.4100.0 0.1 3.8 1.3 4.0 25.5 2.6 23.0 3.4100.0 0.1 3.7 1.3 3.9 25.2 2.5 22.7 3.4100.0 0.1 3.6 1.3 3.9 25.0 2.5 22.5 3.4100.0 0.1 3.5 1.3 3.8 24.7 2.5 22.2 3.4
100.0 0.1 3.4 1.3 3.8 24.4 2.5 22.0 3.4100.0 0.1 3.3 1.3 3.7 24.3 2.5 21.8 3.42016
20102011201220132014
2015
2009
19981999
20002001200220032004
2005200620072008
2001200220032004
2005
1997
200720082009
20102011201220132014
20152016
1996
2006
Year
1996199719981999
2000
NeoplasmsTotalCongenital anomalies
Endocrine, nutritional,
and metabolic diseases
Infectious and parasitic
diseases a Injuries
Mental disorders
Number
Percent
Table 23.Distribution of workers aged 50 or older, by diagnostic group, December 1996–2016
(Continued)
66 ♦ Annual Statistical Report on the Social Security Disability Insurance Program, 2016
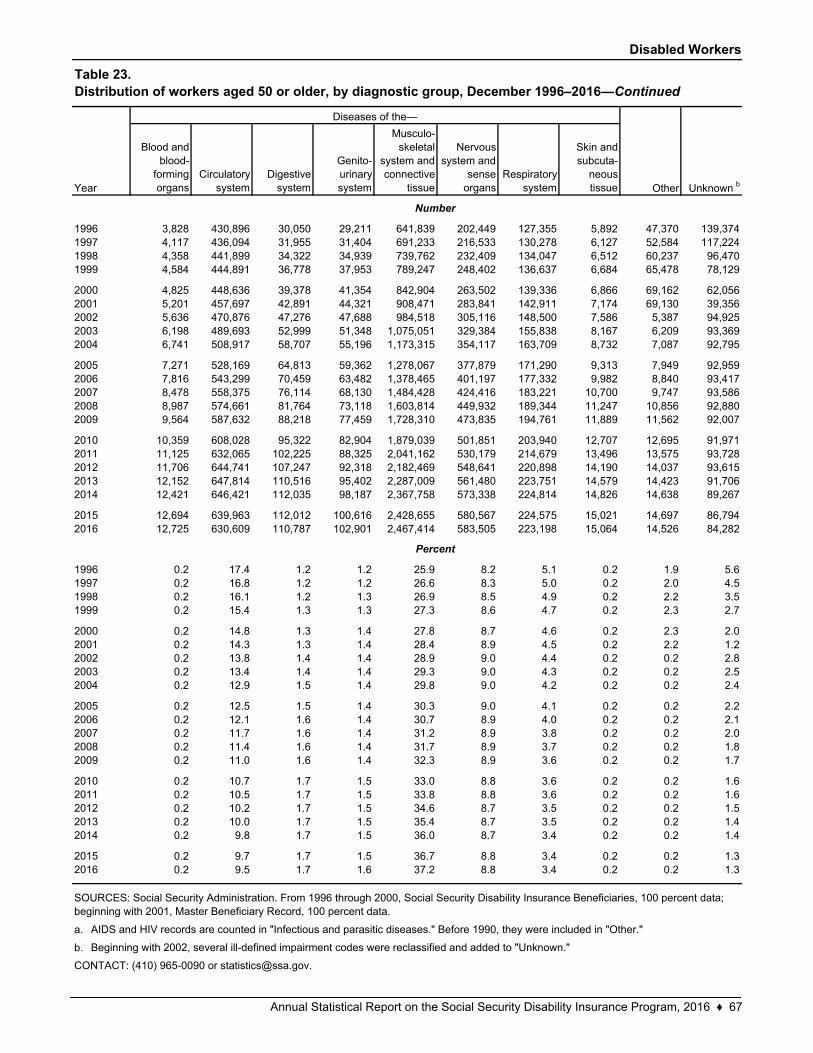
Disabled Workers
Blood and blood-
forming organs
Circulatory system
Digestive system
Genito-urinary system
Musculo-skeletal
system and connective
tissue
Nervous system and
sense organs
Respiratory system
Skin and subcuta-
neous tissue
3,828 430,896 30,050 29,211 641,839 202,449 127,355 5,892 47,370 139,3744,117 436,094 31,955 31,404 691,233 216,533 130,278 6,127 52,584 117,2244,358 441,899 34,322 34,939 739,762 232,409 134,047 6,512 60,237 96,4704,584 444,891 36,778 37,953 789,247 248,402 136,637 6,684 65,478 78,129
4,825 448,636 39,378 41,354 842,904 263,502 139,336 6,866 69,162 62,0565,201 457,697 42,891 44,321 908,471 283,841 142,911 7,174 69,130 39,3565,636 470,876 47,276 47,688 984,518 305,116 148,500 7,586 5,387 94,9256,198 489,693 52,999 51,348 1,075,051 329,384 155,838 8,167 6,209 93,3696,741 508,917 58,707 55,196 1,173,315 354,117 163,709 8,732 7,087 92,795
7,271 528,169 64,813 59,362 1,278,067 377,879 171,290 9,313 7,949 92,9597,816 543,299 70,459 63,482 1,378,465 401,197 177,332 9,982 8,840 93,4178,478 558,375 76,114 68,130 1,484,428 424,416 183,221 10,700 9,747 93,5868,987 574,661 81,764 73,118 1,603,814 449,932 189,344 11,247 10,856 92,8809,564 587,632 88,218 77,459 1,728,310 473,835 194,761 11,889 11,562 92,007
10,359 608,028 95,322 82,904 1,879,039 501,851 203,940 12,707 12,695 91,97111,125 632,065 102,225 88,325 2,041,162 530,179 214,679 13,496 13,575 93,72811,706 644,741 107,247 92,318 2,182,469 548,641 220,898 14,190 14,037 93,61512,152 647,814 110,516 95,402 2,287,009 561,480 223,751 14,579 14,423 91,70612,421 646,421 112,035 98,187 2,367,758 573,338 224,814 14,826 14,638 89,267
12,694 639,963 112,012 100,616 2,428,655 580,567 224,575 15,021 14,697 86,79412,725 630,609 110,787 102,901 2,467,414 583,505 223,198 15,064 14,526 84,282
0.2 17.4 1.2 1.2 25.9 8.2 5.1 0.2 1.9 5.60.2 16.8 1.2 1.2 26.6 8.3 5.0 0.2 2.0 4.50.2 16.1 1.2 1.3 26.9 8.5 4.9 0.2 2.2 3.50.2 15.4 1.3 1.3 27.3 8.6 4.7 0.2 2.3 2.7
0.2 14.8 1.3 1.4 27.8 8.7 4.6 0.2 2.3 2.00.2 14.3 1.3 1.4 28.4 8.9 4.5 0.2 2.2 1.20.2 13.8 1.4 1.4 28.9 9.0 4.4 0.2 0.2 2.80.2 13.4 1.4 1.4 29.3 9.0 4.3 0.2 0.2 2.50.2 12.9 1.5 1.4 29.8 9.0 4.2 0.2 0.2 2.4
0.2 12.5 1.5 1.4 30.3 9.0 4.1 0.2 0.2 2.20.2 12.1 1.6 1.4 30.7 8.9 4.0 0.2 0.2 2.10.2 11.7 1.6 1.4 31.2 8.9 3.8 0.2 0.2 2.00.2 11.4 1.6 1.4 31.7 8.9 3.7 0.2 0.2 1.80.2 11.0 1.6 1.4 32.3 8.9 3.6 0.2 0.2 1.7
0.2 10.7 1.7 1.5 33.0 8.8 3.6 0.2 0.2 1.60.2 10.5 1.7 1.5 33.8 8.8 3.6 0.2 0.2 1.60.2 10.2 1.7 1.5 34.6 8.7 3.5 0.2 0.2 1.50.2 10.0 1.7 1.5 35.4 8.7 3.5 0.2 0.2 1.40.2 9.8 1.7 1.5 36.0 8.7 3.4 0.2 0.2 1.4
0.2 9.7 1.7 1.5 36.7 8.8 3.4 0.2 0.2 1.30.2 9.5 1.7 1.6 37.2 8.8 3.4 0.2 0.2 1.3
a.
b.
Other Unknown b
1996
Diseases of the—
199719981999
20002001
Year
200720082009
20102011
200220032004
20052006
20032004
2005
1996199719981999
2000
201220132014
20152016
AIDS and HIV records are counted in "Infectious and parasitic diseases." Before 1990, they were included in "Other."
Beginning with 2002, several ill-defined impairment codes were reclassified and added to "Unknown."
CONTACT: (410) 965-0090 or [email protected].
Number
Percent
2016
Table 23.Distribution of workers aged 50 or older, by diagnostic group, December 1996–2016—Continued
SOURCES: Social Security Administration. From 1996 through 2000, Social Security Disability Insurance Beneficiaries, 100 percent data; beginning with 2001, Master Beneficiary Record, 100 percent data.
2011201220132014
2015
2006200720082009
2010
20012002
Annual Statistical Report on the Social Security Disability Insurance Program, 2016 ♦ 67
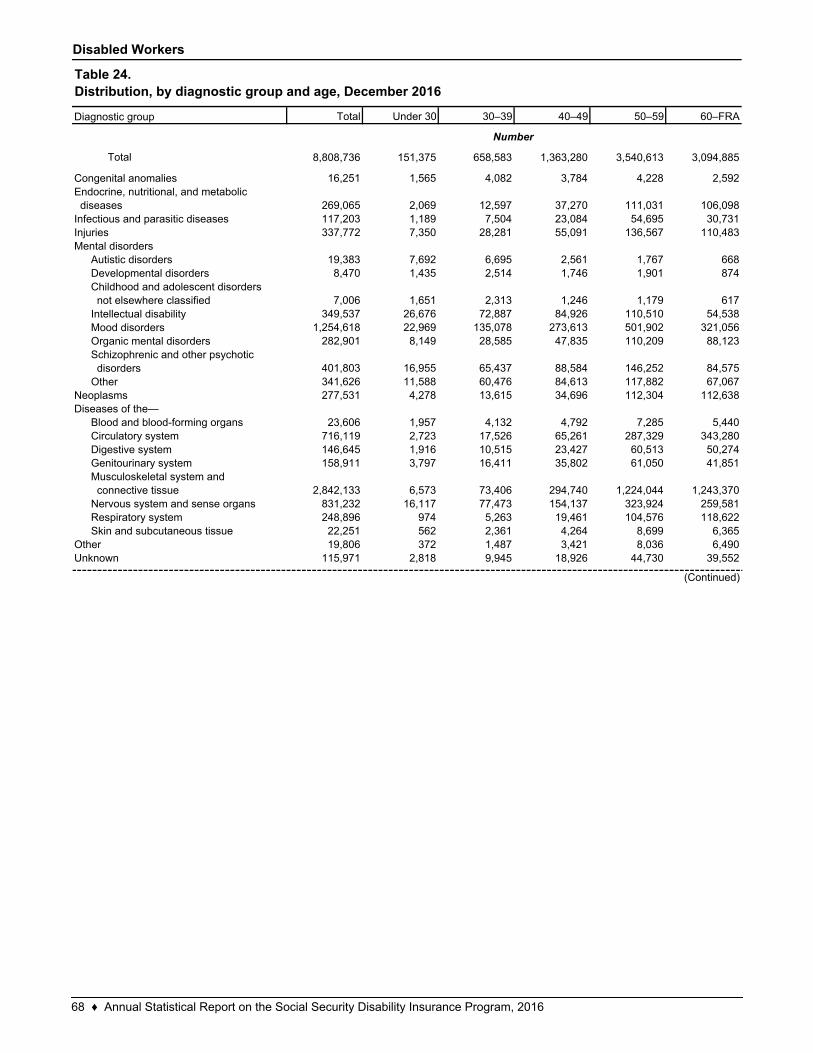
Disabled Workers
Total Under 30 30–39 40–49 50–59 60–FRA
Total 8,808,736 151,375 658,583 1,363,280 3,540,613 3,094,885
16,251 1,565 4,082 3,784 4,228 2,592
269,065 2,069 12,597 37,270 111,031 106,098117,203 1,189 7,504 23,084 54,695 30,731337,772 7,350 28,281 55,091 136,567 110,483
19,383 7,692 6,695 2,561 1,767 6688,470 1,435 2,514 1,746 1,901 874
7,006 1,651 2,313 1,246 1,179 617349,537 26,676 72,887 84,926 110,510 54,538
1,254,618 22,969 135,078 273,613 501,902 321,056282,901 8,149 28,585 47,835 110,209 88,123
401,803 16,955 65,437 88,584 146,252 84,575341,626 11,588 60,476 84,613 117,882 67,067277,531 4,278 13,615 34,696 112,304 112,638
23,606 1,957 4,132 4,792 7,285 5,440716,119 2,723 17,526 65,261 287,329 343,280146,645 1,916 10,515 23,427 60,513 50,274158,911 3,797 16,411 35,802 61,050 41,851
2,842,133 6,573 73,406 294,740 1,224,044 1,243,370831,232 16,117 77,473 154,137 323,924 259,581248,896 974 5,263 19,461 104,576 118,62222,251 562 2,361 4,264 8,699 6,36519,806 372 1,487 3,421 8,036 6,490
115,971 2,818 9,945 18,926 44,730 39,552
Congenital anomaliesEndocrine, nutritional, and metabolic diseasesInfectious and parasitic diseasesInjuriesMental disorders
Digestive system
Developmental disordersChildhood and adolescent disorders not elsewhere classifiedIntellectual disabilityMood disordersOrganic mental disordersSchizophrenic and other psychotic disordersOther
Neoplasms
Table 24.Distribution, by diagnostic group and age, December 2016
Number
Diagnostic group
(Continued)
Autistic disorders
Diseases of the—Blood and blood-forming organsCirculatory system
Genitourinary systemMusculoskeletal system and connective tissueNervous system and sense organsRespiratory systemSkin and subcutaneous tissue
OtherUnknown
68 ♦ Annual Statistical Report on the Social Security Disability Insurance Program, 2016
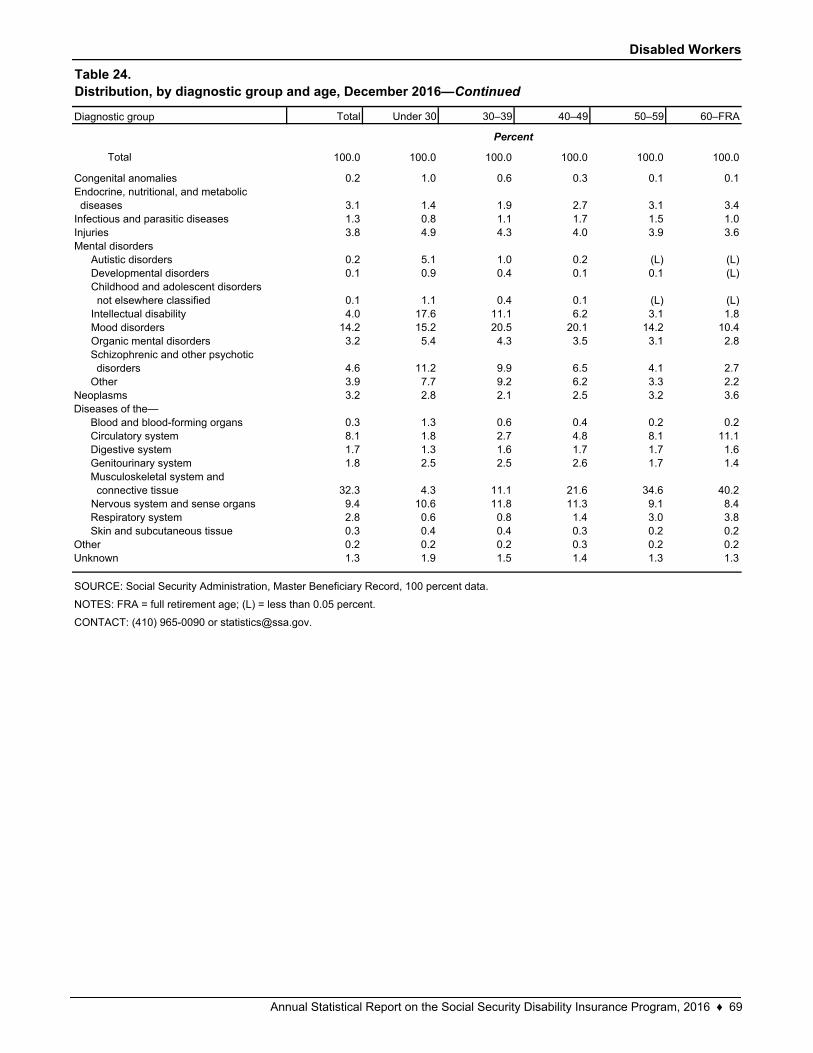
Disabled Workers
Total Under 30 30–39 40–49 50–59 60–FRA
Total 100.0 100.0 100.0 100.0 100.0 100.0
0.2 1.0 0.6 0.3 0.1 0.1
3.1 1.4 1.9 2.7 3.1 3.41.3 0.8 1.1 1.7 1.5 1.03.8 4.9 4.3 4.0 3.9 3.6
0.2 5.1 1.0 0.2 (L) (L)0.1 0.9 0.4 0.1 0.1 (L)
0.1 1.1 0.4 0.1 (L) (L)4.0 17.6 11.1 6.2 3.1 1.8
14.2 15.2 20.5 20.1 14.2 10.43.2 5.4 4.3 3.5 3.1 2.8
4.6 11.2 9.9 6.5 4.1 2.73.9 7.7 9.2 6.2 3.3 2.23.2 2.8 2.1 2.5 3.2 3.6
0.3 1.3 0.6 0.4 0.2 0.28.1 1.8 2.7 4.8 8.1 11.11.7 1.3 1.6 1.7 1.7 1.61.8 2.5 2.5 2.6 1.7 1.4
32.3 4.3 11.1 21.6 34.6 40.29.4 10.6 11.8 11.3 9.1 8.42.8 0.6 0.8 1.4 3.0 3.80.3 0.4 0.4 0.3 0.2 0.20.2 0.2 0.2 0.3 0.2 0.21.3 1.9 1.5 1.4 1.3 1.3
Skin and subcutaneous tissueOtherUnknown
Circulatory systemDigestive systemGenitourinary systemMusculoskeletal system and connective tissue
Respiratory system
Schizophrenic and other psychotic disordersOther
NeoplasmsDiseases of the—
Blood and blood-forming organs
Table 24.Distribution, by diagnostic group and age, December 2016—Continued
Diagnostic group
Percent
SOURCE: Social Security Administration, Master Beneficiary Record, 100 percent data.
NOTES: FRA = full retirement age; (L) = less than 0.05 percent.
CONTACT: (410) 965-0090 or [email protected].
Autistic disordersDevelopmental disordersChildhood and adolescent disorders not elsewhere classifiedIntellectual disability
Mental disorders
Congenital anomaliesEndocrine, nutritional, and metabolic diseasesInfectious and parasitic diseasesInjuries
Nervous system and sense organs
Mood disordersOrganic mental disorders
Annual Statistical Report on the Social Security Disability Insurance Program, 2016 ♦ 69
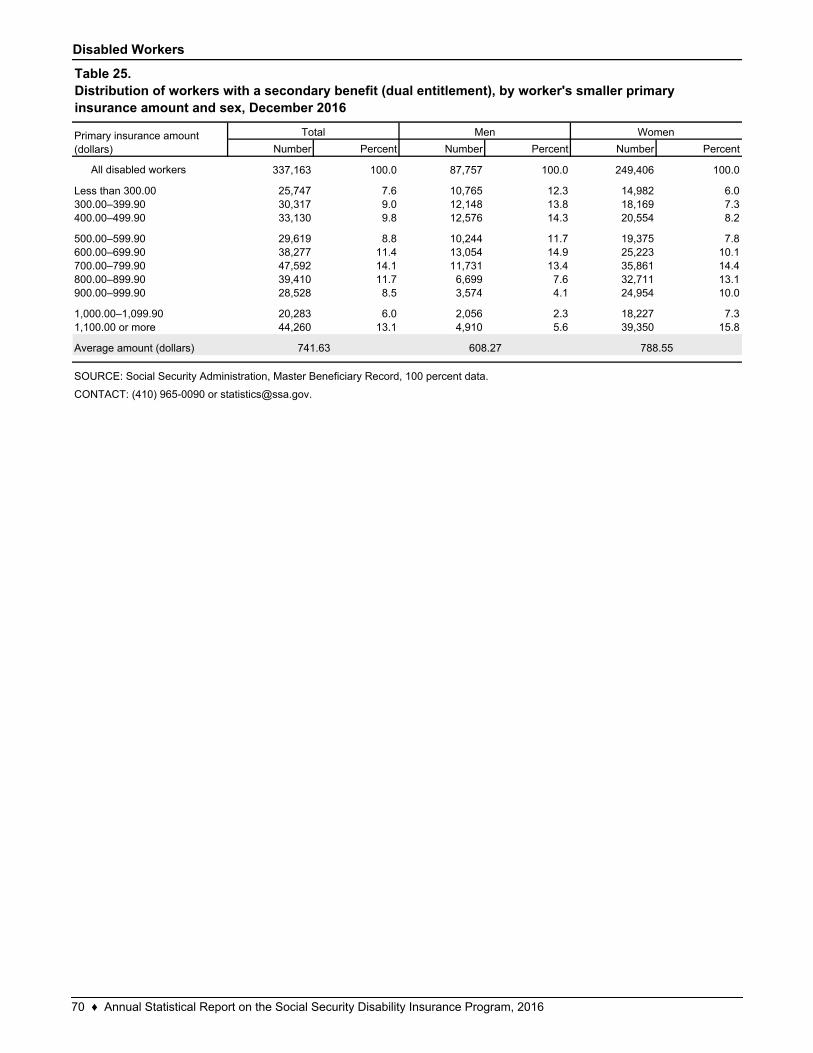
Disabled Workers
Number Percent Number Percent Number Percent
All disabled workers 337,163 100.0 87,757 100.0 249,406 100.0
25,747 7.6 10,765 12.3 14,982 6.030,317 9.0 12,148 13.8 18,169 7.333,130 9.8 12,576 14.3 20,554 8.2
29,619 8.8 10,244 11.7 19,375 7.838,277 11.4 13,054 14.9 25,223 10.147,592 14.1 11,731 13.4 35,861 14.439,410 11.7 6,699 7.6 32,711 13.128,528 8.5 3,574 4.1 24,954 10.0
20,283 6.0 2,056 2.3 18,227 7.344,260 13.1 4,910 5.6 39,350 15.8
741.63 608.27 788.55
SOURCE: Social Security Administration, Master Beneficiary Record, 100 percent data.
CONTACT: (410) 965-0090 or [email protected].
Less than 300.00300.00–399.90400.00–499.90
500.00–599.90
Average amount (dollars)
600.00–699.90700.00–799.90800.00–899.90900.00–999.90
1,000.00–1,099.901,100.00 or more
Table 25.Distribution of workers with a secondary benefit (dual entitlement), by worker's smaller primary insurance amount and sex, December 2016
Total Men WomenPrimary insurance amount (dollars)
70 ♦ Annual Statistical Report on the Social Security Disability Insurance Program, 2016
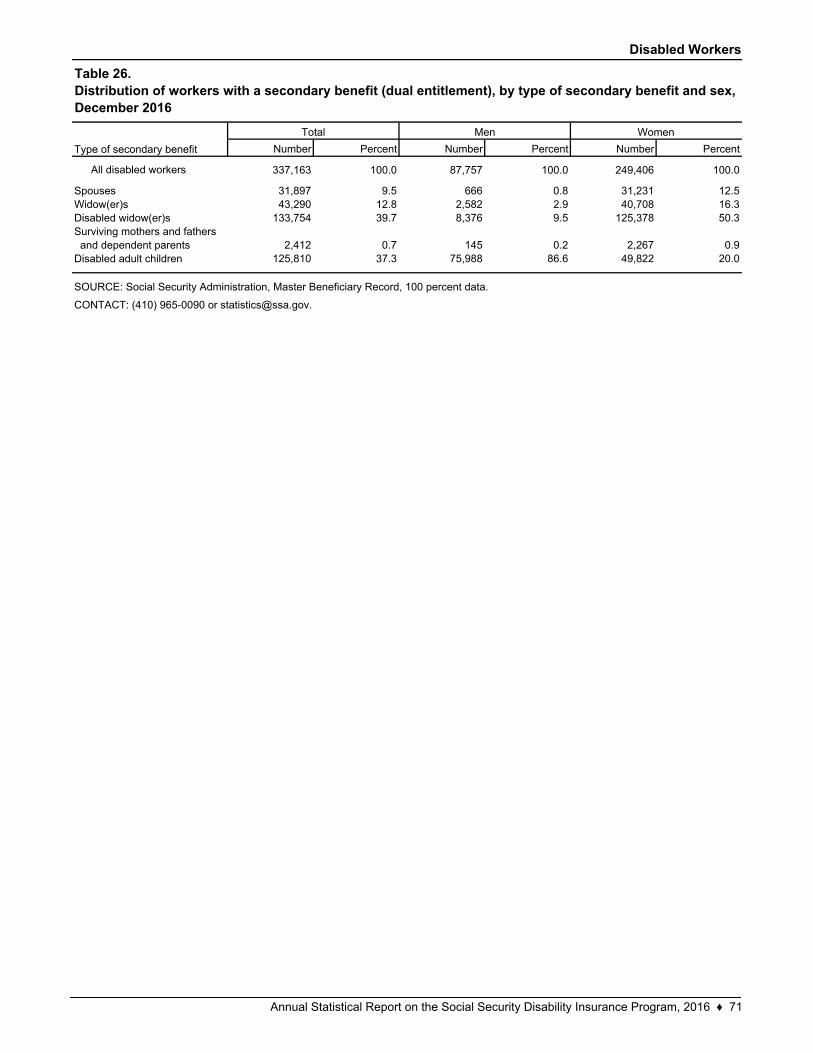
Disabled Workers
Number Percent Number Percent Number Percent
All disabled workers 337,163 100.0 87,757 100.0 249,406 100.0
31,897 9.5 666 0.8 31,231 12.543,290 12.8 2,582 2.9 40,708 16.3
133,754 39.7 8,376 9.5 125,378 50.3
2,412 0.7 145 0.2 2,267 0.9125,810 37.3 75,988 86.6 49,822 20.0
CONTACT: (410) 965-0090 or [email protected].
Type of secondary benefit
SpousesWidow(er)sDisabled widow(er)sSurviving mothers and fathers and dependent parentsDisabled adult children
Table 26.Distribution of workers with a secondary benefit (dual entitlement), by type of secondary benefit and sex, December 2016
Total Men Women
SOURCE: Social Security Administration, Master Beneficiary Record, 100 percent data.
Annual Statistical Report on the Social Security Disability Insurance Program, 2016 ♦ 71
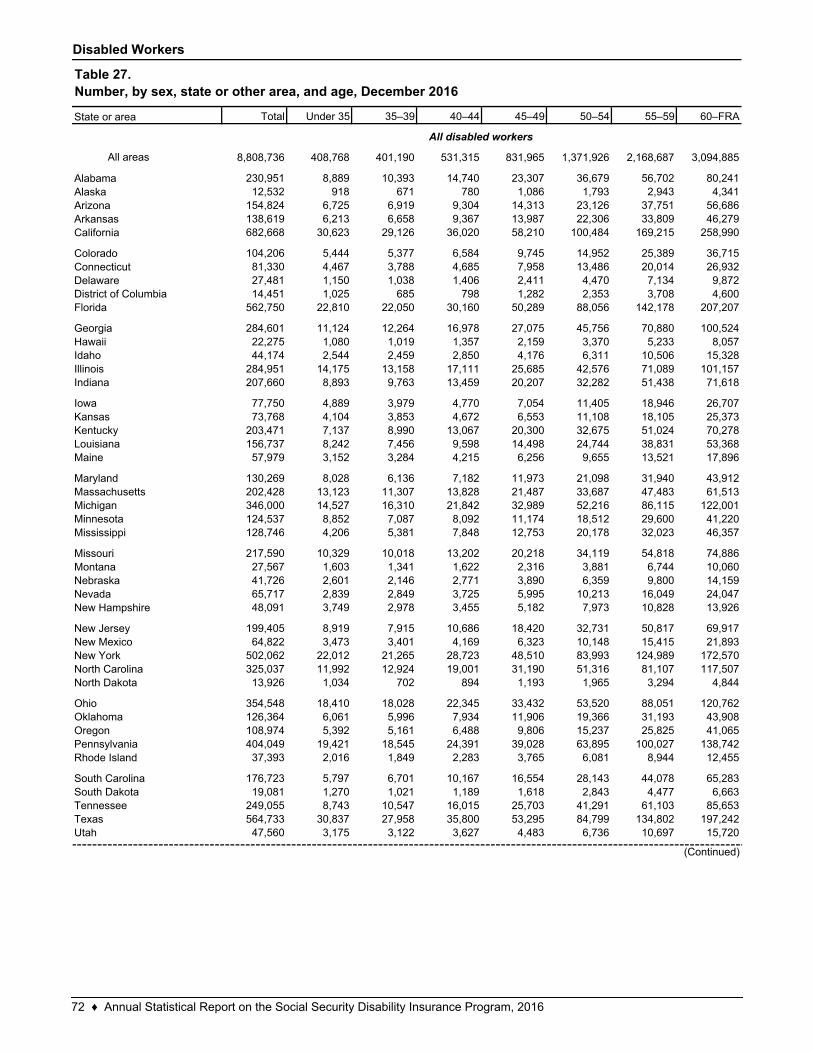
Disabled Workers
Total Under 35 35–39 40–44 45–49 50–54 55–59 60–FRA
All areas 8,808,736 408,768 401,190 531,315 831,965 1,371,926 2,168,687 3,094,885
230,951 8,889 10,393 14,740 23,307 36,679 56,702 80,24112,532 918 671 780 1,086 1,793 2,943 4,341
154,824 6,725 6,919 9,304 14,313 23,126 37,751 56,686138,619 6,213 6,658 9,367 13,987 22,306 33,809 46,279682,668 30,623 29,126 36,020 58,210 100,484 169,215 258,990
104,206 5,444 5,377 6,584 9,745 14,952 25,389 36,71581,330 4,467 3,788 4,685 7,958 13,486 20,014 26,93227,481 1,150 1,038 1,406 2,411 4,470 7,134 9,87214,451 1,025 685 798 1,282 2,353 3,708 4,600
562,750 22,810 22,050 30,160 50,289 88,056 142,178 207,207
284,601 11,124 12,264 16,978 27,075 45,756 70,880 100,52422,275 1,080 1,019 1,357 2,159 3,370 5,233 8,05744,174 2,544 2,459 2,850 4,176 6,311 10,506 15,328
284,951 14,175 13,158 17,111 25,685 42,576 71,089 101,157207,660 8,893 9,763 13,459 20,207 32,282 51,438 71,618
77,750 4,889 3,979 4,770 7,054 11,405 18,946 26,70773,768 4,104 3,853 4,672 6,553 11,108 18,105 25,373
203,471 7,137 8,990 13,067 20,300 32,675 51,024 70,278156,737 8,242 7,456 9,598 14,498 24,744 38,831 53,36857,979 3,152 3,284 4,215 6,256 9,655 13,521 17,896
130,269 8,028 6,136 7,182 11,973 21,098 31,940 43,912202,428 13,123 11,307 13,828 21,487 33,687 47,483 61,513346,000 14,527 16,310 21,842 32,989 52,216 86,115 122,001124,537 8,852 7,087 8,092 11,174 18,512 29,600 41,220128,746 4,206 5,381 7,848 12,753 20,178 32,023 46,357
217,590 10,329 10,018 13,202 20,218 34,119 54,818 74,88627,567 1,603 1,341 1,622 2,316 3,881 6,744 10,06041,726 2,601 2,146 2,771 3,890 6,359 9,800 14,15965,717 2,839 2,849 3,725 5,995 10,213 16,049 24,04748,091 3,749 2,978 3,455 5,182 7,973 10,828 13,926
199,405 8,919 7,915 10,686 18,420 32,731 50,817 69,91764,822 3,473 3,401 4,169 6,323 10,148 15,415 21,893
502,062 22,012 21,265 28,723 48,510 83,993 124,989 172,570325,037 11,992 12,924 19,001 31,190 51,316 81,107 117,50713,926 1,034 702 894 1,193 1,965 3,294 4,844
354,548 18,410 18,028 22,345 33,432 53,520 88,051 120,762126,364 6,061 5,996 7,934 11,906 19,366 31,193 43,908108,974 5,392 5,161 6,488 9,806 15,237 25,825 41,065404,049 19,421 18,545 24,391 39,028 63,895 100,027 138,74237,393 2,016 1,849 2,283 3,765 6,081 8,944 12,455
176,723 5,797 6,701 10,167 16,554 28,143 44,078 65,28319,081 1,270 1,021 1,189 1,618 2,843 4,477 6,663
249,055 8,743 10,547 16,015 25,703 41,291 61,103 85,653564,733 30,837 27,958 35,800 53,295 84,799 134,802 197,24247,560 3,175 3,122 3,627 4,483 6,736 10,697 15,720
TennesseeTexasUtah
OregonPennsylvaniaRhode Island
South CarolinaSouth Dakota
New JerseyNew MexicoNew YorkNorth CarolinaNorth Dakota
Ohio
State or area
AlabamaAlaskaArizonaArkansasCalifornia
ColoradoConnecticutDelaware
Mississippi
MissouriMontanaNebraskaNevadaNew Hampshire
Table 27.Number, by sex, state or other area, and age, December 2016
All disabled workers
District of ColumbiaFlorida
GeorgiaHawaii
(Continued)
IdahoIllinoisIndiana
IowaKansasKentuckyLouisianaMaine
MarylandMassachusettsMichiganMinnesota
Oklahoma
72 ♦ Annual Statistical Report on the Social Security Disability Insurance Program, 2016
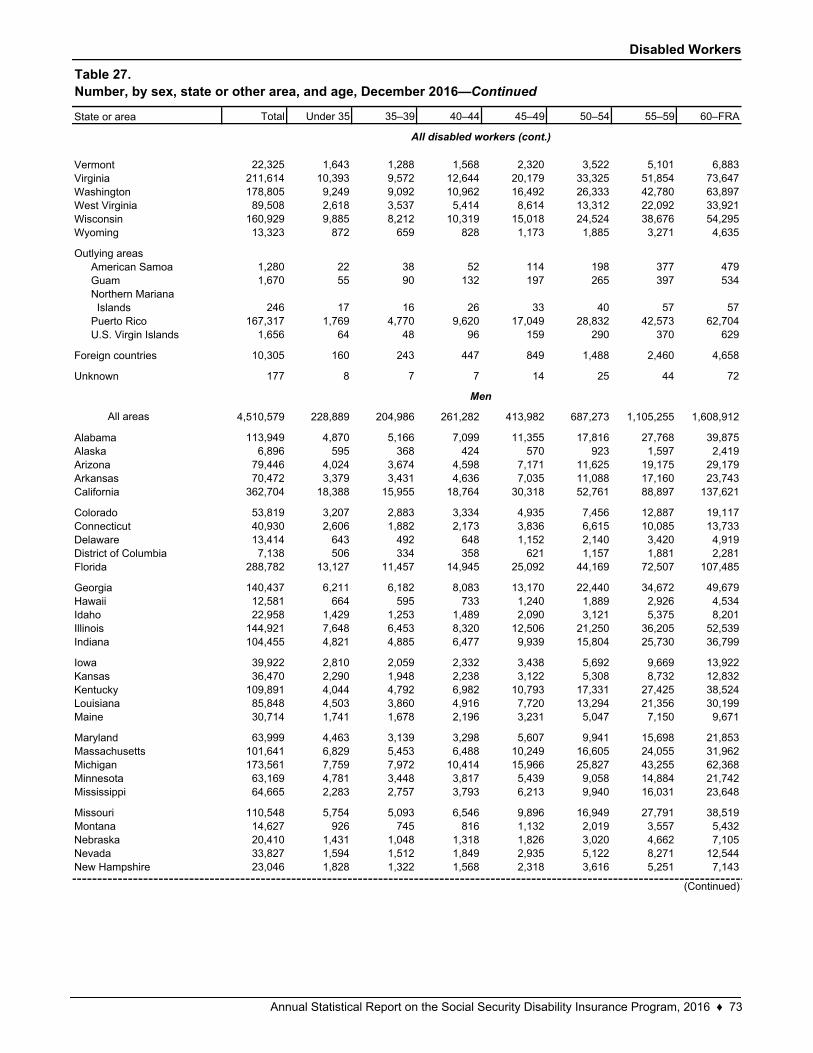
Disabled Workers
Total Under 35 35–39 40–44 45–49 50–54 55–59 60–FRA
22,325 1,643 1,288 1,568 2,320 3,522 5,101 6,883211,614 10,393 9,572 12,644 20,179 33,325 51,854 73,647178,805 9,249 9,092 10,962 16,492 26,333 42,780 63,89789,508 2,618 3,537 5,414 8,614 13,312 22,092 33,921
160,929 9,885 8,212 10,319 15,018 24,524 38,676 54,29513,323 872 659 828 1,173 1,885 3,271 4,635
1,280 22 38 52 114 198 377 4791,670 55 90 132 197 265 397 534
246 17 16 26 33 40 57 57167,317 1,769 4,770 9,620 17,049 28,832 42,573 62,704
1,656 64 48 96 159 290 370 629
10,305 160 243 447 849 1,488 2,460 4,658
177 8 7 7 14 25 44 72
All areas 4,510,579 228,889 204,986 261,282 413,982 687,273 1,105,255 1,608,912
113,949 4,870 5,166 7,099 11,355 17,816 27,768 39,8756,896 595 368 424 570 923 1,597 2,419
79,446 4,024 3,674 4,598 7,171 11,625 19,175 29,17970,472 3,379 3,431 4,636 7,035 11,088 17,160 23,743
362,704 18,388 15,955 18,764 30,318 52,761 88,897 137,621
53,819 3,207 2,883 3,334 4,935 7,456 12,887 19,11740,930 2,606 1,882 2,173 3,836 6,615 10,085 13,73313,414 643 492 648 1,152 2,140 3,420 4,9197,138 506 334 358 621 1,157 1,881 2,281
288,782 13,127 11,457 14,945 25,092 44,169 72,507 107,485
140,437 6,211 6,182 8,083 13,170 22,440 34,672 49,67912,581 664 595 733 1,240 1,889 2,926 4,53422,958 1,429 1,253 1,489 2,090 3,121 5,375 8,201
144,921 7,648 6,453 8,320 12,506 21,250 36,205 52,539104,455 4,821 4,885 6,477 9,939 15,804 25,730 36,799
39,922 2,810 2,059 2,332 3,438 5,692 9,669 13,92236,470 2,290 1,948 2,238 3,122 5,308 8,732 12,832
109,891 4,044 4,792 6,982 10,793 17,331 27,425 38,52485,848 4,503 3,860 4,916 7,720 13,294 21,356 30,19930,714 1,741 1,678 2,196 3,231 5,047 7,150 9,671
63,999 4,463 3,139 3,298 5,607 9,941 15,698 21,853101,641 6,829 5,453 6,488 10,249 16,605 24,055 31,962173,561 7,759 7,972 10,414 15,966 25,827 43,255 62,36863,169 4,781 3,448 3,817 5,439 9,058 14,884 21,74264,665 2,283 2,757 3,793 6,213 9,940 16,031 23,648
110,548 5,754 5,093 6,546 9,896 16,949 27,791 38,51914,627 926 745 816 1,132 2,019 3,557 5,43220,410 1,431 1,048 1,318 1,826 3,020 4,662 7,10533,827 1,594 1,512 1,849 2,935 5,122 8,271 12,54423,046 1,828 1,322 1,568 2,318 3,616 5,251 7,143
MissouriMontanaNebraskaNevadaNew Hampshire
Maine
MarylandMassachusettsMichiganMinnesotaMississippi
(Continued)
IllinoisIndiana
IowaKansasKentuckyLouisiana
DelawareDistrict of ColumbiaFlorida
GeorgiaHawaiiIdaho
AlaskaArizonaArkansasCalifornia
ColoradoConnecticut
Northern Mariana IslandsPuerto RicoU.S. Virgin Islands
Foreign countries
Unknown
Alabama
West VirginiaWisconsinWyoming
Outlying areasAmerican SamoaGuam
VermontVirginiaWashington
Men
Table 27.Number, by sex, state or other area, and age, December 2016—Continued
State or area
All disabled workers (cont.)
Annual Statistical Report on the Social Security Disability Insurance Program, 2016 ♦ 73
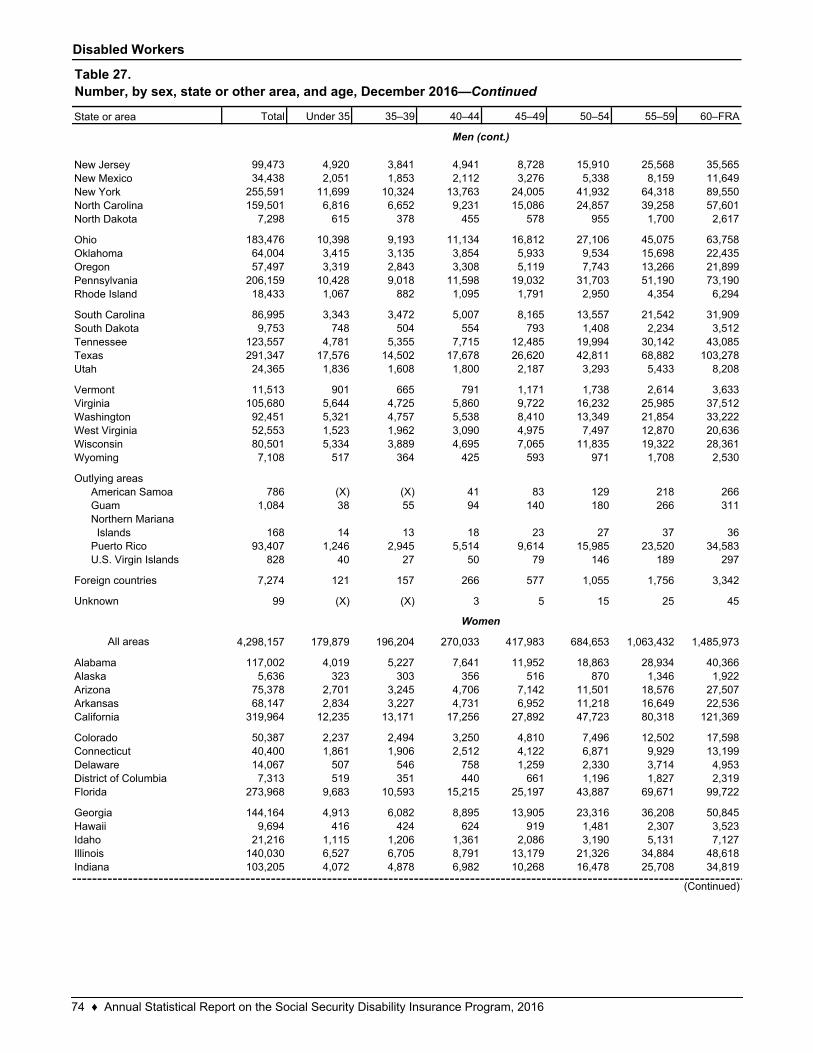
Disabled Workers
Total Under 35 35–39 40–44 45–49 50–54 55–59 60–FRA
99,473 4,920 3,841 4,941 8,728 15,910 25,568 35,56534,438 2,051 1,853 2,112 3,276 5,338 8,159 11,649
255,591 11,699 10,324 13,763 24,005 41,932 64,318 89,550159,501 6,816 6,652 9,231 15,086 24,857 39,258 57,601
7,298 615 378 455 578 955 1,700 2,617
183,476 10,398 9,193 11,134 16,812 27,106 45,075 63,75864,004 3,415 3,135 3,854 5,933 9,534 15,698 22,43557,497 3,319 2,843 3,308 5,119 7,743 13,266 21,899
206,159 10,428 9,018 11,598 19,032 31,703 51,190 73,19018,433 1,067 882 1,095 1,791 2,950 4,354 6,294
86,995 3,343 3,472 5,007 8,165 13,557 21,542 31,9099,753 748 504 554 793 1,408 2,234 3,512
123,557 4,781 5,355 7,715 12,485 19,994 30,142 43,085291,347 17,576 14,502 17,678 26,620 42,811 68,882 103,27824,365 1,836 1,608 1,800 2,187 3,293 5,433 8,208
11,513 901 665 791 1,171 1,738 2,614 3,633105,680 5,644 4,725 5,860 9,722 16,232 25,985 37,51292,451 5,321 4,757 5,538 8,410 13,349 21,854 33,22252,553 1,523 1,962 3,090 4,975 7,497 12,870 20,63680,501 5,334 3,889 4,695 7,065 11,835 19,322 28,3617,108 517 364 425 593 971 1,708 2,530
786 (X) (X) 41 83 129 218 2661,084 38 55 94 140 180 266 311
168 14 13 18 23 27 37 3693,407 1,246 2,945 5,514 9,614 15,985 23,520 34,583
828 40 27 50 79 146 189 297
7,274 121 157 266 577 1,055 1,756 3,342
99 (X) (X) 3 5 15 25 45
All areas 4,298,157 179,879 196,204 270,033 417,983 684,653 1,063,432 1,485,973
117,002 4,019 5,227 7,641 11,952 18,863 28,934 40,3665,636 323 303 356 516 870 1,346 1,922
75,378 2,701 3,245 4,706 7,142 11,501 18,576 27,50768,147 2,834 3,227 4,731 6,952 11,218 16,649 22,536
319,964 12,235 13,171 17,256 27,892 47,723 80,318 121,369
50,387 2,237 2,494 3,250 4,810 7,496 12,502 17,59840,400 1,861 1,906 2,512 4,122 6,871 9,929 13,19914,067 507 546 758 1,259 2,330 3,714 4,9537,313 519 351 440 661 1,196 1,827 2,319
273,968 9,683 10,593 15,215 25,197 43,887 69,671 99,722
144,164 4,913 6,082 8,895 13,905 23,316 36,208 50,8459,694 416 424 624 919 1,481 2,307 3,523
21,216 1,115 1,206 1,361 2,086 3,190 5,131 7,127140,030 6,527 6,705 8,791 13,179 21,326 34,884 48,618103,205 4,072 4,878 6,982 10,268 16,478 25,708 34,819
IdahoIllinoisIndiana
(Continued)
ConnecticutDelawareDistrict of ColumbiaFlorida
GeorgiaHawaii
AlabamaAlaskaArizonaArkansasCalifornia
Colorado
WisconsinWyoming
Outlying areasAmerican SamoaGuamNorthern Mariana Islands
TexasUtah
VermontVirginiaWashingtonWest Virginia
OregonPennsylvaniaRhode Island
South CarolinaSouth DakotaTennessee
New MexicoNew YorkNorth CarolinaNorth Dakota
OhioOklahoma
New Jersey
Table 27.Number, by sex, state or other area, and age, December 2016—Continued
State or area
Men (cont.)
Women
Puerto RicoU.S. Virgin Islands
Foreign countries
Unknown
74 ♦ Annual Statistical Report on the Social Security Disability Insurance Program, 2016
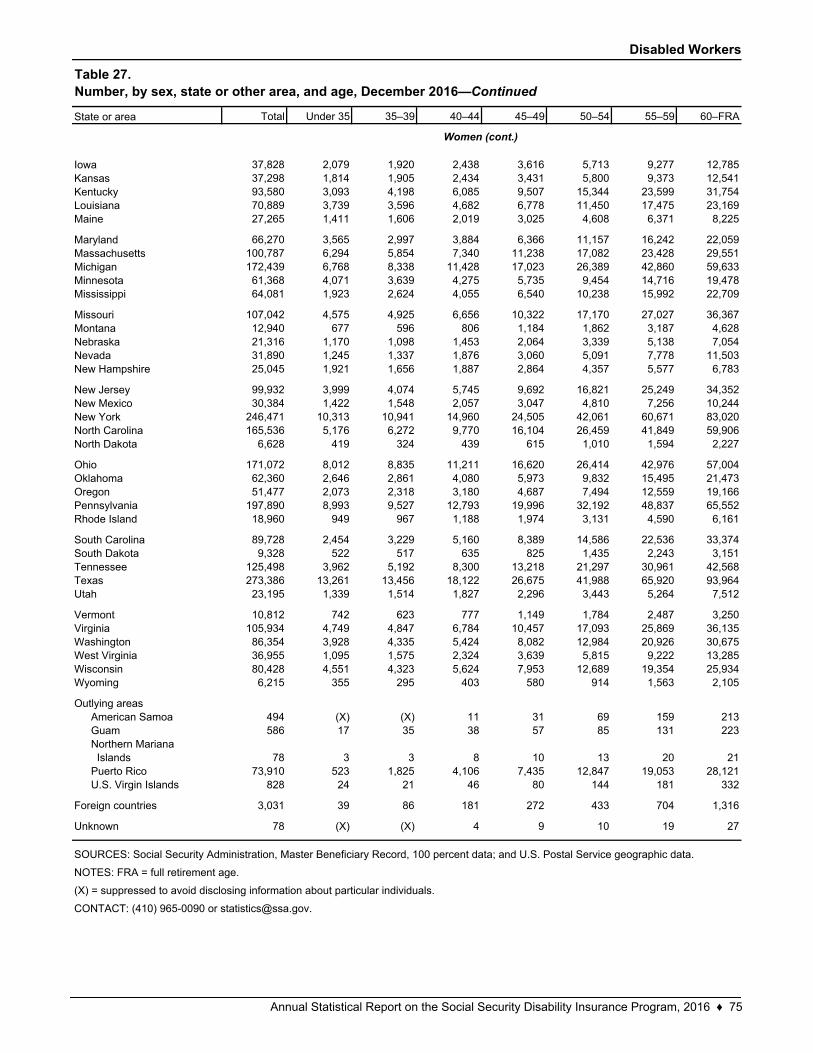
Disabled Workers
Total Under 35 35–39 40–44 45–49 50–54 55–59 60–FRA
37,828 2,079 1,920 2,438 3,616 5,713 9,277 12,78537,298 1,814 1,905 2,434 3,431 5,800 9,373 12,54193,580 3,093 4,198 6,085 9,507 15,344 23,599 31,75470,889 3,739 3,596 4,682 6,778 11,450 17,475 23,16927,265 1,411 1,606 2,019 3,025 4,608 6,371 8,225
66,270 3,565 2,997 3,884 6,366 11,157 16,242 22,059100,787 6,294 5,854 7,340 11,238 17,082 23,428 29,551172,439 6,768 8,338 11,428 17,023 26,389 42,860 59,63361,368 4,071 3,639 4,275 5,735 9,454 14,716 19,47864,081 1,923 2,624 4,055 6,540 10,238 15,992 22,709
107,042 4,575 4,925 6,656 10,322 17,170 27,027 36,36712,940 677 596 806 1,184 1,862 3,187 4,62821,316 1,170 1,098 1,453 2,064 3,339 5,138 7,05431,890 1,245 1,337 1,876 3,060 5,091 7,778 11,50325,045 1,921 1,656 1,887 2,864 4,357 5,577 6,783
99,932 3,999 4,074 5,745 9,692 16,821 25,249 34,35230,384 1,422 1,548 2,057 3,047 4,810 7,256 10,244
246,471 10,313 10,941 14,960 24,505 42,061 60,671 83,020165,536 5,176 6,272 9,770 16,104 26,459 41,849 59,906
6,628 419 324 439 615 1,010 1,594 2,227
171,072 8,012 8,835 11,211 16,620 26,414 42,976 57,00462,360 2,646 2,861 4,080 5,973 9,832 15,495 21,47351,477 2,073 2,318 3,180 4,687 7,494 12,559 19,166
197,890 8,993 9,527 12,793 19,996 32,192 48,837 65,55218,960 949 967 1,188 1,974 3,131 4,590 6,161
89,728 2,454 3,229 5,160 8,389 14,586 22,536 33,3749,328 522 517 635 825 1,435 2,243 3,151
125,498 3,962 5,192 8,300 13,218 21,297 30,961 42,568273,386 13,261 13,456 18,122 26,675 41,988 65,920 93,96423,195 1,339 1,514 1,827 2,296 3,443 5,264 7,512
10,812 742 623 777 1,149 1,784 2,487 3,250105,934 4,749 4,847 6,784 10,457 17,093 25,869 36,13586,354 3,928 4,335 5,424 8,082 12,984 20,926 30,67536,955 1,095 1,575 2,324 3,639 5,815 9,222 13,28580,428 4,551 4,323 5,624 7,953 12,689 19,354 25,9346,215 355 295 403 580 914 1,563 2,105
494 (X) (X) 11 31 69 159 213586 17 35 38 57 85 131 223
78 3 3 8 10 13 20 2173,910 523 1,825 4,106 7,435 12,847 19,053 28,121
828 24 21 46 80 144 181 332
3,031 39 86 181 272 433 704 1,316
78 (X) (X) 4 9 10 19 27
Northern Mariana IslandsPuerto RicoU.S. Virgin Islands
Foreign countries
Unknown
West VirginiaWisconsinWyoming
Outlying areasAmerican SamoaGuam
TennesseeTexasUtah
VermontVirginiaWashington
OklahomaOregonPennsylvaniaRhode Island
South CarolinaSouth Dakota
New JerseyNew MexicoNew YorkNorth CarolinaNorth Dakota
Ohio
Mississippi
MissouriMontanaNebraskaNevadaNew Hampshire
LouisianaMaine
MarylandMassachusettsMichiganMinnesota
IowaKansasKentucky
Table 27.Number, by sex, state or other area, and age, December 2016—Continued
State or area
Women (cont.)
CONTACT: (410) 965-0090 or [email protected].
SOURCES: Social Security Administration, Master Beneficiary Record, 100 percent data; and U.S. Postal Service geographic data.
NOTES: FRA = full retirement age.
(X) = suppressed to avoid disclosing information about particular individuals.
Annual Statistical Report on the Social Security Disability Insurance Program, 2016 ♦ 75
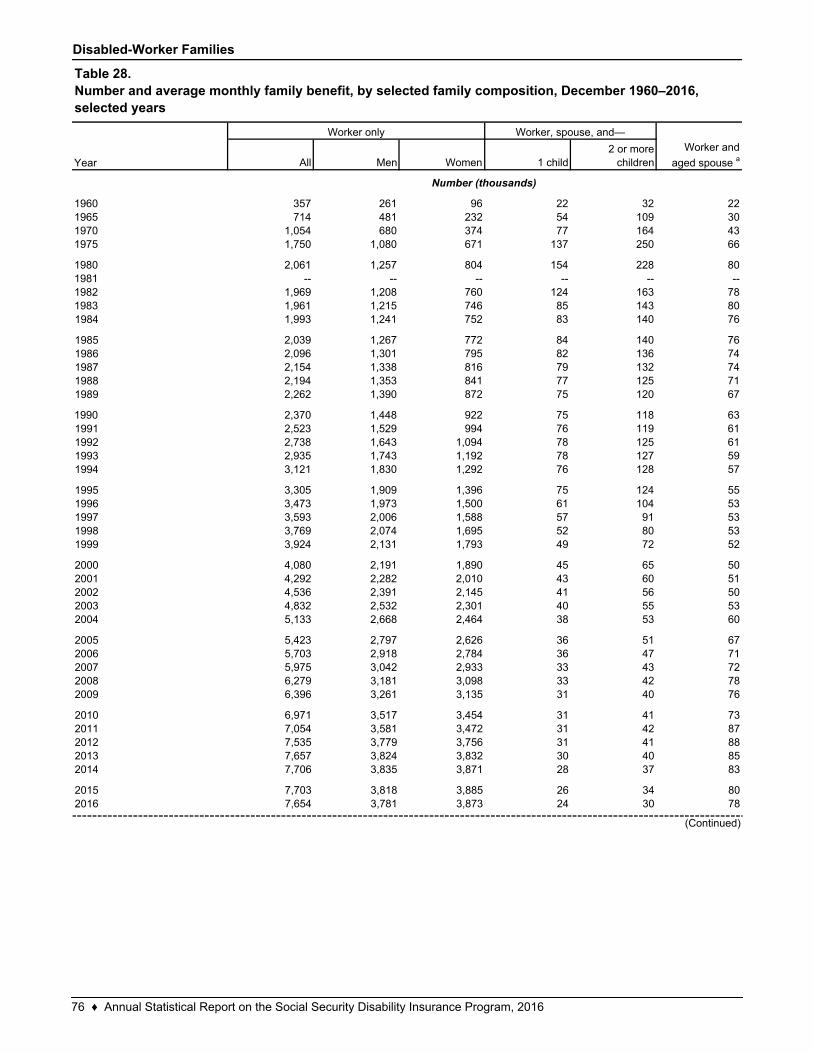
Disabled-Worker Families
All Men Women 1 child2 or more
children
357 261 96 22 32 22714 481 232 54 109 30
1,054 680 374 77 164 431,750 1,080 671 137 250 66
2,061 1,257 804 154 228 80-- -- -- -- -- --
1,969 1,208 760 124 163 781,961 1,215 746 85 143 801,993 1,241 752 83 140 76
2,039 1,267 772 84 140 762,096 1,301 795 82 136 742,154 1,338 816 79 132 742,194 1,353 841 77 125 712,262 1,390 872 75 120 67
2,370 1,448 922 75 118 632,523 1,529 994 76 119 612,738 1,643 1,094 78 125 612,935 1,743 1,192 78 127 593,121 1,830 1,292 76 128 57
3,305 1,909 1,396 75 124 553,473 1,973 1,500 61 104 533,593 2,006 1,588 57 91 533,769 2,074 1,695 52 80 533,924 2,131 1,793 49 72 52
4,080 2,191 1,890 45 65 504,292 2,282 2,010 43 60 514,536 2,391 2,145 41 56 504,832 2,532 2,301 40 55 535,133 2,668 2,464 38 53 60
5,423 2,797 2,626 36 51 675,703 2,918 2,784 36 47 715,975 3,042 2,933 33 43 726,279 3,181 3,098 33 42 786,396 3,261 3,135 31 40 76
6,971 3,517 3,454 31 41 737,054 3,581 3,472 31 42 877,535 3,779 3,756 31 41 887,657 3,824 3,832 30 40 857,706 3,835 3,871 28 37 83
7,703 3,818 3,885 26 34 807,654 3,781 3,873 24 30 78
201220132014
20152016
199619971998
2011
20002001200220032004
20052006200720082009
2010
1991199219931994
1995
1984
198519861987
(Continued)
1999
19881989
Table 28.Number and average monthly family benefit, by selected family composition, December 1960–2016, selected years
Worker only Worker, spouse, and—
Worker and
aged spouse a
1980198119821983
Number (thousands)
Year
1960196519701975
1990
76 ♦ Annual Statistical Report on the Social Security Disability Insurance Program, 2016
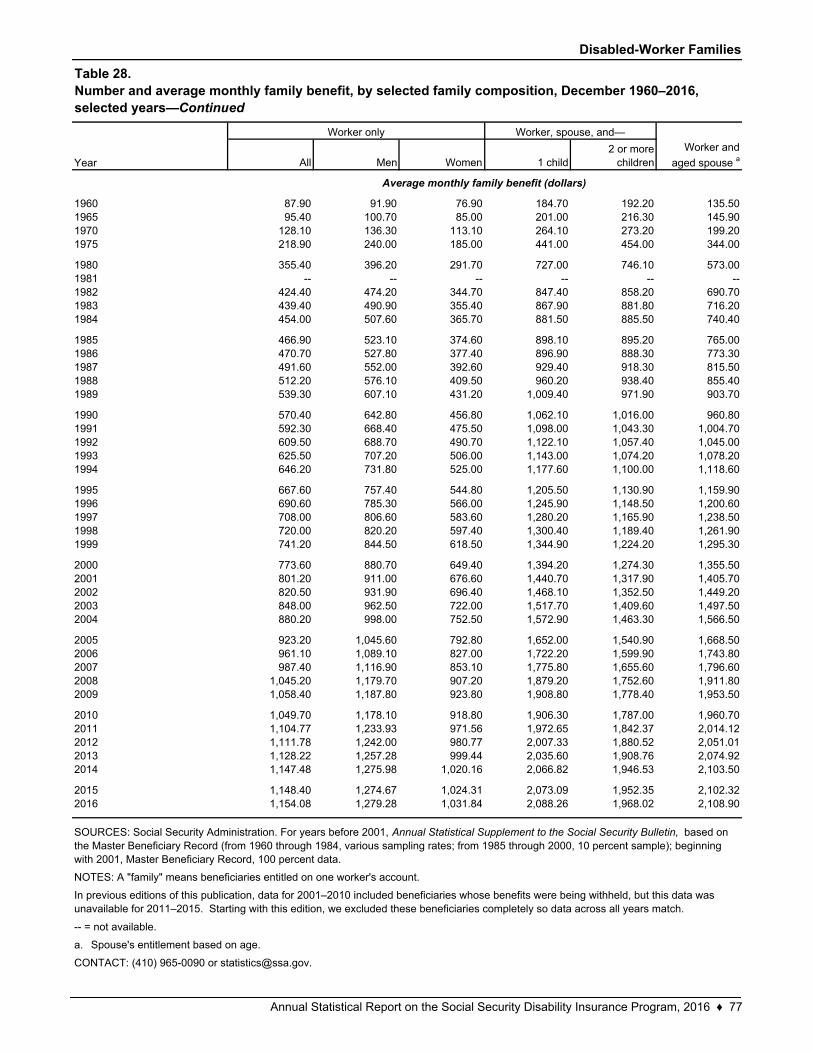
Disabled-Worker Families
All Men Women 1 child2 or more
children
87.90 91.90 76.90 184.70 192.20 135.5095.40 100.70 85.00 201.00 216.30 145.90
128.10 136.30 113.10 264.10 273.20 199.20218.90 240.00 185.00 441.00 454.00 344.00
355.40 396.20 291.70 727.00 746.10 573.00-- -- -- -- -- --
424.40 474.20 344.70 847.40 858.20 690.70439.40 490.90 355.40 867.90 881.80 716.20454.00 507.60 365.70 881.50 885.50 740.40
466.90 523.10 374.60 898.10 895.20 765.00470.70 527.80 377.40 896.90 888.30 773.30491.60 552.00 392.60 929.40 918.30 815.50512.20 576.10 409.50 960.20 938.40 855.40539.30 607.10 431.20 1,009.40 971.90 903.70
570.40 642.80 456.80 1,062.10 1,016.00 960.80592.30 668.40 475.50 1,098.00 1,043.30 1,004.70609.50 688.70 490.70 1,122.10 1,057.40 1,045.00625.50 707.20 506.00 1,143.00 1,074.20 1,078.20646.20 731.80 525.00 1,177.60 1,100.00 1,118.60
667.60 757.40 544.80 1,205.50 1,130.90 1,159.90690.60 785.30 566.00 1,245.90 1,148.50 1,200.60708.00 806.60 583.60 1,280.20 1,165.90 1,238.50720.00 820.20 597.40 1,300.40 1,189.40 1,261.90741.20 844.50 618.50 1,344.90 1,224.20 1,295.30
773.60 880.70 649.40 1,394.20 1,274.30 1,355.50801.20 911.00 676.60 1,440.70 1,317.90 1,405.70820.50 931.90 696.40 1,468.10 1,352.50 1,449.20848.00 962.50 722.00 1,517.70 1,409.60 1,497.50880.20 998.00 752.50 1,572.90 1,463.30 1,566.50
923.20 1,045.60 792.80 1,652.00 1,540.90 1,668.50961.10 1,089.10 827.00 1,722.20 1,599.90 1,743.80987.40 1,116.90 853.10 1,775.80 1,655.60 1,796.60
1,045.20 1,179.70 907.20 1,879.20 1,752.60 1,911.801,058.40 1,187.80 923.80 1,908.80 1,778.40 1,953.50
1,049.70 1,178.10 918.80 1,906.30 1,787.00 1,960.701,104.77 1,233.93 971.56 1,972.65 1,842.37 2,014.121,111.78 1,242.00 980.77 2,007.33 1,880.52 2,051.011,128.22 1,257.28 999.44 2,035.60 1,908.76 2,074.921,147.48 1,275.98 1,020.16 2,066.82 1,946.53 2,103.50
1,148.40 1,274.67 1,024.31 2,073.09 1,952.35 2,102.321,154.08 1,279.28 1,031.84 2,088.26 1,968.02 2,108.90
a.
Average monthly family benefit (dollars)
SOURCES: Social Security Administration. For years before 2001, Annual Statistical Supplement to the Social Security Bulletin, based on the Master Beneficiary Record (from 1960 through 1984, various sampling rates; from 1985 through 2000, 10 percent sample); beginning with 2001, Master Beneficiary Record, 100 percent data.
NOTES: A "family" means beneficiaries entitled on one worker's account.
-- = not available.
Table 28.Number and average monthly family benefit, by selected family composition, December 1960–2016, selected years—Continued
Year
Worker only Worker, spouse, and—
Worker and
aged spouse a
1982
1960196519701975
19801981
1994
19831984
19851986198719881989
1990199119921993
2006
19951996199719981999
20002001200220032004
2005
2012
CONTACT: (410) 965-0090 or [email protected].
20132014
20152016
Spouse's entitlement based on age.
In previous editions of this publication, data for 2001–2010 included beneficiaries whose benefits were being withheld, but this data was unavailable for 2011–2015. Starting with this edition, we excluded these beneficiaries completely so data across all years match.
200720082009
20102011
Annual Statistical Report on the Social Security Disability Insurance Program, 2016 ♦ 77
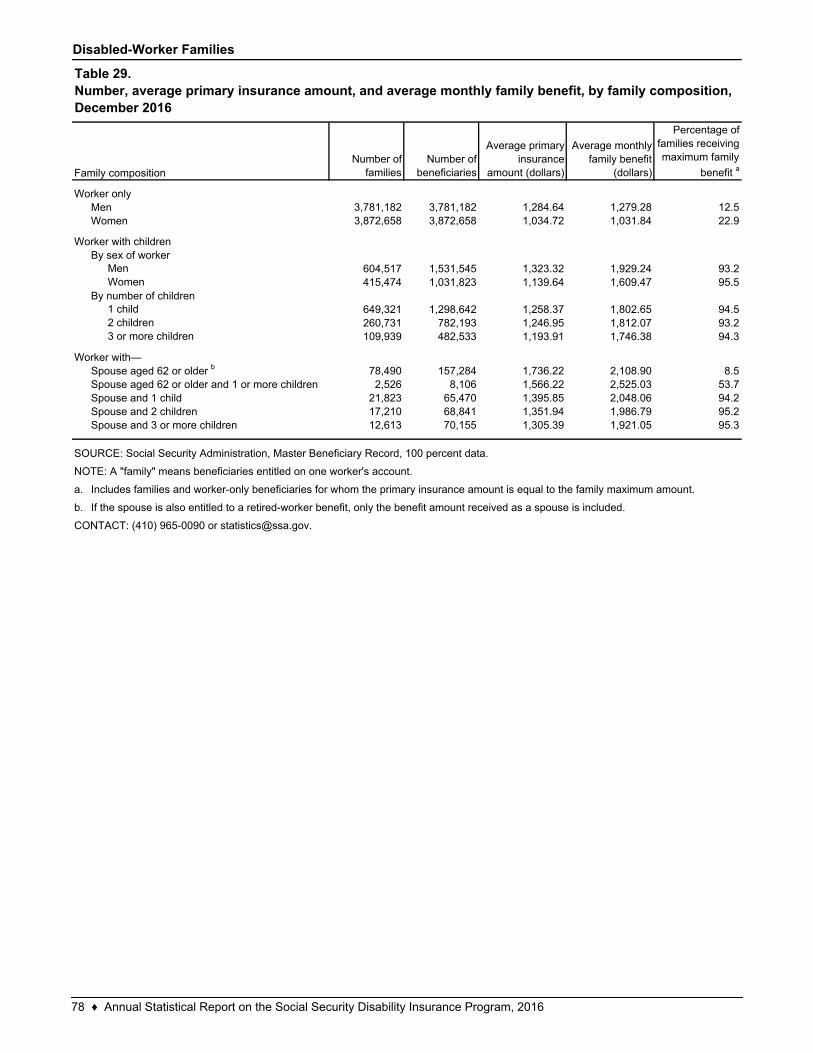
Disabled-Worker Families
Number of families
Number of beneficiaries
Average primary insurance
amount (dollars)
Average monthly family benefit
(dollars)
Percentage of families receiving maximum family
benefit a
3,781,182 3,781,182 1,284.64 1,279.28 12.53,872,658 3,872,658 1,034.72 1,031.84 22.9
Men 604,517 1,531,545 1,323.32 1,929.24 93.2Women 415,474 1,031,823 1,139.64 1,609.47 95.5
1 child 649,321 1,298,642 1,258.37 1,802.65 94.52 children 260,731 782,193 1,246.95 1,812.07 93.23 or more children 109,939 482,533 1,193.91 1,746.38 94.3
78,490 157,284 1,736.22 2,108.90 8.52,526 8,106 1,566.22 2,525.03 53.7
21,823 65,470 1,395.85 2,048.06 94.217,210 68,841 1,351.94 1,986.79 95.212,613 70,155 1,305.39 1,921.05 95.3
a.
b. If the spouse is also entitled to a retired-worker benefit, only the benefit amount received as a spouse is included.
CONTACT: (410) 965-0090 or [email protected].
Family composition
Worker onlyMenWomen
Worker with childrenBy sex of worker
By number of children
Worker with—Spouse aged 62 or older b
SOURCE: Social Security Administration, Master Beneficiary Record, 100 percent data.
NOTE: A "family" means beneficiaries entitled on one worker's account.
Spouse aged 62 or older and 1 or more childrenSpouse and 1 childSpouse and 2 childrenSpouse and 3 or more children
Table 29.Number, average primary insurance amount, and average monthly family benefit, by family composition, December 2016
Includes families and worker-only beneficiaries for whom the primary insurance amount is equal to the family maximum amount.
78 ♦ Annual Statistical Report on the Social Security Disability Insurance Program, 2016
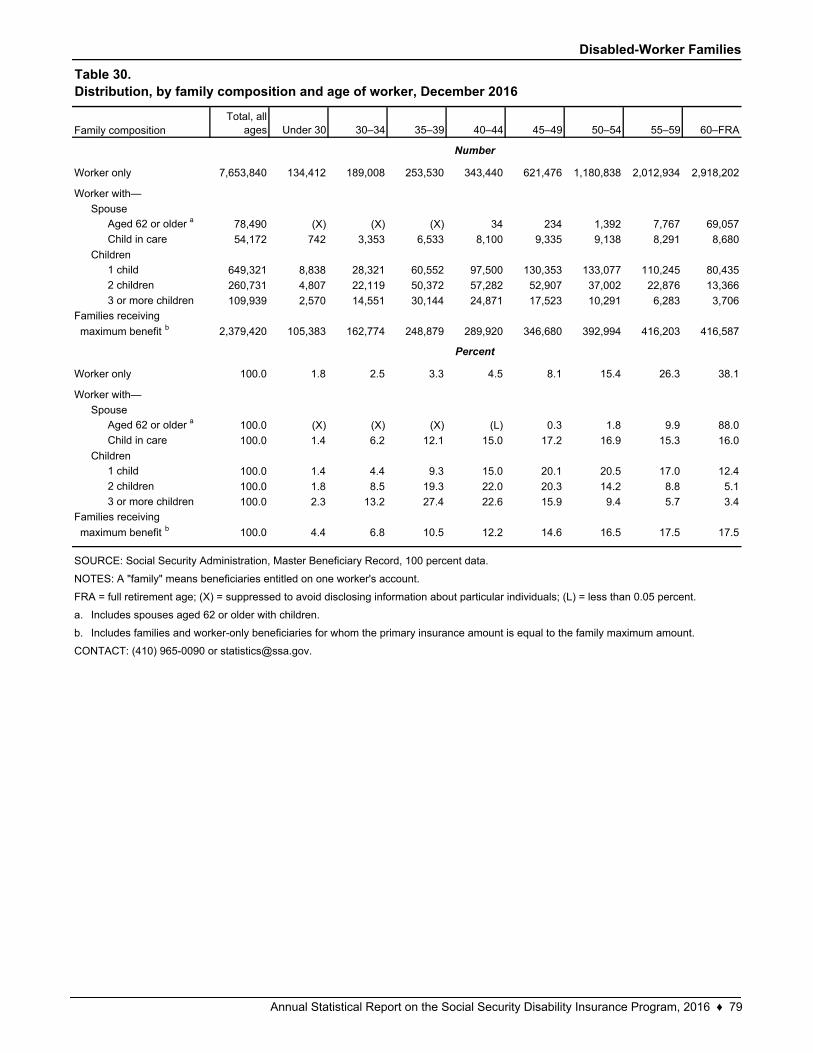
Disabled-Worker Families
Total, all ages Under 30 30–34 35–39 40–44 45–49 50–54 55–59 60–FRA
7,653,840 134,412 189,008 253,530 343,440 621,476 1,180,838 2,012,934 2,918,202
Aged 62 or older a 78,490 (X) (X) (X) 34 234 1,392 7,767 69,057
Child in care 54,172 742 3,353 6,533 8,100 9,335 9,138 8,291 8,680
1 child 649,321 8,838 28,321 60,552 97,500 130,353 133,077 110,245 80,435
2 children 260,731 4,807 22,119 50,372 57,282 52,907 37,002 22,876 13,366
3 or more children 109,939 2,570 14,551 30,144 24,871 17,523 10,291 6,283 3,706
2,379,420 105,383 162,774 248,879 289,920 346,680 392,994 416,203 416,587
100.0 1.8 2.5 3.3 4.5 8.1 15.4 26.3 38.1
Aged 62 or older a 100.0 (X) (X) (X) (L) 0.3 1.8 9.9 88.0
Child in care 100.0 1.4 6.2 12.1 15.0 17.2 16.9 15.3 16.0
1 child 100.0 1.4 4.4 9.3 15.0 20.1 20.5 17.0 12.4
2 children 100.0 1.8 8.5 19.3 22.0 20.3 14.2 8.8 5.1
3 or more children 100.0 2.3 13.2 27.4 22.6 15.9 9.4 5.7 3.4
100.0 4.4 6.8 10.5 12.2 14.6 16.5 17.5 17.5
a.
b.
Includes spouses aged 62 or older with children.
Includes families and worker-only beneficiaries for whom the primary insurance amount is equal to the family maximum amount.
NOTES: A "family" means beneficiaries entitled on one worker's account.
FRA = full retirement age; (X) = suppressed to avoid disclosing information about particular individuals; (L) = less than 0.05 percent.
CONTACT: (410) 965-0090 or [email protected].
Table 30.Distribution, by family composition and age of worker, December 2016
Number
Percent
SOURCE: Social Security Administration, Master Beneficiary Record, 100 percent data.
Families receiving
maximum benefit b
Worker only
Worker with—
Spouse
Family composition
Worker only
Worker with—
Spouse
Children
Children
Families receiving
maximum benefit b
Annual Statistical Report on the Social Security Disability Insurance Program, 2016 ♦ 79

Beneficiaries Who Have Filed for Workers’ Compensation
or Public Disability Benefits
82 ♦ Annual Statistical Report on the Social Security Disability Insurance Program, 2016
Notes
In December 2016, approximately 490,000 disabled workers on the Social Security Disability Insurance program had filed for workers’ compensation or public disability benefits. Disability payments from private sources, such as private pension or insurance benefits, do not affect Social Security disability benefits, but workers’ compensa-tion and other public disability benefits may reduce them. Workers’ compensation is paid to a worker because of a job-related injury or illness. It may be paid by federal or state workers’ compensation agencies or employers or by insurance companies on behalf of employers.
Other public disability benefits that may affect Social Security disability benefits are those paid by a federal, state, or local government for disabling medical conditions that are not job related. Examples are civil service disability benefits, military disability benefits, state temporary disability benefits, and state or local government retirement benefits that are based on disability. Persons who receive Social Security disability benefits and one of the following types of public benefits will not have their Social Security disability benefit reduced:
• Veterans Administration benefits;
• State and local government benefits, if Social Security taxes were deducted from earnings; or
• Supplemental Security Income.
The total amount received from workers’ compensation or other public disability benefits and Social Security disability benefits cannot exceed 80 percent of the worker’s average current earnings before he or she became disabled. The monthly Social Security disability benefit includes benefits payable to family members. If the total amount of these benefits exceeds 80 percent of average current earnings, the excess amount is deducted from the Social Security benefit. The benefit will be reduced until the month the worker reaches age 65 or the month the other benefits stop, whichever comes first.
Example
Before becoming disabled, the worker’s average current earnings were $4,000 a month. The disabled worker, his or her spouse, and their two children would be eligible to receive a total of $2,200 a month in Social Security disability benefits. However, the disabled worker also receives $2,000 a month from workers’ compensation. Because the total amount of benefits received ($4,200) is more than $3,200 (80 percent of average current earnings), the family’s Social Security disability benefits will be reduced by $1,000.
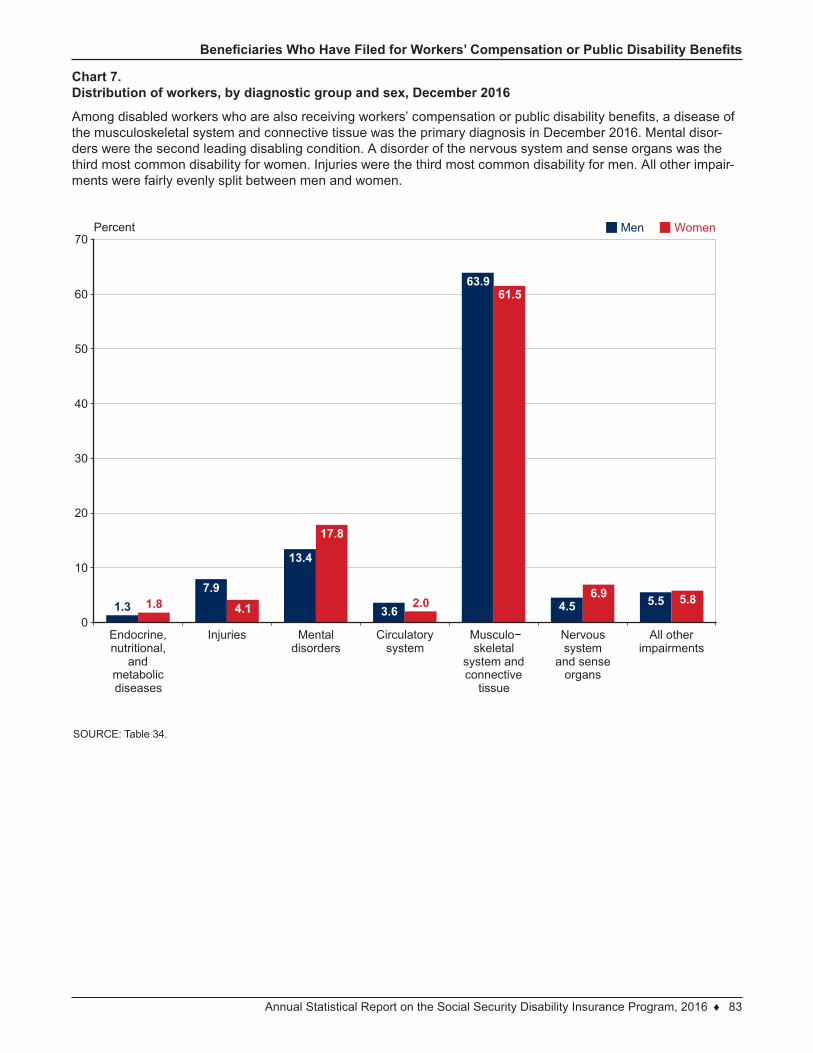
Annual Statistical Report on the Social Security Disability Insurance Program, 2016 ♦ 83
Beneficiaries Who Have Filed for Workers’ Compensation or Public Disability Benefits
Chart 7.Distribution of workers, by diagnostic group and sex, December 2016
Among disabled workers who are also receiving workers’ compensation or public disability benefits, a disease of the musculoskeletal system and connective tissue was the primary diagnosis in December 2016. Mental disor-ders were the second leading disabling condition. A disorder of the nervous system and sense organs was the third most common disability for women. Injuries were the third most common disability for men. All other impair-ments were fairly evenly split between men and women.
SOURCE: Table 34.
1.3 1.87.9
4.1
13.4
17.8
3.62.0
63.961.5
4.56.9 5.5 5.8
0
10
20
30
40
50
60
70Percent
Endocrine,nutritional,
andmetabolicdiseases
Injuries Mentaldisorders
Circulatorysystem
Musculo−skeletal
system andconnective
tissue
Nervoussystem
and senseorgans
All otherimpairments
Men Women
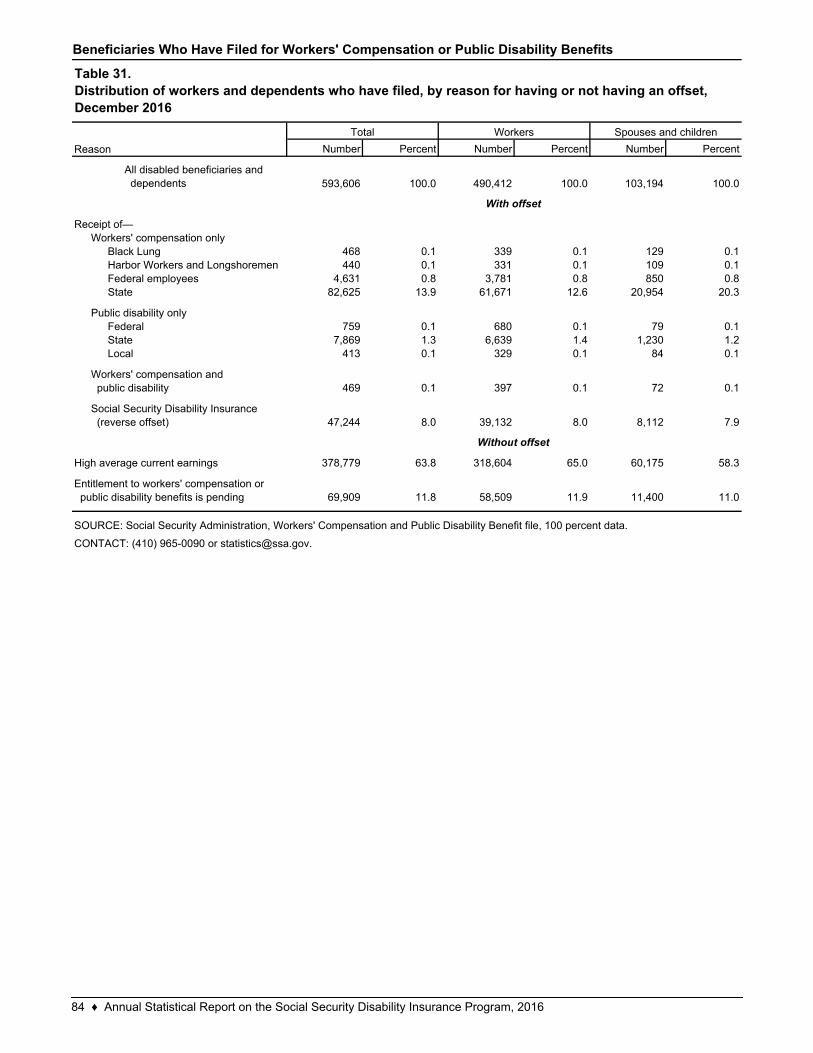
Beneficiaries Who Have Filed for Workers' Compensation or Public Disability Benefits
Number Percent Number Percent Number Percent
All disabled beneficiaries and dependents 593,606 100.0 490,412 100.0 103,194 100.0
468 0.1 339 0.1 129 0.1440 0.1 331 0.1 109 0.1
4,631 0.8 3,781 0.8 850 0.882,625 13.9 61,671 12.6 20,954 20.3
759 0.1 680 0.1 79 0.17,869 1.3 6,639 1.4 1,230 1.2
413 0.1 329 0.1 84 0.1
469 0.1 397 0.1 72 0.1
47,244 8.0 39,132 8.0 8,112 7.9
378,779 63.8 318,604 65.0 60,175 58.3
69,909 11.8 58,509 11.9 11,400 11.0
Table 31.Distribution of workers and dependents who have filed, by reason for having or not having an offset, December 2016
Total Workers Spouses and children
Public disability only
CONTACT: (410) 965-0090 or [email protected].
Reason
Receipt of—Workers' compensation only
Black LungHarbor Workers and LongshoremenFederal employeesState
StateLocal
Workers' compensation and public disability
Social Security Disability Insurance (reverse offset)
Federal
With offset
Without offset
SOURCE: Social Security Administration, Workers' Compensation and Public Disability Benefit file, 100 percent data.
High average current earnings
Entitlement to workers' compensation or public disability benefits is pending
84 ♦ Annual Statistical Report on the Social Security Disability Insurance Program, 2016
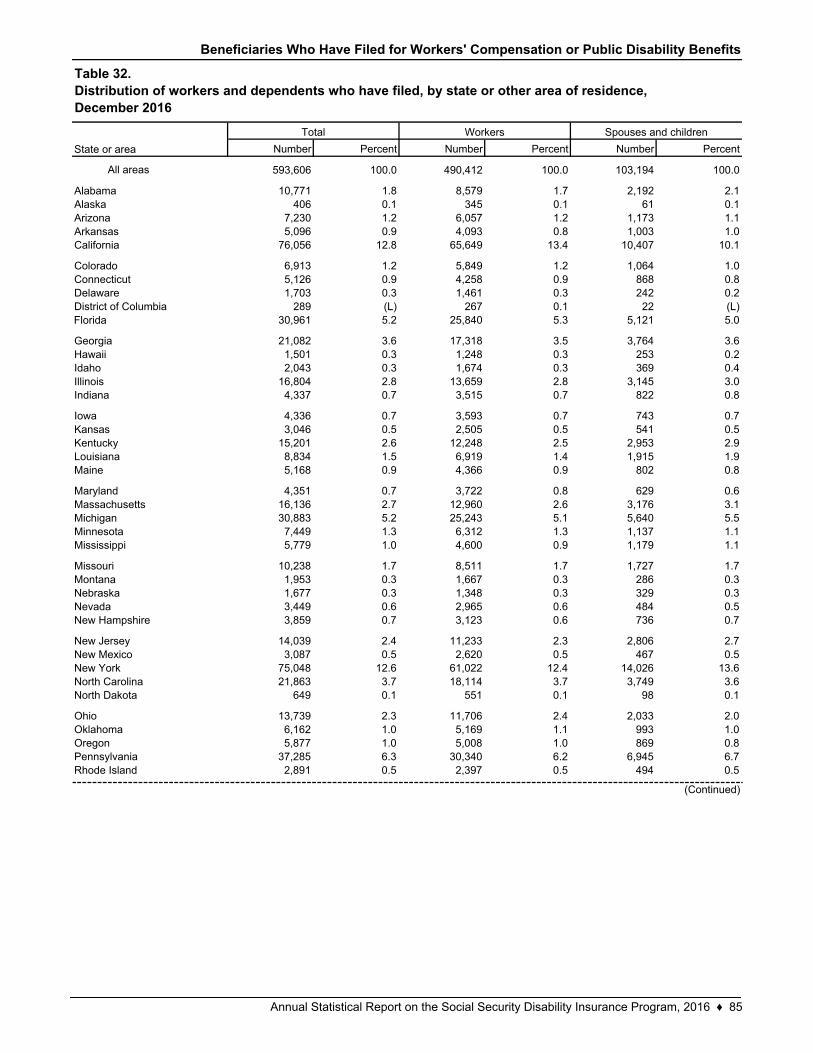
Beneficiaries Who Have Filed for Workers' Compensation or Public Disability Benefits
Number Percent Number Percent Number Percent
All areas 593,606 100.0 490,412 100.0 103,194 100.0
10,771 1.8 8,579 1.7 2,192 2.1406 0.1 345 0.1 61 0.1
7,230 1.2 6,057 1.2 1,173 1.15,096 0.9 4,093 0.8 1,003 1.0
76,056 12.8 65,649 13.4 10,407 10.1
6,913 1.2 5,849 1.2 1,064 1.05,126 0.9 4,258 0.9 868 0.81,703 0.3 1,461 0.3 242 0.2
289 (L) 267 0.1 22 (L)30,961 5.2 25,840 5.3 5,121 5.0
21,082 3.6 17,318 3.5 3,764 3.61,501 0.3 1,248 0.3 253 0.22,043 0.3 1,674 0.3 369 0.4
16,804 2.8 13,659 2.8 3,145 3.04,337 0.7 3,515 0.7 822 0.8
4,336 0.7 3,593 0.7 743 0.73,046 0.5 2,505 0.5 541 0.5
15,201 2.6 12,248 2.5 2,953 2.98,834 1.5 6,919 1.4 1,915 1.95,168 0.9 4,366 0.9 802 0.8
4,351 0.7 3,722 0.8 629 0.616,136 2.7 12,960 2.6 3,176 3.130,883 5.2 25,243 5.1 5,640 5.57,449 1.3 6,312 1.3 1,137 1.15,779 1.0 4,600 0.9 1,179 1.1
10,238 1.7 8,511 1.7 1,727 1.71,953 0.3 1,667 0.3 286 0.31,677 0.3 1,348 0.3 329 0.33,449 0.6 2,965 0.6 484 0.53,859 0.7 3,123 0.6 736 0.7
14,039 2.4 11,233 2.3 2,806 2.73,087 0.5 2,620 0.5 467 0.5
75,048 12.6 61,022 12.4 14,026 13.621,863 3.7 18,114 3.7 3,749 3.6
649 0.1 551 0.1 98 0.1
13,739 2.3 11,706 2.4 2,033 2.06,162 1.0 5,169 1.1 993 1.05,877 1.0 5,008 1.0 869 0.8
37,285 6.3 30,340 6.2 6,945 6.72,891 0.5 2,397 0.5 494 0.5
Florida
Table 32.Distribution of workers and dependents who have filed, by state or other area of residence, December 2016
Total Workers Spouses and children
State or area
AlabamaAlaskaArizonaArkansasCalifornia
ColoradoConnecticutDelawareDistrict of Columbia
Georgia
Minnesota
IdahoIllinoisIndiana
IowaKansasKentuckyLouisianaMaine
Hawaii
OklahomaOregonPennsylvaniaRhode Island
MarylandMassachusettsMichigan
Ohio
Mississippi
MissouriMontanaNebraskaNevadaNew Hampshire
New JerseyNew MexicoNew YorkNorth CarolinaNorth Dakota
(Continued)
Annual Statistical Report on the Social Security Disability Insurance Program, 2016 ♦ 85
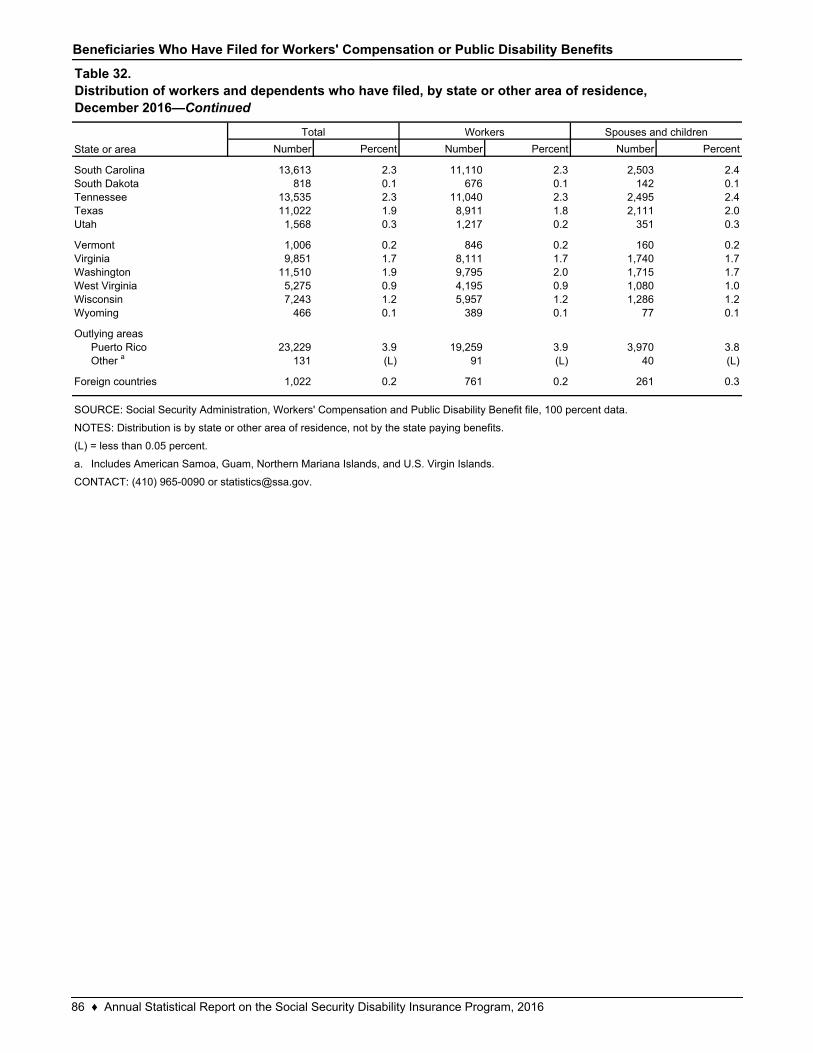
Beneficiaries Who Have Filed for Workers' Compensation or Public Disability Benefits
Number Percent Number Percent Number Percent
13,613 2.3 11,110 2.3 2,503 2.4818 0.1 676 0.1 142 0.1
13,535 2.3 11,040 2.3 2,495 2.411,022 1.9 8,911 1.8 2,111 2.01,568 0.3 1,217 0.2 351 0.3
1,006 0.2 846 0.2 160 0.29,851 1.7 8,111 1.7 1,740 1.7
11,510 1.9 9,795 2.0 1,715 1.75,275 0.9 4,195 0.9 1,080 1.07,243 1.2 5,957 1.2 1,286 1.2
466 0.1 389 0.1 77 0.1
23,229 3.9 19,259 3.9 3,970 3.8131 (L) 91 (L) 40 (L)
1,022 0.2 761 0.2 261 0.3
a.
West Virginia
South CarolinaSouth Dakota
Table 32.Distribution of workers and dependents who have filed, by state or other area of residence, December 2016—Continued
State or area
Total Workers Spouses and children
Washington
TennesseeTexasUtah
VermontVirginia
WisconsinWyoming
Outlying areasPuerto RicoOther a
NOTES: Distribution is by state or other area of residence, not by the state paying benefits.
(L) = less than 0.05 percent.
CONTACT: (410) 965-0090 or [email protected].
Foreign countries
Includes American Samoa, Guam, Northern Mariana Islands, and U.S. Virgin Islands.
SOURCE: Social Security Administration, Workers' Compensation and Public Disability Benefit file, 100 percent data.
86 ♦ Annual Statistical Report on the Social Security Disability Insurance Program, 2016
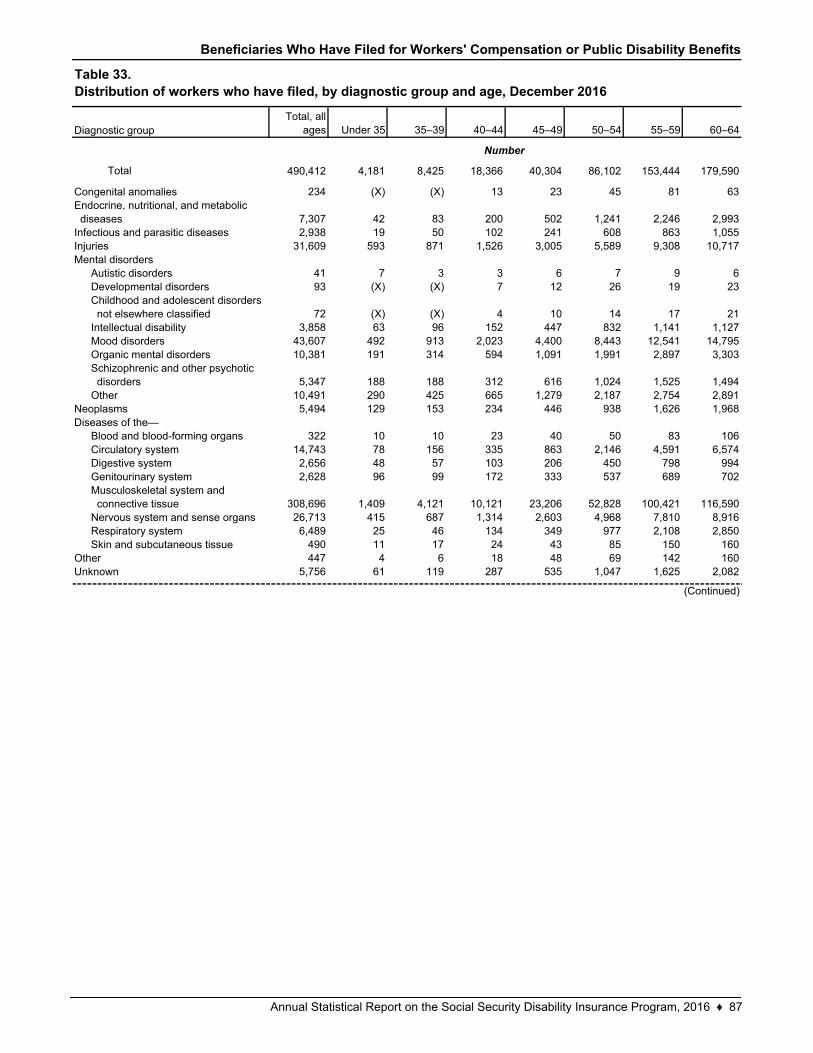
Beneficiaries Who Have Filed for Workers' Compensation or Public Disability Benefits
Total, all ages Under 35 35–39 40–44 45–49 50–54 55–59 60–64
Total 490,412 4,181 8,425 18,366 40,304 86,102 153,444 179,590
234 (X) (X) 13 23 45 81 63
7,307 42 83 200 502 1,241 2,246 2,9932,938 19 50 102 241 608 863 1,055
31,609 593 871 1,526 3,005 5,589 9,308 10,717
41 7 3 3 6 7 9 693 (X) (X) 7 12 26 19 23
72 (X) (X) 4 10 14 17 213,858 63 96 152 447 832 1,141 1,127
43,607 492 913 2,023 4,400 8,443 12,541 14,79510,381 191 314 594 1,091 1,991 2,897 3,303
5,347 188 188 312 616 1,024 1,525 1,49410,491 290 425 665 1,279 2,187 2,754 2,8915,494 129 153 234 446 938 1,626 1,968
322 10 10 23 40 50 83 10614,743 78 156 335 863 2,146 4,591 6,5742,656 48 57 103 206 450 798 9942,628 96 99 172 333 537 689 702
308,696 1,409 4,121 10,121 23,206 52,828 100,421 116,59026,713 415 687 1,314 2,603 4,968 7,810 8,9166,489 25 46 134 349 977 2,108 2,850
490 11 17 24 43 85 150 160447 4 6 18 48 69 142 160
5,756 61 119 287 535 1,047 1,625 2,082
Congenital anomaliesEndocrine, nutritional, and metabolic diseases
Table 33.Distribution of workers who have filed, by diagnostic group and age, December 2016
Number
Diagnostic group
(Continued)
Autistic disorders
Infectious and parasitic diseasesInjuriesMental disorders
Digestive system
Developmental disordersChildhood and adolescent disorders not elsewhere classifiedIntellectual disabilityMood disordersOrganic mental disordersSchizophrenic and other psychotic disordersOther
NeoplasmsDiseases of the—
Blood and blood-forming organsCirculatory system
Genitourinary systemMusculoskeletal system and connective tissueNervous system and sense organsRespiratory systemSkin and subcutaneous tissue
OtherUnknown
Annual Statistical Report on the Social Security Disability Insurance Program, 2016 ♦ 87
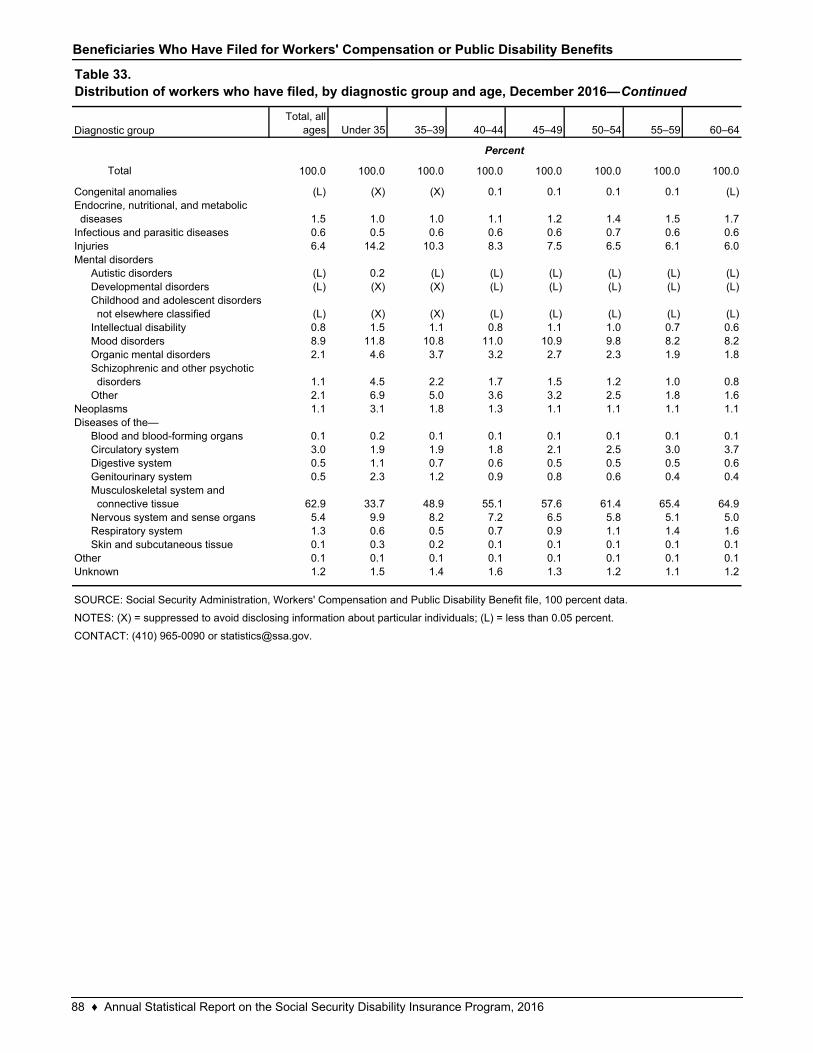
Beneficiaries Who Have Filed for Workers' Compensation or Public Disability Benefits
Total, all ages Under 35 35–39 40–44 45–49 50–54 55–59 60–64
Total 100.0 100.0 100.0 100.0 100.0 100.0 100.0 100.0
(L) (X) (X) 0.1 0.1 0.1 0.1 (L)
1.5 1.0 1.0 1.1 1.2 1.4 1.5 1.70.6 0.5 0.6 0.6 0.6 0.7 0.6 0.66.4 14.2 10.3 8.3 7.5 6.5 6.1 6.0
(L) 0.2 (L) (L) (L) (L) (L) (L)(L) (X) (X) (L) (L) (L) (L) (L)
(L) (X) (X) (L) (L) (L) (L) (L)0.8 1.5 1.1 0.8 1.1 1.0 0.7 0.68.9 11.8 10.8 11.0 10.9 9.8 8.2 8.22.1 4.6 3.7 3.2 2.7 2.3 1.9 1.8
1.1 4.5 2.2 1.7 1.5 1.2 1.0 0.82.1 6.9 5.0 3.6 3.2 2.5 1.8 1.61.1 3.1 1.8 1.3 1.1 1.1 1.1 1.1
0.1 0.2 0.1 0.1 0.1 0.1 0.1 0.13.0 1.9 1.9 1.8 2.1 2.5 3.0 3.70.5 1.1 0.7 0.6 0.5 0.5 0.5 0.60.5 2.3 1.2 0.9 0.8 0.6 0.4 0.4
62.9 33.7 48.9 55.1 57.6 61.4 65.4 64.95.4 9.9 8.2 7.2 6.5 5.8 5.1 5.01.3 0.6 0.5 0.7 0.9 1.1 1.4 1.60.1 0.3 0.2 0.1 0.1 0.1 0.1 0.10.1 0.1 0.1 0.1 0.1 0.1 0.1 0.11.2 1.5 1.4 1.6 1.3 1.2 1.1 1.2
Percent
Table 33.Distribution of workers who have filed, by diagnostic group and age, December 2016—Continued
Diagnostic group
SOURCE: Social Security Administration, Workers' Compensation and Public Disability Benefit file, 100 percent data.
NOTES: (X) = suppressed to avoid disclosing information about particular individuals; (L) = less than 0.05 percent.
CONTACT: (410) 965-0090 or [email protected].
Autistic disordersDevelopmental disordersChildhood and adolescent disorders not elsewhere classifiedIntellectual disability
Digestive systemGenitourinary systemMusculoskeletal system and connective tissue
Infectious and parasitic diseases
Congenital anomaliesEndocrine, nutritional, and metabolic diseases
Respiratory systemSkin and subcutaneous tissue
OtherUnknown
Injuries
Nervous system and sense organs
Mood disordersOrganic mental disordersSchizophrenic and other psychotic disordersOther
NeoplasmsDiseases of the—
Blood and blood-forming organsCirculatory system
Mental disorders
88 ♦ Annual Statistical Report on the Social Security Disability Insurance Program, 2016
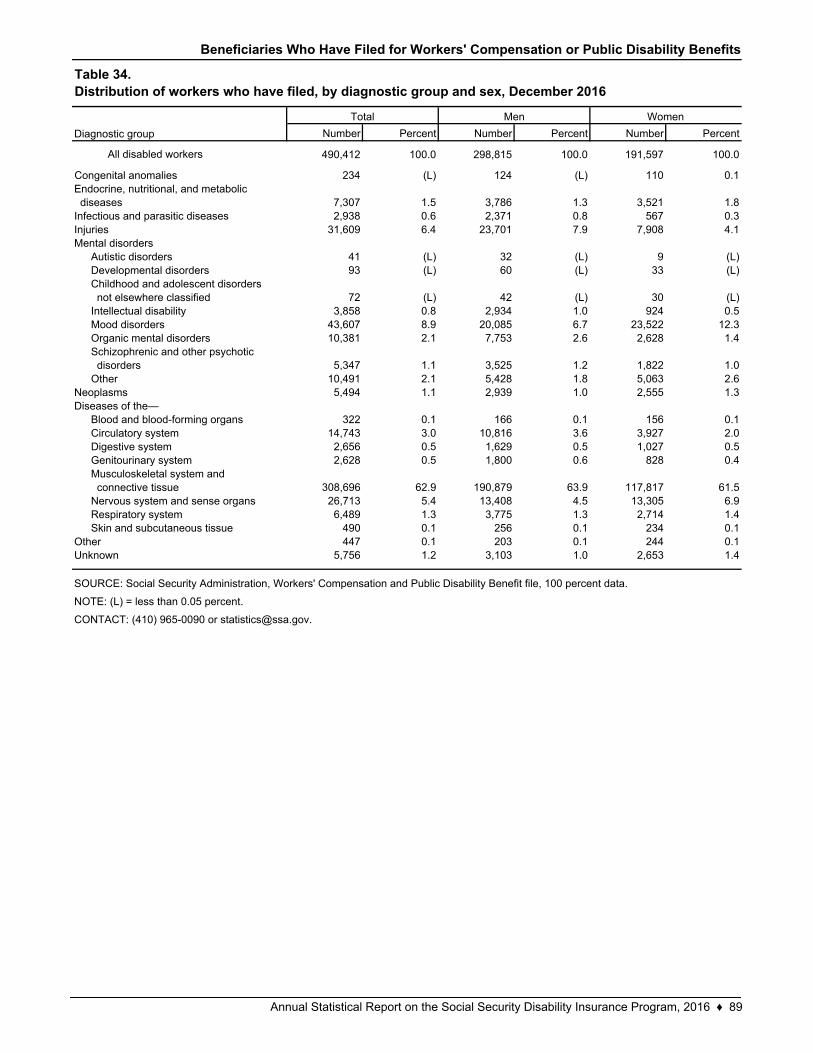
Beneficiaries Who Have Filed for Workers' Compensation or Public Disability Benefits
Number Percent Number Percent Number Percent
All disabled workers 490,412 100.0 298,815 100.0 191,597 100.0
234 (L) 124 (L) 110 0.1
7,307 1.5 3,786 1.3 3,521 1.82,938 0.6 2,371 0.8 567 0.3
31,609 6.4 23,701 7.9 7,908 4.1
41 (L) 32 (L) 9 (L)93 (L) 60 (L) 33 (L)
72 (L) 42 (L) 30 (L)3,858 0.8 2,934 1.0 924 0.5
43,607 8.9 20,085 6.7 23,522 12.310,381 2.1 7,753 2.6 2,628 1.4
5,347 1.1 3,525 1.2 1,822 1.010,491 2.1 5,428 1.8 5,063 2.65,494 1.1 2,939 1.0 2,555 1.3
322 0.1 166 0.1 156 0.114,743 3.0 10,816 3.6 3,927 2.02,656 0.5 1,629 0.5 1,027 0.52,628 0.5 1,800 0.6 828 0.4
308,696 62.9 190,879 63.9 117,817 61.526,713 5.4 13,408 4.5 13,305 6.96,489 1.3 3,775 1.3 2,714 1.4
490 0.1 256 0.1 234 0.1447 0.1 203 0.1 244 0.1
5,756 1.2 3,103 1.0 2,653 1.4
Congenital anomalies
Table 34.Distribution of workers who have filed, by diagnostic group and sex, December 2016
Total Men Women
Diagnostic group
Skin and subcutaneous tissue
Endocrine, nutritional, and metabolic diseasesInfectious and parasitic diseasesInjuries
Blood and blood-forming organs
Mental disordersAutistic disordersDevelopmental disordersChildhood and adolescent disorders not elsewhere classifiedIntellectual disabilityMood disorders
Respiratory system
Organic mental disordersSchizophrenic and other psychotic disordersOther
NeoplasmsDiseases of the—
Circulatory systemDigestive systemGenitourinary systemMusculoskeletal system and connective tissueNervous system and sense organs
SOURCE: Social Security Administration, Workers' Compensation and Public Disability Benefit file, 100 percent data.
NOTE: (L) = less than 0.05 percent.
CONTACT: (410) 965-0090 or [email protected].
OtherUnknown
Annual Statistical Report on the Social Security Disability Insurance Program, 2016 ♦ 89


Benefits Awarded, Withheld, and Terminated

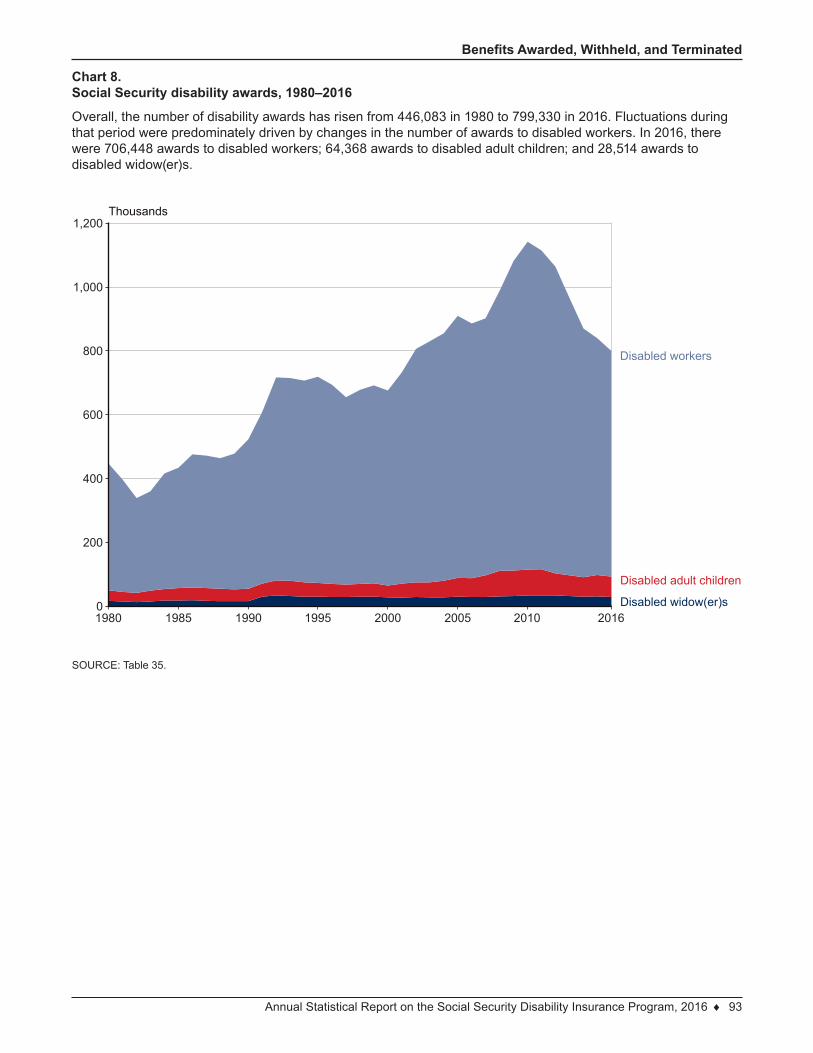
Annual Statistical Report on the Social Security Disability Insurance Program, 2016 ♦ 93
Benefits Awarded, Withheld, and Terminated
Chart 8.Social Security disability awards, 1980–2016
Overall, the number of disability awards has risen from 446,083 in 1980 to 799,330 in 2016. Fluctuations during that period were predominately driven by changes in the number of awards to disabled workers. In 2016, there were 706,448 awards to disabled workers; 64,368 awards to disabled adult children; and 28,514 awards to disabled widow(er)s.
SOURCE: Table 35.
1980 1985 1990 1995 2000 2005 2010 20160
200
400
600
800
1,000
1,200Thousands
Disabled widow(er)s
Disabled adult children
Disabled workers
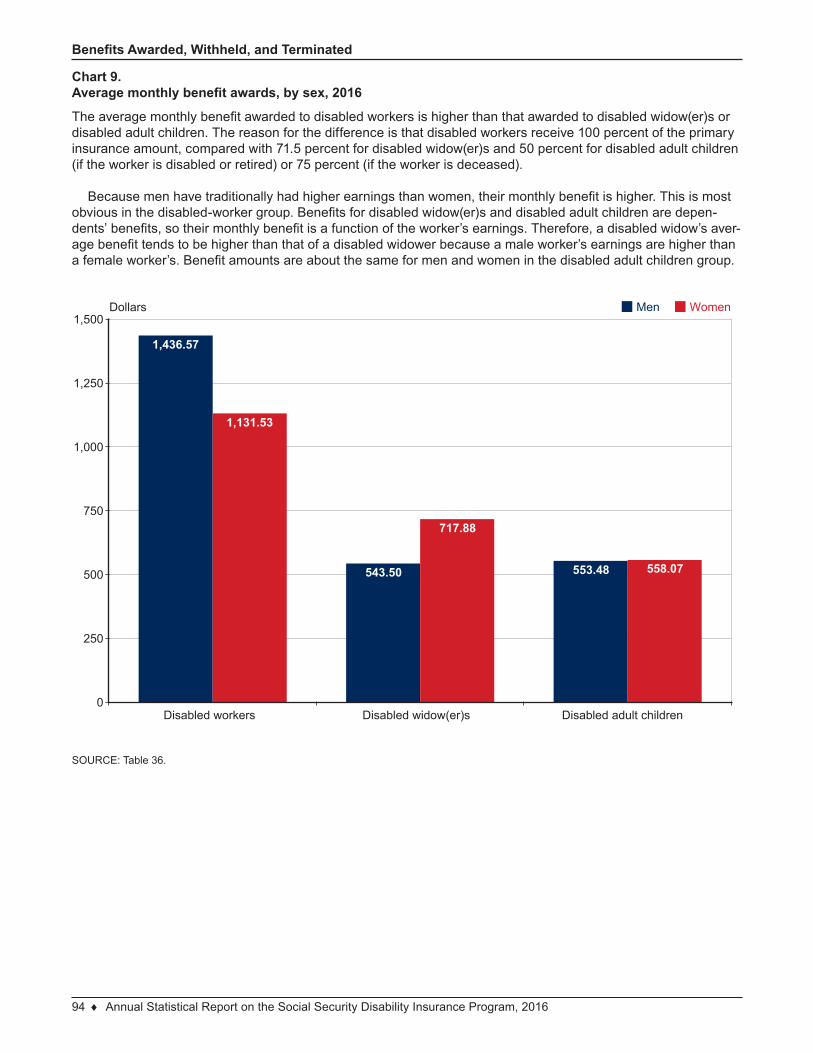
94 ♦ Annual Statistical Report on the Social Security Disability Insurance Program, 2016
Benefits Awarded, Withheld, and Terminated
Chart 9.Average monthly benefit awards, by sex, 2016
The average monthly benefit awarded to disabled workers is higher than that awarded to disabled widow(er)s or disabled adult children. The reason for the difference is that disabled workers receive 100 percent of the primary insurance amount, compared with 71.5 percent for disabled widow(er)s and 50 percent for disabled adult children (if the worker is disabled or retired) or 75 percent (if the worker is deceased).
Because men have traditionally had higher earnings than women, their monthly benefit is higher. This is most obvious in the disabled-worker group. Benefits for disabled widow(er)s and disabled adult children are depen-dents’ benefits, so their monthly benefit is a function of the worker’s earnings. Therefore, a disabled widow’s aver-age benefit tends to be higher than that of a disabled widower because a male worker’s earnings are higher than a female worker’s. Benefit amounts are about the same for men and women in the disabled adult children group.
SOURCE: Table 36.
1,436.57
1,131.53
543.50
717.88
553.48 558.07
Disabled workers Disabled widow(er)s Disabled adult children0
250
500
750
1,000
1,250
1,500Dollars Men Women
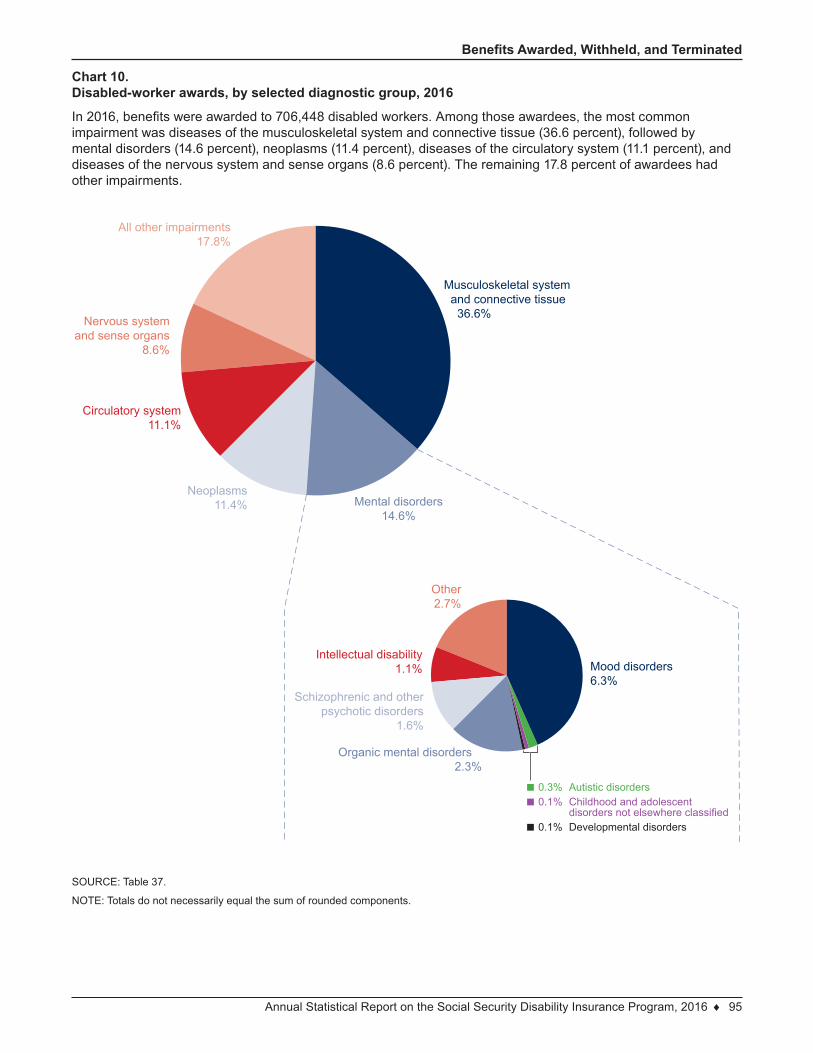
Annual Statistical Report on the Social Security Disability Insurance Program, 2016 ♦ 95
Benefits Awarded, Withheld, and Terminated
Chart 10.Disabled-worker awards, by selected diagnostic group, 2016
In 2016, benefits were awarded to 706,448 disabled workers. Among those awardees, the most common impairment was diseases of the musculoskeletal system and connective tissue (36.6 percent), followed by mental disorders (14.6 percent), neoplasms (11.4 percent), diseases of the circulatory system (11.1 percent), and diseases of the nervous system and sense organs (8.6 percent). The remaining 17.8 percent of awardees had other impairments.
SOURCE: Table 37.
NOTE: Totals do not necessarily equal the sum of rounded components.
Musculoskeletal system and connective tissue 36.6%
All other impairments17.8%
Mental disorders14.6%
Nervous systemand sense organs
8.6%
Schizophrenic and otherpsychotic disorders
1.6%
Organic mental disorders 2.3%
Mood disorders6.3%
Other2.7%
Intellectual disability1.1%
■ 0.3% Autistic disorders■ 0.1% Childhood and adolescent disorders not elsewhere classified■ 0.1% Developmental disorders
Neoplasms11.4%
Circulatory system11.1%
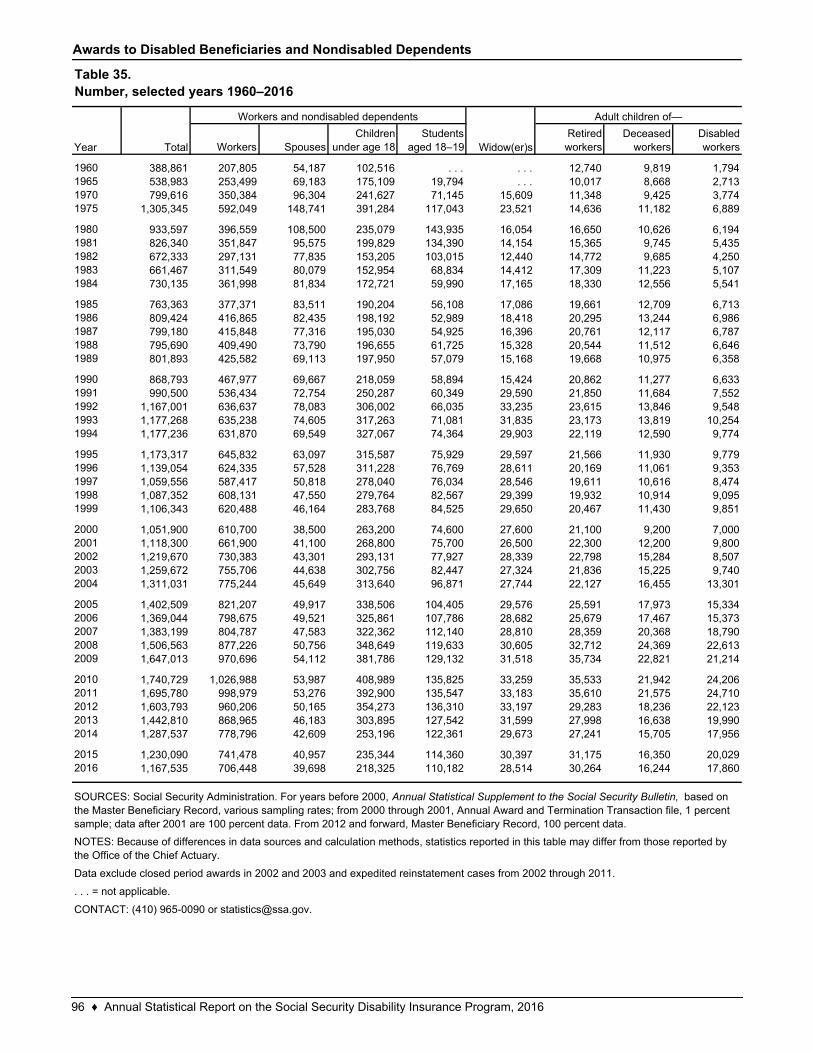
Awards to Disabled Beneficiaries and Nondisabled Dependents
Workers SpousesChildren
under age 18Students
aged 18–19Retired workers
Deceased workers
Disabled workers
1960 388,861 207,805 54,187 102,516 . . . . . . 12,740 9,819 1,7941965 538,983 253,499 69,183 175,109 19,794 . . . 10,017 8,668 2,7131970 799,616 350,384 96,304 241,627 71,145 15,609 11,348 9,425 3,7741975 1,305,345 592,049 148,741 391,284 117,043 23,521 14,636 11,182 6,889
1980 933,597 396,559 108,500 235,079 143,935 16,054 16,650 10,626 6,1941981 826,340 351,847 95,575 199,829 134,390 14,154 15,365 9,745 5,4351982 672,333 297,131 77,835 153,205 103,015 12,440 14,772 9,685 4,2501983 661,467 311,549 80,079 152,954 68,834 14,412 17,309 11,223 5,1071984 730,135 361,998 81,834 172,721 59,990 17,165 18,330 12,556 5,541
1985 763,363 377,371 83,511 190,204 56,108 17,086 19,661 12,709 6,7131986 809,424 416,865 82,435 198,192 52,989 18,418 20,295 13,244 6,9861987 799,180 415,848 77,316 195,030 54,925 16,396 20,761 12,117 6,7871988 795,690 409,490 73,790 196,655 61,725 15,328 20,544 11,512 6,6461989 801,893 425,582 69,113 197,950 57,079 15,168 19,668 10,975 6,358
1990 868,793 467,977 69,667 218,059 58,894 15,424 20,862 11,277 6,6331991 990,500 536,434 72,754 250,287 60,349 29,590 21,850 11,684 7,5521992 1,167,001 636,637 78,083 306,002 66,035 33,235 23,615 13,846 9,5481993 1,177,268 635,238 74,605 317,263 71,081 31,835 23,173 13,819 10,2541994 1,177,236 631,870 69,549 327,067 74,364 29,903 22,119 12,590 9,774
1995 1,173,317 645,832 63,097 315,587 75,929 29,597 21,566 11,930 9,7791996 1,139,054 624,335 57,528 311,228 76,769 28,611 20,169 11,061 9,3531997 1,059,556 587,417 50,818 278,040 76,034 28,546 19,611 10,616 8,4741998 1,087,352 608,131 47,550 279,764 82,567 29,399 19,932 10,914 9,0951999 1,106,343 620,488 46,164 283,768 84,525 29,650 20,467 11,430 9,851
2000 1,051,900 610,700 38,500 263,200 74,600 27,600 21,100 9,200 7,0002001 1,118,300 661,900 41,100 268,800 75,700 26,500 22,300 12,200 9,8002002 1,219,670 730,383 43,301 293,131 77,927 28,339 22,798 15,284 8,5072003 1,259,672 755,706 44,638 302,756 82,447 27,324 21,836 15,225 9,7402004 1,311,031 775,244 45,649 313,640 96,871 27,744 22,127 16,455 13,301
2005 1,402,509 821,207 49,917 338,506 104,405 29,576 25,591 17,973 15,3342006 1,369,044 798,675 49,521 325,861 107,786 28,682 25,679 17,467 15,3732007 1,383,199 804,787 47,583 322,362 112,140 28,810 28,359 20,368 18,7902008 1,506,563 877,226 50,756 348,649 119,633 30,605 32,712 24,369 22,6132009 1,647,013 970,696 54,112 381,786 129,132 31,518 35,734 22,821 21,214
2010 1,740,729 1,026,988 53,987 408,989 135,825 33,259 35,533 21,942 24,2062011 1,695,780 998,979 53,276 392,900 135,547 33,183 35,610 21,575 24,7102012 1,603,793 960,206 50,165 354,273 136,310 33,197 29,283 18,236 22,1232013 1,442,810 868,965 46,183 303,895 127,542 31,599 27,998 16,638 19,9902014 1,287,537 778,796 42,609 253,196 122,361 29,673 27,241 15,705 17,956
2015 1,230,090 741,478 40,957 235,344 114,360 30,397 31,175 16,350 20,0292016 1,167,535 706,448 39,698 218,325 110,182 28,514 30,264 16,244 17,860
SOURCES: Social Security Administration. For years before 2000, Annual Statistical Supplement to the Social Security Bulletin, based on the Master Beneficiary Record, various sampling rates; from 2000 through 2001, Annual Award and Termination Transaction file, 1 percent sample; data after 2001 are 100 percent data. From 2012 and forward, Master Beneficiary Record, 100 percent data.
NOTES: Because of differences in data sources and calculation methods, statistics reported in this table may differ from those reported by the Office of the Chief Actuary.
Data exclude closed period awards in 2002 and 2003 and expedited reinstatement cases from 2002 through 2011.
. . . = not applicable.
CONTACT: (410) 965-0090 or [email protected].
Table 35.Number, selected years 1960–2016
Year Total
Workers and nondisabled dependents
Widow(er)s
Adult children of—
96 ♦ Annual Statistical Report on the Social Security Disability Insurance Program, 2016

Awards to Disabled Beneficiaries and Nondisabled Dependents
Number
Average monthly
benefit a (dollars) Number
Average monthly
benefit a (dollars) Number
Average monthly
benefit a (dollars)
Total 706,448 1,292.94 373,798 1,436.57 332,650 1,131.53
18,471 654.91 10,888 658.04 7,583 650.4219,991 887.16 10,787 914.78 9,204 854.7926,252 1,026.36 13,277 1,072.58 12,975 979.0633,670 1,112.10 16,471 1,178.43 17,199 1,048.5946,981 1,177.37 22,882 1,274.42 24,099 1,085.2366,464 1,239.03 32,578 1,366.49 33,886 1,116.48
136,236 1,271.77 68,161 1,424.49 68,075 1,118.85206,080 1,368.16 110,047 1,539.70 96,033 1,171.59145,968 1,486.31 84,803 1,648.53 61,165 1,261.41
6,335 1,474.47 3,904 1,611.35 2,431 1,254.64
Total 39,698 368.49 4,466 385.05 35,232 366.39
8,169 248.53 512 177.69 7,657 253.261,032 170.21 41 104.24 991 172.941,248 186.39 60 144.45 1,188 188.511,527 218.51 85 179.56 1,442 220.811,452 252.55 93 147.54 1,359 259.741,301 285.05 97 202.32 1,204 291.72
941 333.17 72 193.83 869 344.72668 355.10 64 241.75 604 367.11
31,529 399.57 3,954 411.90 27,575 397.8024,316 346.43 1,794 245.01 22,522 354.517,213 578.73 2,160 550.52 5,053 590.78
Total 346,367 351.88 180,235 353.87 166,132 349.71
218,325 306.63 110,910 307.19 107,415 306.0453,690 236.50 27,396 238.14 26,294 234.8053,833 269.13 27,548 270.38 26,285 267.8372,243 332.09 36,532 332.81 35,711 331.3438,559 408.91 19,434 408.55 19,125 409.28
110,182 441.82 58,740 443.03 51,442 440.43
17,860 350.18 10,585 348.25 7,275 352.98
Total 28,514 699.29 3,040 543.50 25,474 717.88
12,043 685.50 1,207 531.49 10,836 702.6616,325 709.40 1,818 551.35 14,507 729.21
146 704.99 15 559.33 131 721.6760–FRA
50–54
55–59
Entitlement based on age62–6465 or older
Under 18Under 55–910–1415–17
Students 18–19
Disabled 18 or older
50–54
Under 2525–2930–3435–3940–44
55–FRA
50–5455–5960–6465–FRA
Entitlement based on care of children
Under 30
Workers
Spouses of disabled workers
Children of disabled workers
Widow(er)s
(Continued)
45–49
30–3435–3940–4445–49
Table 36.Number and average monthly benefit, by basis of entitlement, age, and sex, 2016
Total Male Female
Basis of entitlement and age
Annual Statistical Report on the Social Security Disability Insurance Program, 2016 ♦ 97
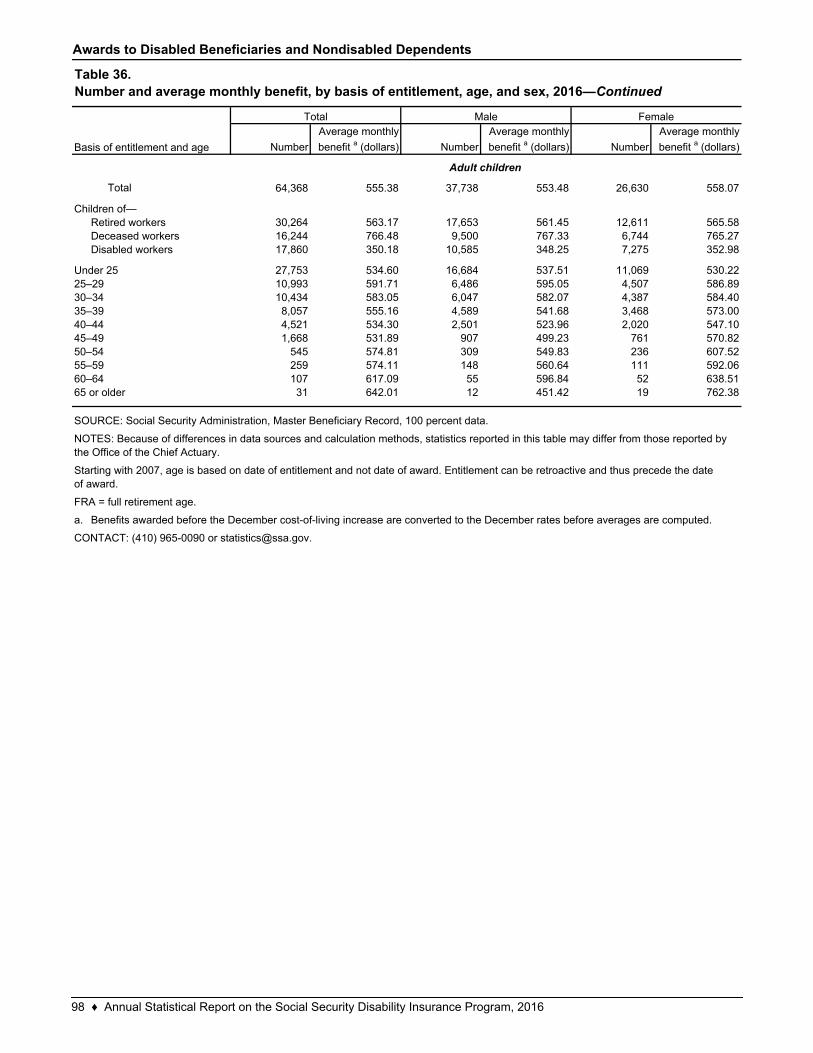
Awards to Disabled Beneficiaries and Nondisabled Dependents
Number
Average monthly
benefit a (dollars) Number
Average monthly
benefit a (dollars) Number
Average monthly
benefit a (dollars)
Total 64,368 555.38 37,738 553.48 26,630 558.07
30,264 563.17 17,653 561.45 12,611 565.5816,244 766.48 9,500 767.33 6,744 765.2717,860 350.18 10,585 348.25 7,275 352.98
27,753 534.60 16,684 537.51 11,069 530.2210,993 591.71 6,486 595.05 4,507 586.8910,434 583.05 6,047 582.07 4,387 584.408,057 555.16 4,589 541.68 3,468 573.004,521 534.30 2,501 523.96 2,020 547.101,668 531.89 907 499.23 761 570.82
545 574.81 309 549.83 236 607.52259 574.11 148 560.64 111 592.06107 617.09 55 596.84 52 638.5131 642.01 12 451.42 19 762.38
a.
55–5960–6465 or older
Benefits awarded before the December cost-of-living increase are converted to the December rates before averages are computed.
CONTACT: (410) 965-0090 or [email protected].
50–54
Children of—Retired workersDeceased workersDisabled workers
Under 2525–2930–3435–3940–4445–49
SOURCE: Social Security Administration, Master Beneficiary Record, 100 percent data.
NOTES: Because of differences in data sources and calculation methods, statistics reported in this table may differ from those reported by the Office of the Chief Actuary.
Starting with 2007, age is based on date of entitlement and not date of award. Entitlement can be retroactive and thus precede the date of award.
FRA = full retirement age.
Adult children
Table 36.Number and average monthly benefit, by basis of entitlement, age, and sex, 2016—Continued
Basis of entitlement and age
Total Male Female
98 ♦ Annual Statistical Report on the Social Security Disability Insurance Program, 2016
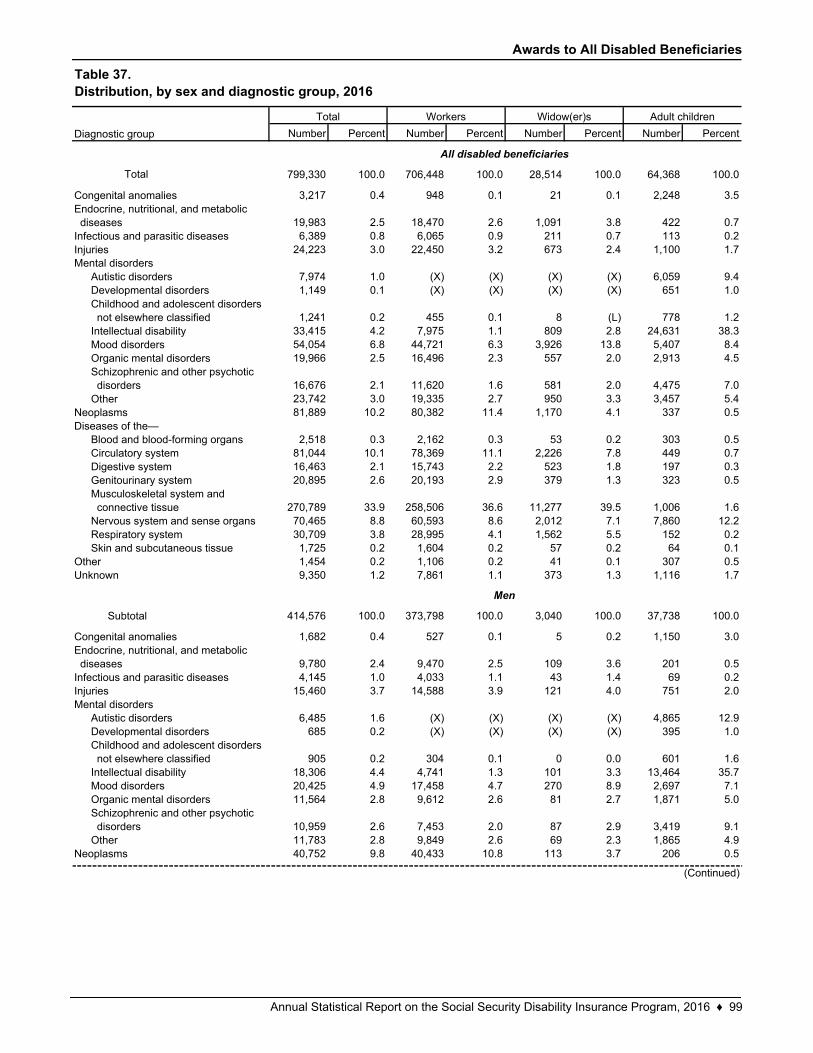
Awards to All Disabled Beneficiaries
Number Percent Number Percent Number Percent Number Percent
Total 799,330 100.0 706,448 100.0 28,514 100.0 64,368 100.0
3,217 0.4 948 0.1 21 0.1 2,248 3.5
19,983 2.5 18,470 2.6 1,091 3.8 422 0.76,389 0.8 6,065 0.9 211 0.7 113 0.2
24,223 3.0 22,450 3.2 673 2.4 1,100 1.7
7,974 1.0 (X) (X) (X) (X) 6,059 9.41,149 0.1 (X) (X) (X) (X) 651 1.0
1,241 0.2 455 0.1 8 (L) 778 1.233,415 4.2 7,975 1.1 809 2.8 24,631 38.354,054 6.8 44,721 6.3 3,926 13.8 5,407 8.419,966 2.5 16,496 2.3 557 2.0 2,913 4.5
16,676 2.1 11,620 1.6 581 2.0 4,475 7.023,742 3.0 19,335 2.7 950 3.3 3,457 5.481,889 10.2 80,382 11.4 1,170 4.1 337 0.5
2,518 0.3 2,162 0.3 53 0.2 303 0.581,044 10.1 78,369 11.1 2,226 7.8 449 0.716,463 2.1 15,743 2.2 523 1.8 197 0.320,895 2.6 20,193 2.9 379 1.3 323 0.5
270,789 33.9 258,506 36.6 11,277 39.5 1,006 1.670,465 8.8 60,593 8.6 2,012 7.1 7,860 12.230,709 3.8 28,995 4.1 1,562 5.5 152 0.21,725 0.2 1,604 0.2 57 0.2 64 0.11,454 0.2 1,106 0.2 41 0.1 307 0.59,350 1.2 7,861 1.1 373 1.3 1,116 1.7
414,576 100.0 373,798 100.0 3,040 100.0 37,738 100.0
1,682 0.4 527 0.1 5 0.2 1,150 3.0
9,780 2.4 9,470 2.5 109 3.6 201 0.54,145 1.0 4,033 1.1 43 1.4 69 0.2
15,460 3.7 14,588 3.9 121 4.0 751 2.0
6,485 1.6 (X) (X) (X) (X) 4,865 12.9685 0.2 (X) (X) (X) (X) 395 1.0
905 0.2 304 0.1 0 0.0 601 1.618,306 4.4 4,741 1.3 101 3.3 13,464 35.720,425 4.9 17,458 4.7 270 8.9 2,697 7.111,564 2.8 9,612 2.6 81 2.7 1,871 5.0
10,959 2.6 7,453 2.0 87 2.9 3,419 9.111,783 2.8 9,849 2.6 69 2.3 1,865 4.940,752 9.8 40,433 10.8 113 3.7 206 0.5
Autistic disordersDevelopmental disordersChildhood and adolescent disorders not elsewhere classifiedIntellectual disabilityMood disordersOrganic mental disordersSchizophrenic and other psychotic disordersOther
Neoplasms
Blood and blood-forming organsCirculatory systemDigestive system
Mental disorders
Musculoskeletal system and connective tissueNervous system and sense organsRespiratory systemSkin and subcutaneous tissue
OtherUnknown
Subtotal
Congenital anomaliesEndocrine, nutritional, and metabolic diseasesInfectious and parasitic diseasesInjuries
Diagnostic group
Congenital anomaliesEndocrine, nutritional, and metabolic diseasesInfectious and parasitic diseasesInjuries
Genitourinary system
Childhood and adolescent disorders not elsewhere classifiedIntellectual disabilityMood disordersOrganic mental disordersSchizophrenic and other psychotic disordersOther
NeoplasmsDiseases of the—
All disabled beneficiaries
Men
Table 37.Distribution, by sex and diagnostic group, 2016
Total Workers Widow(er)s Adult children
Mental disordersAutistic disordersDevelopmental disorders
(Continued)
Annual Statistical Report on the Social Security Disability Insurance Program, 2016 ♦ 99
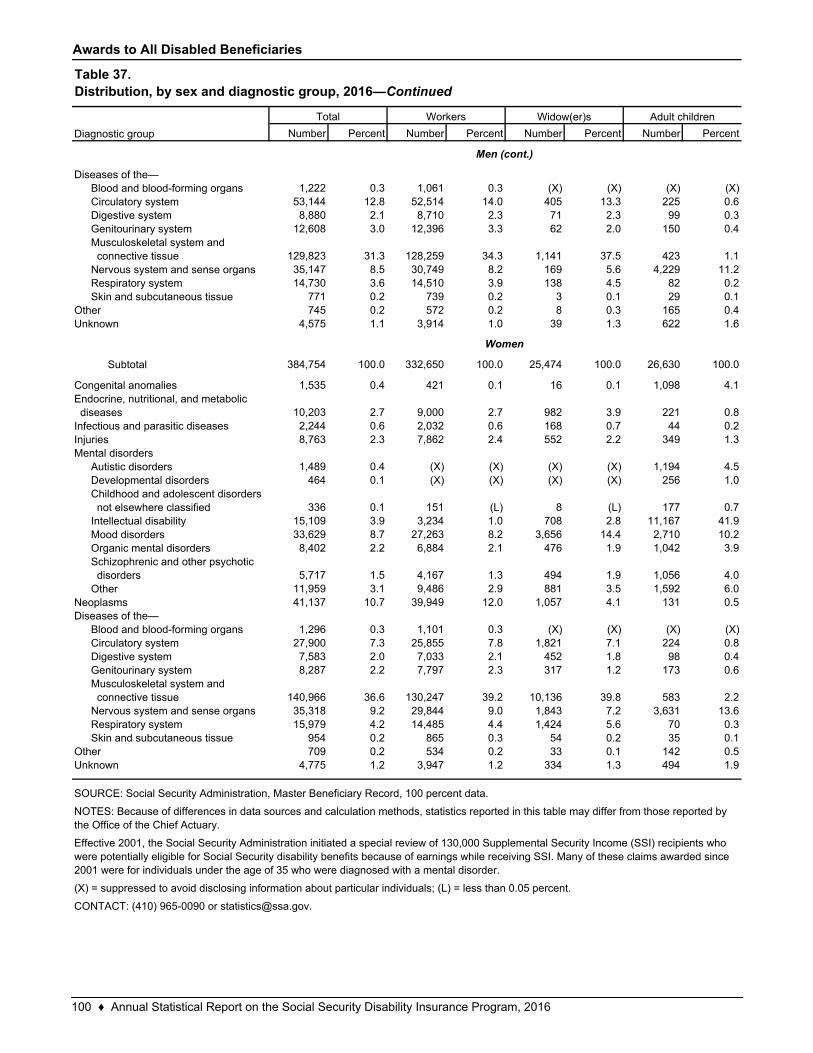
Awards to All Disabled Beneficiaries
Number Percent Number Percent Number Percent Number Percent
1,222 0.3 1,061 0.3 (X) (X) (X) (X)53,144 12.8 52,514 14.0 405 13.3 225 0.68,880 2.1 8,710 2.3 71 2.3 99 0.3
12,608 3.0 12,396 3.3 62 2.0 150 0.4
129,823 31.3 128,259 34.3 1,141 37.5 423 1.135,147 8.5 30,749 8.2 169 5.6 4,229 11.214,730 3.6 14,510 3.9 138 4.5 82 0.2
771 0.2 739 0.2 3 0.1 29 0.1745 0.2 572 0.2 8 0.3 165 0.4
4,575 1.1 3,914 1.0 39 1.3 622 1.6
384,754 100.0 332,650 100.0 25,474 100.0 26,630 100.0
1,535 0.4 421 0.1 16 0.1 1,098 4.1
10,203 2.7 9,000 2.7 982 3.9 221 0.82,244 0.6 2,032 0.6 168 0.7 44 0.28,763 2.3 7,862 2.4 552 2.2 349 1.3
1,489 0.4 (X) (X) (X) (X) 1,194 4.5464 0.1 (X) (X) (X) (X) 256 1.0
336 0.1 151 (L) 8 (L) 177 0.715,109 3.9 3,234 1.0 708 2.8 11,167 41.933,629 8.7 27,263 8.2 3,656 14.4 2,710 10.28,402 2.2 6,884 2.1 476 1.9 1,042 3.9
5,717 1.5 4,167 1.3 494 1.9 1,056 4.011,959 3.1 9,486 2.9 881 3.5 1,592 6.041,137 10.7 39,949 12.0 1,057 4.1 131 0.5
1,296 0.3 1,101 0.3 (X) (X) (X) (X)27,900 7.3 25,855 7.8 1,821 7.1 224 0.87,583 2.0 7,033 2.1 452 1.8 98 0.48,287 2.2 7,797 2.3 317 1.2 173 0.6
140,966 36.6 130,247 39.2 10,136 39.8 583 2.235,318 9.2 29,844 9.0 1,843 7.2 3,631 13.615,979 4.2 14,485 4.4 1,424 5.6 70 0.3
954 0.2 865 0.3 54 0.2 35 0.1709 0.2 534 0.2 33 0.1 142 0.5
4,775 1.2 3,947 1.2 334 1.3 494 1.9
(X) = suppressed to avoid disclosing information about particular individuals; (L) = less than 0.05 percent.
CONTACT: (410) 965-0090 or [email protected].
NOTES: Because of differences in data sources and calculation methods, statistics reported in this table may differ from those reported by the Office of the Chief Actuary.
Effective 2001, the Social Security Administration initiated a special review of 130,000 Supplemental Security Income (SSI) recipients who were potentially eligible for Social Security disability benefits because of earnings while receiving SSI. Many of these claims awarded since 2001 were for individuals under the age of 35 who were diagnosed with a mental disorder.
Nervous system and sense organsRespiratory systemSkin and subcutaneous tissue
OtherUnknown
Diseases of the—Blood and blood-forming organsCirculatory systemDigestive system
Musculoskeletal system and connective tissue
Skin and subcutaneous tissueOtherUnknown
Subtotal
Congenital anomalies
Digestive systemGenitourinary systemMusculoskeletal system and connective tissueNervous system and sense organsRespiratory system
Circulatory system
Diseases of the—Blood and blood-forming organs
Widow(er)s Adult children
Women
SOURCE: Social Security Administration, Master Beneficiary Record, 100 percent data.
InjuriesMental disorders
Autistic disordersDevelopmental disorders
Infectious and parasitic diseases
Endocrine, nutritional, and metabolic diseases
Genitourinary system
Childhood and adolescent disorders not elsewhere classifiedIntellectual disabilityMood disordersOrganic mental disordersSchizophrenic and other psychotic disordersOther
Neoplasms
Men (cont.)
Table 37.Distribution, by sex and diagnostic group, 2016—Continued
Diagnostic group
Total Workers
100 ♦ Annual Statistical Report on the Social Security Disability Insurance Program, 2016
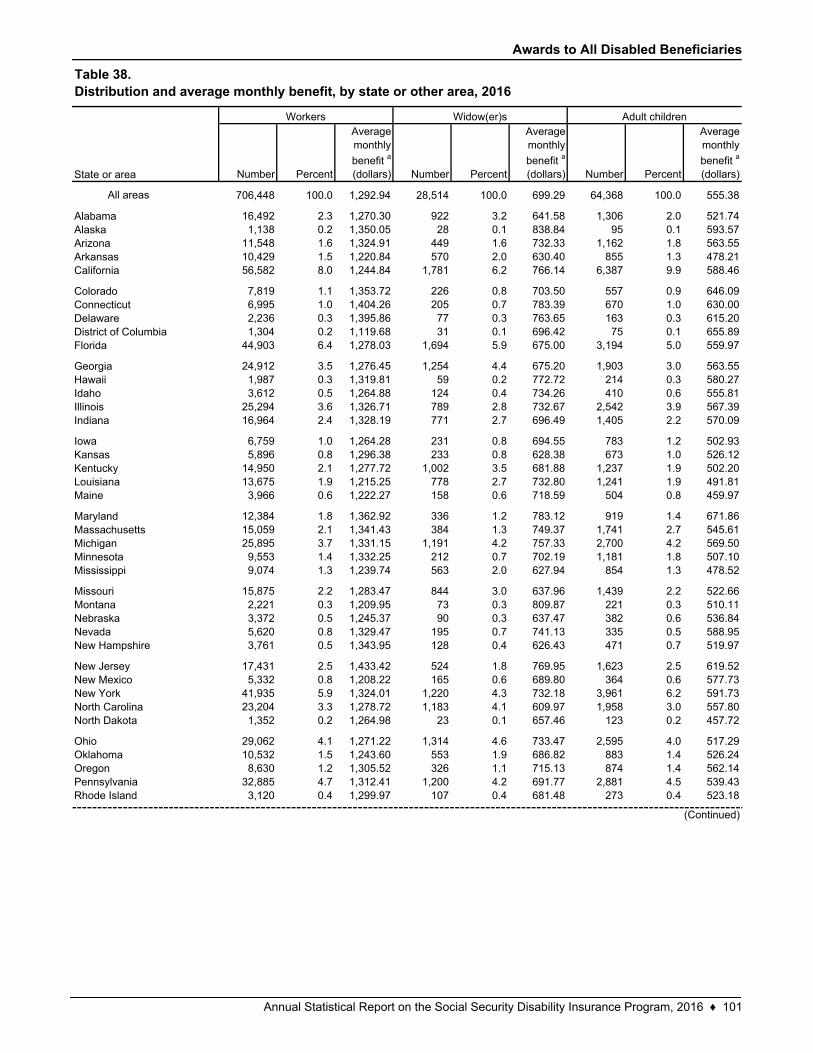
Awards to All Disabled Beneficiaries
Number Percent
Average monthly
benefit a
(dollars) Number Percent
Average monthly
benefit a
(dollars) Number Percent
Average monthly
benefit a
(dollars)
All areas 706,448 100.0 1,292.94 28,514 100.0 699.29 64,368 100.0 555.38
16,492 2.3 1,270.30 922 3.2 641.58 1,306 2.0 521.741,138 0.2 1,350.05 28 0.1 838.84 95 0.1 593.57
11,548 1.6 1,324.91 449 1.6 732.33 1,162 1.8 563.5510,429 1.5 1,220.84 570 2.0 630.40 855 1.3 478.2156,582 8.0 1,244.84 1,781 6.2 766.14 6,387 9.9 588.46
7,819 1.1 1,353.72 226 0.8 703.50 557 0.9 646.096,995 1.0 1,404.26 205 0.7 783.39 670 1.0 630.002,236 0.3 1,395.86 77 0.3 763.65 163 0.3 615.201,304 0.2 1,119.68 31 0.1 696.42 75 0.1 655.89
44,903 6.4 1,278.03 1,694 5.9 675.00 3,194 5.0 559.97
24,912 3.5 1,276.45 1,254 4.4 675.20 1,903 3.0 563.551,987 0.3 1,319.81 59 0.2 772.72 214 0.3 580.273,612 0.5 1,264.88 124 0.4 734.26 410 0.6 555.81
25,294 3.6 1,326.71 789 2.8 732.67 2,542 3.9 567.3916,964 2.4 1,328.19 771 2.7 696.49 1,405 2.2 570.09
6,759 1.0 1,264.28 231 0.8 694.55 783 1.2 502.935,896 0.8 1,296.38 233 0.8 628.38 673 1.0 526.12
14,950 2.1 1,277.72 1,002 3.5 681.88 1,237 1.9 502.2013,675 1.9 1,215.25 778 2.7 732.80 1,241 1.9 491.813,966 0.6 1,222.27 158 0.6 718.59 504 0.8 459.97
12,384 1.8 1,362.92 336 1.2 783.12 919 1.4 671.8615,059 2.1 1,341.43 384 1.3 749.37 1,741 2.7 545.6125,895 3.7 1,331.15 1,191 4.2 757.33 2,700 4.2 569.509,553 1.4 1,332.25 212 0.7 702.19 1,181 1.8 507.109,074 1.3 1,239.74 563 2.0 627.94 854 1.3 478.52
15,875 2.2 1,283.47 844 3.0 637.96 1,439 2.2 522.662,221 0.3 1,209.95 73 0.3 809.87 221 0.3 510.113,372 0.5 1,245.37 90 0.3 637.47 382 0.6 536.845,620 0.8 1,329.47 195 0.7 741.13 335 0.5 588.953,761 0.5 1,343.95 128 0.4 626.43 471 0.7 519.97
17,431 2.5 1,433.42 524 1.8 769.95 1,623 2.5 619.525,332 0.8 1,208.22 165 0.6 689.80 364 0.6 577.73
41,935 5.9 1,324.01 1,220 4.3 732.18 3,961 6.2 591.7323,204 3.3 1,278.72 1,183 4.1 609.97 1,958 3.0 557.801,352 0.2 1,264.98 23 0.1 657.46 123 0.2 457.72
29,062 4.1 1,271.22 1,314 4.6 733.47 2,595 4.0 517.2910,532 1.5 1,243.60 553 1.9 686.82 883 1.4 526.248,630 1.2 1,305.52 326 1.1 715.13 874 1.4 562.14
32,885 4.7 1,312.41 1,200 4.2 691.77 2,881 4.5 539.433,120 0.4 1,299.97 107 0.4 681.48 273 0.4 523.18
OklahomaOregonPennsylvaniaRhode Island
(Continued)
Ohio
Mississippi
MissouriMontanaNebraskaNevadaNew Hampshire
New JerseyNew MexicoNew YorkNorth CarolinaNorth Dakota
Minnesota
IdahoIllinoisIndiana
IowaKansasKentuckyLouisianaMaine
MarylandMassachusettsMichigan
Hawaii
AlabamaAlaskaArizonaArkansasCalifornia
ColoradoConnecticutDelawareDistrict of ColumbiaFlorida
Georgia
Table 38.Distribution and average monthly benefit, by state or other area, 2016
Workers Widow(er)s Adult children
State or area
Annual Statistical Report on the Social Security Disability Insurance Program, 2016 ♦ 101
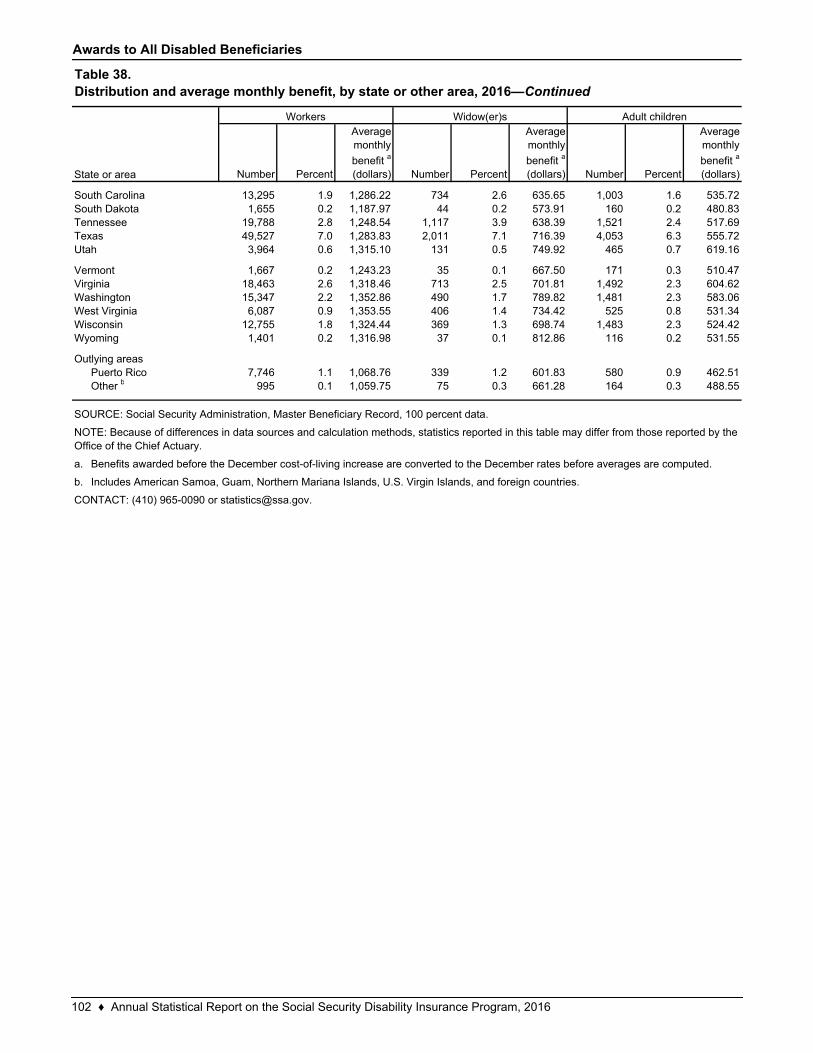
Awards to All Disabled Beneficiaries
Number Percent
Average monthly
benefit a
(dollars) Number Percent
Average monthly
benefit a
(dollars) Number Percent
Average monthly
benefit a
(dollars)
13,295 1.9 1,286.22 734 2.6 635.65 1,003 1.6 535.721,655 0.2 1,187.97 44 0.2 573.91 160 0.2 480.83
19,788 2.8 1,248.54 1,117 3.9 638.39 1,521 2.4 517.6949,527 7.0 1,283.83 2,011 7.1 716.39 4,053 6.3 555.723,964 0.6 1,315.10 131 0.5 749.92 465 0.7 619.16
1,667 0.2 1,243.23 35 0.1 667.50 171 0.3 510.4718,463 2.6 1,318.46 713 2.5 701.81 1,492 2.3 604.6215,347 2.2 1,352.86 490 1.7 789.82 1,481 2.3 583.066,087 0.9 1,353.55 406 1.4 734.42 525 0.8 531.34
12,755 1.8 1,324.44 369 1.3 698.74 1,483 2.3 524.421,401 0.2 1,316.98 37 0.1 812.86 116 0.2 531.55
7,746 1.1 1,068.76 339 1.2 601.83 580 0.9 462.51995 0.1 1,059.75 75 0.3 661.28 164 0.3 488.55
a.
b.
CONTACT: (410) 965-0090 or [email protected].
Benefits awarded before the December cost-of-living increase are converted to the December rates before averages are computed.
Includes American Samoa, Guam, Northern Mariana Islands, U.S. Virgin Islands, and foreign countries.
Outlying areasPuerto RicoOther b
SOURCE: Social Security Administration, Master Beneficiary Record, 100 percent data.
NOTE: Because of differences in data sources and calculation methods, statistics reported in this table may differ from those reported by the Office of the Chief Actuary.
VermontVirginia
West VirginiaWisconsinWyoming
Washington
South CarolinaSouth Dakota
Table 38.Distribution and average monthly benefit, by state or other area, 2016—Continued
State or area
Workers Widow(er)s Adult children
TennesseeTexasUtah
102 ♦ Annual Statistical Report on the Social Security Disability Insurance Program, 2016
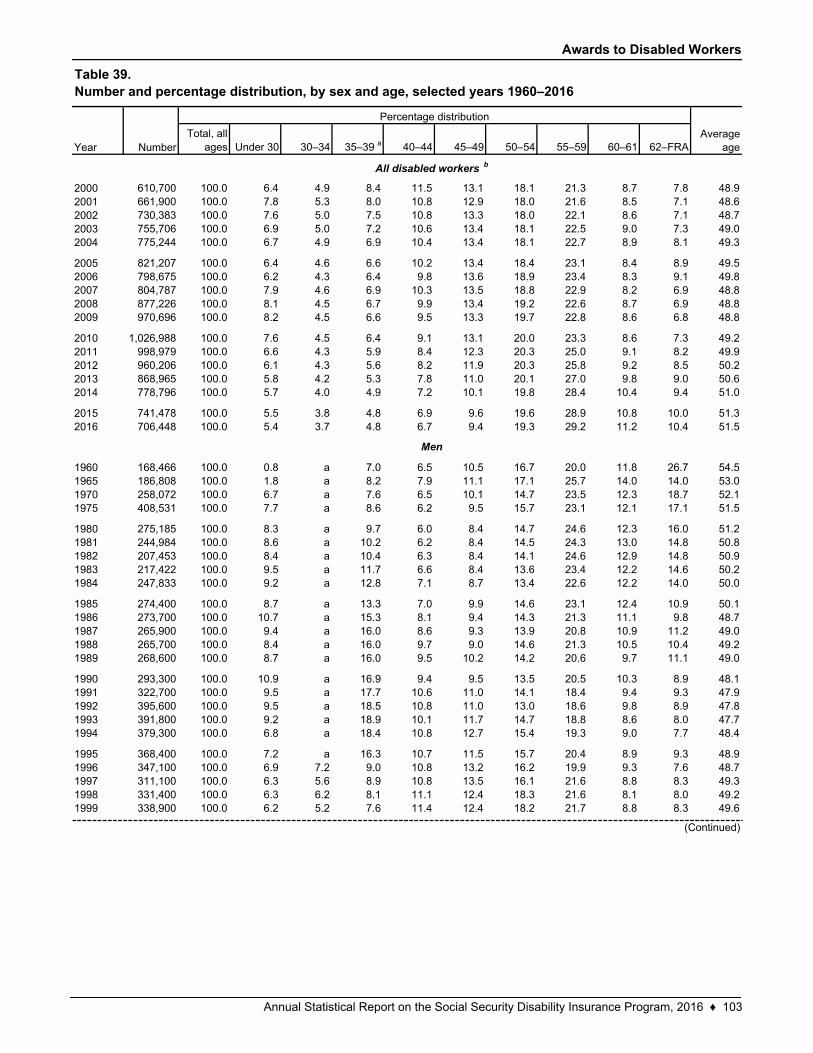
Awards to Disabled Workers
Total, all ages Under 30 30–34 35–39 a 40–44 45–49 50–54 55–59 60–61 62–FRA
610,700 100.0 6.4 4.9 8.4 11.5 13.1 18.1 21.3 8.7 7.8 48.9661,900 100.0 7.8 5.3 8.0 10.8 12.9 18.0 21.6 8.5 7.1 48.6730,383 100.0 7.6 5.0 7.5 10.8 13.3 18.0 22.1 8.6 7.1 48.7755,706 100.0 6.9 5.0 7.2 10.6 13.4 18.1 22.5 9.0 7.3 49.0775,244 100.0 6.7 4.9 6.9 10.4 13.4 18.1 22.7 8.9 8.1 49.3
821,207 100.0 6.4 4.6 6.6 10.2 13.4 18.4 23.1 8.4 8.9 49.5798,675 100.0 6.2 4.3 6.4 9.8 13.6 18.9 23.4 8.3 9.1 49.8804,787 100.0 7.9 4.6 6.9 10.3 13.5 18.8 22.9 8.2 6.9 48.8877,226 100.0 8.1 4.5 6.7 9.9 13.4 19.2 22.6 8.7 6.9 48.8970,696 100.0 8.2 4.5 6.6 9.5 13.3 19.7 22.8 8.6 6.8 48.8
1,026,988 100.0 7.6 4.5 6.4 9.1 13.1 20.0 23.3 8.6 7.3 49.2998,979 100.0 6.6 4.3 5.9 8.4 12.3 20.3 25.0 9.1 8.2 49.9960,206 100.0 6.1 4.3 5.6 8.2 11.9 20.3 25.8 9.2 8.5 50.2868,965 100.0 5.8 4.2 5.3 7.8 11.0 20.1 27.0 9.8 9.0 50.6778,796 100.0 5.7 4.0 4.9 7.2 10.1 19.8 28.4 10.4 9.4 51.0
741,478 100.0 5.5 3.8 4.8 6.9 9.6 19.6 28.9 10.8 10.0 51.3706,448 100.0 5.4 3.7 4.8 6.7 9.4 19.3 29.2 11.2 10.4 51.5
168,466 100.0 0.8 a 7.0 6.5 10.5 16.7 20.0 11.8 26.7 54.5186,808 100.0 1.8 a 8.2 7.9 11.1 17.1 25.7 14.0 14.0 53.0258,072 100.0 6.7 a 7.6 6.5 10.1 14.7 23.5 12.3 18.7 52.1408,531 100.0 7.7 a 8.6 6.2 9.5 15.7 23.1 12.1 17.1 51.5
275,185 100.0 8.3 a 9.7 6.0 8.4 14.7 24.6 12.3 16.0 51.2244,984 100.0 8.6 a 10.2 6.2 8.4 14.5 24.3 13.0 14.8 50.8207,453 100.0 8.4 a 10.4 6.3 8.4 14.1 24.6 12.9 14.8 50.9217,422 100.0 9.5 a 11.7 6.6 8.4 13.6 23.4 12.2 14.6 50.2247,833 100.0 9.2 a 12.8 7.1 8.7 13.4 22.6 12.2 14.0 50.0
274,400 100.0 8.7 a 13.3 7.0 9.9 14.6 23.1 12.4 10.9 50.1273,700 100.0 10.7 a 15.3 8.1 9.4 14.3 21.3 11.1 9.8 48.7265,900 100.0 9.4 a 16.0 8.6 9.3 13.9 20.8 10.9 11.2 49.0265,700 100.0 8.4 a 16.0 9.7 9.0 14.6 21.3 10.5 10.4 49.2268,600 100.0 8.7 a 16.0 9.5 10.2 14.2 20.6 9.7 11.1 49.0
293,300 100.0 10.9 a 16.9 9.4 9.5 13.5 20.5 10.3 8.9 48.1322,700 100.0 9.5 a 17.7 10.6 11.0 14.1 18.4 9.4 9.3 47.9395,600 100.0 9.5 a 18.5 10.8 11.0 13.0 18.6 9.8 8.9 47.8391,800 100.0 9.2 a 18.9 10.1 11.7 14.7 18.8 8.6 8.0 47.7379,300 100.0 6.8 a 18.4 10.8 12.7 15.4 19.3 9.0 7.7 48.4
368,400 100.0 7.2 a 16.3 10.7 11.5 15.7 20.4 8.9 9.3 48.9347,100 100.0 6.9 7.2 9.0 10.8 13.2 16.2 19.9 9.3 7.6 48.7311,100 100.0 6.3 5.6 8.9 10.8 13.5 16.1 21.6 8.8 8.3 49.3331,400 100.0 6.3 6.2 8.1 11.1 12.4 18.3 21.6 8.1 8.0 49.2338,900 100.0 6.2 5.2 7.6 11.4 12.4 18.2 21.7 8.8 8.3 49.61999
19971998
198719881989
199019911992
1960196519701975
1980
19931994
19951996
2000200120022003
20102011201220132014
2015
2004
2005
Table 39.Number and percentage distribution, by sex and age, selected years 1960–2016
Number
Percentage distribution
Average ageYear
(Continued)
All disabled workers b
Men
2006200720082009
1981198219831984
19851986
2016
Annual Statistical Report on the Social Security Disability Insurance Program, 2016 ♦ 103
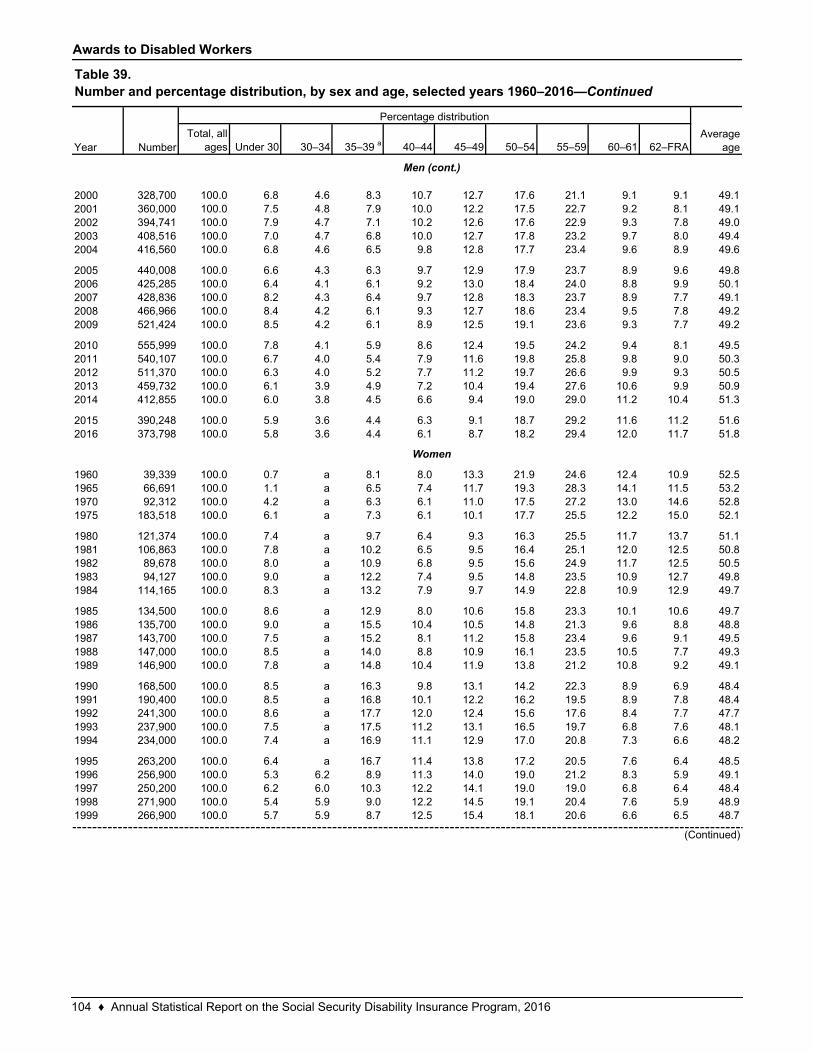
Awards to Disabled Workers
Total, all ages Under 30 30–34 35–39 a 40–44 45–49 50–54 55–59 60–61 62–FRA
328,700 100.0 6.8 4.6 8.3 10.7 12.7 17.6 21.1 9.1 9.1 49.1360,000 100.0 7.5 4.8 7.9 10.0 12.2 17.5 22.7 9.2 8.1 49.1394,741 100.0 7.9 4.7 7.1 10.2 12.6 17.6 22.9 9.3 7.8 49.0408,516 100.0 7.0 4.7 6.8 10.0 12.7 17.8 23.2 9.7 8.0 49.4416,560 100.0 6.8 4.6 6.5 9.8 12.8 17.7 23.4 9.6 8.9 49.6
440,008 100.0 6.6 4.3 6.3 9.7 12.9 17.9 23.7 8.9 9.6 49.8425,285 100.0 6.4 4.1 6.1 9.2 13.0 18.4 24.0 8.8 9.9 50.1428,836 100.0 8.2 4.3 6.4 9.7 12.8 18.3 23.7 8.9 7.7 49.1466,966 100.0 8.4 4.2 6.1 9.3 12.7 18.6 23.4 9.5 7.8 49.2521,424 100.0 8.5 4.2 6.1 8.9 12.5 19.1 23.6 9.3 7.7 49.2
555,999 100.0 7.8 4.1 5.9 8.6 12.4 19.5 24.2 9.4 8.1 49.5540,107 100.0 6.7 4.0 5.4 7.9 11.6 19.8 25.8 9.8 9.0 50.3511,370 100.0 6.3 4.0 5.2 7.7 11.2 19.7 26.6 9.9 9.3 50.5459,732 100.0 6.1 3.9 4.9 7.2 10.4 19.4 27.6 10.6 9.9 50.9412,855 100.0 6.0 3.8 4.5 6.6 9.4 19.0 29.0 11.2 10.4 51.3
390,248 100.0 5.9 3.6 4.4 6.3 9.1 18.7 29.2 11.6 11.2 51.6373,798 100.0 5.8 3.6 4.4 6.1 8.7 18.2 29.4 12.0 11.7 51.8
39,339 100.0 0.7 a 8.1 8.0 13.3 21.9 24.6 12.4 10.9 52.566,691 100.0 1.1 a 6.5 7.4 11.7 19.3 28.3 14.1 11.5 53.292,312 100.0 4.2 a 6.3 6.1 11.0 17.5 27.2 13.0 14.6 52.8
183,518 100.0 6.1 a 7.3 6.1 10.1 17.7 25.5 12.2 15.0 52.1
121,374 100.0 7.4 a 9.7 6.4 9.3 16.3 25.5 11.7 13.7 51.1106,863 100.0 7.8 a 10.2 6.5 9.5 16.4 25.1 12.0 12.5 50.889,678 100.0 8.0 a 10.9 6.8 9.5 15.6 24.9 11.7 12.5 50.594,127 100.0 9.0 a 12.2 7.4 9.5 14.8 23.5 10.9 12.7 49.8
114,165 100.0 8.3 a 13.2 7.9 9.7 14.9 22.8 10.9 12.9 49.7
134,500 100.0 8.6 a 12.9 8.0 10.6 15.8 23.3 10.1 10.6 49.7135,700 100.0 9.0 a 15.5 10.4 10.5 14.8 21.3 9.6 8.8 48.8143,700 100.0 7.5 a 15.2 8.1 11.2 15.8 23.4 9.6 9.1 49.5147,000 100.0 8.5 a 14.0 8.8 10.9 16.1 23.5 10.5 7.7 49.3146,900 100.0 7.8 a 14.8 10.4 11.9 13.8 21.2 10.8 9.2 49.1
168,500 100.0 8.5 a 16.3 9.8 13.1 14.2 22.3 8.9 6.9 48.4190,400 100.0 8.5 a 16.8 10.1 12.2 16.2 19.5 8.9 7.8 48.4241,300 100.0 8.6 a 17.7 12.0 12.4 15.6 17.6 8.4 7.7 47.7237,900 100.0 7.5 a 17.5 11.2 13.1 16.5 19.7 6.8 7.6 48.1234,000 100.0 7.4 a 16.9 11.1 12.9 17.0 20.8 7.3 6.6 48.2
263,200 100.0 6.4 a 16.7 11.4 13.8 17.2 20.5 7.6 6.4 48.5256,900 100.0 5.3 6.2 8.9 11.3 14.0 19.0 21.2 8.3 5.9 49.1250,200 100.0 6.2 6.0 10.3 12.2 14.1 19.0 19.0 6.8 6.4 48.4271,900 100.0 5.4 5.9 9.0 12.2 14.5 19.1 20.4 7.6 5.9 48.9266,900 100.0 5.7 5.9 8.7 12.5 15.4 18.1 20.6 6.6 6.5 48.7
1994
19951996199719981999
19881989
1990199119921993
198219831984
198519861987
1960196519701975
19801981
2011201220132014
20152016
2006200720082009
2010
20002001200220032004
2005
Women
Men (cont.)
(Continued)
Table 39.Number and percentage distribution, by sex and age, selected years 1960–2016—Continued
Year Number
Percentage distribution
Average age
104 ♦ Annual Statistical Report on the Social Security Disability Insurance Program, 2016
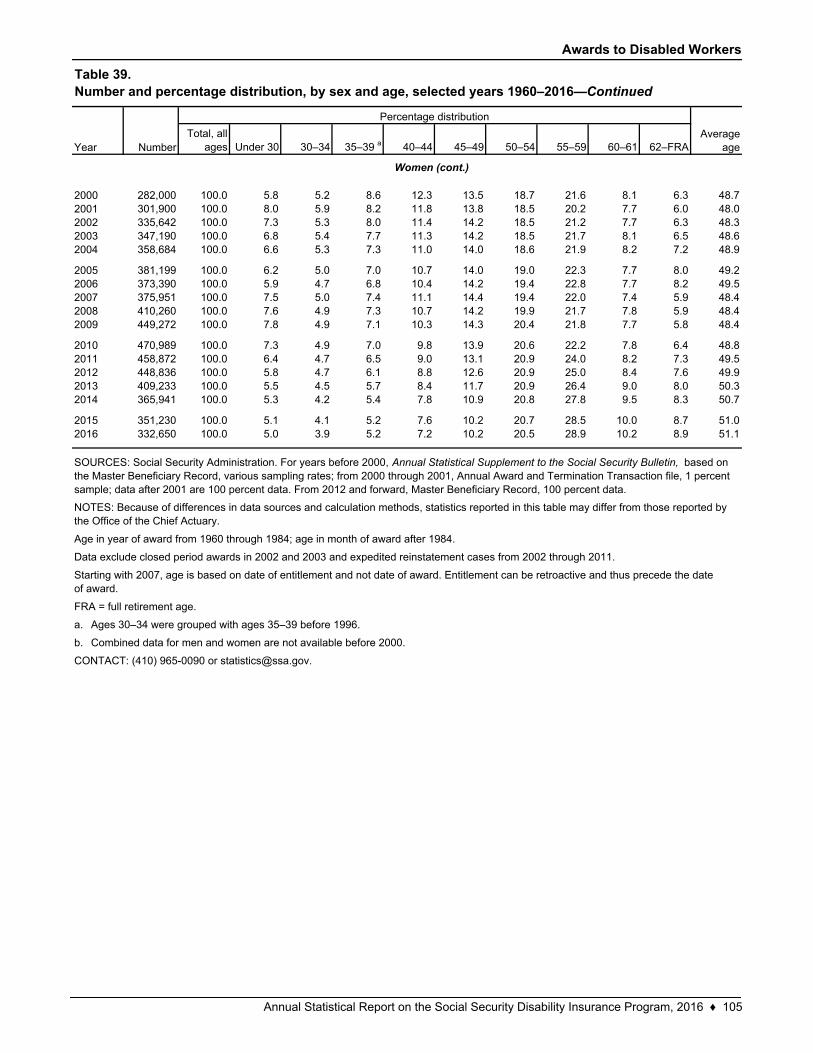
Awards to Disabled Workers
Total, all ages Under 30 30–34 35–39 a 40–44 45–49 50–54 55–59 60–61 62–FRA
282,000 100.0 5.8 5.2 8.6 12.3 13.5 18.7 21.6 8.1 6.3 48.7301,900 100.0 8.0 5.9 8.2 11.8 13.8 18.5 20.2 7.7 6.0 48.0335,642 100.0 7.3 5.3 8.0 11.4 14.2 18.5 21.2 7.7 6.3 48.3347,190 100.0 6.8 5.4 7.7 11.3 14.2 18.5 21.7 8.1 6.5 48.6358,684 100.0 6.6 5.3 7.3 11.0 14.0 18.6 21.9 8.2 7.2 48.9
381,199 100.0 6.2 5.0 7.0 10.7 14.0 19.0 22.3 7.7 8.0 49.2373,390 100.0 5.9 4.7 6.8 10.4 14.2 19.4 22.8 7.7 8.2 49.5375,951 100.0 7.5 5.0 7.4 11.1 14.4 19.4 22.0 7.4 5.9 48.4410,260 100.0 7.6 4.9 7.3 10.7 14.2 19.9 21.7 7.8 5.9 48.4449,272 100.0 7.8 4.9 7.1 10.3 14.3 20.4 21.8 7.7 5.8 48.4
470,989 100.0 7.3 4.9 7.0 9.8 13.9 20.6 22.2 7.8 6.4 48.8458,872 100.0 6.4 4.7 6.5 9.0 13.1 20.9 24.0 8.2 7.3 49.5448,836 100.0 5.8 4.7 6.1 8.8 12.6 20.9 25.0 8.4 7.6 49.9409,233 100.0 5.5 4.5 5.7 8.4 11.7 20.9 26.4 9.0 8.0 50.3365,941 100.0 5.3 4.2 5.4 7.8 10.9 20.8 27.8 9.5 8.3 50.7
351,230 100.0 5.1 4.1 5.2 7.6 10.2 20.7 28.5 10.0 8.7 51.0332,650 100.0 5.0 3.9 5.2 7.2 10.2 20.5 28.9 10.2 8.9 51.1
a.
b.
CONTACT: (410) 965-0090 or [email protected].
Combined data for men and women are not available before 2000.
201220132014
20152016
Ages 30–34 were grouped with ages 35–39 before 1996.
2006200720082009
20102011
Data exclude closed period awards in 2002 and 2003 and expedited reinstatement cases from 2002 through 2011.
Starting with 2007, age is based on date of entitlement and not date of award. Entitlement can be retroactive and thus precede the date of award.
FRA = full retirement age.
20002001200220032004
2005
SOURCES: Social Security Administration. For years before 2000, Annual Statistical Supplement to the Social Security Bulletin, based on the Master Beneficiary Record, various sampling rates; from 2000 through 2001, Annual Award and Termination Transaction file, 1 percent sample; data after 2001 are 100 percent data. From 2012 and forward, Master Beneficiary Record, 100 percent data.
NOTES: Because of differences in data sources and calculation methods, statistics reported in this table may differ from those reported by the Office of the Chief Actuary.
Age in year of award from 1960 through 1984; age in month of award after 1984.
Table 39.Number and percentage distribution, by sex and age, selected years 1960–2016—Continued
Year Number
Percentage distribution
Average age
Women (cont.)
Annual Statistical Report on the Social Security Disability Insurance Program, 2016 ♦ 105
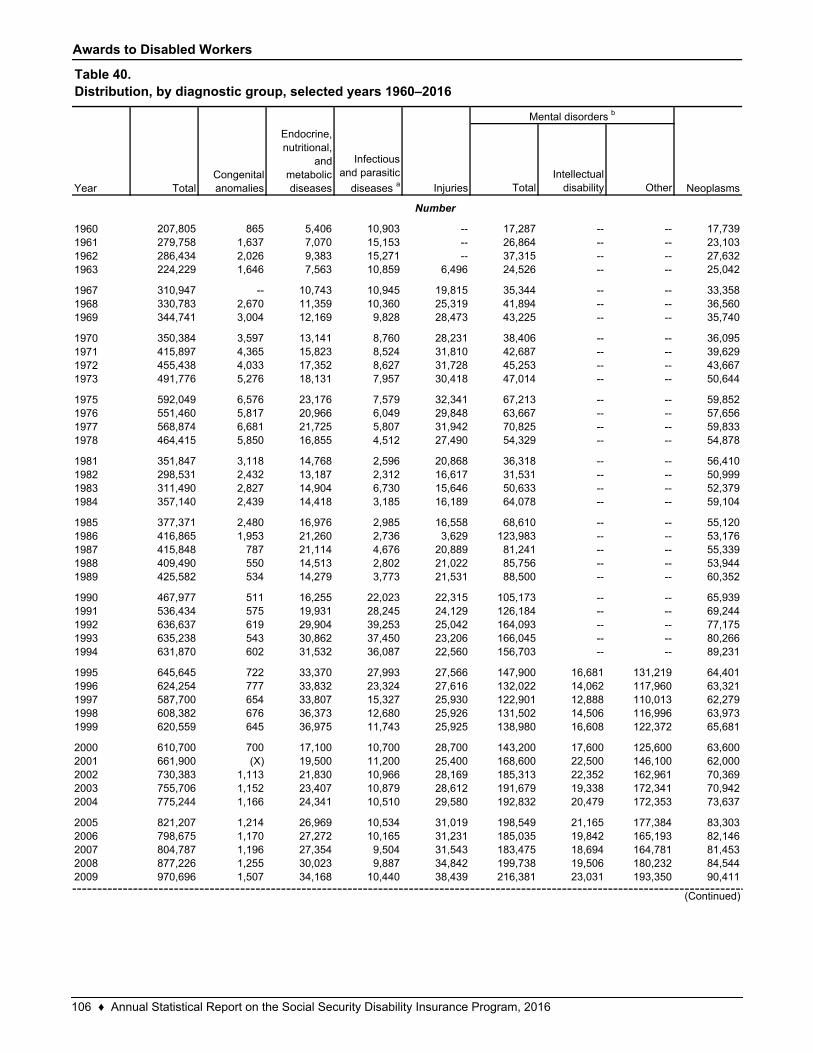
Awards to Disabled Workers
TotalIntellectual
disability Other
207,805 865 5,406 10,903 -- 17,287 -- -- 17,739279,758 1,637 7,070 15,153 -- 26,864 -- -- 23,103286,434 2,026 9,383 15,271 -- 37,315 -- -- 27,632224,229 1,646 7,563 10,859 6,496 24,526 -- -- 25,042
310,947 -- 10,743 10,945 19,815 35,344 -- -- 33,358330,783 2,670 11,359 10,360 25,319 41,894 -- -- 36,560344,741 3,004 12,169 9,828 28,473 43,225 -- -- 35,740
350,384 3,597 13,141 8,760 28,231 38,406 -- -- 36,095415,897 4,365 15,823 8,524 31,810 42,687 -- -- 39,629455,438 4,033 17,352 8,627 31,728 45,253 -- -- 43,667491,776 5,276 18,131 7,957 30,418 47,014 -- -- 50,644
592,049 6,576 23,176 7,579 32,341 67,213 -- -- 59,852551,460 5,817 20,966 6,049 29,848 63,667 -- -- 57,656568,874 6,681 21,725 5,807 31,942 70,825 -- -- 59,833464,415 5,850 16,855 4,512 27,490 54,329 -- -- 54,878
351,847 3,118 14,768 2,596 20,868 36,318 -- -- 56,410298,531 2,432 13,187 2,312 16,617 31,531 -- -- 50,999311,490 2,827 14,904 6,730 15,646 50,633 -- -- 52,379357,140 2,439 14,418 3,185 16,189 64,078 -- -- 59,104
377,371 2,480 16,976 2,985 16,558 68,610 -- -- 55,120416,865 1,953 21,260 2,736 3,629 123,983 -- -- 53,176415,848 787 21,114 4,676 20,889 81,241 -- -- 55,339409,490 550 14,513 2,802 21,022 85,756 -- -- 53,944425,582 534 14,279 3,773 21,531 88,500 -- -- 60,352
467,977 511 16,255 22,023 22,315 105,173 -- -- 65,939536,434 575 19,931 28,245 24,129 126,184 -- -- 69,244636,637 619 29,904 39,253 25,042 164,093 -- -- 77,175635,238 543 30,862 37,450 23,206 166,045 -- -- 80,266631,870 602 31,532 36,087 22,560 156,703 -- -- 89,231
645,645 722 33,370 27,993 27,566 147,900 16,681 131,219 64,401624,254 777 33,832 23,324 27,616 132,022 14,062 117,960 63,321587,700 654 33,807 15,327 25,930 122,901 12,888 110,013 62,279608,382 676 36,373 12,680 25,926 131,502 14,506 116,996 63,973620,559 645 36,975 11,743 25,925 138,980 16,608 122,372 65,681
610,700 700 17,100 10,700 28,700 143,200 17,600 125,600 63,600661,900 (X) 19,500 11,200 25,400 168,600 22,500 146,100 62,000730,383 1,113 21,830 10,966 28,169 185,313 22,352 162,961 70,369755,706 1,152 23,407 10,879 28,612 191,679 19,338 172,341 70,942775,244 1,166 24,341 10,510 29,580 192,832 20,479 172,353 73,637
821,207 1,214 26,969 10,534 31,019 198,549 21,165 177,384 83,303798,675 1,170 27,272 10,165 31,231 185,035 19,842 165,193 82,146804,787 1,196 27,354 9,504 31,543 183,475 18,694 164,781 81,453877,226 1,255 30,023 9,887 34,842 199,738 19,506 180,232 84,544970,696 1,507 34,168 10,440 38,439 216,381 23,031 193,350 90,411
200720082009
2001200220032004
20052006
19951996199719981999
2000
1989
19901991199219931994
19831984
1985198619871988
1975197619771978
19811982
Year
1960196119621963
1967
Neoplasms
19681969
1970197119721973
TotalCongenital anomalies
Endocrine, nutritional,
and metabolic diseases
Infectious and parasitic
diseases a Injuries
Mental disorders b
Table 40.Distribution, by diagnostic group, selected years 1960–2016
Number
(Continued)
106 ♦ Annual Statistical Report on the Social Security Disability Insurance Program, 2016
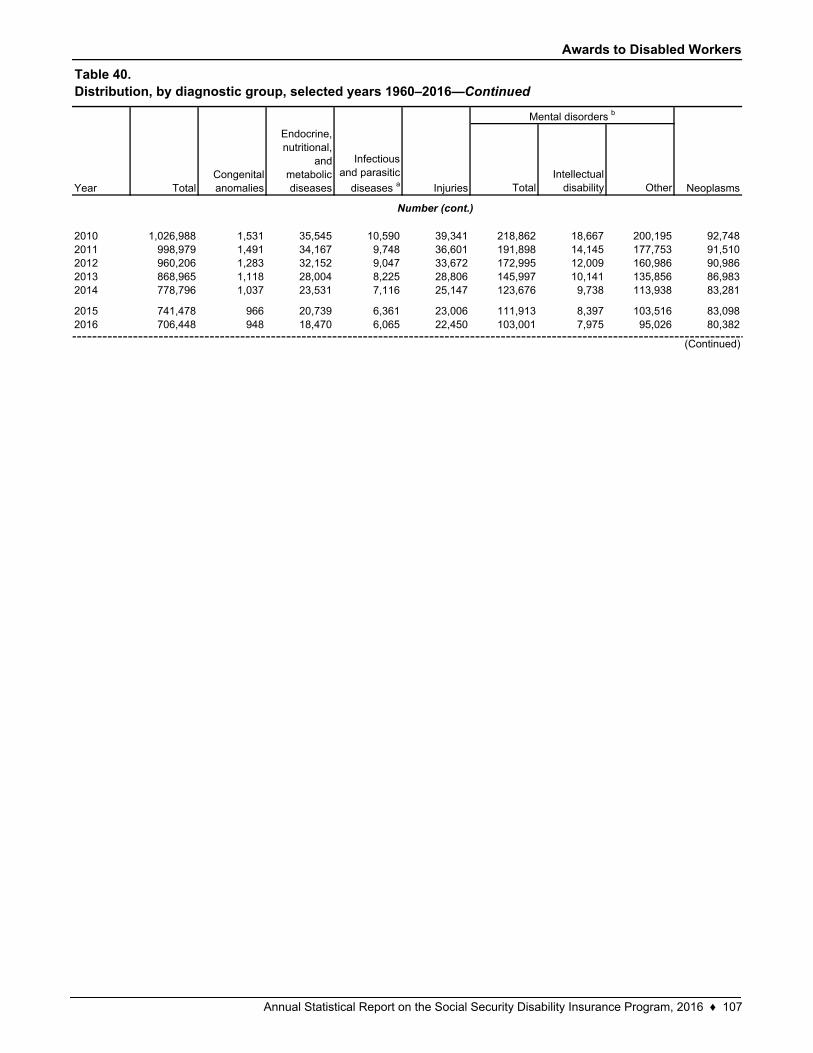
Awards to Disabled Workers
TotalIntellectual
disability Other
1,026,988 1,531 35,545 10,590 39,341 218,862 18,667 200,195 92,748998,979 1,491 34,167 9,748 36,601 191,898 14,145 177,753 91,510960,206 1,283 32,152 9,047 33,672 172,995 12,009 160,986 90,986868,965 1,118 28,004 8,225 28,806 145,997 10,141 135,856 86,983778,796 1,037 23,531 7,116 25,147 123,676 9,738 113,938 83,281
741,478 966 20,739 6,361 23,006 111,913 8,397 103,516 83,098706,448 948 18,470 6,065 22,450 103,001 7,975 95,026 80,382
20132014
20152016
201020112012
(Continued)
Table 40.Distribution, by diagnostic group, selected years 1960–2016—Continued
Year TotalCongenital anomalies
Endocrine, nutritional,
and metabolic diseases
Infectious and parasitic
diseases a Injuries
Mental disorders b
Neoplasms
Number (cont.)
Annual Statistical Report on the Social Security Disability Insurance Program, 2016 ♦ 107
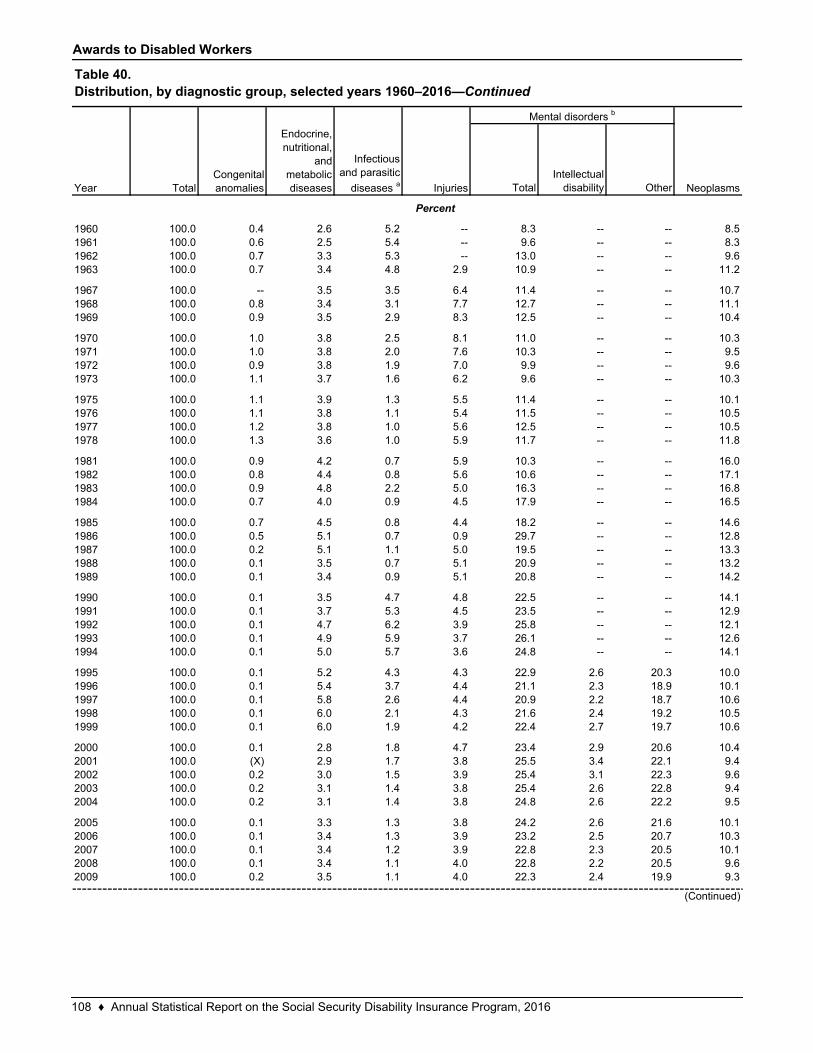
Awards to Disabled Workers
TotalIntellectual
disability Other
100.0 0.4 2.6 5.2 -- 8.3 -- -- 8.5100.0 0.6 2.5 5.4 -- 9.6 -- -- 8.3100.0 0.7 3.3 5.3 -- 13.0 -- -- 9.6100.0 0.7 3.4 4.8 2.9 10.9 -- -- 11.2
100.0 -- 3.5 3.5 6.4 11.4 -- -- 10.7100.0 0.8 3.4 3.1 7.7 12.7 -- -- 11.1100.0 0.9 3.5 2.9 8.3 12.5 -- -- 10.4
100.0 1.0 3.8 2.5 8.1 11.0 -- -- 10.3100.0 1.0 3.8 2.0 7.6 10.3 -- -- 9.5100.0 0.9 3.8 1.9 7.0 9.9 -- -- 9.6100.0 1.1 3.7 1.6 6.2 9.6 -- -- 10.3
100.0 1.1 3.9 1.3 5.5 11.4 -- -- 10.1100.0 1.1 3.8 1.1 5.4 11.5 -- -- 10.5100.0 1.2 3.8 1.0 5.6 12.5 -- -- 10.5100.0 1.3 3.6 1.0 5.9 11.7 -- -- 11.8
100.0 0.9 4.2 0.7 5.9 10.3 -- -- 16.0100.0 0.8 4.4 0.8 5.6 10.6 -- -- 17.1100.0 0.9 4.8 2.2 5.0 16.3 -- -- 16.8100.0 0.7 4.0 0.9 4.5 17.9 -- -- 16.5
100.0 0.7 4.5 0.8 4.4 18.2 -- -- 14.6100.0 0.5 5.1 0.7 0.9 29.7 -- -- 12.8100.0 0.2 5.1 1.1 5.0 19.5 -- -- 13.3100.0 0.1 3.5 0.7 5.1 20.9 -- -- 13.2100.0 0.1 3.4 0.9 5.1 20.8 -- -- 14.2
100.0 0.1 3.5 4.7 4.8 22.5 -- -- 14.1100.0 0.1 3.7 5.3 4.5 23.5 -- -- 12.9100.0 0.1 4.7 6.2 3.9 25.8 -- -- 12.1100.0 0.1 4.9 5.9 3.7 26.1 -- -- 12.6100.0 0.1 5.0 5.7 3.6 24.8 -- -- 14.1
100.0 0.1 5.2 4.3 4.3 22.9 2.6 20.3 10.0100.0 0.1 5.4 3.7 4.4 21.1 2.3 18.9 10.1100.0 0.1 5.8 2.6 4.4 20.9 2.2 18.7 10.6100.0 0.1 6.0 2.1 4.3 21.6 2.4 19.2 10.5100.0 0.1 6.0 1.9 4.2 22.4 2.7 19.7 10.6
100.0 0.1 2.8 1.8 4.7 23.4 2.9 20.6 10.4100.0 (X) 2.9 1.7 3.8 25.5 3.4 22.1 9.4100.0 0.2 3.0 1.5 3.9 25.4 3.1 22.3 9.6100.0 0.2 3.1 1.4 3.8 25.4 2.6 22.8 9.4100.0 0.2 3.1 1.4 3.8 24.8 2.6 22.2 9.5
100.0 0.1 3.3 1.3 3.8 24.2 2.6 21.6 10.1100.0 0.1 3.4 1.3 3.9 23.2 2.5 20.7 10.3100.0 0.1 3.4 1.2 3.9 22.8 2.3 20.5 10.1100.0 0.1 3.4 1.1 4.0 22.8 2.2 20.5 9.6100.0 0.2 3.5 1.1 4.0 22.3 2.4 19.9 9.3
2004
20052006200720082009
19981999
2000200120022003
199219931994
199519961997
1986198719881989
19901991
1978
1981198219831984
1985
197119721973
197519761977
19621963
196719681969
1970
19601961
Percent
Table 40.Distribution, by diagnostic group, selected years 1960–2016—Continued
Year TotalCongenital anomalies
Endocrine, nutritional,
and metabolic diseases
Infectious and parasitic
diseases a
(Continued)
Injuries
Mental disorders b
Neoplasms
108 ♦ Annual Statistical Report on the Social Security Disability Insurance Program, 2016
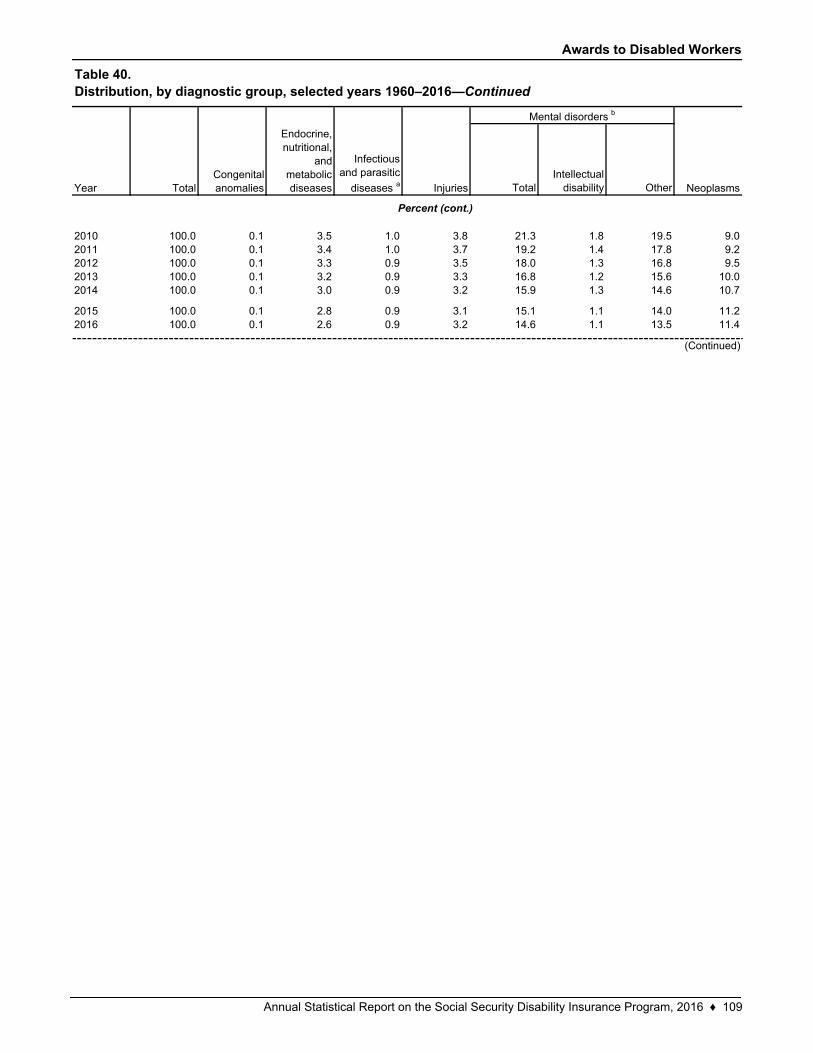
Awards to Disabled Workers
TotalIntellectual
disability Other
100.0 0.1 3.5 1.0 3.8 21.3 1.8 19.5 9.0100.0 0.1 3.4 1.0 3.7 19.2 1.4 17.8 9.2100.0 0.1 3.3 0.9 3.5 18.0 1.3 16.8 9.5100.0 0.1 3.2 0.9 3.3 16.8 1.2 15.6 10.0100.0 0.1 3.0 0.9 3.2 15.9 1.3 14.6 10.7
100.0 0.1 2.8 0.9 3.1 15.1 1.1 14.0 11.2100.0 0.1 2.6 0.9 3.2 14.6 1.1 13.5 11.42016
20102011201220132014
2015
(Continued)
Percent (cont.)
Table 40.Distribution, by diagnostic group, selected years 1960–2016—Continued
Year TotalCongenital anomalies
Endocrine, nutritional,
and metabolic diseases
Infectious and parasitic
diseases a Injuries
Mental disorders b
Neoplasms
Annual Statistical Report on the Social Security Disability Insurance Program, 2016 ♦ 109
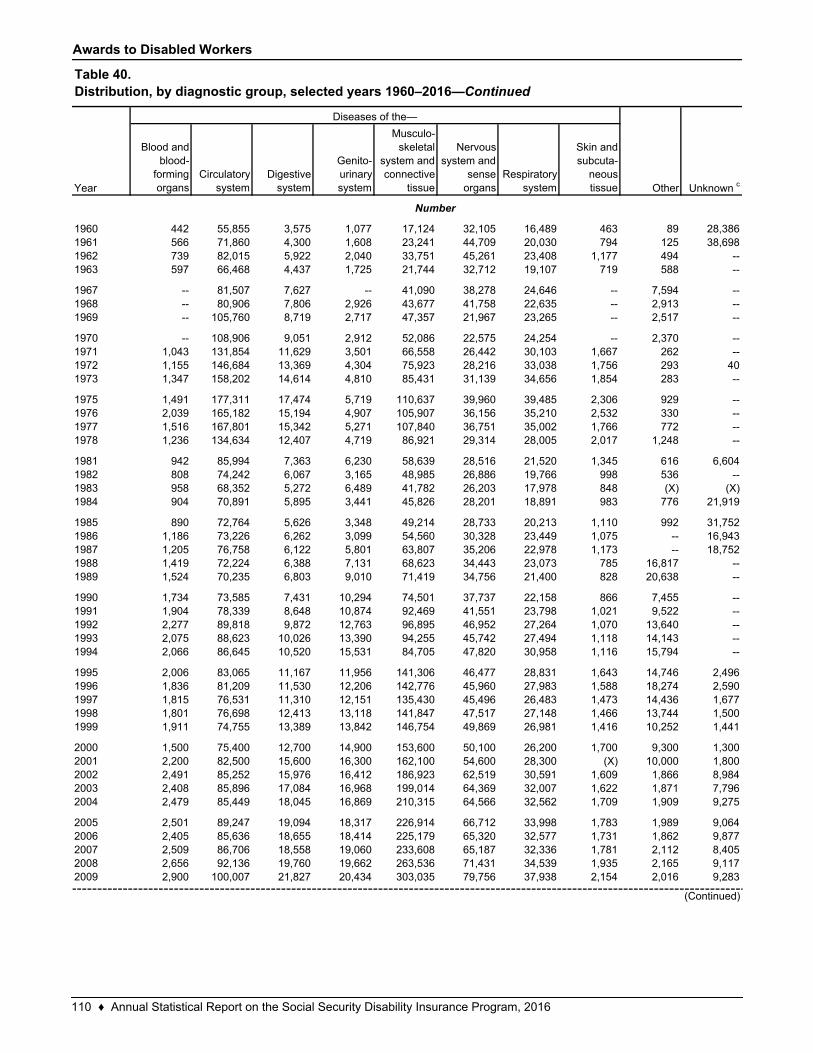
Awards to Disabled Workers
Blood and blood-
forming organs
Circulatory system
Digestive system
Genito-urinary system
Musculo-skeletal
system and connective
tissue
Nervous system and
sense organs
Respiratory system
Skin and subcuta-
neous tissue
442 55,855 3,575 1,077 17,124 32,105 16,489 463 89 28,386566 71,860 4,300 1,608 23,241 44,709 20,030 794 125 38,698739 82,015 5,922 2,040 33,751 45,261 23,408 1,177 494 --597 66,468 4,437 1,725 21,744 32,712 19,107 719 588 --
-- 81,507 7,627 -- 41,090 38,278 24,646 -- 7,594 ---- 80,906 7,806 2,926 43,677 41,758 22,635 -- 2,913 ---- 105,760 8,719 2,717 47,357 21,967 23,265 -- 2,517 --
-- 108,906 9,051 2,912 52,086 22,575 24,254 -- 2,370 --1,043 131,854 11,629 3,501 66,558 26,442 30,103 1,667 262 --1,155 146,684 13,369 4,304 75,923 28,216 33,038 1,756 293 401,347 158,202 14,614 4,810 85,431 31,139 34,656 1,854 283 --
1,491 177,311 17,474 5,719 110,637 39,960 39,485 2,306 929 --2,039 165,182 15,194 4,907 105,907 36,156 35,210 2,532 330 --1,516 167,801 15,342 5,271 107,840 36,751 35,002 1,766 772 --1,236 134,634 12,407 4,719 86,921 29,314 28,005 2,017 1,248 --
942 85,994 7,363 6,230 58,639 28,516 21,520 1,345 616 6,604808 74,242 6,067 3,165 48,985 26,886 19,766 998 536 --958 68,352 5,272 6,489 41,782 26,203 17,978 848 (X) (X)904 70,891 5,895 3,441 45,826 28,201 18,891 983 776 21,919
890 72,764 5,626 3,348 49,214 28,733 20,213 1,110 992 31,7521,186 73,226 6,262 3,099 54,560 30,328 23,449 1,075 -- 16,9431,205 76,758 6,122 5,801 63,807 35,206 22,978 1,173 -- 18,7521,419 72,224 6,388 7,131 68,623 34,443 23,073 785 16,817 --1,524 70,235 6,803 9,010 71,419 34,756 21,400 828 20,638 --
1,734 73,585 7,431 10,294 74,501 37,737 22,158 866 7,455 --1,904 78,339 8,648 10,874 92,469 41,551 23,798 1,021 9,522 --2,277 89,818 9,872 12,763 96,895 46,952 27,264 1,070 13,640 --2,075 88,623 10,026 13,390 94,255 45,742 27,494 1,118 14,143 --2,066 86,645 10,520 15,531 84,705 47,820 30,958 1,116 15,794 --
2,006 83,065 11,167 11,956 141,306 46,477 28,831 1,643 14,746 2,4961,836 81,209 11,530 12,206 142,776 45,960 27,983 1,588 18,274 2,5901,815 76,531 11,310 12,151 135,430 45,496 26,483 1,473 14,436 1,6771,801 76,698 12,413 13,118 141,847 47,517 27,148 1,466 13,744 1,5001,911 74,755 13,389 13,842 146,754 49,869 26,981 1,416 10,252 1,441
1,500 75,400 12,700 14,900 153,600 50,100 26,200 1,700 9,300 1,3002,200 82,500 15,600 16,300 162,100 54,600 28,300 (X) 10,000 1,8002,491 85,252 15,976 16,412 186,923 62,519 30,591 1,609 1,866 8,9842,408 85,896 17,084 16,968 199,014 64,369 32,007 1,622 1,871 7,7962,479 85,449 18,045 16,869 210,315 64,566 32,562 1,709 1,909 9,275
2,501 89,247 19,094 18,317 226,914 66,712 33,998 1,783 1,989 9,0642,405 85,636 18,655 18,414 225,179 65,320 32,577 1,731 1,862 9,8772,509 86,706 18,558 19,060 233,608 65,187 32,336 1,781 2,112 8,4052,656 92,136 19,760 19,662 263,536 71,431 34,539 1,935 2,165 9,1172,900 100,007 21,827 20,434 303,035 79,756 37,938 2,154 2,016 9,283
Unknown c
Diseases of the—
Other
197519761977
19621963
196719681969
1970197119721973
Year
19601961
1978
1981198219831984
19851986198719881989
19901991199219931994
19951996199719981999
20002001200220032004
20052006200720082009
Table 40.Distribution, by diagnostic group, selected years 1960–2016—Continued
Number
(Continued)
110 ♦ Annual Statistical Report on the Social Security Disability Insurance Program, 2016
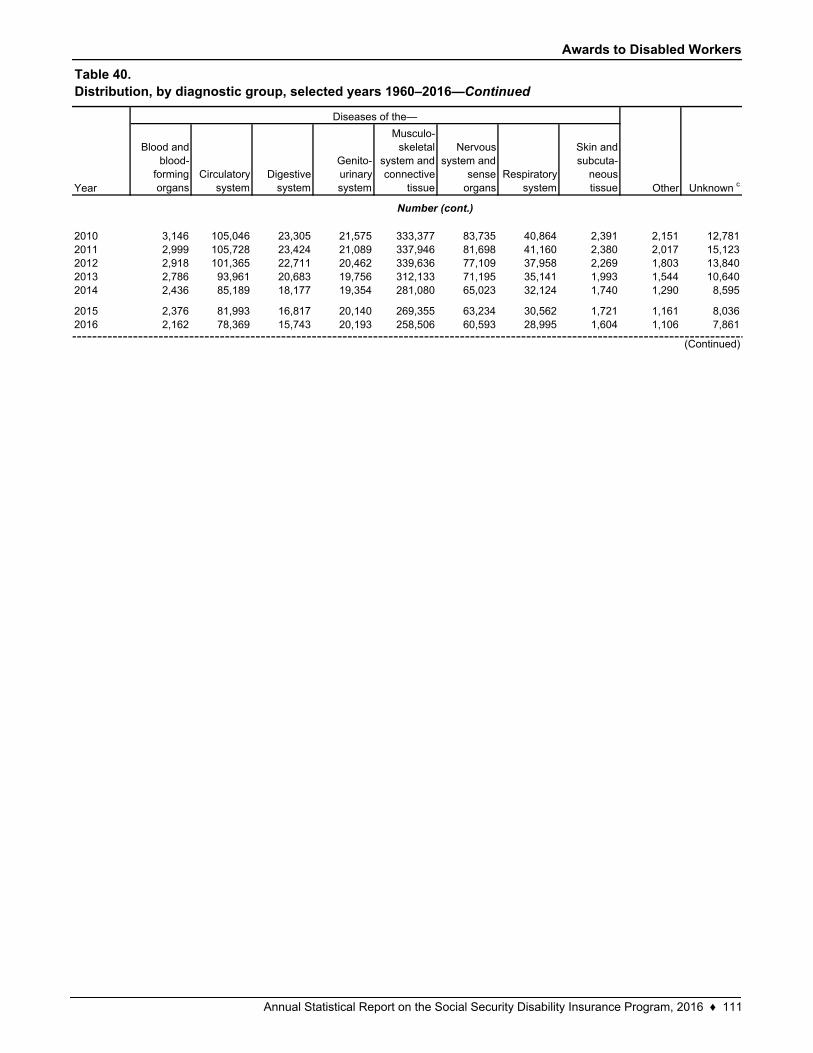
Awards to Disabled Workers
Blood and blood-
forming organs
Circulatory system
Digestive system
Genito-urinary system
Musculo-skeletal
system and connective
tissue
Nervous system and
sense organs
Respiratory system
Skin and subcuta-
neous tissue
3,146 105,046 23,305 21,575 333,377 83,735 40,864 2,391 2,151 12,7812,999 105,728 23,424 21,089 337,946 81,698 41,160 2,380 2,017 15,1232,918 101,365 22,711 20,462 339,636 77,109 37,958 2,269 1,803 13,8402,786 93,961 20,683 19,756 312,133 71,195 35,141 1,993 1,544 10,6402,436 85,189 18,177 19,354 281,080 65,023 32,124 1,740 1,290 8,595
2,376 81,993 16,817 20,140 269,355 63,234 30,562 1,721 1,161 8,0362,162 78,369 15,743 20,193 258,506 60,593 28,995 1,604 1,106 7,861
20102011201220132014
2015
(Continued)
Table 40.Distribution, by diagnostic group, selected years 1960–2016—Continued
Year
Diseases of the—
Other Unknown c
2016
Number (cont.)
Annual Statistical Report on the Social Security Disability Insurance Program, 2016 ♦ 111
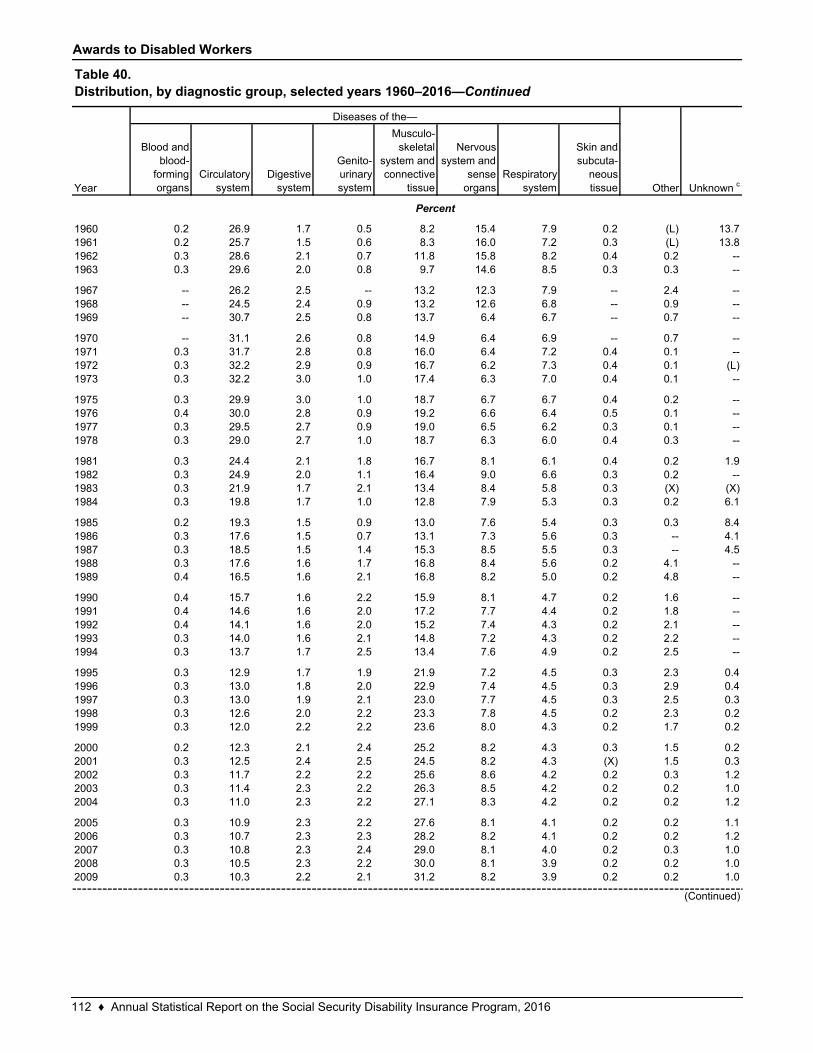
Awards to Disabled Workers
Blood and blood-
forming organs
Circulatory system
Digestive system
Genito-urinary system
Musculo-skeletal
system and connective
tissue
Nervous system and
sense organs
Respiratory system
Skin and subcuta-
neous tissue
0.2 26.9 1.7 0.5 8.2 15.4 7.9 0.2 (L) 13.70.2 25.7 1.5 0.6 8.3 16.0 7.2 0.3 (L) 13.80.3 28.6 2.1 0.7 11.8 15.8 8.2 0.4 0.2 --0.3 29.6 2.0 0.8 9.7 14.6 8.5 0.3 0.3 --
-- 26.2 2.5 -- 13.2 12.3 7.9 -- 2.4 ---- 24.5 2.4 0.9 13.2 12.6 6.8 -- 0.9 ---- 30.7 2.5 0.8 13.7 6.4 6.7 -- 0.7 --
-- 31.1 2.6 0.8 14.9 6.4 6.9 -- 0.7 --0.3 31.7 2.8 0.8 16.0 6.4 7.2 0.4 0.1 --0.3 32.2 2.9 0.9 16.7 6.2 7.3 0.4 0.1 (L)0.3 32.2 3.0 1.0 17.4 6.3 7.0 0.4 0.1 --
0.3 29.9 3.0 1.0 18.7 6.7 6.7 0.4 0.2 --0.4 30.0 2.8 0.9 19.2 6.6 6.4 0.5 0.1 --0.3 29.5 2.7 0.9 19.0 6.5 6.2 0.3 0.1 --0.3 29.0 2.7 1.0 18.7 6.3 6.0 0.4 0.3 --
0.3 24.4 2.1 1.8 16.7 8.1 6.1 0.4 0.2 1.90.3 24.9 2.0 1.1 16.4 9.0 6.6 0.3 0.2 --0.3 21.9 1.7 2.1 13.4 8.4 5.8 0.3 (X) (X)0.3 19.8 1.7 1.0 12.8 7.9 5.3 0.3 0.2 6.1
0.2 19.3 1.5 0.9 13.0 7.6 5.4 0.3 0.3 8.40.3 17.6 1.5 0.7 13.1 7.3 5.6 0.3 -- 4.10.3 18.5 1.5 1.4 15.3 8.5 5.5 0.3 -- 4.50.3 17.6 1.6 1.7 16.8 8.4 5.6 0.2 4.1 --0.4 16.5 1.6 2.1 16.8 8.2 5.0 0.2 4.8 --
0.4 15.7 1.6 2.2 15.9 8.1 4.7 0.2 1.6 --0.4 14.6 1.6 2.0 17.2 7.7 4.4 0.2 1.8 --0.4 14.1 1.6 2.0 15.2 7.4 4.3 0.2 2.1 --0.3 14.0 1.6 2.1 14.8 7.2 4.3 0.2 2.2 --0.3 13.7 1.7 2.5 13.4 7.6 4.9 0.2 2.5 --
0.3 12.9 1.7 1.9 21.9 7.2 4.5 0.3 2.3 0.40.3 13.0 1.8 2.0 22.9 7.4 4.5 0.3 2.9 0.40.3 13.0 1.9 2.1 23.0 7.7 4.5 0.3 2.5 0.30.3 12.6 2.0 2.2 23.3 7.8 4.5 0.2 2.3 0.20.3 12.0 2.2 2.2 23.6 8.0 4.3 0.2 1.7 0.2
0.2 12.3 2.1 2.4 25.2 8.2 4.3 0.3 1.5 0.20.3 12.5 2.4 2.5 24.5 8.2 4.3 (X) 1.5 0.30.3 11.7 2.2 2.2 25.6 8.6 4.2 0.2 0.3 1.20.3 11.4 2.3 2.2 26.3 8.5 4.2 0.2 0.2 1.00.3 11.0 2.3 2.2 27.1 8.3 4.2 0.2 0.2 1.2
0.3 10.9 2.3 2.2 27.6 8.1 4.1 0.2 0.2 1.10.3 10.7 2.3 2.3 28.2 8.2 4.1 0.2 0.2 1.20.3 10.8 2.3 2.4 29.0 8.1 4.0 0.2 0.3 1.00.3 10.5 2.3 2.2 30.0 8.1 3.9 0.2 0.2 1.00.3 10.3 2.2 2.1 31.2 8.2 3.9 0.2 0.2 1.0
1960196119621963
196719681969
1970197119721973
1975197619771978
1981198219831984
19851986198719881989
19901991199219931994
19951996199719981999
20002001200220032004
20052006200720082009
Percent
Table 40.Distribution, by diagnostic group, selected years 1960–2016—Continued
Other Unknown c
(Continued)
Year
Diseases of the—
112 ♦ Annual Statistical Report on the Social Security Disability Insurance Program, 2016
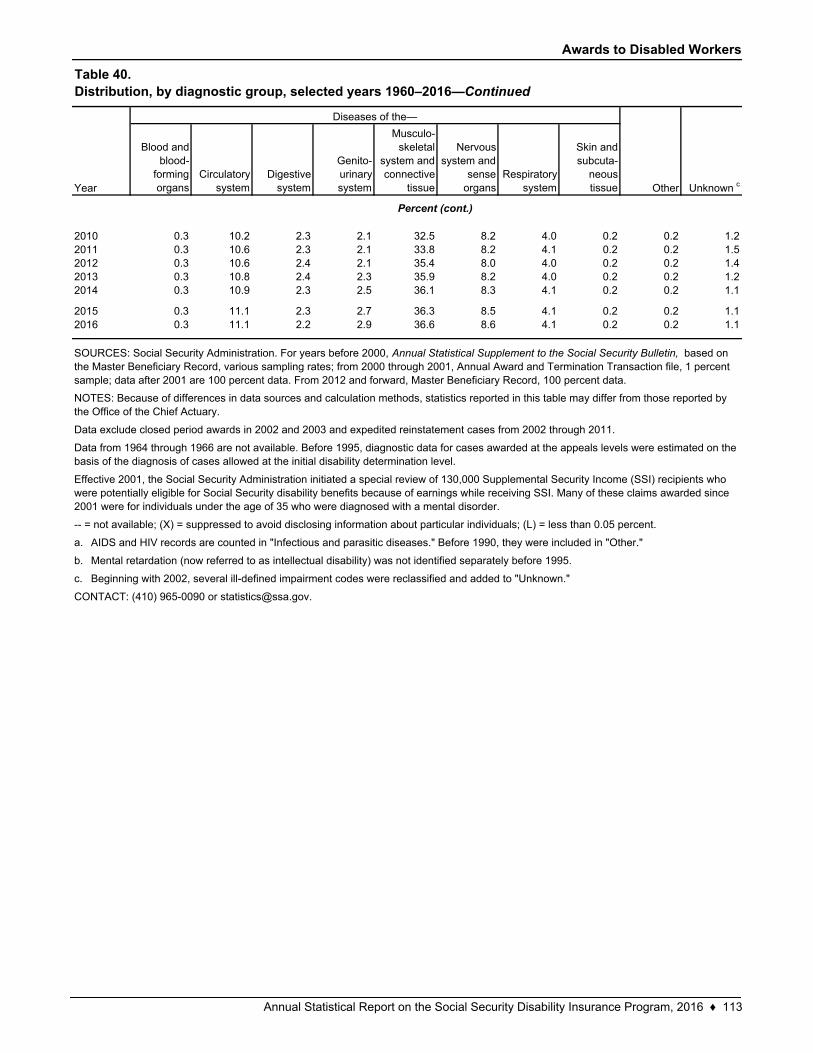
Awards to Disabled Workers
Blood and blood-
forming organs
Circulatory system
Digestive system
Genito-urinary system
Musculo-skeletal
system and connective
tissue
Nervous system and
sense organs
Respiratory system
Skin and subcuta-
neous tissue
0.3 10.2 2.3 2.1 32.5 8.2 4.0 0.2 0.2 1.20.3 10.6 2.3 2.1 33.8 8.2 4.1 0.2 0.2 1.50.3 10.6 2.4 2.1 35.4 8.0 4.0 0.2 0.2 1.40.3 10.8 2.4 2.3 35.9 8.2 4.0 0.2 0.2 1.20.3 10.9 2.3 2.5 36.1 8.3 4.1 0.2 0.2 1.1
0.3 11.1 2.3 2.7 36.3 8.5 4.1 0.2 0.2 1.10.3 11.1 2.2 2.9 36.6 8.6 4.1 0.2 0.2 1.1
a.
b.
c.
20102011201220132014
20152016
SOURCES: Social Security Administration. For years before 2000, Annual Statistical Supplement to the Social Security Bulletin, based on the Master Beneficiary Record, various sampling rates; from 2000 through 2001, Annual Award and Termination Transaction file, 1 percent sample; data after 2001 are 100 percent data. From 2012 and forward, Master Beneficiary Record, 100 percent data.
NOTES: Because of differences in data sources and calculation methods, statistics reported in this table may differ from those reported by the Office of the Chief Actuary.
Data exclude closed period awards in 2002 and 2003 and expedited reinstatement cases from 2002 through 2011.
Data from 1964 through 1966 are not available. Before 1995, diagnostic data for cases awarded at the appeals levels were estimated on the basis of the diagnosis of cases allowed at the initial disability determination level.
Effective 2001, the Social Security Administration initiated a special review of 130,000 Supplemental Security Income (SSI) recipients who were potentially eligible for Social Security disability benefits because of earnings while receiving SSI. Many of these claims awarded since 2001 were for individuals under the age of 35 who were diagnosed with a mental disorder.
-- = not available; (X) = suppressed to avoid disclosing information about particular individuals; (L) = less than 0.05 percent.
AIDS and HIV records are counted in "Infectious and parasitic diseases." Before 1990, they were included in "Other."
Mental retardation (now referred to as intellectual disability) was not identified separately before 1995.
Beginning with 2002, several ill-defined impairment codes were reclassified and added to "Unknown."
CONTACT: (410) 965-0090 or [email protected].
Percent (cont.)
Table 40.Distribution, by diagnostic group, selected years 1960–2016—Continued
Year
Diseases of the—
Other Unknown c
Annual Statistical Report on the Social Security Disability Insurance Program, 2016 ♦ 113
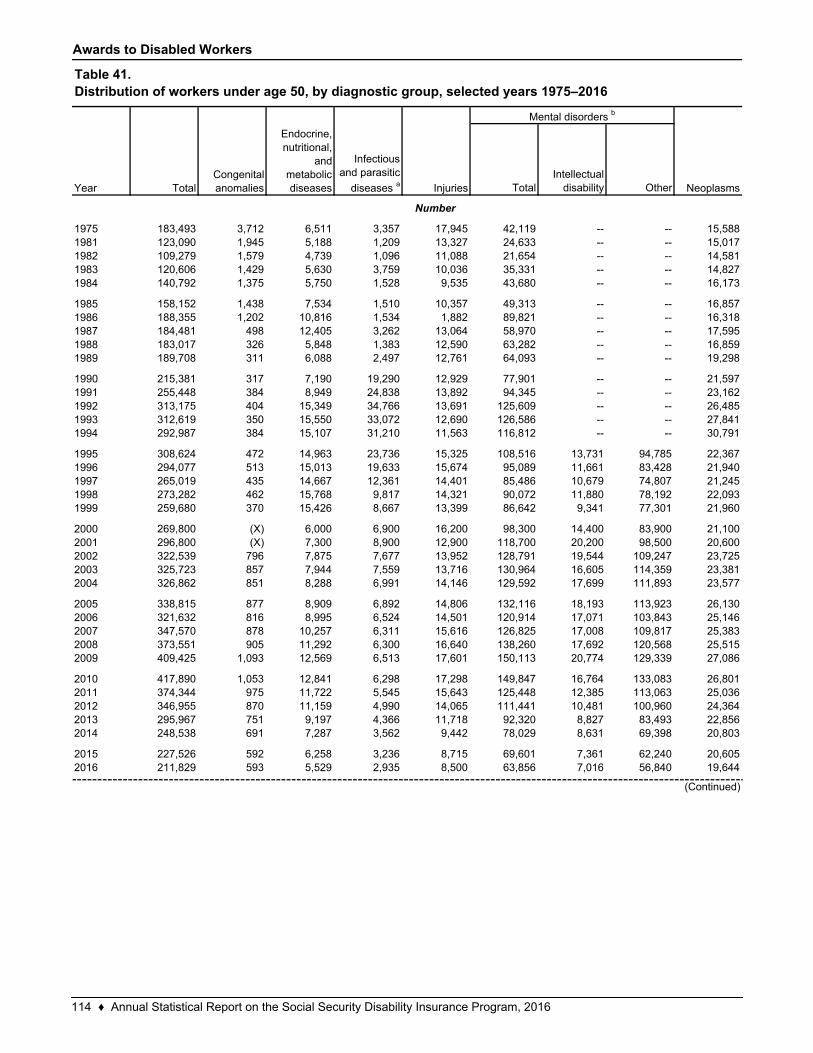
Awards to Disabled Workers
TotalIntellectual
disability Other
183,493 3,712 6,511 3,357 17,945 42,119 -- -- 15,588123,090 1,945 5,188 1,209 13,327 24,633 -- -- 15,017109,279 1,579 4,739 1,096 11,088 21,654 -- -- 14,581120,606 1,429 5,630 3,759 10,036 35,331 -- -- 14,827140,792 1,375 5,750 1,528 9,535 43,680 -- -- 16,173
158,152 1,438 7,534 1,510 10,357 49,313 -- -- 16,857188,355 1,202 10,816 1,534 1,882 89,821 -- -- 16,318184,481 498 12,405 3,262 13,064 58,970 -- -- 17,595183,017 326 5,848 1,383 12,590 63,282 -- -- 16,859189,708 311 6,088 2,497 12,761 64,093 -- -- 19,298
215,381 317 7,190 19,290 12,929 77,901 -- -- 21,597255,448 384 8,949 24,838 13,892 94,345 -- -- 23,162313,175 404 15,349 34,766 13,691 125,609 -- -- 26,485312,619 350 15,550 33,072 12,690 126,586 -- -- 27,841292,987 384 15,107 31,210 11,563 116,812 -- -- 30,791
308,624 472 14,963 23,736 15,325 108,516 13,731 94,785 22,367294,077 513 15,013 19,633 15,674 95,089 11,661 83,428 21,940265,019 435 14,667 12,361 14,401 85,486 10,679 74,807 21,245273,282 462 15,768 9,817 14,321 90,072 11,880 78,192 22,093259,680 370 15,426 8,667 13,399 86,642 9,341 77,301 21,960
269,800 (X) 6,000 6,900 16,200 98,300 14,400 83,900 21,100296,800 (X) 7,300 8,900 12,900 118,700 20,200 98,500 20,600322,539 796 7,875 7,677 13,952 128,791 19,544 109,247 23,725325,723 857 7,944 7,559 13,716 130,964 16,605 114,359 23,381326,862 851 8,288 6,991 14,146 129,592 17,699 111,893 23,577
338,815 877 8,909 6,892 14,806 132,116 18,193 113,923 26,130321,632 816 8,995 6,524 14,501 120,914 17,071 103,843 25,146347,570 878 10,257 6,311 15,616 126,825 17,008 109,817 25,383373,551 905 11,292 6,300 16,640 138,260 17,692 120,568 25,515409,425 1,093 12,569 6,513 17,601 150,113 20,774 129,339 27,086
417,890 1,053 12,841 6,298 17,298 149,847 16,764 133,083 26,801374,344 975 11,722 5,545 15,643 125,448 12,385 113,063 25,036346,955 870 11,159 4,990 14,065 111,441 10,481 100,960 24,364295,967 751 9,197 4,366 11,718 92,320 8,827 83,493 22,856248,538 691 7,287 3,562 9,442 78,029 8,631 69,398 20,803
227,526 592 6,258 3,236 8,715 69,601 7,361 62,240 20,605211,829 593 5,529 2,935 8,500 63,856 7,016 56,840 19,644
20082009
20102011201220132014
20152016
2007
1996199719981999
20002001200220032004
20052006
199219931994
1995
1984
19851986198719881989
Mental disorders b
Table 41.Distribution of workers under age 50, by diagnostic group, selected years 1975–2016
Year
19751981
NeoplasmsTotalCongenital anomalies
Endocrine, nutritional,
and metabolic diseases
Infectious and parasitic
diseases a Injuries
Number
(Continued)
19821983
19901991
114 ♦ Annual Statistical Report on the Social Security Disability Insurance Program, 2016
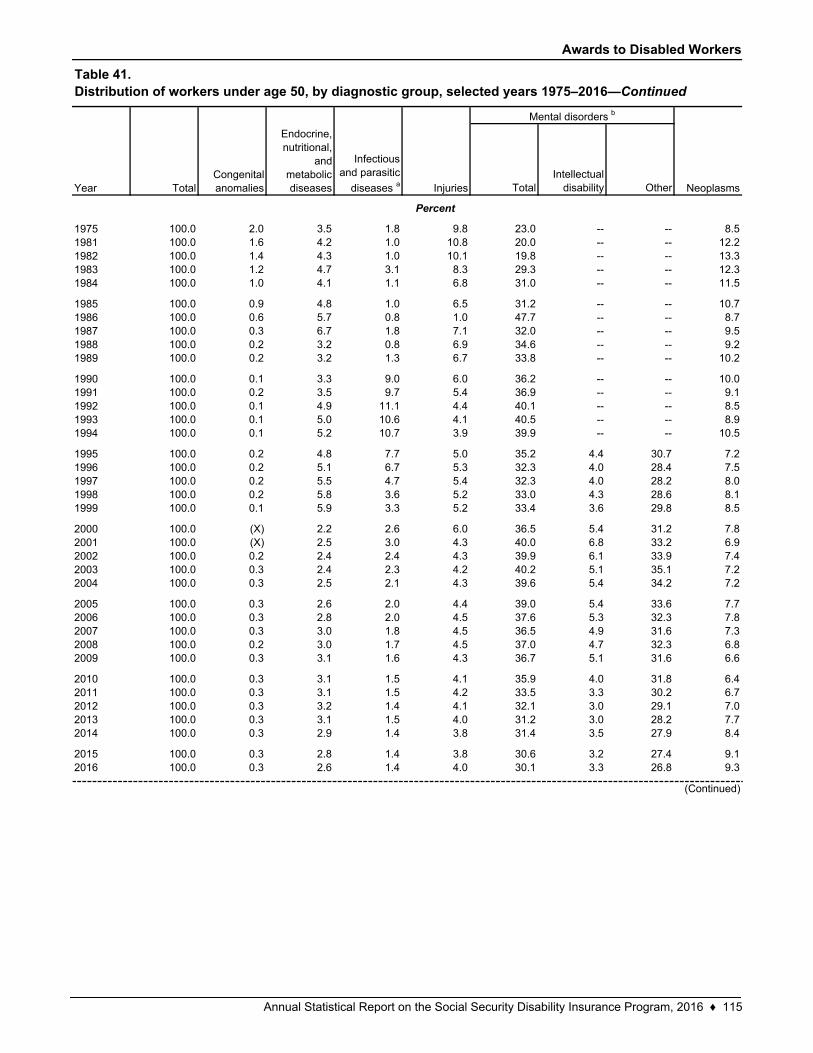
Awards to Disabled Workers
TotalIntellectual
disability Other
100.0 2.0 3.5 1.8 9.8 23.0 -- -- 8.5100.0 1.6 4.2 1.0 10.8 20.0 -- -- 12.2100.0 1.4 4.3 1.0 10.1 19.8 -- -- 13.3100.0 1.2 4.7 3.1 8.3 29.3 -- -- 12.3100.0 1.0 4.1 1.1 6.8 31.0 -- -- 11.5
100.0 0.9 4.8 1.0 6.5 31.2 -- -- 10.7100.0 0.6 5.7 0.8 1.0 47.7 -- -- 8.7100.0 0.3 6.7 1.8 7.1 32.0 -- -- 9.5100.0 0.2 3.2 0.8 6.9 34.6 -- -- 9.2100.0 0.2 3.2 1.3 6.7 33.8 -- -- 10.2
100.0 0.1 3.3 9.0 6.0 36.2 -- -- 10.0100.0 0.2 3.5 9.7 5.4 36.9 -- -- 9.1100.0 0.1 4.9 11.1 4.4 40.1 -- -- 8.5100.0 0.1 5.0 10.6 4.1 40.5 -- -- 8.9100.0 0.1 5.2 10.7 3.9 39.9 -- -- 10.5
100.0 0.2 4.8 7.7 5.0 35.2 4.4 30.7 7.2100.0 0.2 5.1 6.7 5.3 32.3 4.0 28.4 7.5100.0 0.2 5.5 4.7 5.4 32.3 4.0 28.2 8.0100.0 0.2 5.8 3.6 5.2 33.0 4.3 28.6 8.1100.0 0.1 5.9 3.3 5.2 33.4 3.6 29.8 8.5
100.0 (X) 2.2 2.6 6.0 36.5 5.4 31.2 7.8100.0 (X) 2.5 3.0 4.3 40.0 6.8 33.2 6.9100.0 0.2 2.4 2.4 4.3 39.9 6.1 33.9 7.4100.0 0.3 2.4 2.3 4.2 40.2 5.1 35.1 7.2100.0 0.3 2.5 2.1 4.3 39.6 5.4 34.2 7.2
100.0 0.3 2.6 2.0 4.4 39.0 5.4 33.6 7.7100.0 0.3 2.8 2.0 4.5 37.6 5.3 32.3 7.8100.0 0.3 3.0 1.8 4.5 36.5 4.9 31.6 7.3100.0 0.2 3.0 1.7 4.5 37.0 4.7 32.3 6.8100.0 0.3 3.1 1.6 4.3 36.7 5.1 31.6 6.6
100.0 0.3 3.1 1.5 4.1 35.9 4.0 31.8 6.4100.0 0.3 3.1 1.5 4.2 33.5 3.3 30.2 6.7100.0 0.3 3.2 1.4 4.1 32.1 3.0 29.1 7.0100.0 0.3 3.1 1.5 4.0 31.2 3.0 28.2 7.7100.0 0.3 2.9 1.4 3.8 31.4 3.5 27.9 8.4
100.0 0.3 2.8 1.4 3.8 30.6 3.2 27.4 9.1100.0 0.3 2.6 1.4 4.0 30.1 3.3 26.8 9.3
(Continued)
20132014
20152016
200720082009
201020112012
2006
19951996199719981999
20002001200220032004
2005
1994
19831984
19851986198719881989
1990199119921993
1982
19751981
Percent
Table 41.Distribution of workers under age 50, by diagnostic group, selected years 1975–2016—Continued
Year TotalCongenital anomalies
Endocrine, nutritional,
and metabolic diseases
Infectious and parasitic
diseases a Injuries
Mental disorders b
Neoplasms
Annual Statistical Report on the Social Security Disability Insurance Program, 2016 ♦ 115
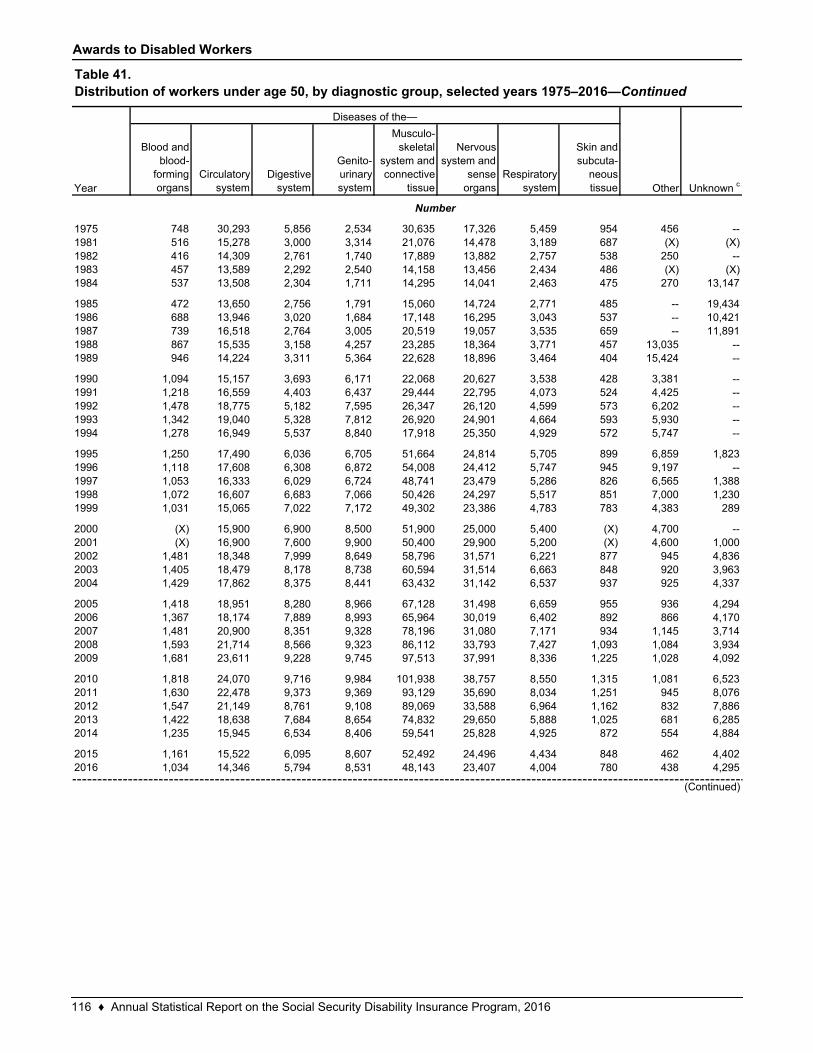
Awards to Disabled Workers
Blood and blood-
forming organs
Circulatory system
Digestive system
Genito-urinary system
Musculo-skeletal
system and connective
tissue
Nervous system and
sense organs
Respiratory system
Skin and subcuta-
neous tissue
748 30,293 5,856 2,534 30,635 17,326 5,459 954 456 --516 15,278 3,000 3,314 21,076 14,478 3,189 687 (X) (X)416 14,309 2,761 1,740 17,889 13,882 2,757 538 250 --457 13,589 2,292 2,540 14,158 13,456 2,434 486 (X) (X)537 13,508 2,304 1,711 14,295 14,041 2,463 475 270 13,147
472 13,650 2,756 1,791 15,060 14,724 2,771 485 -- 19,434688 13,946 3,020 1,684 17,148 16,295 3,043 537 -- 10,421739 16,518 2,764 3,005 20,519 19,057 3,535 659 -- 11,891867 15,535 3,158 4,257 23,285 18,364 3,771 457 13,035 --946 14,224 3,311 5,364 22,628 18,896 3,464 404 15,424 --
1,094 15,157 3,693 6,171 22,068 20,627 3,538 428 3,381 --1,218 16,559 4,403 6,437 29,444 22,795 4,073 524 4,425 --1,478 18,775 5,182 7,595 26,347 26,120 4,599 573 6,202 --1,342 19,040 5,328 7,812 26,920 24,901 4,664 593 5,930 --1,278 16,949 5,537 8,840 17,918 25,350 4,929 572 5,747 --
1,250 17,490 6,036 6,705 51,664 24,814 5,705 899 6,859 1,8231,118 17,608 6,308 6,872 54,008 24,412 5,747 945 9,197 --1,053 16,333 6,029 6,724 48,741 23,479 5,286 826 6,565 1,3881,072 16,607 6,683 7,066 50,426 24,297 5,517 851 7,000 1,2301,031 15,065 7,022 7,172 49,302 23,386 4,783 783 4,383 289
(X) 15,900 6,900 8,500 51,900 25,000 5,400 (X) 4,700 --(X) 16,900 7,600 9,900 50,400 29,900 5,200 (X) 4,600 1,000
1,481 18,348 7,999 8,649 58,796 31,571 6,221 877 945 4,8361,405 18,479 8,178 8,738 60,594 31,514 6,663 848 920 3,9631,429 17,862 8,375 8,441 63,432 31,142 6,537 937 925 4,337
1,418 18,951 8,280 8,966 67,128 31,498 6,659 955 936 4,2941,367 18,174 7,889 8,993 65,964 30,019 6,402 892 866 4,1701,481 20,900 8,351 9,328 78,196 31,080 7,171 934 1,145 3,7141,593 21,714 8,566 9,323 86,112 33,793 7,427 1,093 1,084 3,9341,681 23,611 9,228 9,745 97,513 37,991 8,336 1,225 1,028 4,092
1,818 24,070 9,716 9,984 101,938 38,757 8,550 1,315 1,081 6,5231,630 22,478 9,373 9,369 93,129 35,690 8,034 1,251 945 8,0761,547 21,149 8,761 9,108 89,069 33,588 6,964 1,162 832 7,8861,422 18,638 7,684 8,654 74,832 29,650 5,888 1,025 681 6,2851,235 15,945 6,534 8,406 59,541 25,828 4,925 872 554 4,884
1,161 15,522 6,095 8,607 52,492 24,496 4,434 848 462 4,4021,034 14,346 5,794 8,531 48,143 23,407 4,004 780 438 4,295
197519811982
Year
Diseases of the—
Other Unknown c
Number
Table 41.Distribution of workers under age 50, by diagnostic group, selected years 1975–2016—Continued
1989
19901991
198619871988
19831984
1985
19981999
2000
199519961997
199219931994
200720082009
2004
20052006
200120022003
2016
(Continued)
20132014
2015
201020112012
116 ♦ Annual Statistical Report on the Social Security Disability Insurance Program, 2016
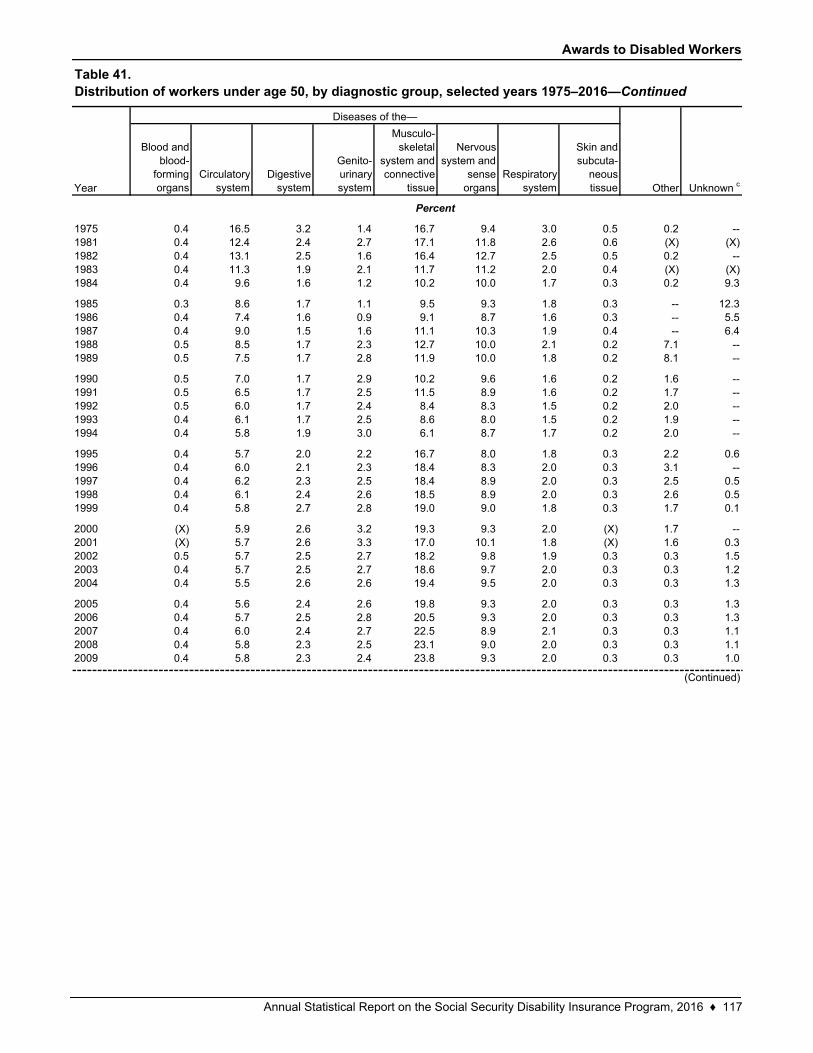
Awards to Disabled Workers
Blood and blood-
forming organs
Circulatory system
Digestive system
Genito-urinary system
Musculo-skeletal
system and connective
tissue
Nervous system and
sense organs
Respiratory system
Skin and subcuta-
neous tissue
0.4 16.5 3.2 1.4 16.7 9.4 3.0 0.5 0.2 --0.4 12.4 2.4 2.7 17.1 11.8 2.6 0.6 (X) (X)0.4 13.1 2.5 1.6 16.4 12.7 2.5 0.5 0.2 --0.4 11.3 1.9 2.1 11.7 11.2 2.0 0.4 (X) (X)0.4 9.6 1.6 1.2 10.2 10.0 1.7 0.3 0.2 9.3
0.3 8.6 1.7 1.1 9.5 9.3 1.8 0.3 -- 12.30.4 7.4 1.6 0.9 9.1 8.7 1.6 0.3 -- 5.50.4 9.0 1.5 1.6 11.1 10.3 1.9 0.4 -- 6.40.5 8.5 1.7 2.3 12.7 10.0 2.1 0.2 7.1 --0.5 7.5 1.7 2.8 11.9 10.0 1.8 0.2 8.1 --
0.5 7.0 1.7 2.9 10.2 9.6 1.6 0.2 1.6 --0.5 6.5 1.7 2.5 11.5 8.9 1.6 0.2 1.7 --0.5 6.0 1.7 2.4 8.4 8.3 1.5 0.2 2.0 --0.4 6.1 1.7 2.5 8.6 8.0 1.5 0.2 1.9 --0.4 5.8 1.9 3.0 6.1 8.7 1.7 0.2 2.0 --
0.4 5.7 2.0 2.2 16.7 8.0 1.8 0.3 2.2 0.60.4 6.0 2.1 2.3 18.4 8.3 2.0 0.3 3.1 --0.4 6.2 2.3 2.5 18.4 8.9 2.0 0.3 2.5 0.50.4 6.1 2.4 2.6 18.5 8.9 2.0 0.3 2.6 0.50.4 5.8 2.7 2.8 19.0 9.0 1.8 0.3 1.7 0.1
(X) 5.9 2.6 3.2 19.3 9.3 2.0 (X) 1.7 --(X) 5.7 2.6 3.3 17.0 10.1 1.8 (X) 1.6 0.30.5 5.7 2.5 2.7 18.2 9.8 1.9 0.3 0.3 1.50.4 5.7 2.5 2.7 18.6 9.7 2.0 0.3 0.3 1.20.4 5.5 2.6 2.6 19.4 9.5 2.0 0.3 0.3 1.3
0.4 5.6 2.4 2.6 19.8 9.3 2.0 0.3 0.3 1.30.4 5.7 2.5 2.8 20.5 9.3 2.0 0.3 0.3 1.30.4 6.0 2.4 2.7 22.5 8.9 2.1 0.3 0.3 1.10.4 5.8 2.3 2.5 23.1 9.0 2.0 0.3 0.3 1.10.4 5.8 2.3 2.4 23.8 9.3 2.0 0.3 0.3 1.0
Table 41.Distribution of workers under age 50, by diagnostic group, selected years 1975–2016—Continued
198219831984
Percent
19751981
Year
Diseases of the—
Other Unknown c
199119921993
19881989
1990
198519861987
200020012002
199719981999
1994
19951996
2009
200620072008
20032004
2005
(Continued)
Annual Statistical Report on the Social Security Disability Insurance Program, 2016 ♦ 117
Awards to Disabled Workers
Blood and blood-
forming organs
Circulatory system
Digestive system
Genito-urinary system
Musculo-skeletal
system and connective
tissue
Nervous system and
sense organs
Respiratory system
Skin and subcuta-
neous tissue
0.4 5.8 2.3 2.4 24.4 9.3 2.0 0.3 0.3 1.60.4 6.0 2.5 2.5 24.9 9.5 2.1 0.3 0.3 2.20.4 6.1 2.5 2.6 25.7 9.7 2.0 0.3 0.2 2.30.5 6.3 2.6 2.9 25.3 10.0 2.0 0.3 0.2 2.10.5 6.4 2.6 3.4 24.0 10.4 2.0 0.4 0.2 2.0
0.5 6.8 2.7 3.8 23.1 10.8 1.9 0.4 0.2 1.90.5 6.8 2.7 4.0 22.7 11.0 1.9 0.4 0.2 2.0
a.
b.
c.
20102011
AIDS and HIV records are counted in "Infectious and parasitic diseases." Before 1990, they were included in "Other."
Mental retardation (now referred to as intellectual disability) was not identified separately before 1995.
Beginning with 2002, several ill-defined impairment codes were reclassified and added to "Unknown."
CONTACT: (410) 965-0090 or [email protected].
Table 41.Distribution of workers under age 50, by diagnostic group, selected years 1975–2016—Continued
Year
Diseases of the—
Other Unknown c
NOTES: Because of differences in data sources and calculation methods, statistics reported in this table may differ from those reported by the Office of the Chief Actuary.
Data exclude closed period awards in 2002 and 2003 and expedited reinstatement cases from 2002 through 2011.
Before 1995, diagnostic data for cases awarded at the appeals levels were estimated on the basis of the diagnosis of cases allowed at the initial disability determination level.
Effective 2001, the Social Security Administration initiated a special review of 130,000 Supplemental Security Income (SSI) recipients who were potentially eligible for Social Security disability benefits because of earnings while receiving SSI. Many of these claims awarded since 2001 were for individuals under the age of 35 who were diagnosed with a mental disorder.
Starting with 2007, age is based on date of entitlement and not date of award. Entitlement can be retroactive and thus precede the date of award.
-- = not available; (X) = suppressed to avoid disclosing information about particular individuals.
20152016
SOURCES: Social Security Administration. For years before 2000, Annual Statistical Supplement to the Social Security Bulletin, based on the Master Beneficiary Record, various sampling rates; from 2000 through 2001, Annual Award and Termination Transaction file, 1 percent sample; data after 2001 are 100 percent data. From 2012 and forward, Master Beneficiary Record, 100 percent data.
Percent (cont.)
201220132014
118 ♦ Annual Statistical Report on the Social Security Disability Insurance Program, 2016
Awards to Disabled Workers
TotalIntellectual
disability Other
408,556 2,864 16,665 4,222 14,396 25,094 -- -- 44,264222,162 1,173 9,580 1,387 7,541 11,685 -- -- 41,393189,252 853 8,448 1,216 5,529 9,877 -- -- 36,418190,884 1,398 9,274 2,971 5,610 15,302 -- -- 37,552216,348 1,064 8,668 1,657 6,654 20,398 -- -- 42,931
219,219 1,042 9,442 1,475 6,201 19,297 -- -- 38,263228,510 751 10,444 1,202 1,747 34,162 -- -- 36,858231,367 289 8,709 1,414 7,825 22,271 -- -- 37,744226,473 224 8,665 1,419 8,432 22,474 -- -- 37,085235,874 223 8,191 1,276 8,770 24,407 -- -- 41,054
252,596 194 9,065 2,733 9,386 27,272 -- -- 44,342280,986 191 10,982 3,407 10,237 31,839 -- -- 46,082323,462 215 14,555 4,487 11,351 38,484 -- -- 50,690322,619 193 15,312 4,378 10,516 39,459 -- -- 52,425338,833 218 16,425 4,877 10,997 39,891 -- -- 58,440
337,021 250 18,407 4,257 12,241 39,384 2,950 36,434 42,034330,177 264 18,819 3,691 11,942 36,933 2,401 34,532 41,381322,681 219 19,140 2,966 11,529 37,415 2,209 35,206 41,034335,100 214 20,605 2,863 11,605 41,430 2,626 38,804 41,880360,879 275 21,549 3,076 12,526 52,338 7,267 45,071 43,721
340,900 (X) 11,100 3,800 12,500 44,900 3,200 41,700 42,500365,100 (X) 12,200 2,300 12,500 49,900 2,300 47,600 41,400407,844 317 13,955 3,289 14,217 56,522 2,808 53,714 46,644429,983 295 15,463 3,320 14,896 60,715 2,733 57,982 47,561448,382 315 16,053 3,519 15,434 63,240 2,780 60,460 50,060
482,392 337 18,060 3,642 16,213 66,433 2,972 63,461 57,173477,043 354 18,277 3,641 16,730 64,121 2,771 61,350 57,000457,217 318 17,097 3,193 15,927 56,650 1,686 54,964 56,070503,675 350 18,731 3,587 18,202 61,478 1,814 59,664 59,029561,271 414 21,599 3,927 20,838 66,268 2,257 64,011 63,325
609,098 478 22,704 4,292 22,043 69,015 1,903 67,112 65,947624,635 516 22,445 4,203 20,958 66,450 1,760 64,690 66,474613,251 413 20,993 4,057 19,607 61,554 1,528 60,026 66,622572,998 367 18,807 3,859 17,088 53,677 1,314 52,363 64,127530,258 346 16,244 3,554 15,705 45,647 1,107 44,540 62,478
513,952 374 14,481 3,125 14,291 42,312 1,036 41,276 62,493494,619 355 12,941 3,130 13,950 39,145 959 38,186 60,738
20082009
20102011201220132014
20152016
2007
1996199719981999
20002001200220032004
20052006
199219931994
1995
1984
19851986198719881989
Mental disorders b
Table 42.Distribution of workers aged 50 or older, by diagnostic group, selected years 1975–2016
Year
19751981
NeoplasmsTotalCongenital anomalies
Endocrine, nutritional,
and metabolic diseases
Infectious and parasitic
diseases a Injuries
Number
(Continued)
19821983
19901991
Annual Statistical Report on the Social Security Disability Insurance Program, 2016 ♦ 119
Awards to Disabled Workers
TotalIntellectual
disability Other
100.0 0.7 4.1 1.0 3.5 6.1 -- -- 10.8100.0 0.5 4.3 0.6 3.4 5.3 -- -- 18.6100.0 0.5 4.5 0.6 2.9 5.2 -- -- 19.2100.0 0.7 4.9 1.6 2.9 8.0 -- -- 19.7100.0 0.5 4.0 0.8 3.1 9.4 -- -- 19.8
100.0 0.5 4.3 0.7 2.8 8.8 -- -- 17.5100.0 0.3 4.6 0.5 0.8 14.9 -- -- 16.1100.0 0.1 3.8 0.6 3.4 9.6 -- -- 16.3100.0 0.1 3.8 0.6 3.7 9.9 -- -- 16.4100.0 0.1 3.5 0.5 3.7 10.3 -- -- 17.4
100.0 0.1 3.6 1.1 3.7 10.8 -- -- 17.6100.0 0.1 3.9 1.2 3.6 11.3 -- -- 16.4100.0 0.1 4.5 1.4 3.5 11.9 -- -- 15.7100.0 0.1 4.7 1.4 3.3 12.2 -- -- 16.2100.0 0.1 4.8 1.4 3.2 11.8 -- -- 17.2
100.0 0.1 5.5 1.3 3.6 11.7 0.9 10.8 12.5100.0 0.1 5.7 1.1 3.6 11.2 0.7 10.5 12.5100.0 0.1 5.9 0.9 3.6 11.6 0.7 10.9 12.7100.0 0.1 6.1 0.9 3.5 12.4 0.8 11.6 12.5100.0 0.1 6.0 0.9 3.5 14.5 2.0 12.5 12.1
100.0 (X) 3.3 1.1 3.7 13.2 0.9 12.2 12.5100.0 (X) 3.3 0.6 3.4 13.7 0.6 13.0 11.3100.0 0.1 3.4 0.8 3.5 13.9 0.7 13.2 11.4100.0 0.1 3.6 0.8 3.5 14.1 0.6 13.5 11.1100.0 0.1 3.6 0.8 3.4 14.1 0.6 13.5 11.2
100.0 0.1 3.7 0.8 3.4 13.8 0.6 13.2 11.9100.0 0.1 3.8 0.8 3.5 13.5 0.6 12.9 11.9100.0 0.1 3.7 0.7 3.5 12.4 0.4 12.0 12.3100.0 0.1 3.7 0.7 3.6 12.2 0.4 11.8 11.7100.0 0.1 3.8 0.7 3.7 11.8 0.4 11.4 11.3
100.0 0.1 3.7 0.7 3.6 11.3 0.3 11.0 10.8100.0 0.1 3.6 0.7 3.4 10.6 0.3 10.4 10.6100.0 0.1 3.4 0.7 3.2 10.0 0.2 9.8 10.9100.0 0.1 3.3 0.7 3.0 9.4 0.2 9.1 11.2100.0 0.1 3.1 0.7 3.0 8.6 0.2 8.4 11.8
100.0 0.1 2.8 0.6 2.8 8.2 0.2 8.0 12.2100.0 0.1 2.6 0.6 2.8 7.9 0.2 7.7 12.3
(Continued)
20132014
20152016
200720082009
201020112012
2006
19951996199719981999
20002001200220032004
2005
1994
19831984
19851986198719881989
1990199119921993
1982
19751981
Percent
Table 42.Distribution of workers aged 50 or older, by diagnostic group, selected years 1975–2016—Continued
Year TotalCongenital anomalies
Endocrine, nutritional,
and metabolic diseases
Infectious and parasitic
diseases a Injuries
Mental disorders b
Neoplasms
120 ♦ Annual Statistical Report on the Social Security Disability Insurance Program, 2016
Awards to Disabled Workers
Blood and blood-
forming organs
Circulatory system
Digestive system
Genito-urinary system
Musculo-skeletal
system and connective
tissue
Nervous system and
sense organs
Respiratory system
Skin and subcuta-
neous tissue
743 147,018 11,618 3,185 80,002 22,634 34,026 1,352 473 --426 70,716 4,363 2,916 37,563 14,038 18,331 658 (X) (X)392 59,933 3,306 1,425 31,096 13,004 17,009 460 287 --501 54,763 2,980 3,949 27,624 12,747 15,544 362 (X) (X)367 57,383 3,591 1,730 31,531 14,160 16,428 508 506 8,772
418 59,114 2,870 1,557 34,154 14,009 17,442 625 -- 13,310498 59,280 3,242 1,415 37,412 14,033 20,406 538 -- 6,522466 60,240 3,358 2,796 43,288 16,149 19,443 514 -- 6,861552 56,689 3,230 2,874 45,338 16,079 19,302 328 3,782 --578 56,011 3,492 3,646 48,791 15,860 17,936 424 5,216 --
640 58,428 3,738 4,123 52,433 17,110 18,620 438 4,074 --686 61,780 4,245 4,437 63,025 18,756 19,725 497 5,097 --799 71,043 4,690 5,168 70,548 20,832 22,665 497 7,438 --733 69,583 4,698 5,578 67,335 20,841 22,830 525 8,213 --788 69,696 4,983 6,691 66,787 22,470 26,029 544 10,047 --
756 65,575 5,131 5,251 89,642 21,663 23,126 744 8,560 --718 63,601 5,222 5,334 88,768 21,548 22,236 643 9,077 --762 60,198 5,281 5,427 86,689 22,017 21,197 647 7,871 289729 60,091 5,730 6,052 91,421 23,200 21,631 615 6,744 290880 59,690 6,367 6,670 97,452 26,483 22,198 633 5,869 1,152
(X) 59,500 5,800 6,400 101,700 25,100 20,800 (X) 4,600 600(X) 65,600 8,000 6,400 111,700 24,700 23,100 (X) 5,400 800
1,010 66,904 7,977 7,763 128,127 30,948 24,370 732 921 4,1481,003 67,417 8,906 8,230 138,420 32,855 25,344 774 951 3,8331,050 67,587 9,670 8,428 146,883 33,424 26,025 772 984 4,938
1,083 70,296 10,814 9,351 159,786 35,214 27,339 828 1,053 4,7701,038 67,462 10,766 9,421 159,215 35,301 26,175 839 996 5,7071,028 65,806 10,207 9,732 155,412 34,107 25,165 847 967 4,6911,063 70,422 11,194 10,339 177,424 37,638 27,112 842 1,081 5,1831,219 76,396 12,599 10,689 205,522 41,765 29,602 929 988 5,191
1,328 80,976 13,589 11,591 231,439 44,978 32,314 1,076 1,070 6,2581,369 83,250 14,051 11,720 244,817 46,008 33,126 1,129 1,072 7,0471,371 80,216 13,950 11,354 250,567 43,521 30,994 1,107 971 5,9541,364 75,323 12,999 11,102 237,301 41,545 29,253 968 863 4,3551,201 69,244 11,643 10,948 221,539 39,195 27,199 868 736 3,711
1,215 66,471 10,722 11,533 216,863 38,738 26,128 873 699 3,6341,128 64,023 9,949 11,662 210,363 37,186 24,991 824 668 3,566
197519811982
Year
Diseases of the—
Other Unknown c
Number
Table 42.Distribution of workers aged 50 or older, by diagnostic group, selected years 1975–2016—Continued
1989
19901991
198619871988
19831984
1985
19981999
2000
199519961997
199219931994
200720082009
2004
20052006
200120022003
2016
(Continued)
20132014
2015
201020112012
Annual Statistical Report on the Social Security Disability Insurance Program, 2016 ♦ 121
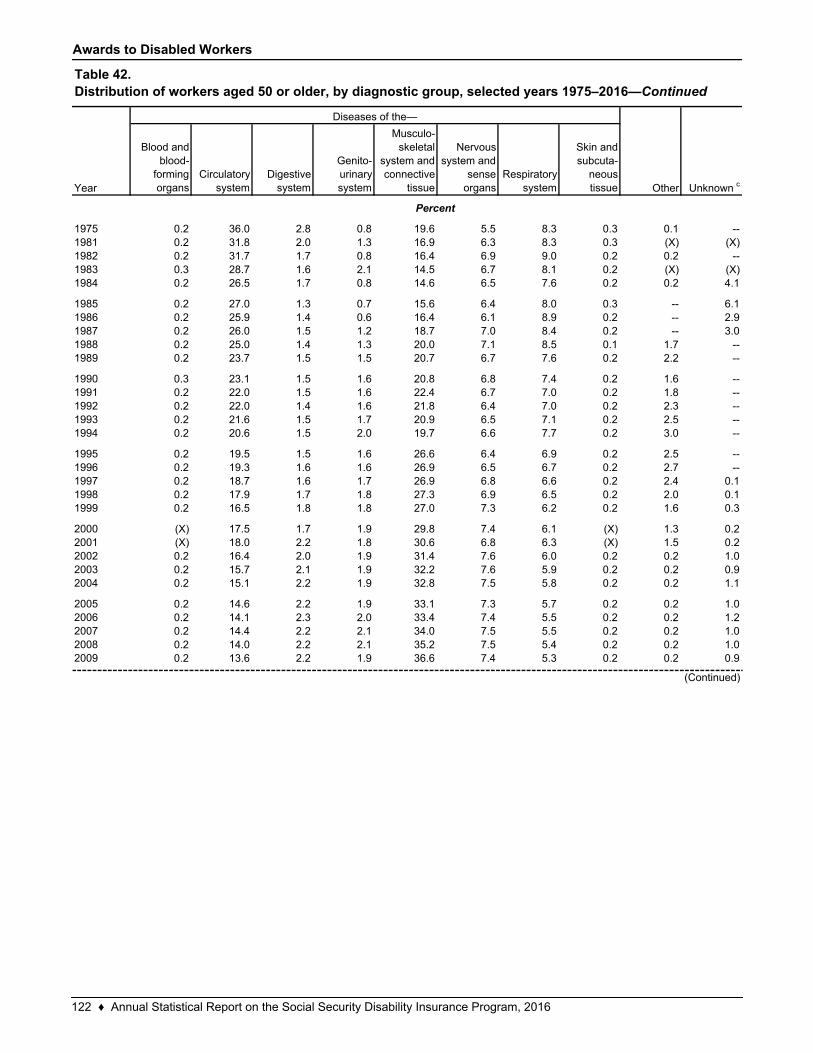
Awards to Disabled Workers
Blood and blood-
forming organs
Circulatory system
Digestive system
Genito-urinary system
Musculo-skeletal
system and connective
tissue
Nervous system and
sense organs
Respiratory system
Skin and subcuta-
neous tissue
0.2 36.0 2.8 0.8 19.6 5.5 8.3 0.3 0.1 --0.2 31.8 2.0 1.3 16.9 6.3 8.3 0.3 (X) (X)0.2 31.7 1.7 0.8 16.4 6.9 9.0 0.2 0.2 --0.3 28.7 1.6 2.1 14.5 6.7 8.1 0.2 (X) (X)0.2 26.5 1.7 0.8 14.6 6.5 7.6 0.2 0.2 4.1
0.2 27.0 1.3 0.7 15.6 6.4 8.0 0.3 -- 6.10.2 25.9 1.4 0.6 16.4 6.1 8.9 0.2 -- 2.90.2 26.0 1.5 1.2 18.7 7.0 8.4 0.2 -- 3.00.2 25.0 1.4 1.3 20.0 7.1 8.5 0.1 1.7 --0.2 23.7 1.5 1.5 20.7 6.7 7.6 0.2 2.2 --
0.3 23.1 1.5 1.6 20.8 6.8 7.4 0.2 1.6 --0.2 22.0 1.5 1.6 22.4 6.7 7.0 0.2 1.8 --0.2 22.0 1.4 1.6 21.8 6.4 7.0 0.2 2.3 --0.2 21.6 1.5 1.7 20.9 6.5 7.1 0.2 2.5 --0.2 20.6 1.5 2.0 19.7 6.6 7.7 0.2 3.0 --
0.2 19.5 1.5 1.6 26.6 6.4 6.9 0.2 2.5 --0.2 19.3 1.6 1.6 26.9 6.5 6.7 0.2 2.7 --0.2 18.7 1.6 1.7 26.9 6.8 6.6 0.2 2.4 0.10.2 17.9 1.7 1.8 27.3 6.9 6.5 0.2 2.0 0.10.2 16.5 1.8 1.8 27.0 7.3 6.2 0.2 1.6 0.3
(X) 17.5 1.7 1.9 29.8 7.4 6.1 (X) 1.3 0.2(X) 18.0 2.2 1.8 30.6 6.8 6.3 (X) 1.5 0.20.2 16.4 2.0 1.9 31.4 7.6 6.0 0.2 0.2 1.00.2 15.7 2.1 1.9 32.2 7.6 5.9 0.2 0.2 0.90.2 15.1 2.2 1.9 32.8 7.5 5.8 0.2 0.2 1.1
0.2 14.6 2.2 1.9 33.1 7.3 5.7 0.2 0.2 1.00.2 14.1 2.3 2.0 33.4 7.4 5.5 0.2 0.2 1.20.2 14.4 2.2 2.1 34.0 7.5 5.5 0.2 0.2 1.00.2 14.0 2.2 2.1 35.2 7.5 5.4 0.2 0.2 1.00.2 13.6 2.2 1.9 36.6 7.4 5.3 0.2 0.2 0.9
Table 42.Distribution of workers aged 50 or older, by diagnostic group, selected years 1975–2016—Continued
198219831984
Percent
19751981
Year
Diseases of the—
Other Unknown c
199119921993
19881989
1990
198519861987
200020012002
199719981999
1994
19951996
2009
200620072008
20032004
2005
(Continued)
122 ♦ Annual Statistical Report on the Social Security Disability Insurance Program, 2016
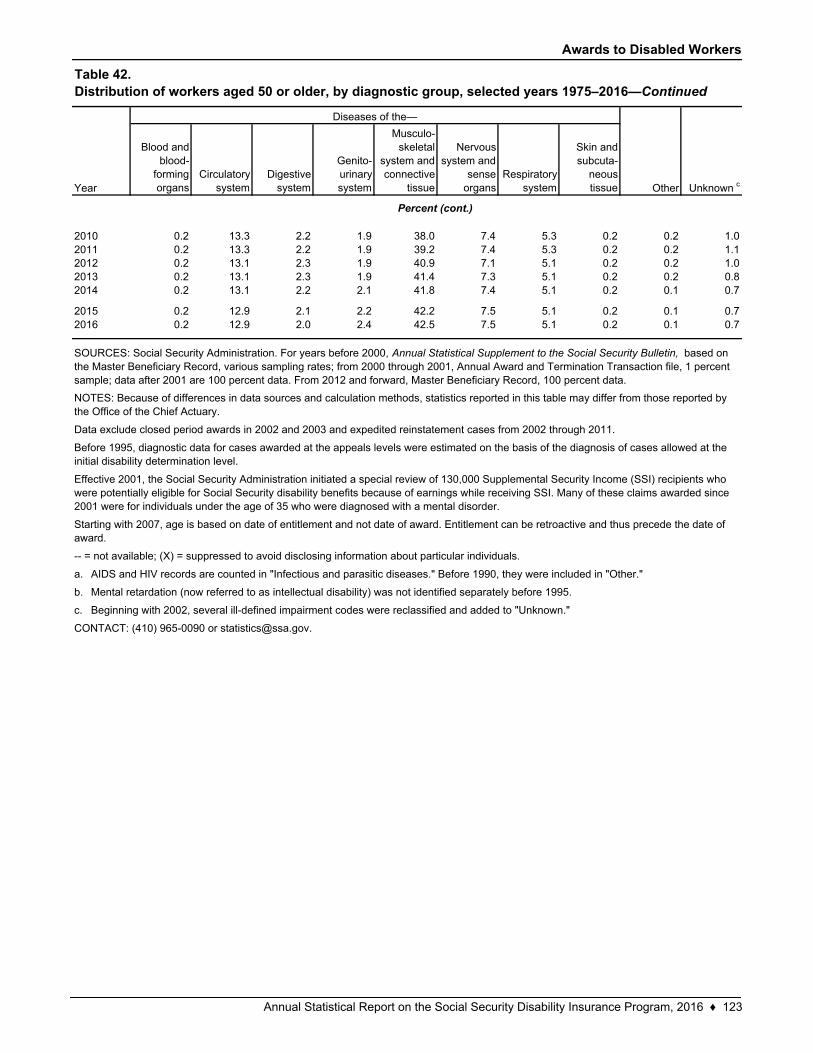
Awards to Disabled Workers
Blood and blood-
forming organs
Circulatory system
Digestive system
Genito-urinary system
Musculo-skeletal
system and connective
tissue
Nervous system and
sense organs
Respiratory system
Skin and subcuta-
neous tissue
0.2 13.3 2.2 1.9 38.0 7.4 5.3 0.2 0.2 1.00.2 13.3 2.2 1.9 39.2 7.4 5.3 0.2 0.2 1.10.2 13.1 2.3 1.9 40.9 7.1 5.1 0.2 0.2 1.00.2 13.1 2.3 1.9 41.4 7.3 5.1 0.2 0.2 0.80.2 13.1 2.2 2.1 41.8 7.4 5.1 0.2 0.1 0.7
0.2 12.9 2.1 2.2 42.2 7.5 5.1 0.2 0.1 0.70.2 12.9 2.0 2.4 42.5 7.5 5.1 0.2 0.1 0.7
a.
b.
c.
20102011
AIDS and HIV records are counted in "Infectious and parasitic diseases." Before 1990, they were included in "Other."
Mental retardation (now referred to as intellectual disability) was not identified separately before 1995.
Beginning with 2002, several ill-defined impairment codes were reclassified and added to "Unknown."
CONTACT: (410) 965-0090 or [email protected].
Table 42.Distribution of workers aged 50 or older, by diagnostic group, selected years 1975–2016—Continued
Year
Diseases of the—
Other Unknown c
NOTES: Because of differences in data sources and calculation methods, statistics reported in this table may differ from those reported by the Office of the Chief Actuary.
Data exclude closed period awards in 2002 and 2003 and expedited reinstatement cases from 2002 through 2011.
Before 1995, diagnostic data for cases awarded at the appeals levels were estimated on the basis of the diagnosis of cases allowed at the initial disability determination level.
Effective 2001, the Social Security Administration initiated a special review of 130,000 Supplemental Security Income (SSI) recipients who were potentially eligible for Social Security disability benefits because of earnings while receiving SSI. Many of these claims awarded since 2001 were for individuals under the age of 35 who were diagnosed with a mental disorder.
Starting with 2007, age is based on date of entitlement and not date of award. Entitlement can be retroactive and thus precede the date of award.
-- = not available; (X) = suppressed to avoid disclosing information about particular individuals.
20152016
SOURCES: Social Security Administration. For years before 2000, Annual Statistical Supplement to the Social Security Bulletin, based on the Master Beneficiary Record, various sampling rates; from 2000 through 2001, Annual Award and Termination Transaction file, 1 percent sample; data after 2001 are 100 percent data. From 2012 and forward, Master Beneficiary Record, 100 percent data.
Percent (cont.)
201220132014
Annual Statistical Report on the Social Security Disability Insurance Program, 2016 ♦ 123
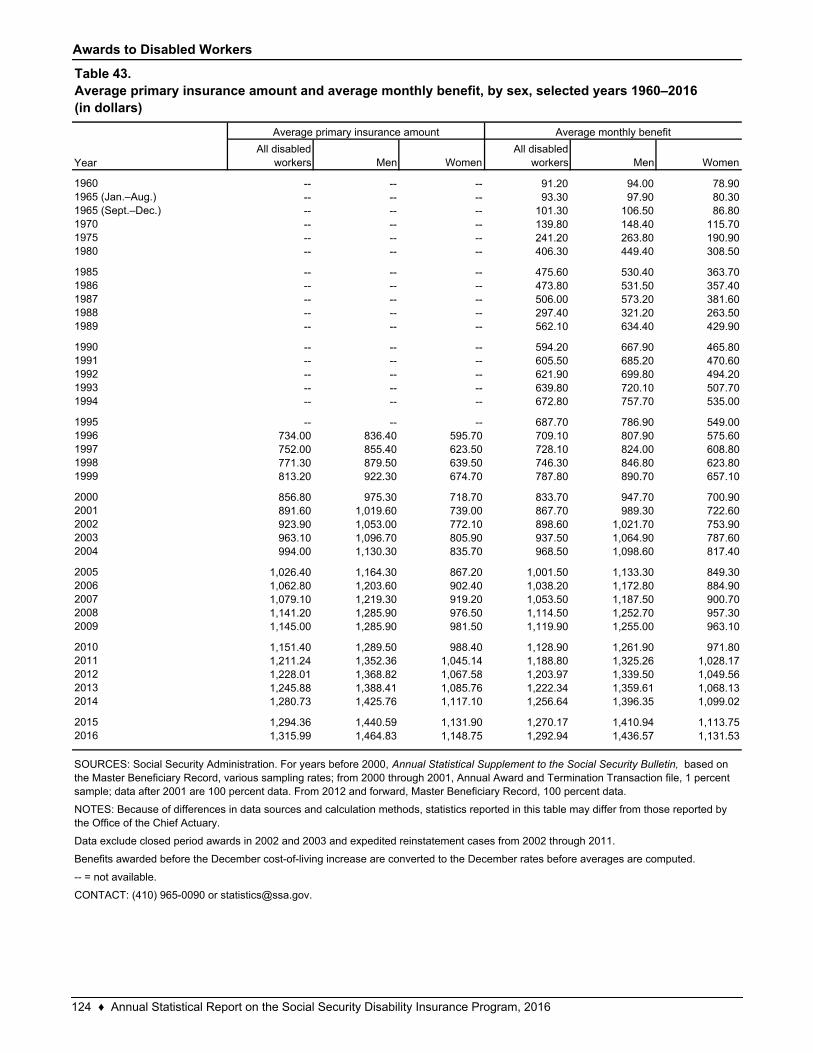
Awards to Disabled Workers
All disabled workers Men Women
All disabled workers Men Women
1960 -- -- -- 91.20 94.00 78.901965 (Jan.–Aug.) -- -- -- 93.30 97.90 80.301965 (Sept.–Dec.) -- -- -- 101.30 106.50 86.801970 -- -- -- 139.80 148.40 115.701975 -- -- -- 241.20 263.80 190.901980 -- -- -- 406.30 449.40 308.50
1985 -- -- -- 475.60 530.40 363.701986 -- -- -- 473.80 531.50 357.401987 -- -- -- 506.00 573.20 381.601988 -- -- -- 297.40 321.20 263.501989 -- -- -- 562.10 634.40 429.90
1990 -- -- -- 594.20 667.90 465.801991 -- -- -- 605.50 685.20 470.601992 -- -- -- 621.90 699.80 494.201993 -- -- -- 639.80 720.10 507.701994 -- -- -- 672.80 757.70 535.00
1995 -- -- -- 687.70 786.90 549.001996 734.00 836.40 595.70 709.10 807.90 575.601997 752.00 855.40 623.50 728.10 824.00 608.801998 771.30 879.50 639.50 746.30 846.80 623.801999 813.20 922.30 674.70 787.80 890.70 657.10
2000 856.80 975.30 718.70 833.70 947.70 700.902001 891.60 1,019.60 739.00 867.70 989.30 722.602002 923.90 1,053.00 772.10 898.60 1,021.70 753.902003 963.10 1,096.70 805.90 937.50 1,064.90 787.602004 994.00 1,130.30 835.70 968.50 1,098.60 817.40
2005 1,026.40 1,164.30 867.20 1,001.50 1,133.30 849.302006 1,062.80 1,203.60 902.40 1,038.20 1,172.80 884.902007 1,079.10 1,219.30 919.20 1,053.50 1,187.50 900.702008 1,141.20 1,285.90 976.50 1,114.50 1,252.70 957.302009 1,145.00 1,285.90 981.50 1,119.90 1,255.00 963.10
2010 1,151.40 1,289.50 988.40 1,128.90 1,261.90 971.802011 1,211.24 1,352.36 1,045.14 1,188.80 1,325.26 1,028.172012 1,228.01 1,368.82 1,067.58 1,203.97 1,339.50 1,049.562013 1,245.88 1,388.41 1,085.76 1,222.34 1,359.61 1,068.132014 1,280.73 1,425.76 1,117.10 1,256.64 1,396.35 1,099.02
2015 1,294.36 1,440.59 1,131.90 1,270.17 1,410.94 1,113.752016 1,315.99 1,464.83 1,148.75 1,292.94 1,436.57 1,131.53
NOTES: Because of differences in data sources and calculation methods, statistics reported in this table may differ from those reported by the Office of the Chief Actuary.
Data exclude closed period awards in 2002 and 2003 and expedited reinstatement cases from 2002 through 2011.
Benefits awarded before the December cost-of-living increase are converted to the December rates before averages are computed.
-- = not available.
CONTACT: (410) 965-0090 or [email protected].
Table 43.Average primary insurance amount and average monthly benefit, by sex, selected years 1960–2016 (in dollars)
Year
Average primary insurance amount Average monthly benefit
SOURCES: Social Security Administration. For years before 2000, Annual Statistical Supplement to the Social Security Bulletin, based on the Master Beneficiary Record, various sampling rates; from 2000 through 2001, Annual Award and Termination Transaction file, 1 percent sample; data after 2001 are 100 percent data. From 2012 and forward, Master Beneficiary Record, 100 percent data.
124 ♦ Annual Statistical Report on the Social Security Disability Insurance Program, 2016
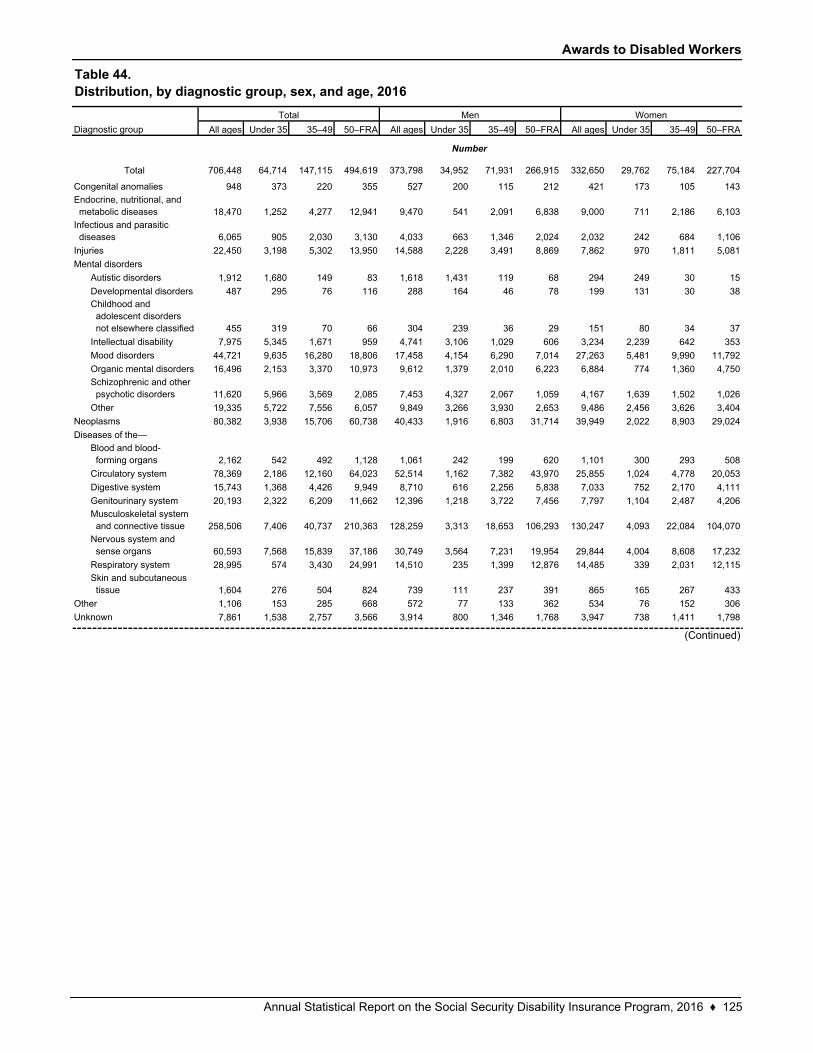
Awards to Disabled Workers
All ages Under 35 35–49 50–FRA All ages Under 35 35–49 50–FRA All ages Under 35 35–49 50–FRA
Total 706,448 64,714 147,115 494,619 373,798 34,952 71,931 266,915 332,650 29,762 75,184 227,704
948 373 220 355 527 200 115 212 421 173 105 143
18,470 1,252 4,277 12,941 9,470 541 2,091 6,838 9,000 711 2,186 6,103
6,065 905 2,030 3,130 4,033 663 1,346 2,024 2,032 242 684 1,106
22,450 3,198 5,302 13,950 14,588 2,228 3,491 8,869 7,862 970 1,811 5,081
1,912 1,680 149 83 1,618 1,431 119 68 294 249 30 15
487 295 76 116 288 164 46 78 199 131 30 38
455 319 70 66 304 239 36 29 151 80 34 37
7,975 5,345 1,671 959 4,741 3,106 1,029 606 3,234 2,239 642 353
44,721 9,635 16,280 18,806 17,458 4,154 6,290 7,014 27,263 5,481 9,990 11,792
16,496 2,153 3,370 10,973 9,612 1,379 2,010 6,223 6,884 774 1,360 4,750
11,620 5,966 3,569 2,085 7,453 4,327 2,067 1,059 4,167 1,639 1,502 1,026
19,335 5,722 7,556 6,057 9,849 3,266 3,930 2,653 9,486 2,456 3,626 3,404
80,382 3,938 15,706 60,738 40,433 1,916 6,803 31,714 39,949 2,022 8,903 29,024
2,162 542 492 1,128 1,061 242 199 620 1,101 300 293 508
78,369 2,186 12,160 64,023 52,514 1,162 7,382 43,970 25,855 1,024 4,778 20,053
15,743 1,368 4,426 9,949 8,710 616 2,256 5,838 7,033 752 2,170 4,111
20,193 2,322 6,209 11,662 12,396 1,218 3,722 7,456 7,797 1,104 2,487 4,206
258,506 7,406 40,737 210,363 128,259 3,313 18,653 106,293 130,247 4,093 22,084 104,070
60,593 7,568 15,839 37,186 30,749 3,564 7,231 19,954 29,844 4,004 8,608 17,232
28,995 574 3,430 24,991 14,510 235 1,399 12,876 14,485 339 2,031 12,115
1,604 276 504 824 739 111 237 391 865 165 267 433
1,106 153 285 668 572 77 133 362 534 76 152 306
7,861 1,538 2,757 3,566 3,914 800 1,346 1,768 3,947 738 1,411 1,798
Diseases of the—
Blood and blood- forming organs
Circulatory system
Genitourinary system
Musculoskeletal system and connective tissue
Nervous system and sense organs
Respiratory system
Skin and subcutaneous tissue
Other
Unknown
Congenital anomalies
Endocrine, nutritional, and metabolic diseases
Infectious and parasitic diseases
Injuries
Mental disorders
Digestive system
Developmental disordersChildhood and adolescent disorders not elsewhere classified
Intellectual disability
Mood disorders
Organic mental disorders
Schizophrenic and other psychotic disorders
Number
Table 44.Distribution, by diagnostic group, sex, and age, 2016
Total Men Women
Diagnostic group
(Continued)
Autistic disorders
Other
Neoplasms
Annual Statistical Report on the Social Security Disability Insurance Program, 2016 ♦ 125
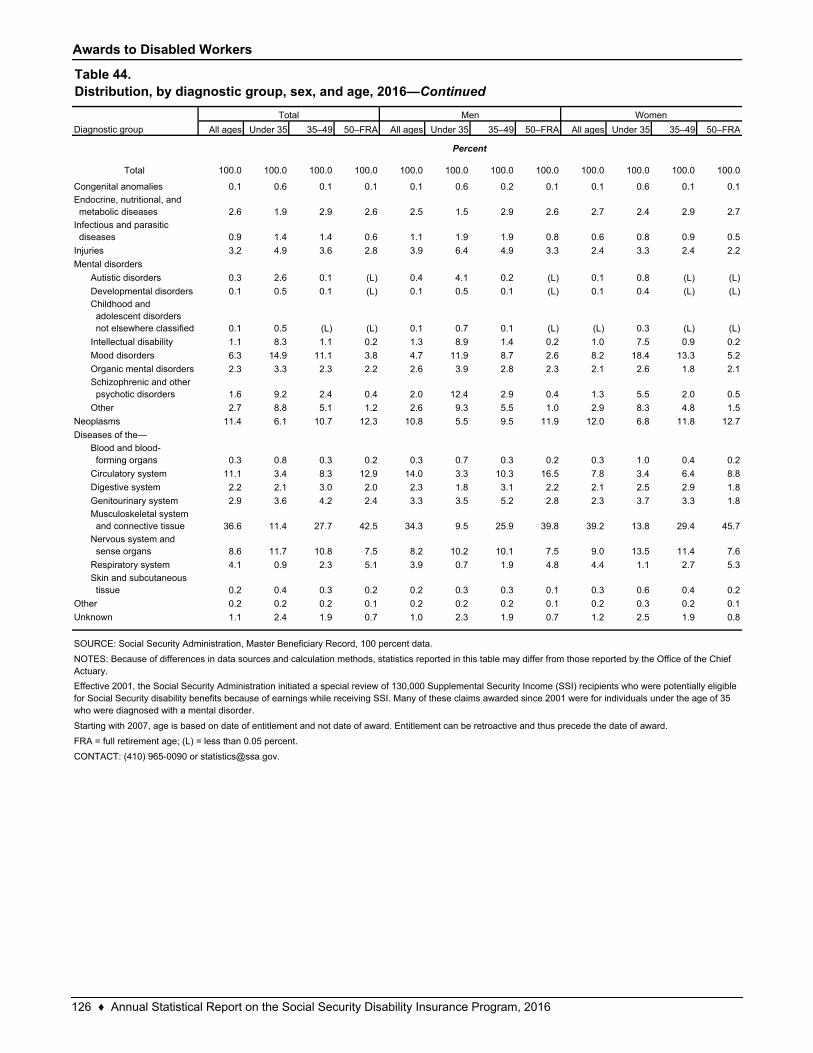
Awards to Disabled Workers
All ages Under 35 35–49 50–FRA All ages Under 35 35–49 50–FRA All ages Under 35 35–49 50–FRA
Total 100.0 100.0 100.0 100.0 100.0 100.0 100.0 100.0 100.0 100.0 100.0 100.0
0.1 0.6 0.1 0.1 0.1 0.6 0.2 0.1 0.1 0.6 0.1 0.1
2.6 1.9 2.9 2.6 2.5 1.5 2.9 2.6 2.7 2.4 2.9 2.7
0.9 1.4 1.4 0.6 1.1 1.9 1.9 0.8 0.6 0.8 0.9 0.5
3.2 4.9 3.6 2.8 3.9 6.4 4.9 3.3 2.4 3.3 2.4 2.2
0.3 2.6 0.1 (L) 0.4 4.1 0.2 (L) 0.1 0.8 (L) (L)
0.1 0.5 0.1 (L) 0.1 0.5 0.1 (L) 0.1 0.4 (L) (L)
0.1 0.5 (L) (L) 0.1 0.7 0.1 (L) (L) 0.3 (L) (L)
1.1 8.3 1.1 0.2 1.3 8.9 1.4 0.2 1.0 7.5 0.9 0.2
6.3 14.9 11.1 3.8 4.7 11.9 8.7 2.6 8.2 18.4 13.3 5.2
2.3 3.3 2.3 2.2 2.6 3.9 2.8 2.3 2.1 2.6 1.8 2.1
1.6 9.2 2.4 0.4 2.0 12.4 2.9 0.4 1.3 5.5 2.0 0.5
2.7 8.8 5.1 1.2 2.6 9.3 5.5 1.0 2.9 8.3 4.8 1.5
11.4 6.1 10.7 12.3 10.8 5.5 9.5 11.9 12.0 6.8 11.8 12.7
0.3 0.8 0.3 0.2 0.3 0.7 0.3 0.2 0.3 1.0 0.4 0.2
11.1 3.4 8.3 12.9 14.0 3.3 10.3 16.5 7.8 3.4 6.4 8.8
2.2 2.1 3.0 2.0 2.3 1.8 3.1 2.2 2.1 2.5 2.9 1.8
2.9 3.6 4.2 2.4 3.3 3.5 5.2 2.8 2.3 3.7 3.3 1.8
36.6 11.4 27.7 42.5 34.3 9.5 25.9 39.8 39.2 13.8 29.4 45.7
8.6 11.7 10.8 7.5 8.2 10.2 10.1 7.5 9.0 13.5 11.4 7.6
4.1 0.9 2.3 5.1 3.9 0.7 1.9 4.8 4.4 1.1 2.7 5.3
0.2 0.4 0.3 0.2 0.2 0.3 0.3 0.1 0.3 0.6 0.4 0.2
0.2 0.2 0.2 0.1 0.2 0.2 0.2 0.1 0.2 0.3 0.2 0.1
1.1 2.4 1.9 0.7 1.0 2.3 1.9 0.7 1.2 2.5 1.9 0.8
FRA = full retirement age; (L) = less than 0.05 percent.
CONTACT: (410) 965-0090 or [email protected].
Other
Unknown
Digestive system
Genitourinary system
Musculoskeletal system and connective tissue
Nervous system and sense organs
Respiratory system
Skin and subcutaneous tissue
Circulatory system
Autistic disorders
Developmental disordersChildhood and adolescent disorders not elsewhere classified
Intellectual disability
Mood disorders
Organic mental disorders
Schizophrenic and other psychotic disorders
Other
Neoplasms
Diseases of the—
Blood and blood- forming organs
Mental disorders
Congenital anomalies
Endocrine, nutritional, and metabolic diseases
Infectious and parasitic diseases
Injuries
SOURCE: Social Security Administration, Master Beneficiary Record, 100 percent data.
NOTES: Because of differences in data sources and calculation methods, statistics reported in this table may differ from those reported by the Office of the Chief Actuary.
Effective 2001, the Social Security Administration initiated a special review of 130,000 Supplemental Security Income (SSI) recipients who were potentially eligible for Social Security disability benefits because of earnings while receiving SSI. Many of these claims awarded since 2001 were for individuals under the age of 35 who were diagnosed with a mental disorder.
Starting with 2007, age is based on date of entitlement and not date of award. Entitlement can be retroactive and thus precede the date of award.
Percent
Table 44.Distribution, by diagnostic group, sex, and age, 2016—Continued
Diagnostic group
Total Men Women
126 ♦ Annual Statistical Report on the Social Security Disability Insurance Program, 2016
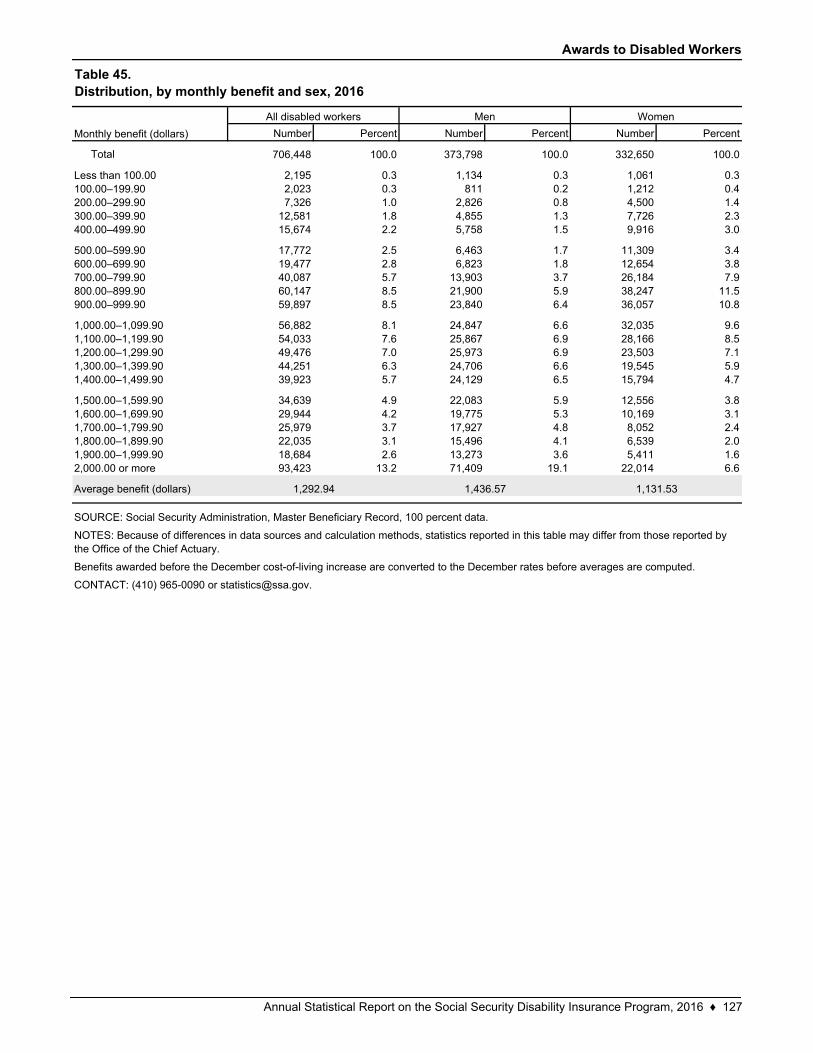
Awards to Disabled Workers
Number Percent Number Percent Number Percent
Total 706,448 100.0 373,798 100.0 332,650 100.0
2,195 0.3 1,134 0.3 1,061 0.32,023 0.3 811 0.2 1,212 0.47,326 1.0 2,826 0.8 4,500 1.4
12,581 1.8 4,855 1.3 7,726 2.315,674 2.2 5,758 1.5 9,916 3.0
17,772 2.5 6,463 1.7 11,309 3.419,477 2.8 6,823 1.8 12,654 3.840,087 5.7 13,903 3.7 26,184 7.960,147 8.5 21,900 5.9 38,247 11.559,897 8.5 23,840 6.4 36,057 10.8
56,882 8.1 24,847 6.6 32,035 9.654,033 7.6 25,867 6.9 28,166 8.549,476 7.0 25,973 6.9 23,503 7.144,251 6.3 24,706 6.6 19,545 5.939,923 5.7 24,129 6.5 15,794 4.7
34,639 4.9 22,083 5.9 12,556 3.829,944 4.2 19,775 5.3 10,169 3.125,979 3.7 17,927 4.8 8,052 2.422,035 3.1 15,496 4.1 6,539 2.018,684 2.6 13,273 3.6 5,411 1.693,423 13.2 71,409 19.1 22,014 6.6
Benefits awarded before the December cost-of-living increase are converted to the December rates before averages are computed.
2,000.00 or more
Average benefit (dollars)
1,400.00–1,499.90
1,500.00–1,599.901,600.00–1,699.901,700.00–1,799.901,800.00–1,899.901,900.00–1,999.90
CONTACT: (410) 965-0090 or [email protected].
Monthly benefit (dollars)
Less than 100.00100.00–199.90200.00–299.90300.00–399.90400.00–499.90
500.00–599.90600.00–699.90700.00–799.90
1,292.94 1,436.57 1,131.53
SOURCE: Social Security Administration, Master Beneficiary Record, 100 percent data.
NOTES: Because of differences in data sources and calculation methods, statistics reported in this table may differ from those reported by the Office of the Chief Actuary.
800.00–899.90
Table 45.Distribution, by monthly benefit and sex, 2016
All disabled workers Men Women
1,300.00–1,399.90
900.00–999.90
1,000.00–1,099.901,100.00–1,199.901,200.00–1,299.90
Annual Statistical Report on the Social Security Disability Insurance Program, 2016 ♦ 127
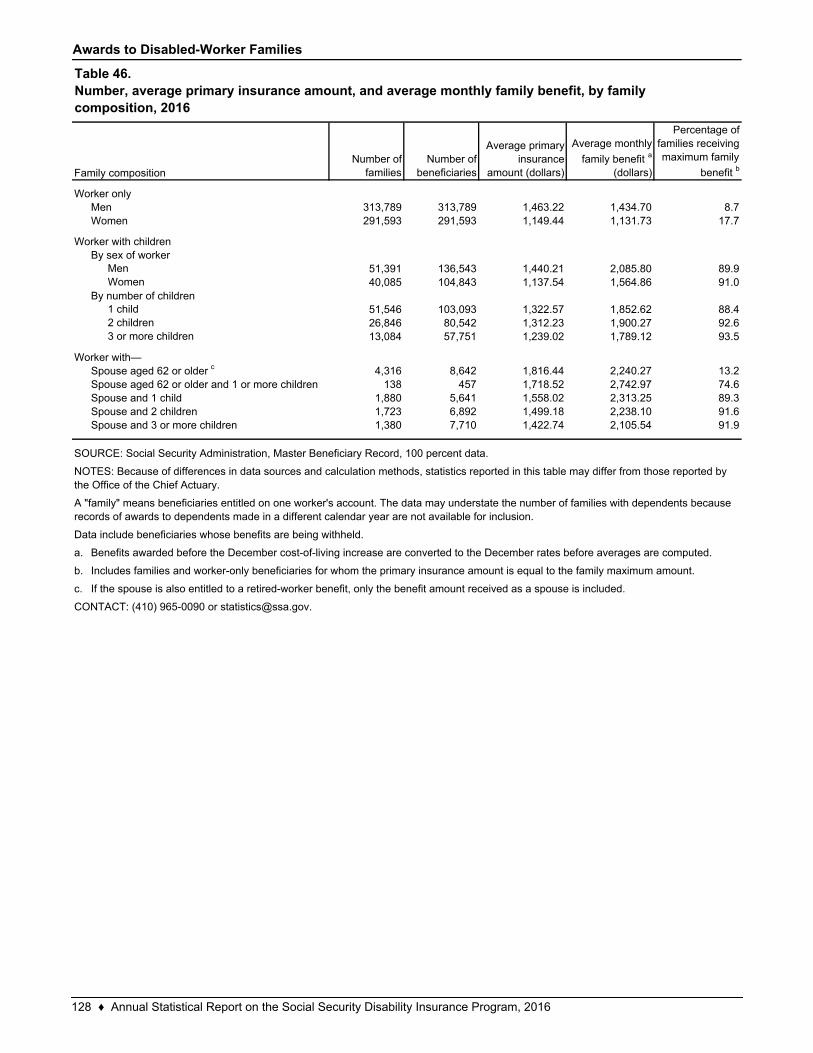
Awards to Disabled-Worker Families
Number of families
Number of beneficiaries
Average primary insurance
amount (dollars)
Average monthly
family benefit a
(dollars)
Percentage of families receiving maximum family
benefit b
313,789 313,789 1,463.22 1,434.70 8.7291,593 291,593 1,149.44 1,131.73 17.7
Men 51,391 136,543 1,440.21 2,085.80 89.9Women 40,085 104,843 1,137.54 1,564.86 91.0
1 child 51,546 103,093 1,322.57 1,852.62 88.42 children 26,846 80,542 1,312.23 1,900.27 92.63 or more children 13,084 57,751 1,239.02 1,789.12 93.5
4,316 8,642 1,816.44 2,240.27 13.2138 457 1,718.52 2,742.97 74.6
1,880 5,641 1,558.02 2,313.25 89.31,723 6,892 1,499.18 2,238.10 91.61,380 7,710 1,422.74 2,105.54 91.9
a.
b.
c.
Benefits awarded before the December cost-of-living increase are converted to the December rates before averages are computed.
Includes families and worker-only beneficiaries for whom the primary insurance amount is equal to the family maximum amount.
If the spouse is also entitled to a retired-worker benefit, only the benefit amount received as a spouse is included.
CONTACT: (410) 965-0090 or [email protected].
Data include beneficiaries whose benefits are being withheld.
By number of children
Worker with—Spouse aged 62 or older c
Spouse aged 62 or older and 1 or more childrenSpouse and 1 childSpouse and 2 childrenSpouse and 3 or more children
Table 46.Number, average primary insurance amount, and average monthly family benefit, by family composition, 2016
By sex of worker
SOURCE: Social Security Administration, Master Beneficiary Record, 100 percent data.
NOTES: Because of differences in data sources and calculation methods, statistics reported in this table may differ from those reported by the Office of the Chief Actuary.
A "family" means beneficiaries entitled on one worker's account. The data may understate the number of families with dependents because records of awards to dependents made in a different calendar year are not available for inclusion.
Family composition
Worker onlyMenWomen
Worker with children
128 ♦ Annual Statistical Report on the Social Security Disability Insurance Program, 2016
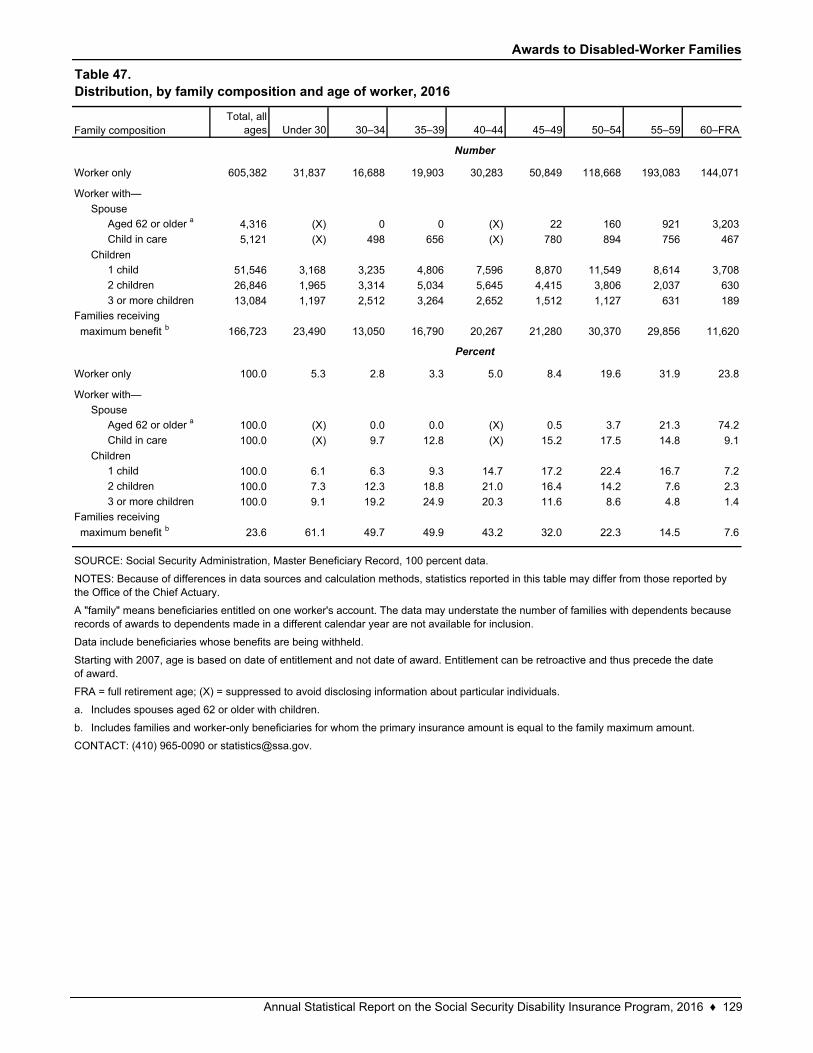
Awards to Disabled-Worker Families
Total, all ages Under 30 30–34 35–39 40–44 45–49 50–54 55–59 60–FRA
605,382 31,837 16,688 19,903 30,283 50,849 118,668 193,083 144,071
Aged 62 or older a 4,316 (X) 0 0 (X) 22 160 921 3,203
Child in care 5,121 (X) 498 656 (X) 780 894 756 467
1 child 51,546 3,168 3,235 4,806 7,596 8,870 11,549 8,614 3,708
2 children 26,846 1,965 3,314 5,034 5,645 4,415 3,806 2,037 630
3 or more children 13,084 1,197 2,512 3,264 2,652 1,512 1,127 631 189
166,723 23,490 13,050 16,790 20,267 21,280 30,370 29,856 11,620
100.0 5.3 2.8 3.3 5.0 8.4 19.6 31.9 23.8
Aged 62 or older a 100.0 (X) 0.0 0.0 (X) 0.5 3.7 21.3 74.2
Child in care 100.0 (X) 9.7 12.8 (X) 15.2 17.5 14.8 9.1
1 child 100.0 6.1 6.3 9.3 14.7 17.2 22.4 16.7 7.2
2 children 100.0 7.3 12.3 18.8 21.0 16.4 14.2 7.6 2.3
3 or more children 100.0 9.1 19.2 24.9 20.3 11.6 8.6 4.8 1.4
23.6 61.1 49.7 49.9 43.2 32.0 22.3 14.5 7.6
a.
b. Includes families and worker-only beneficiaries for whom the primary insurance amount is equal to the family maximum amount.
CONTACT: (410) 965-0090 or [email protected].
Family composition
Worker only
Worker with—
Spouse
Children
Families receiving
maximum benefit b
Worker only
Worker with—
NOTES: Because of differences in data sources and calculation methods, statistics reported in this table may differ from those reported by the Office of the Chief Actuary.
A "family" means beneficiaries entitled on one worker's account. The data may understate the number of families with dependents because records of awards to dependents made in a different calendar year are not available for inclusion.
Data include beneficiaries whose benefits are being withheld.
Starting with 2007, age is based on date of entitlement and not date of award. Entitlement can be retroactive and thus precede the date of award.
FRA = full retirement age; (X) = suppressed to avoid disclosing information about particular individuals.
Table 47.Distribution, by family composition and age of worker, 2016
Number
Includes spouses aged 62 or older with children.
Percent
SOURCE: Social Security Administration, Master Beneficiary Record, 100 percent data.
Spouse
Children
Families receiving
maximum benefit b
Annual Statistical Report on the Social Security Disability Insurance Program, 2016 ♦ 129
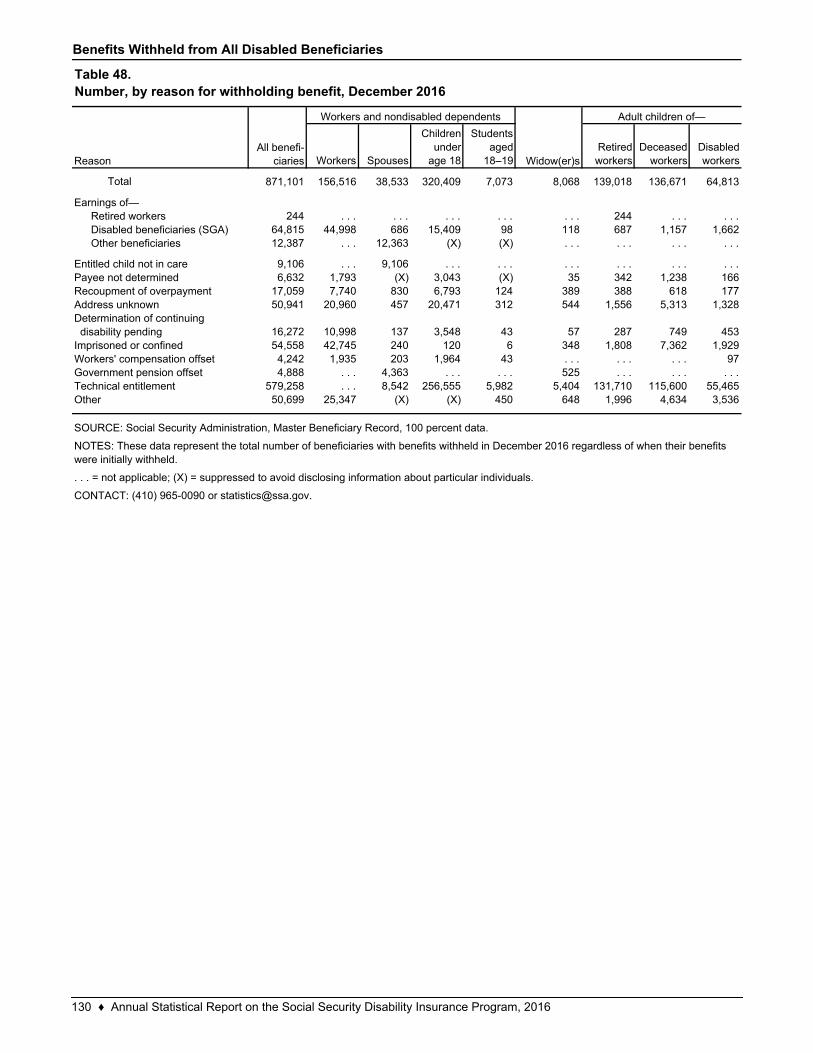
Benefits Withheld from All Disabled Beneficiaries
Workers Spouses
Children under
age 18
Students aged
18–19Retired workers
Deceased workers
Disabled workers
Total 871,101 156,516 38,533 320,409 7,073 8,068 139,018 136,671 64,813
244 . . . . . . . . . . . . . . . 244 . . . . . .64,815 44,998 686 15,409 98 118 687 1,157 1,66212,387 . . . 12,363 (X) (X) . . . . . . . . . . . .
9,106 . . . 9,106 . . . . . . . . . . . . . . . . . .6,632 1,793 (X) 3,043 (X) 35 342 1,238 166
17,059 7,740 830 6,793 124 389 388 618 17750,941 20,960 457 20,471 312 544 1,556 5,313 1,328
16,272 10,998 137 3,548 43 57 287 749 45354,558 42,745 240 120 6 348 1,808 7,362 1,9294,242 1,935 203 1,964 43 . . . . . . . . . 974,888 . . . 4,363 . . . . . . 525 . . . . . . . . .
579,258 . . . 8,542 256,555 5,982 5,404 131,710 115,600 55,46550,699 25,347 (X) (X) 450 648 1,996 4,634 3,536
SOURCE: Social Security Administration, Master Beneficiary Record, 100 percent data.
NOTES: These data represent the total number of beneficiaries with benefits withheld in December 2016 regardless of when their benefits were initially withheld.
. . . = not applicable; (X) = suppressed to avoid disclosing information about particular individuals.
CONTACT: (410) 965-0090 or [email protected].
Entitled child not in carePayee not determinedRecoupment of overpaymentAddress unknownDetermination of continuing disability pending
Workers' compensation offsetGovernment pension offsetTechnical entitlementOther
Earnings of—Retired workersDisabled beneficiaries (SGA)Other beneficiaries
Imprisoned or confined
Table 48.Number, by reason for withholding benefit, December 2016
All benefi-ciaries
Workers and nondisabled dependents
Widow(er)s
Adult children of—
Reason
130 ♦ Annual Statistical Report on the Social Security Disability Insurance Program, 2016
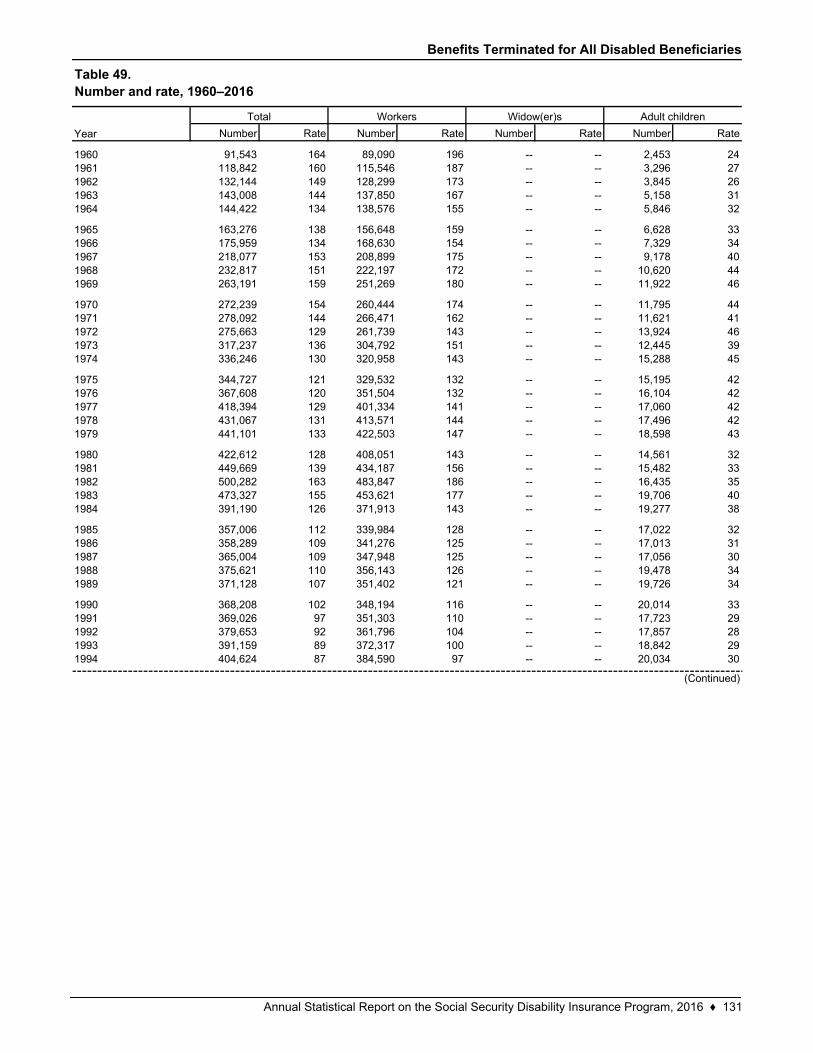
Benefits Terminated for All Disabled Beneficiaries
Number Rate Number Rate Number Rate Number Rate
91,543 164 89,090 196 -- -- 2,453 24118,842 160 115,546 187 -- -- 3,296 27132,144 149 128,299 173 -- -- 3,845 26143,008 144 137,850 167 -- -- 5,158 31144,422 134 138,576 155 -- -- 5,846 32
163,276 138 156,648 159 -- -- 6,628 33175,959 134 168,630 154 -- -- 7,329 34218,077 153 208,899 175 -- -- 9,178 40232,817 151 222,197 172 -- -- 10,620 44263,191 159 251,269 180 -- -- 11,922 46
272,239 154 260,444 174 -- -- 11,795 44278,092 144 266,471 162 -- -- 11,621 41275,663 129 261,739 143 -- -- 13,924 46317,237 136 304,792 151 -- -- 12,445 39336,246 130 320,958 143 -- -- 15,288 45
344,727 121 329,532 132 -- -- 15,195 42367,608 120 351,504 132 -- -- 16,104 42418,394 129 401,334 141 -- -- 17,060 42431,067 131 413,571 144 -- -- 17,496 42441,101 133 422,503 147 -- -- 18,598 43
422,612 128 408,051 143 -- -- 14,561 32449,669 139 434,187 156 -- -- 15,482 33500,282 163 483,847 186 -- -- 16,435 35473,327 155 453,621 177 -- -- 19,706 40391,190 126 371,913 143 -- -- 19,277 38
357,006 112 339,984 128 -- -- 17,022 32358,289 109 341,276 125 -- -- 17,013 31365,004 109 347,948 125 -- -- 17,056 30375,621 110 356,143 126 -- -- 19,478 34371,128 107 351,402 121 -- -- 19,726 34
368,208 102 348,194 116 -- -- 20,014 33369,026 97 351,303 110 -- -- 17,723 29379,653 92 361,796 104 -- -- 17,857 28391,159 89 372,317 100 -- -- 18,842 29404,624 87 384,590 97 -- -- 20,034 30
199219931994
1984
19851986198719881989
(Continued)
19901991
1983
197219731974
19751976197719781979
198019811982
1971
19601961196219631964
19651966196719681969
1970
Table 49.Number and rate, 1960–2016
Total Workers Widow(er)s Adult children
Year
Annual Statistical Report on the Social Security Disability Insurance Program, 2016 ♦ 131
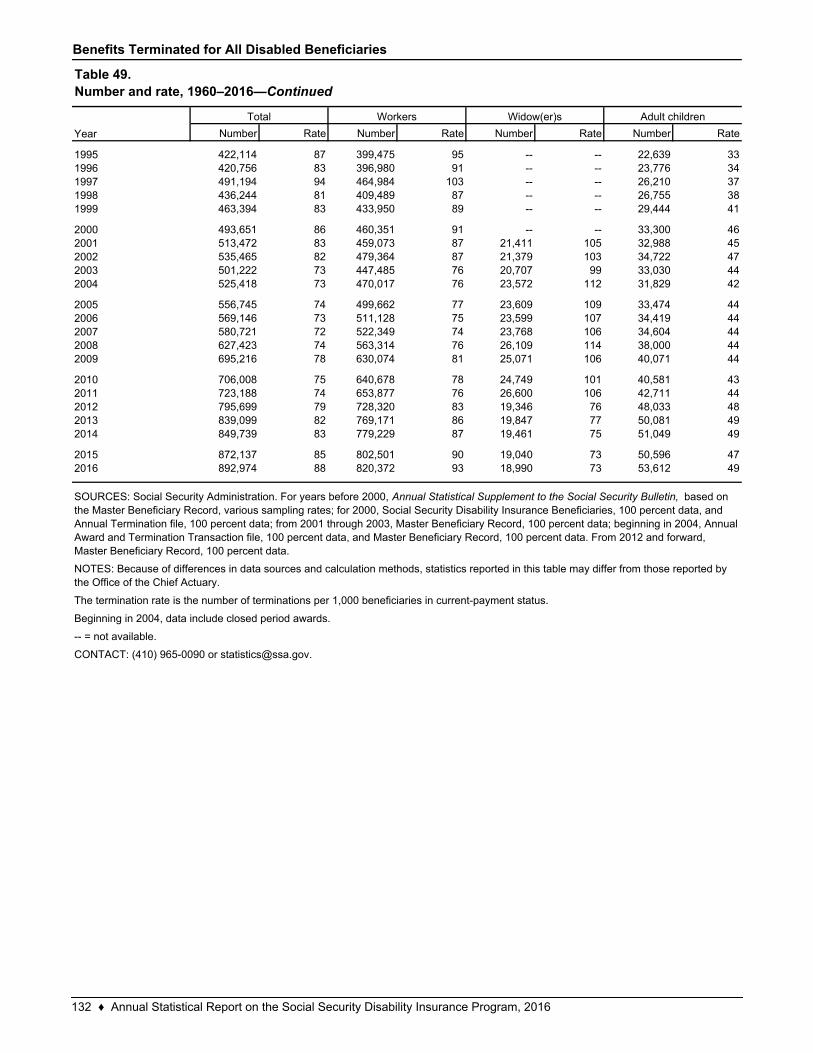
Benefits Terminated for All Disabled Beneficiaries
Number Rate Number Rate Number Rate Number Rate
422,114 87 399,475 95 -- -- 22,639 33420,756 83 396,980 91 -- -- 23,776 34491,194 94 464,984 103 -- -- 26,210 37436,244 81 409,489 87 -- -- 26,755 38463,394 83 433,950 89 -- -- 29,444 41
493,651 86 460,351 91 -- -- 33,300 46513,472 83 459,073 87 21,411 105 32,988 45535,465 82 479,364 87 21,379 103 34,722 47501,222 73 447,485 76 20,707 99 33,030 44525,418 73 470,017 76 23,572 112 31,829 42
556,745 74 499,662 77 23,609 109 33,474 44569,146 73 511,128 75 23,599 107 34,419 44580,721 72 522,349 74 23,768 106 34,604 44627,423 74 563,314 76 26,109 114 38,000 44695,216 78 630,074 81 25,071 106 40,071 44
706,008 75 640,678 78 24,749 101 40,581 43723,188 74 653,877 76 26,600 106 42,711 44795,699 79 728,320 83 19,346 76 48,033 48839,099 82 769,171 86 19,847 77 50,081 49849,739 83 779,229 87 19,461 75 51,049 49
872,137 85 802,501 90 19,040 73 50,596 47892,974 88 820,372 93 18,990 73 53,612 49
CONTACT: (410) 965-0090 or [email protected].
SOURCES: Social Security Administration. For years before 2000, Annual Statistical Supplement to the Social Security Bulletin, based on the Master Beneficiary Record, various sampling rates; for 2000, Social Security Disability Insurance Beneficiaries, 100 percent data, and Annual Termination file, 100 percent data; from 2001 through 2003, Master Beneficiary Record, 100 percent data; beginning in 2004, Annual Award and Termination Transaction file, 100 percent data, and Master Beneficiary Record, 100 percent data. From 2012 and forward, Master Beneficiary Record, 100 percent data.
NOTES: Because of differences in data sources and calculation methods, statistics reported in this table may differ from those reported by the Office of the Chief Actuary.
The termination rate is the number of terminations per 1,000 beneficiaries in current-payment status.
Beginning in 2004, data include closed period awards.
-- = not available.
2014
20152016
20082009
2010201120122013
2007
1996199719981999
20002001200220032004
20052006
1995
Table 49.Number and rate, 1960–2016—Continued
Year
Total Workers Widow(er)s Adult children
132 ♦ Annual Statistical Report on the Social Security Disability Insurance Program, 2016
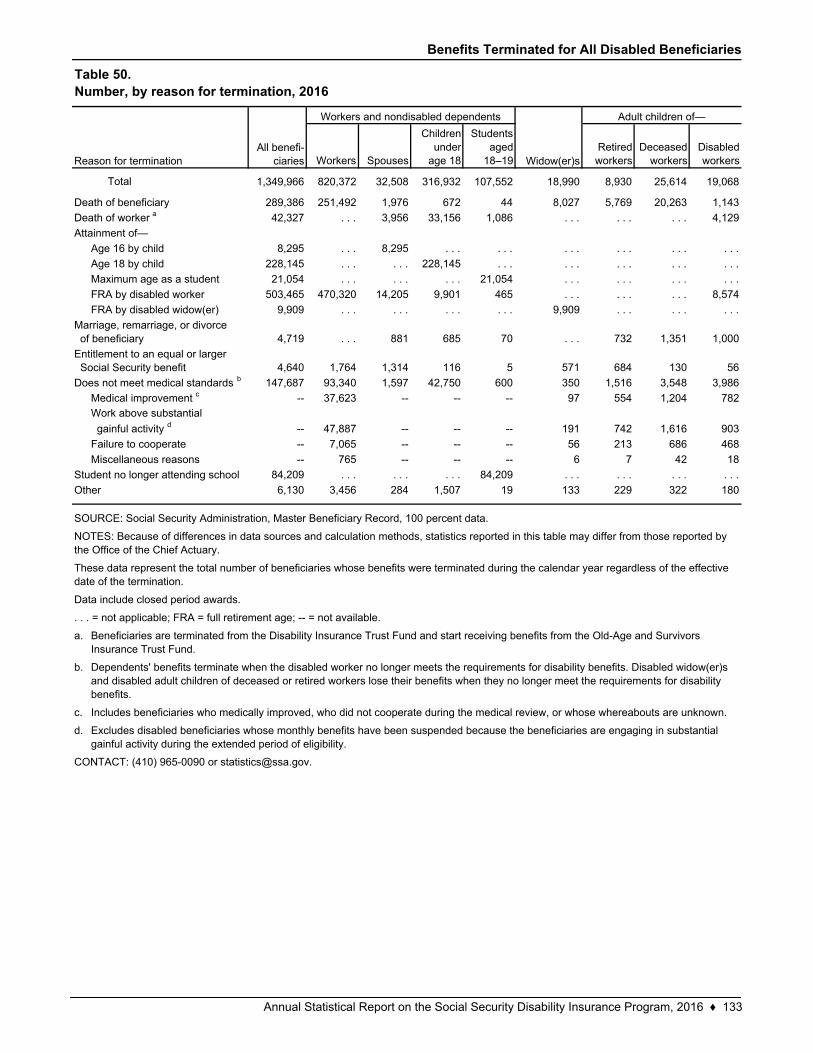
Benefits Terminated for All Disabled Beneficiaries
Workers Spouses
Children under
age 18
Students aged
18–19Retired workers
Deceased workers
Disabled workers
Total 1,349,966 820,372 32,508 316,932 107,552 18,990 8,930 25,614 19,068
289,386 251,492 1,976 672 44 8,027 5,769 20,263 1,143
42,327 . . . 3,956 33,156 1,086 . . . . . . . . . 4,129
8,295 . . . 8,295 . . . . . . . . . . . . . . . . . .
228,145 . . . . . . 228,145 . . . . . . . . . . . . . . .
21,054 . . . . . . . . . 21,054 . . . . . . . . . . . .
503,465 470,320 14,205 9,901 465 . . . . . . . . . 8,574
9,909 . . . . . . . . . . . . 9,909 . . . . . . . . .
4,719 . . . 881 685 70 . . . 732 1,351 1,000
4,640 1,764 1,314 116 5 571 684 130 56
147,687 93,340 1,597 42,750 600 350 1,516 3,548 3,986
-- 37,623 -- -- -- 97 554 1,204 782
-- 47,887 -- -- -- 191 742 1,616 903
-- 7,065 -- -- -- 56 213 686 468
-- 765 -- -- -- 6 7 42 18
84,209 . . . . . . . . . 84,209 . . . . . . . . . . . .
6,130 3,456 284 1,507 19 133 229 322 180
a.
b.
c.
d. Excludes disabled beneficiaries whose monthly benefits have been suspended because the beneficiaries are engaging in substantial gainful activity during the extended period of eligibility.
Miscellaneous reasons
Student no longer attending school
Other
Beneficiaries are terminated from the Disability Insurance Trust Fund and start receiving benefits from the Old-Age and Survivors Insurance Trust Fund.
Dependents' benefits terminate when the disabled worker no longer meets the requirements for disability benefits. Disabled widow(er)s and disabled adult children of deceased or retired workers lose their benefits when they no longer meet the requirements for disability benefits.
Includes beneficiaries who medically improved, who did not cooperate during the medical review, or whose whereabouts are unknown.
Marriage, remarriage, or divorce of beneficiary
Entitlement to an equal or larger Social Security benefit
Does not meet medical standards b
Medical improvement c
Work above substantial
gainful activity d
Failure to cooperate
CONTACT: (410) 965-0090 or [email protected].
Reason for termination
Death of beneficiary
Death of worker a
Attainment of—
Age 16 by child
SOURCE: Social Security Administration, Master Beneficiary Record, 100 percent data.
NOTES: Because of differences in data sources and calculation methods, statistics reported in this table may differ from those reported by the Office of the Chief Actuary.
These data represent the total number of beneficiaries whose benefits were terminated during the calendar year regardless of the effective date of the termination.
Data include closed period awards.
. . . = not applicable; FRA = full retirement age; -- = not available.
Age 18 by child
Maximum age as a student
FRA by disabled worker
FRA by disabled widow(er)
Table 50.Number, by reason for termination, 2016
All benefi-ciaries
Workers and nondisabled dependents
Widow(er)s
Adult children of—
Annual Statistical Report on the Social Security Disability Insurance Program, 2016 ♦ 133
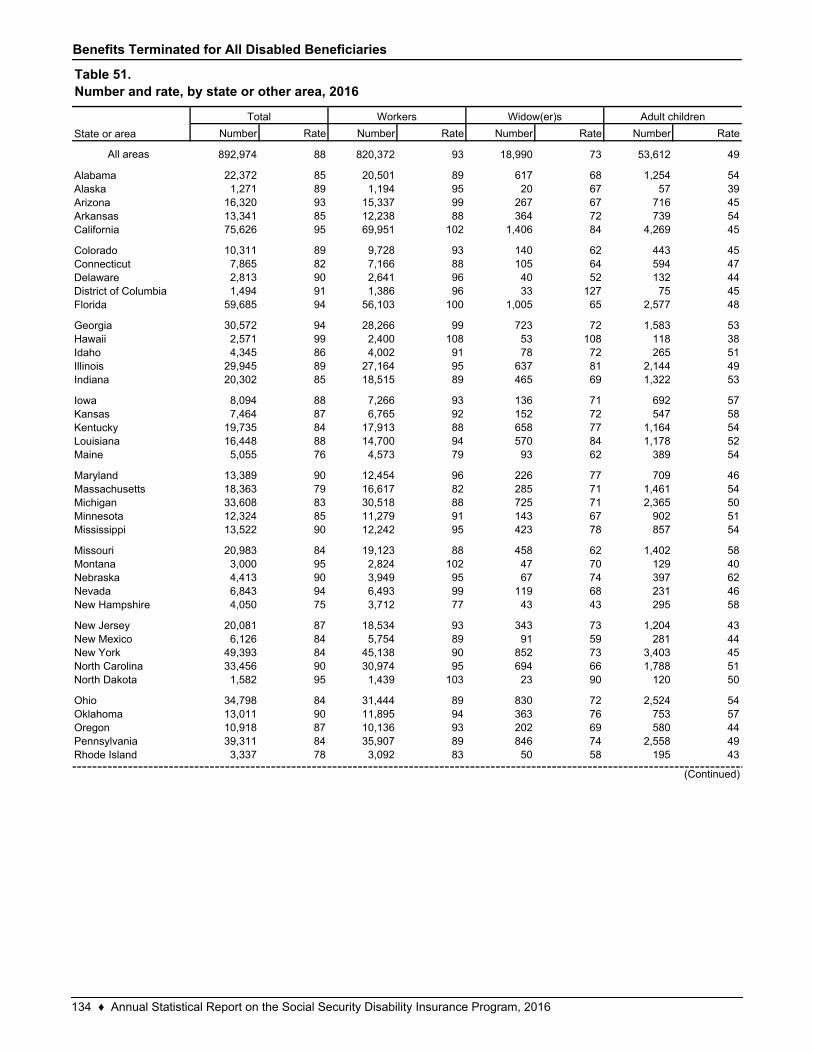
Benefits Terminated for All Disabled Beneficiaries
Number Rate Number Rate Number Rate Number Rate
All areas 892,974 88 820,372 93 18,990 73 53,612 49
22,372 85 20,501 89 617 68 1,254 541,271 89 1,194 95 20 67 57 39
16,320 93 15,337 99 267 67 716 4513,341 85 12,238 88 364 72 739 5475,626 95 69,951 102 1,406 84 4,269 45
10,311 89 9,728 93 140 62 443 457,865 82 7,166 88 105 64 594 472,813 90 2,641 96 40 52 132 441,494 91 1,386 96 33 127 75 45
59,685 94 56,103 100 1,005 65 2,577 48
30,572 94 28,266 99 723 72 1,583 532,571 99 2,400 108 53 108 118 384,345 86 4,002 91 78 72 265 51
29,945 89 27,164 95 637 81 2,144 4920,302 85 18,515 89 465 69 1,322 53
8,094 88 7,266 93 136 71 692 577,464 87 6,765 92 152 72 547 58
19,735 84 17,913 88 658 77 1,164 5416,448 88 14,700 94 570 84 1,178 525,055 76 4,573 79 93 62 389 54
13,389 90 12,454 96 226 77 709 4618,363 79 16,617 82 285 71 1,461 5433,608 83 30,518 88 725 71 2,365 5012,324 85 11,279 91 143 67 902 5113,522 90 12,242 95 423 78 857 54
20,983 84 19,123 88 458 62 1,402 583,000 95 2,824 102 47 70 129 404,413 90 3,949 95 67 74 397 626,843 94 6,493 99 119 68 231 464,050 75 3,712 77 43 43 295 58
20,081 87 18,534 93 343 73 1,204 436,126 84 5,754 89 91 59 281 44
49,393 84 45,138 90 852 73 3,403 4533,456 90 30,974 95 694 66 1,788 511,582 95 1,439 103 23 90 120 50
34,798 84 31,444 89 830 72 2,524 5413,011 90 11,895 94 363 76 753 5710,918 87 10,136 93 202 69 580 4439,311 84 35,907 89 846 74 2,558 493,337 78 3,092 83 50 58 195 43
NevadaNew Hampshire
New Jersey
New YorkNorth CarolinaNorth Dakota
OhioOklahomaOregonPennsylvaniaRhode Island
MinnesotaMississippi
MissouriMontanaNebraska
AlabamaAlaskaArizonaArkansas
Maine
District of ColumbiaFlorida
GeorgiaHawaiiIdahoIllinoisIndiana
IowaKansasKentuckyLouisiana
California
ColoradoConnecticutDelaware
(Continued)
New Mexico
MarylandMassachusettsMichigan
Table 51.Number and rate, by state or other area, 2016
Total Workers Widow(er)s Adult children
State or area
134 ♦ Annual Statistical Report on the Social Security Disability Insurance Program, 2016
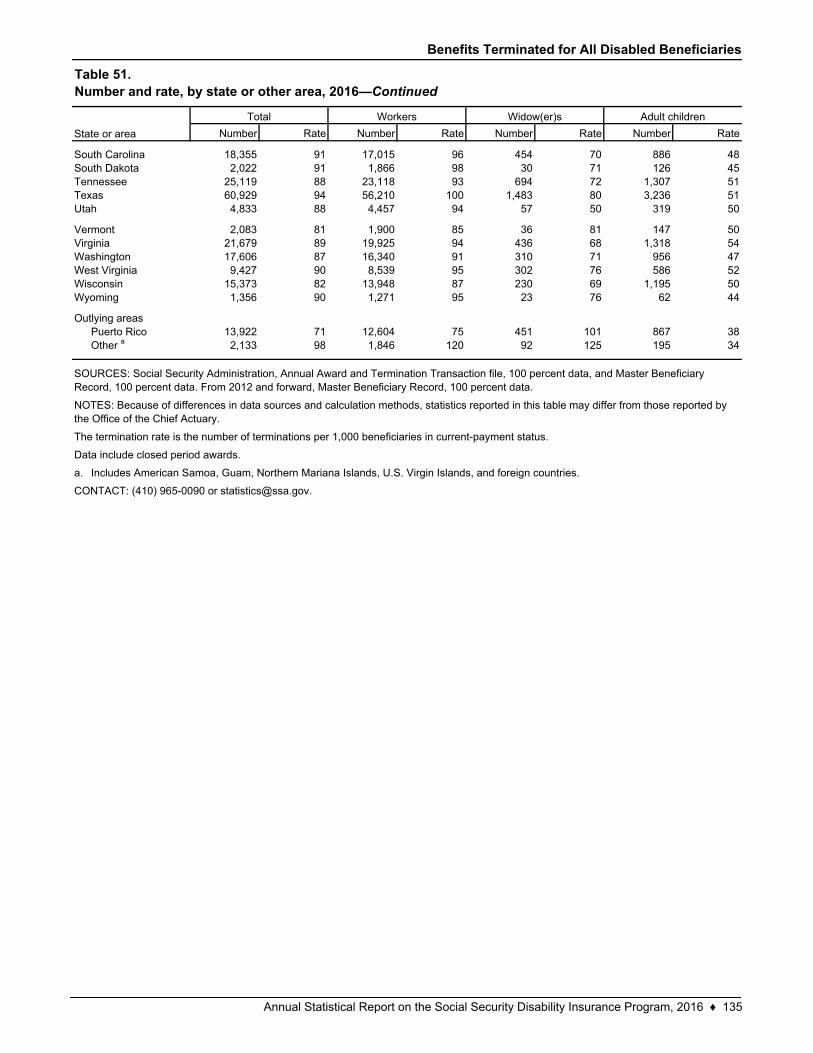
Benefits Terminated for All Disabled Beneficiaries
Number Rate Number Rate Number Rate Number Rate
18,355 91 17,015 96 454 70 886 482,022 91 1,866 98 30 71 126 45
25,119 88 23,118 93 694 72 1,307 5160,929 94 56,210 100 1,483 80 3,236 514,833 88 4,457 94 57 50 319 50
2,083 81 1,900 85 36 81 147 5021,679 89 19,925 94 436 68 1,318 5417,606 87 16,340 91 310 71 956 479,427 90 8,539 95 302 76 586 52
15,373 82 13,948 87 230 69 1,195 501,356 90 1,271 95 23 76 62 44
13,922 71 12,604 75 451 101 867 382,133 98 1,846 120 92 125 195 34
a.
Wisconsin
CONTACT: (410) 965-0090 or [email protected].
NOTES: Because of differences in data sources and calculation methods, statistics reported in this table may differ from those reported by the Office of the Chief Actuary.
The termination rate is the number of terminations per 1,000 beneficiaries in current-payment status.
Data include closed period awards.
Wyoming
Outlying areasPuerto RicoOther a
Includes American Samoa, Guam, Northern Mariana Islands, U.S. Virgin Islands, and foreign countries.
Utah
VermontVirginiaWashingtonWest Virginia
Texas
South CarolinaSouth DakotaTennessee
SOURCES: Social Security Administration, Annual Award and Termination Transaction file, 100 percent data, and Master Beneficiary Record, 100 percent data. From 2012 and forward, Master Beneficiary Record, 100 percent data.
Table 51.Number and rate, by state or other area, 2016—Continued
State or area
Total Workers Widow(er)s Adult children
Annual Statistical Report on the Social Security Disability Insurance Program, 2016 ♦ 135
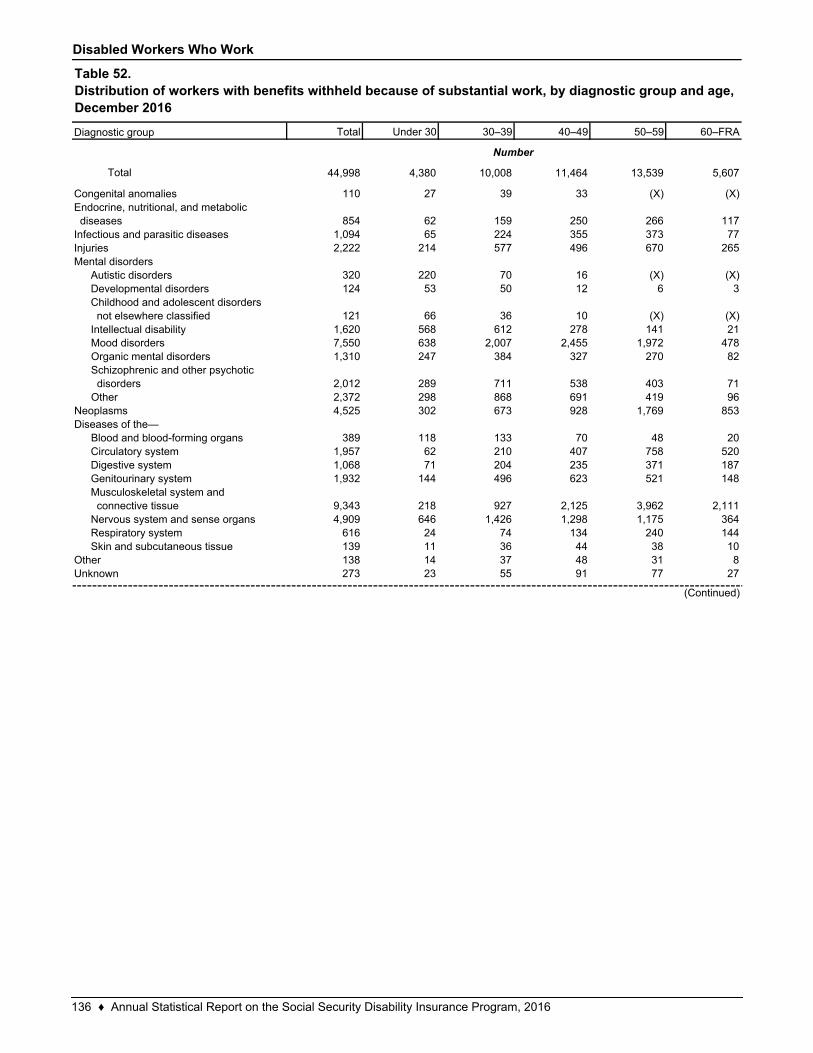
Disabled Workers Who Work
Total Under 30 30–39 40–49 50–59 60–FRA
Total 44,998 4,380 10,008 11,464 13,539 5,607
110 27 39 33 (X) (X)
854 62 159 250 266 1171,094 65 224 355 373 772,222 214 577 496 670 265
320 220 70 16 (X) (X)124 53 50 12 6 3
121 66 36 10 (X) (X)1,620 568 612 278 141 217,550 638 2,007 2,455 1,972 4781,310 247 384 327 270 82
2,012 289 711 538 403 712,372 298 868 691 419 964,525 302 673 928 1,769 853
389 118 133 70 48 201,957 62 210 407 758 5201,068 71 204 235 371 1871,932 144 496 623 521 148
9,343 218 927 2,125 3,962 2,1114,909 646 1,426 1,298 1,175 364
616 24 74 134 240 144139 11 36 44 38 10138 14 37 48 31 8273 23 55 91 77 27
Respiratory systemSkin and subcutaneous tissue
OtherUnknown
Circulatory systemDigestive systemGenitourinary systemMusculoskeletal system and connective tissueNervous system and sense organs
Diagnostic group
Congenital anomaliesEndocrine, nutritional, and metabolic diseasesInfectious and parasitic diseasesInjuriesMental disorders
Autistic disordersDevelopmental disordersChildhood and adolescent disorders not elsewhere classifiedIntellectual disability
Table 52.Distribution of workers with benefits withheld because of substantial work, by diagnostic group and age, December 2016
Number
(Continued)
Neoplasms
Mood disordersOrganic mental disordersSchizophrenic and other psychotic disordersOther
Diseases of the—Blood and blood-forming organs
136 ♦ Annual Statistical Report on the Social Security Disability Insurance Program, 2016
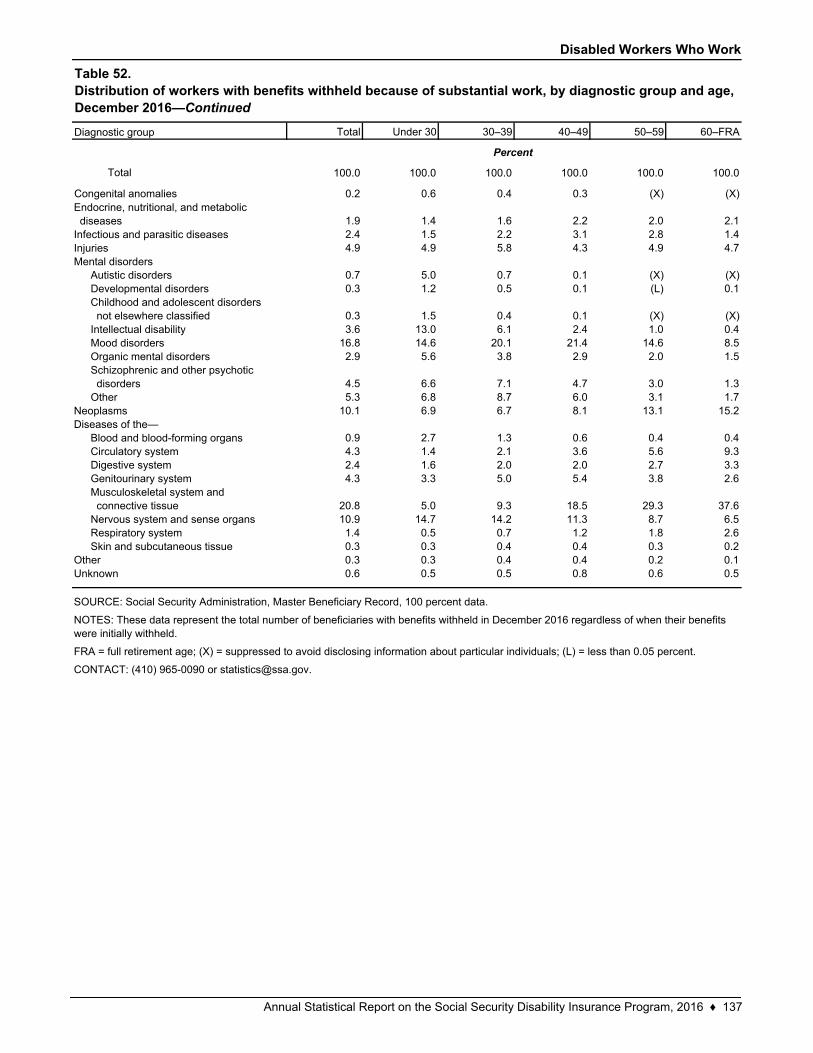
Disabled Workers Who Work
Total Under 30 30–39 40–49 50–59 60–FRA
Total 100.0 100.0 100.0 100.0 100.0 100.0
0.2 0.6 0.4 0.3 (X) (X)
1.9 1.4 1.6 2.2 2.0 2.12.4 1.5 2.2 3.1 2.8 1.44.9 4.9 5.8 4.3 4.9 4.7
0.7 5.0 0.7 0.1 (X) (X)0.3 1.2 0.5 0.1 (L) 0.1
0.3 1.5 0.4 0.1 (X) (X)3.6 13.0 6.1 2.4 1.0 0.4
16.8 14.6 20.1 21.4 14.6 8.52.9 5.6 3.8 2.9 2.0 1.5
4.5 6.6 7.1 4.7 3.0 1.35.3 6.8 8.7 6.0 3.1 1.7
10.1 6.9 6.7 8.1 13.1 15.2
0.9 2.7 1.3 0.6 0.4 0.44.3 1.4 2.1 3.6 5.6 9.32.4 1.6 2.0 2.0 2.7 3.34.3 3.3 5.0 5.4 3.8 2.6
20.8 5.0 9.3 18.5 29.3 37.610.9 14.7 14.2 11.3 8.7 6.51.4 0.5 0.7 1.2 1.8 2.60.3 0.3 0.4 0.4 0.3 0.20.3 0.3 0.4 0.4 0.2 0.10.6 0.5 0.5 0.8 0.6 0.5
OtherUnknown
Digestive systemGenitourinary systemMusculoskeletal system and connective tissueNervous system and sense organsRespiratory systemSkin and subcutaneous tissue
Circulatory system
Autistic disordersDevelopmental disordersChildhood and adolescent disorders not elsewhere classifiedIntellectual disabilityMood disordersOrganic mental disordersSchizophrenic and other psychotic disordersOther
NeoplasmsDiseases of the—
Blood and blood-forming organs
CONTACT: (410) 965-0090 or [email protected].
Percent
SOURCE: Social Security Administration, Master Beneficiary Record, 100 percent data.
NOTES: These data represent the total number of beneficiaries with benefits withheld in December 2016 regardless of when their benefits were initially withheld.
FRA = full retirement age; (X) = suppressed to avoid disclosing information about particular individuals; (L) = less than 0.05 percent.
Endocrine, nutritional, and metabolic diseasesInfectious and parasitic diseasesInjuriesMental disorders
Table 52.Distribution of workers with benefits withheld because of substantial work, by diagnostic group and age, December 2016—Continued
Diagnostic group
Congenital anomalies
Annual Statistical Report on the Social Security Disability Insurance Program, 2016 ♦ 137
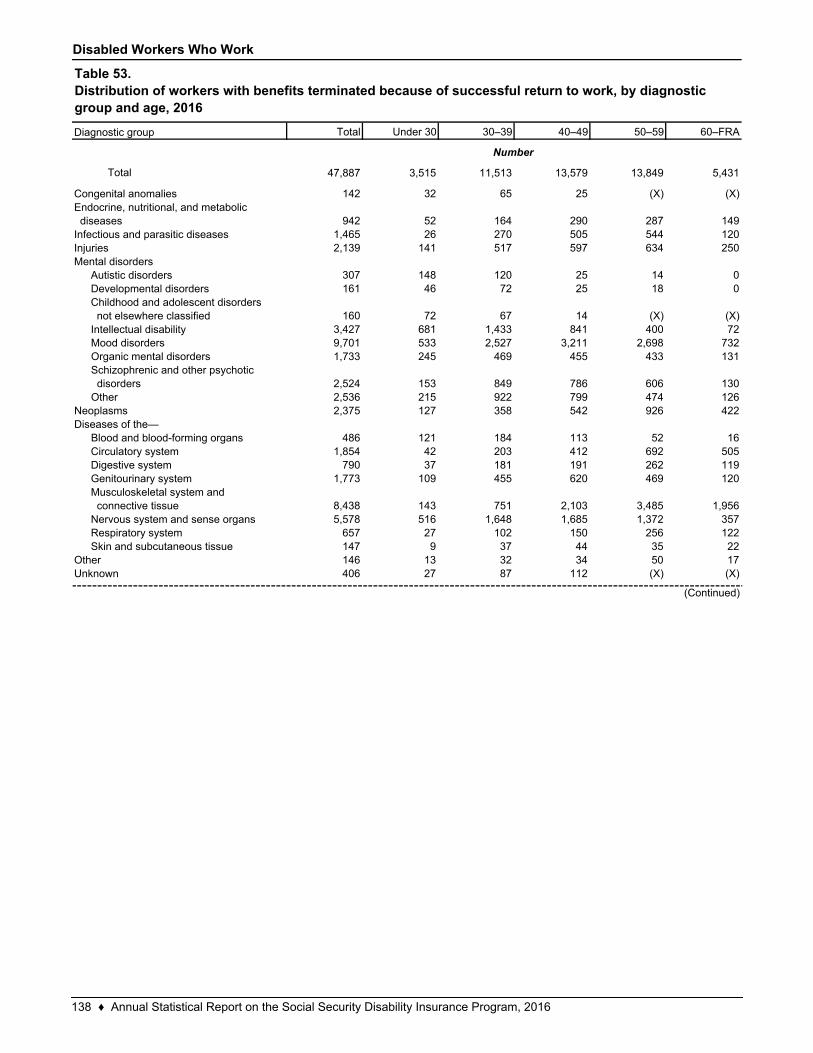
Disabled Workers Who Work
Total Under 30 30–39 40–49 50–59 60–FRA
Total 47,887 3,515 11,513 13,579 13,849 5,431
142 32 65 25 (X) (X)
942 52 164 290 287 1491,465 26 270 505 544 1202,139 141 517 597 634 250
307 148 120 25 14 0161 46 72 25 18 0
160 72 67 14 (X) (X)3,427 681 1,433 841 400 729,701 533 2,527 3,211 2,698 7321,733 245 469 455 433 131
2,524 153 849 786 606 1302,536 215 922 799 474 1262,375 127 358 542 926 422
486 121 184 113 52 161,854 42 203 412 692 505
790 37 181 191 262 1191,773 109 455 620 469 120
8,438 143 751 2,103 3,485 1,9565,578 516 1,648 1,685 1,372 357
657 27 102 150 256 122147 9 37 44 35 22146 13 32 34 50 17406 27 87 112 (X) (X)
Respiratory systemSkin and subcutaneous tissue
OtherUnknown
Circulatory systemDigestive systemGenitourinary systemMusculoskeletal system and connective tissueNervous system and sense organs
Diagnostic group
Congenital anomaliesEndocrine, nutritional, and metabolic diseasesInfectious and parasitic diseasesInjuriesMental disorders
Autistic disordersDevelopmental disordersChildhood and adolescent disorders not elsewhere classifiedIntellectual disability
Table 53.Distribution of workers with benefits terminated because of successful return to work, by diagnostic group and age, 2016
Number
(Continued)
Neoplasms
Mood disordersOrganic mental disordersSchizophrenic and other psychotic disordersOther
Diseases of the—Blood and blood-forming organs
138 ♦ Annual Statistical Report on the Social Security Disability Insurance Program, 2016
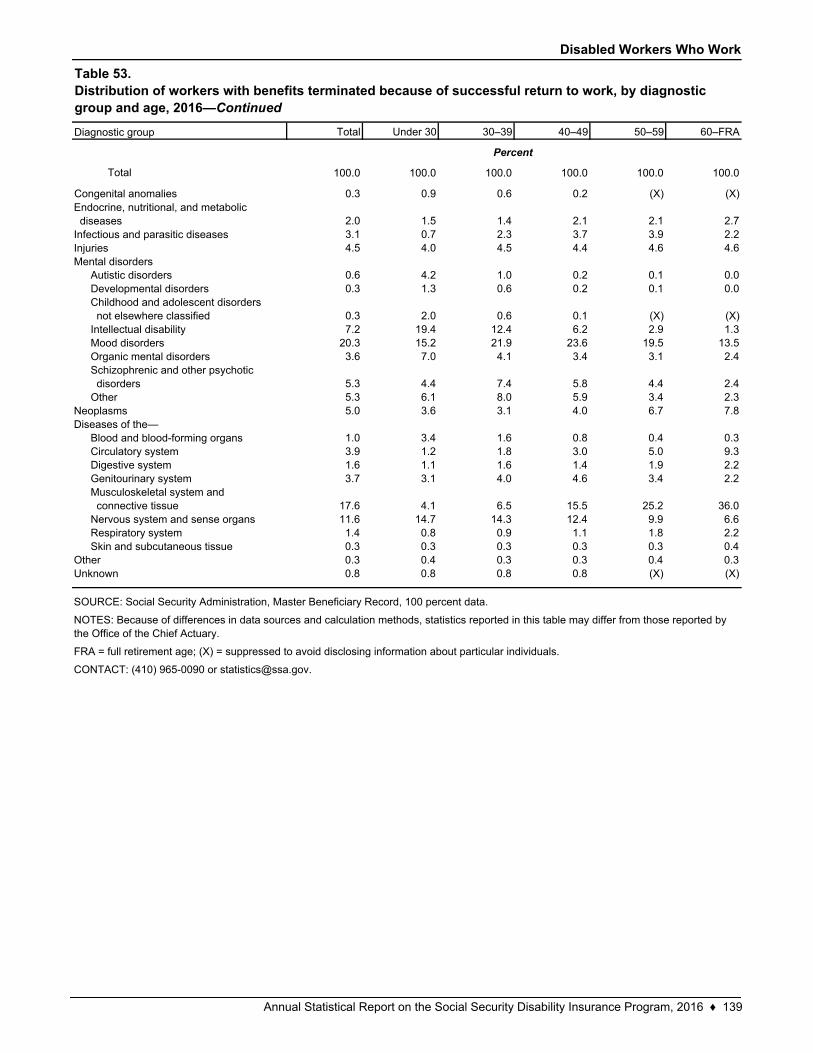
Disabled Workers Who Work
Total Under 30 30–39 40–49 50–59 60–FRA
Total 100.0 100.0 100.0 100.0 100.0 100.0
0.3 0.9 0.6 0.2 (X) (X)
2.0 1.5 1.4 2.1 2.1 2.73.1 0.7 2.3 3.7 3.9 2.24.5 4.0 4.5 4.4 4.6 4.6
0.6 4.2 1.0 0.2 0.1 0.00.3 1.3 0.6 0.2 0.1 0.0
0.3 2.0 0.6 0.1 (X) (X)7.2 19.4 12.4 6.2 2.9 1.3
20.3 15.2 21.9 23.6 19.5 13.53.6 7.0 4.1 3.4 3.1 2.4
5.3 4.4 7.4 5.8 4.4 2.45.3 6.1 8.0 5.9 3.4 2.35.0 3.6 3.1 4.0 6.7 7.8
1.0 3.4 1.6 0.8 0.4 0.33.9 1.2 1.8 3.0 5.0 9.31.6 1.1 1.6 1.4 1.9 2.23.7 3.1 4.0 4.6 3.4 2.2
17.6 4.1 6.5 15.5 25.2 36.011.6 14.7 14.3 12.4 9.9 6.61.4 0.8 0.9 1.1 1.8 2.20.3 0.3 0.3 0.3 0.3 0.40.3 0.4 0.3 0.3 0.4 0.30.8 0.8 0.8 0.8 (X) (X)
OtherUnknown
Digestive systemGenitourinary systemMusculoskeletal system and connective tissueNervous system and sense organsRespiratory systemSkin and subcutaneous tissue
Circulatory system
Autistic disordersDevelopmental disordersChildhood and adolescent disorders not elsewhere classifiedIntellectual disabilityMood disordersOrganic mental disordersSchizophrenic and other psychotic disordersOther
NeoplasmsDiseases of the—
Blood and blood-forming organs
CONTACT: (410) 965-0090 or [email protected].
Percent
SOURCE: Social Security Administration, Master Beneficiary Record, 100 percent data.
NOTES: Because of differences in data sources and calculation methods, statistics reported in this table may differ from those reported by the Office of the Chief Actuary.
FRA = full retirement age; (X) = suppressed to avoid disclosing information about particular individuals.
Endocrine, nutritional, and metabolic diseasesInfectious and parasitic diseasesInjuriesMental disorders
Table 53.Distribution of workers with benefits terminated because of successful return to work, by diagnostic group and age, 2016—Continued
Diagnostic group
Congenital anomalies
Annual Statistical Report on the Social Security Disability Insurance Program, 2016 ♦ 139
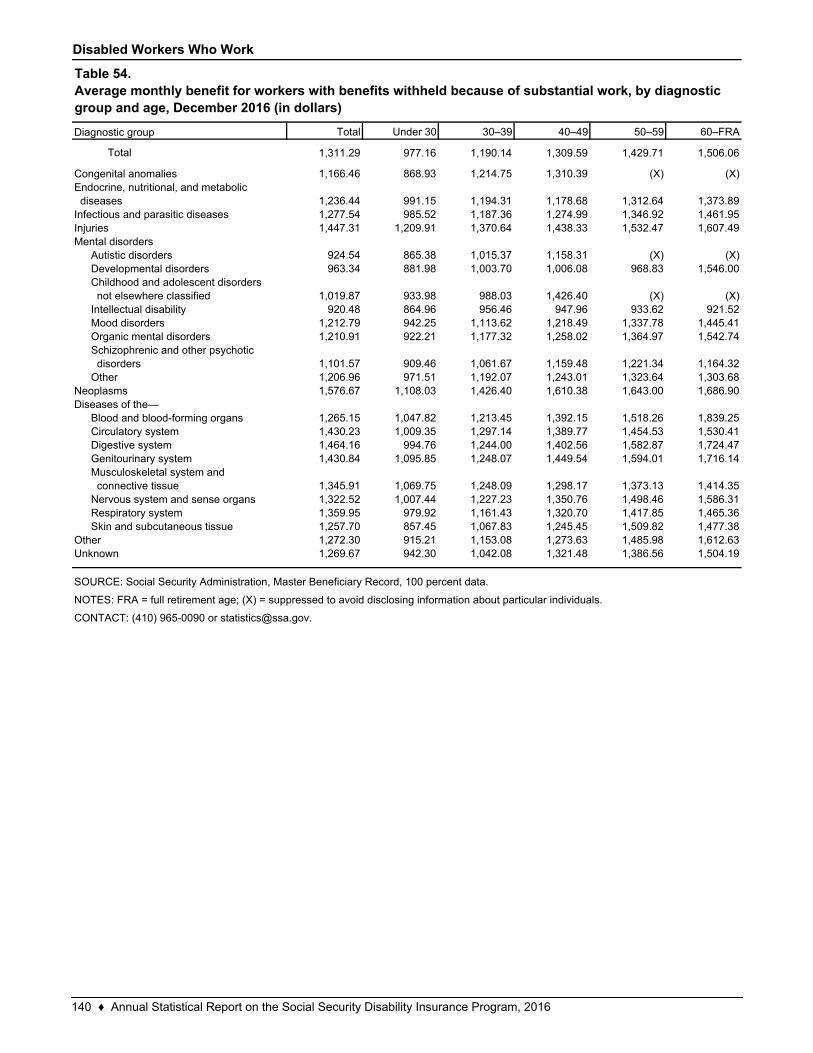
Disabled Workers Who Work
Total Under 30 30–39 40–49 50–59 60–FRA
Total 1,311.29 977.16 1,190.14 1,309.59 1,429.71 1,506.06
1,166.46 868.93 1,214.75 1,310.39 (X) (X)
1,236.44 991.15 1,194.31 1,178.68 1,312.64 1,373.891,277.54 985.52 1,187.36 1,274.99 1,346.92 1,461.951,447.31 1,209.91 1,370.64 1,438.33 1,532.47 1,607.49
924.54 865.38 1,015.37 1,158.31 (X) (X)963.34 881.98 1,003.70 1,006.08 968.83 1,546.00
1,019.87 933.98 988.03 1,426.40 (X) (X)920.48 864.96 956.46 947.96 933.62 921.52
1,212.79 942.25 1,113.62 1,218.49 1,337.78 1,445.411,210.91 922.21 1,177.32 1,258.02 1,364.97 1,542.74
1,101.57 909.46 1,061.67 1,159.48 1,221.34 1,164.321,206.96 971.51 1,192.07 1,243.01 1,323.64 1,303.681,576.67 1,108.03 1,426.40 1,610.38 1,643.00 1,686.90
1,265.15 1,047.82 1,213.45 1,392.15 1,518.26 1,839.251,430.23 1,009.35 1,297.14 1,389.77 1,454.53 1,530.411,464.16 994.76 1,244.00 1,402.56 1,582.87 1,724.471,430.84 1,095.85 1,248.07 1,449.54 1,594.01 1,716.14
1,345.91 1,069.75 1,248.09 1,298.17 1,373.13 1,414.351,322.52 1,007.44 1,227.23 1,350.76 1,498.46 1,586.311,359.95 979.92 1,161.43 1,320.70 1,417.85 1,465.361,257.70 857.45 1,067.83 1,245.45 1,509.82 1,477.381,272.30 915.21 1,153.08 1,273.63 1,485.98 1,612.631,269.67 942.30 1,042.08 1,321.48 1,386.56 1,504.19
NOTES: FRA = full retirement age; (X) = suppressed to avoid disclosing information about particular individuals.
CONTACT: (410) 965-0090 or [email protected].
Diagnostic group
Congenital anomaliesEndocrine, nutritional, and metabolic diseasesInfectious and parasitic diseasesInjuriesMental disorders
Autistic disordersDevelopmental disorders
Schizophrenic and other psychotic disordersOther
NeoplasmsDiseases of the—
Blood and blood-forming organs
Other
Table 54.Average monthly benefit for workers with benefits withheld because of substantial work, by diagnostic group and age, December 2016 (in dollars)
SOURCE: Social Security Administration, Master Beneficiary Record, 100 percent data.
Childhood and adolescent disorders not elsewhere classifiedIntellectual disabilityMood disordersOrganic mental disorders
Circulatory system
Unknown
Digestive systemGenitourinary systemMusculoskeletal system and connective tissueNervous system and sense organsRespiratory systemSkin and subcutaneous tissue
140 ♦ Annual Statistical Report on the Social Security Disability Insurance Program, 2016
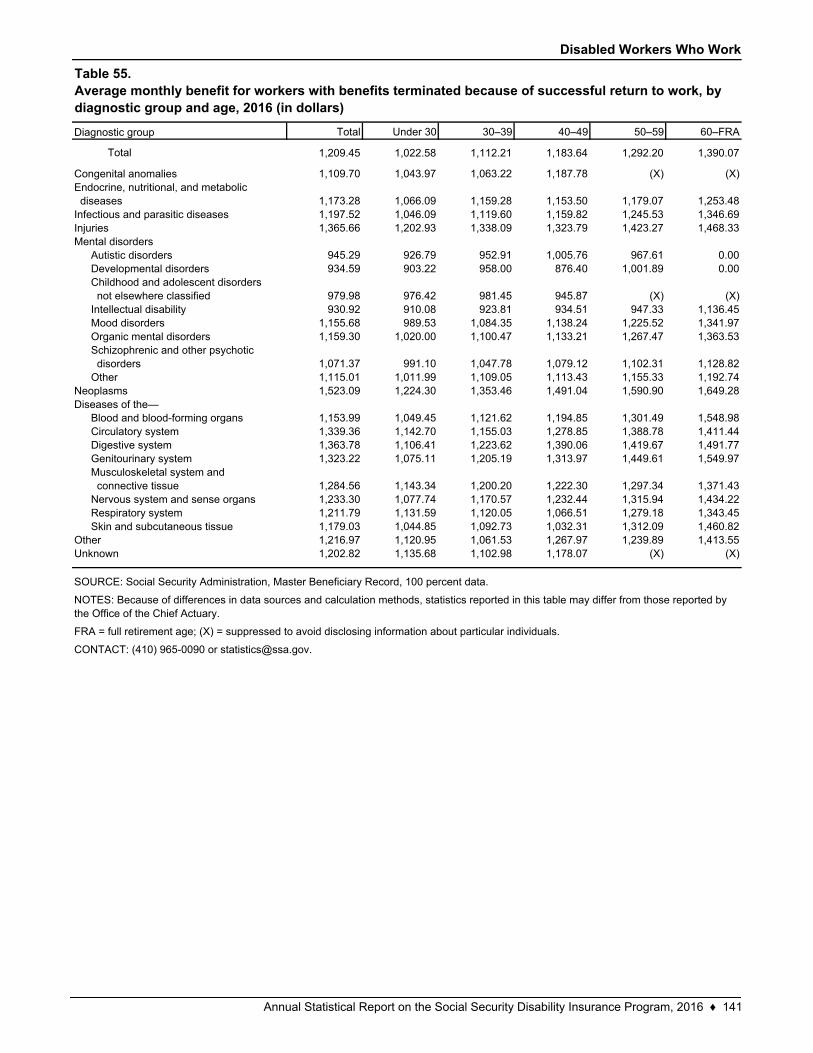
Disabled Workers Who Work
Total Under 30 30–39 40–49 50–59 60–FRA
Total 1,209.45 1,022.58 1,112.21 1,183.64 1,292.20 1,390.07
1,109.70 1,043.97 1,063.22 1,187.78 (X) (X)
1,173.28 1,066.09 1,159.28 1,153.50 1,179.07 1,253.481,197.52 1,046.09 1,119.60 1,159.82 1,245.53 1,346.691,365.66 1,202.93 1,338.09 1,323.79 1,423.27 1,468.33
945.29 926.79 952.91 1,005.76 967.61 0.00934.59 903.22 958.00 876.40 1,001.89 0.00
979.98 976.42 981.45 945.87 (X) (X)930.92 910.08 923.81 934.51 947.33 1,136.45
1,155.68 989.53 1,084.35 1,138.24 1,225.52 1,341.971,159.30 1,020.00 1,100.47 1,133.21 1,267.47 1,363.53
1,071.37 991.10 1,047.78 1,079.12 1,102.31 1,128.821,115.01 1,011.99 1,109.05 1,113.43 1,155.33 1,192.741,523.09 1,224.30 1,353.46 1,491.04 1,590.90 1,649.28
1,153.99 1,049.45 1,121.62 1,194.85 1,301.49 1,548.981,339.36 1,142.70 1,155.03 1,278.85 1,388.78 1,411.441,363.78 1,106.41 1,223.62 1,390.06 1,419.67 1,491.771,323.22 1,075.11 1,205.19 1,313.97 1,449.61 1,549.97
1,284.56 1,143.34 1,200.20 1,222.30 1,297.34 1,371.431,233.30 1,077.74 1,170.57 1,232.44 1,315.94 1,434.221,211.79 1,131.59 1,120.05 1,066.51 1,279.18 1,343.451,179.03 1,044.85 1,092.73 1,032.31 1,312.09 1,460.821,216.97 1,120.95 1,061.53 1,267.97 1,239.89 1,413.551,202.82 1,135.68 1,102.98 1,178.07 (X) (X)
NOTES: Because of differences in data sources and calculation methods, statistics reported in this table may differ from those reported by the Office of the Chief Actuary.
FRA = full retirement age; (X) = suppressed to avoid disclosing information about particular individuals.
CONTACT: (410) 965-0090 or [email protected].
Diagnostic group
Congenital anomaliesEndocrine, nutritional, and metabolic diseasesInfectious and parasitic diseasesInjuriesMental disorders
Autistic disorders
Organic mental disordersSchizophrenic and other psychotic disordersOther
NeoplasmsDiseases of the—
Skin and subcutaneous tissue
Table 55.Average monthly benefit for workers with benefits terminated because of successful return to work, by diagnostic group and age, 2016 (in dollars)
SOURCE: Social Security Administration, Master Beneficiary Record, 100 percent data.
Developmental disordersChildhood and adolescent disorders not elsewhere classifiedIntellectual disabilityMood disorders
Blood and blood-forming organs
OtherUnknown
Circulatory systemDigestive systemGenitourinary systemMusculoskeletal system and connective tissueNervous system and sense organsRespiratory system
Annual Statistical Report on the Social Security Disability Insurance Program, 2016 ♦ 141
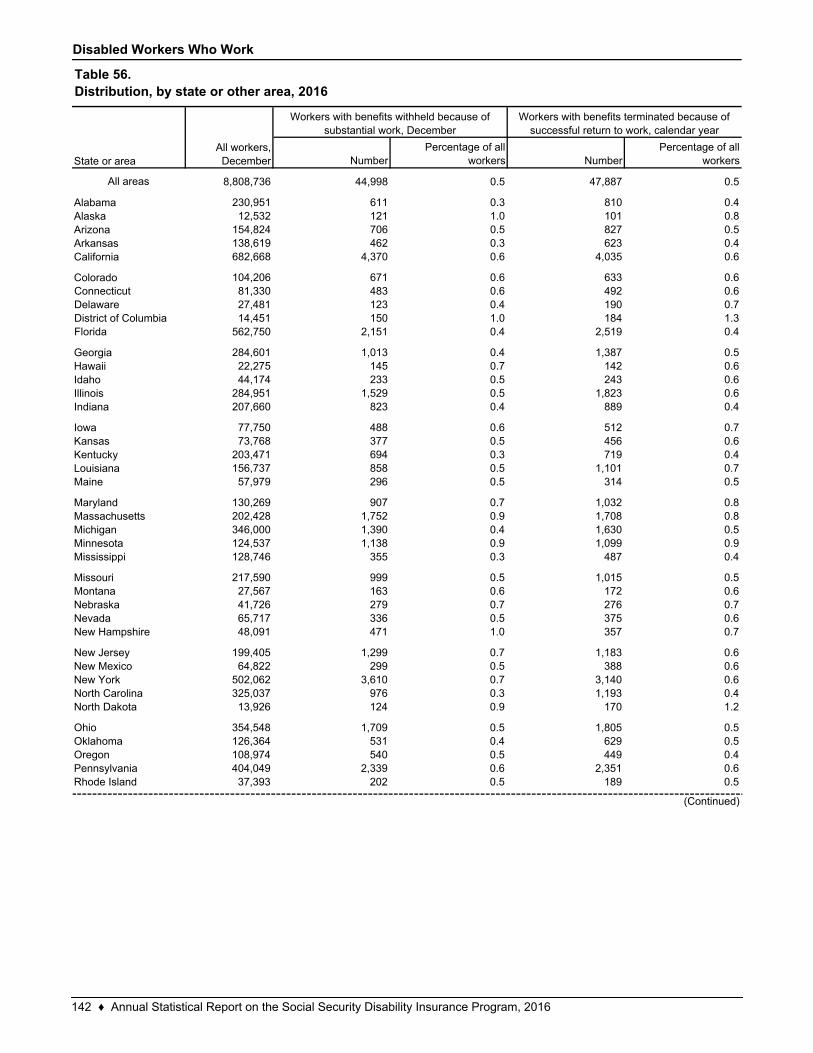
Disabled Workers Who Work
NumberPercentage of all
workers NumberPercentage of all
workers
All areas 8,808,736 44,998 0.5 47,887 0.5
230,951 611 0.3 810 0.412,532 121 1.0 101 0.8
154,824 706 0.5 827 0.5138,619 462 0.3 623 0.4682,668 4,370 0.6 4,035 0.6
104,206 671 0.6 633 0.681,330 483 0.6 492 0.627,481 123 0.4 190 0.714,451 150 1.0 184 1.3
562,750 2,151 0.4 2,519 0.4
284,601 1,013 0.4 1,387 0.522,275 145 0.7 142 0.644,174 233 0.5 243 0.6
284,951 1,529 0.5 1,823 0.6207,660 823 0.4 889 0.4
77,750 488 0.6 512 0.773,768 377 0.5 456 0.6
203,471 694 0.3 719 0.4156,737 858 0.5 1,101 0.757,979 296 0.5 314 0.5
130,269 907 0.7 1,032 0.8202,428 1,752 0.9 1,708 0.8346,000 1,390 0.4 1,630 0.5124,537 1,138 0.9 1,099 0.9128,746 355 0.3 487 0.4
217,590 999 0.5 1,015 0.527,567 163 0.6 172 0.641,726 279 0.7 276 0.765,717 336 0.5 375 0.648,091 471 1.0 357 0.7
199,405 1,299 0.7 1,183 0.664,822 299 0.5 388 0.6
502,062 3,610 0.7 3,140 0.6325,037 976 0.3 1,193 0.413,926 124 0.9 170 1.2
354,548 1,709 0.5 1,805 0.5126,364 531 0.4 629 0.5108,974 540 0.5 449 0.4404,049 2,339 0.6 2,351 0.637,393 202 0.5 189 0.5
North Dakota
OhioOklahomaOregonPennsylvaniaRhode Island
North Carolina
MichiganMinnesotaMississippi
MissouriMontanaNebraskaNevadaNew Hampshire
New JerseyNew MexicoNew York
Massachusetts
GeorgiaHawaiiIdahoIllinoisIndiana
IowaKansasKentuckyLouisianaMaine
Maryland
State or area
AlabamaAlaskaArizonaArkansas
(Continued)
California
Colorado
Table 56.Distribution, by state or other area, 2016
All workers, December
Workers with benefits withheld because of substantial work, December
Workers with benefits terminated because of successful return to work, calendar year
Florida
ConnecticutDelawareDistrict of Columbia
142 ♦ Annual Statistical Report on the Social Security Disability Insurance Program, 2016
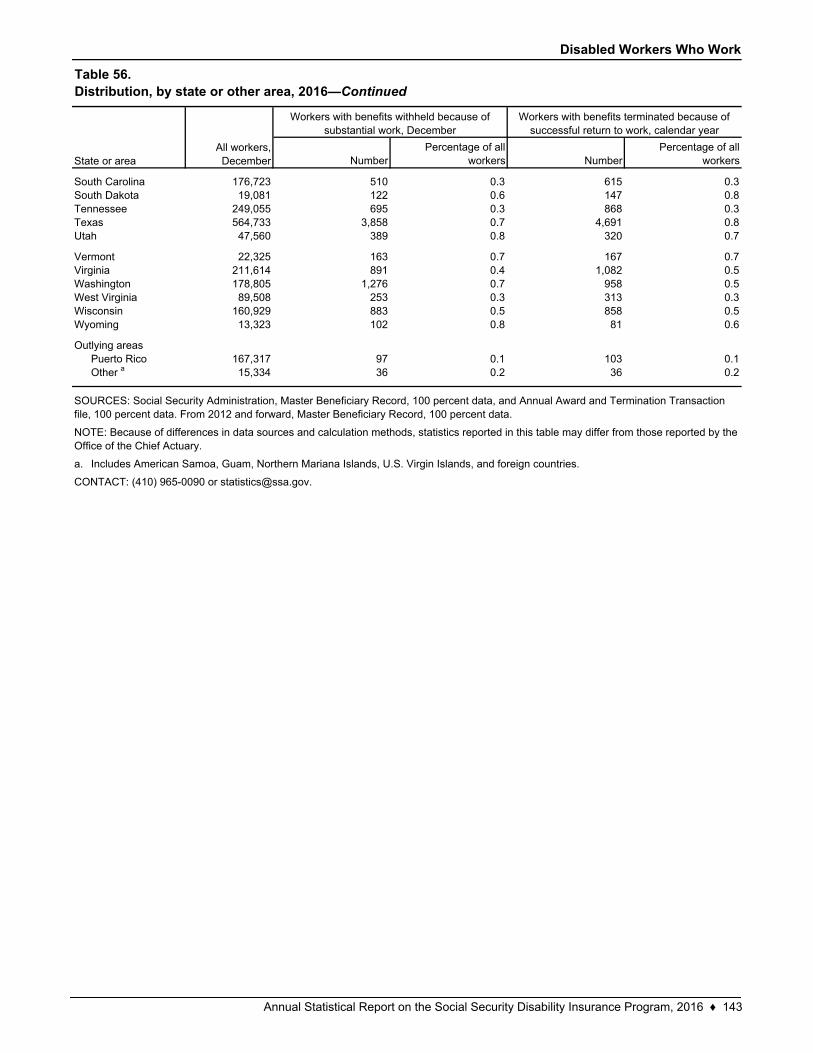
Disabled Workers Who Work
NumberPercentage of all
workers NumberPercentage of all
workers
176,723 510 0.3 615 0.319,081 122 0.6 147 0.8
249,055 695 0.3 868 0.3564,733 3,858 0.7 4,691 0.847,560 389 0.8 320 0.7
22,325 163 0.7 167 0.7211,614 891 0.4 1,082 0.5178,805 1,276 0.7 958 0.589,508 253 0.3 313 0.3
160,929 883 0.5 858 0.513,323 102 0.8 81 0.6
167,317 97 0.1 103 0.115,334 36 0.2 36 0.2
a.
Puerto RicoOther a
Includes American Samoa, Guam, Northern Mariana Islands, U.S. Virgin Islands, and foreign countries.
VirginiaWashingtonWest VirginiaWisconsinWyoming
Outlying areas
Vermont
South CarolinaSouth DakotaTennesseeTexasUtah
SOURCES: Social Security Administration, Master Beneficiary Record, 100 percent data, and Annual Award and Termination Transaction file, 100 percent data. From 2012 and forward, Master Beneficiary Record, 100 percent data.
NOTE: Because of differences in data sources and calculation methods, statistics reported in this table may differ from those reported by the Office of the Chief Actuary.
CONTACT: (410) 965-0090 or [email protected].
Table 56.Distribution, by state or other area, 2016—Continued
State or areaAll workers, December
Workers with benefits withheld because of substantial work, December
Workers with benefits terminated because of successful return to work, calendar year
Annual Statistical Report on the Social Security Disability Insurance Program, 2016 ♦ 143
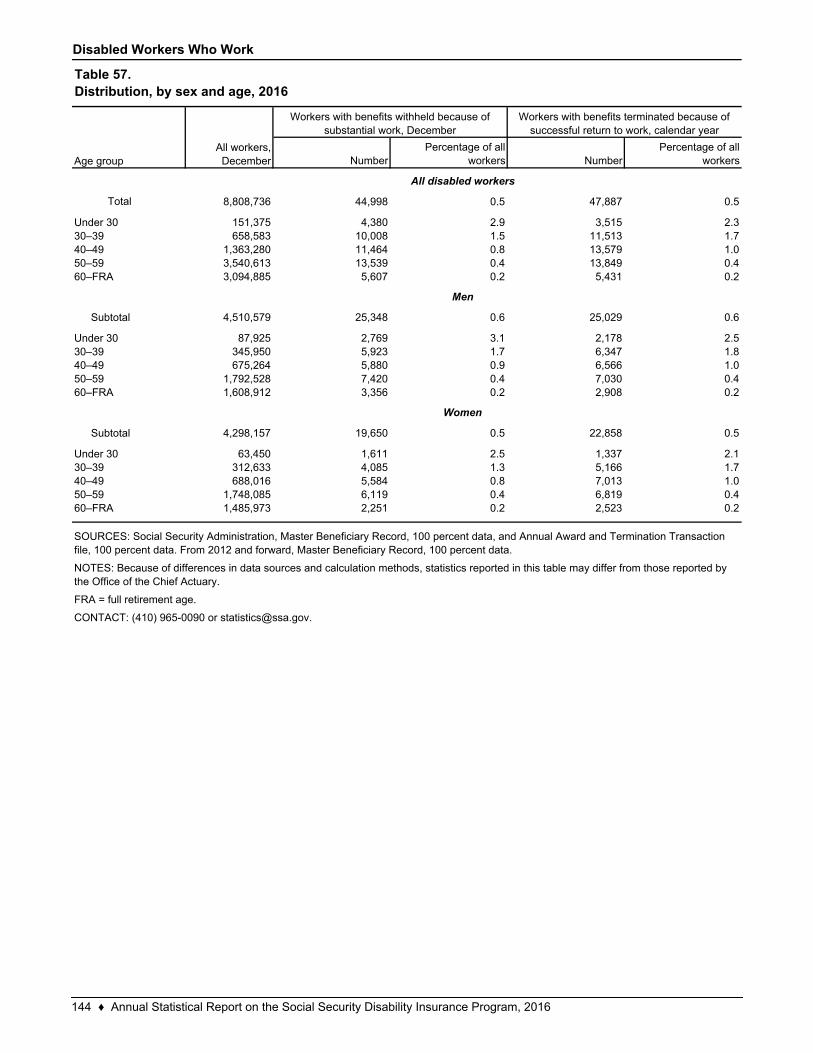
Disabled Workers Who Work
NumberPercentage of all
workers NumberPercentage of all
workers
Total 8,808,736 44,998 0.5 47,887 0.5
151,375 4,380 2.9 3,515 2.3658,583 10,008 1.5 11,513 1.7
1,363,280 11,464 0.8 13,579 1.03,540,613 13,539 0.4 13,849 0.43,094,885 5,607 0.2 5,431 0.2
4,510,579 25,348 0.6 25,029 0.6
87,925 2,769 3.1 2,178 2.5345,950 5,923 1.7 6,347 1.8675,264 5,880 0.9 6,566 1.0
1,792,528 7,420 0.4 7,030 0.41,608,912 3,356 0.2 2,908 0.2
4,298,157 19,650 0.5 22,858 0.5
63,450 1,611 2.5 1,337 2.1312,633 4,085 1.3 5,166 1.7688,016 5,584 0.8 7,013 1.0
1,748,085 6,119 0.4 6,819 0.41,485,973 2,251 0.2 2,523 0.2
CONTACT: (410) 965-0090 or [email protected].
Age group
Under 3030–3940–4950–5960–FRA
Subtotal
Under 3030–39
All disabled workers
Men
Women
SOURCES: Social Security Administration, Master Beneficiary Record, 100 percent data, and Annual Award and Termination Transaction file, 100 percent data. From 2012 and forward, Master Beneficiary Record, 100 percent data.
NOTES: Because of differences in data sources and calculation methods, statistics reported in this table may differ from those reported by the Office of the Chief Actuary.
Under 30
Table 57.Distribution, by sex and age, 2016
All workers, December
Workers with benefits withheld because of substantial work, December
Workers with benefits terminated because of successful return to work, calendar year
FRA = full retirement age.
40–4950–5960–FRA
Subtotal
30–3940–4950–5960–FRA
144 ♦ Annual Statistical Report on the Social Security Disability Insurance Program, 2016
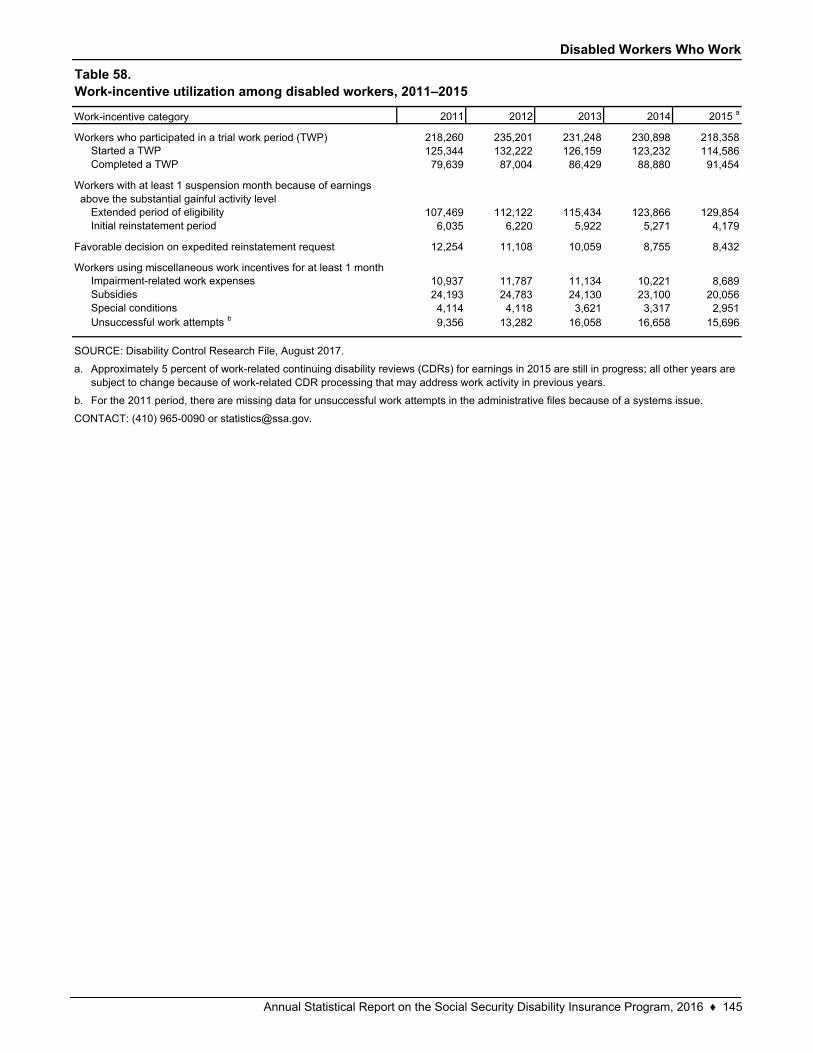
Disabled Workers Who Work
2011 2012 2013 2014 2015 a
218,260 235,201 231,248 230,898 218,358Started a TWP 125,344 132,222 126,159 123,232 114,586Completed a TWP 79,639 87,004 86,429 88,880 91,454
Extended period of eligibility 107,469 112,122 115,434 123,866 129,854Initial reinstatement period 6,035 6,220 5,922 5,271 4,179
12,254 11,108 10,059 8,755 8,432
Impairment-related work expenses 10,937 11,787 11,134 10,221 8,689Subsidies 24,193 24,783 24,130 23,100 20,056Special conditions 4,114 4,118 3,621 3,317 2,951Unsuccessful work attempts b 9,356 13,282 16,058 16,658 15,696
a.
b.
Approximately 5 percent of work-related continuing disability reviews (CDRs) for earnings in 2015 are still in progress; all other years are subject to change because of work-related CDR processing that may address work activity in previous years.
CONTACT: (410) 965-0090 or [email protected].
For the 2011 period, there are missing data for unsuccessful work attempts in the administrative files because of a systems issue.
Table 58.Work-incentive utilization among disabled workers, 2011–2015
SOURCE: Disability Control Research File, August 2017.
Work-incentive category
Workers who participated in a trial work period (TWP)
Workers with at least 1 suspension month because of earnings above the substantial gainful activity level
Favorable decision on expedited reinstatement request
Workers using miscellaneous work incentives for at least 1 month
Annual Statistical Report on the Social Security Disability Insurance Program, 2016 ♦ 145
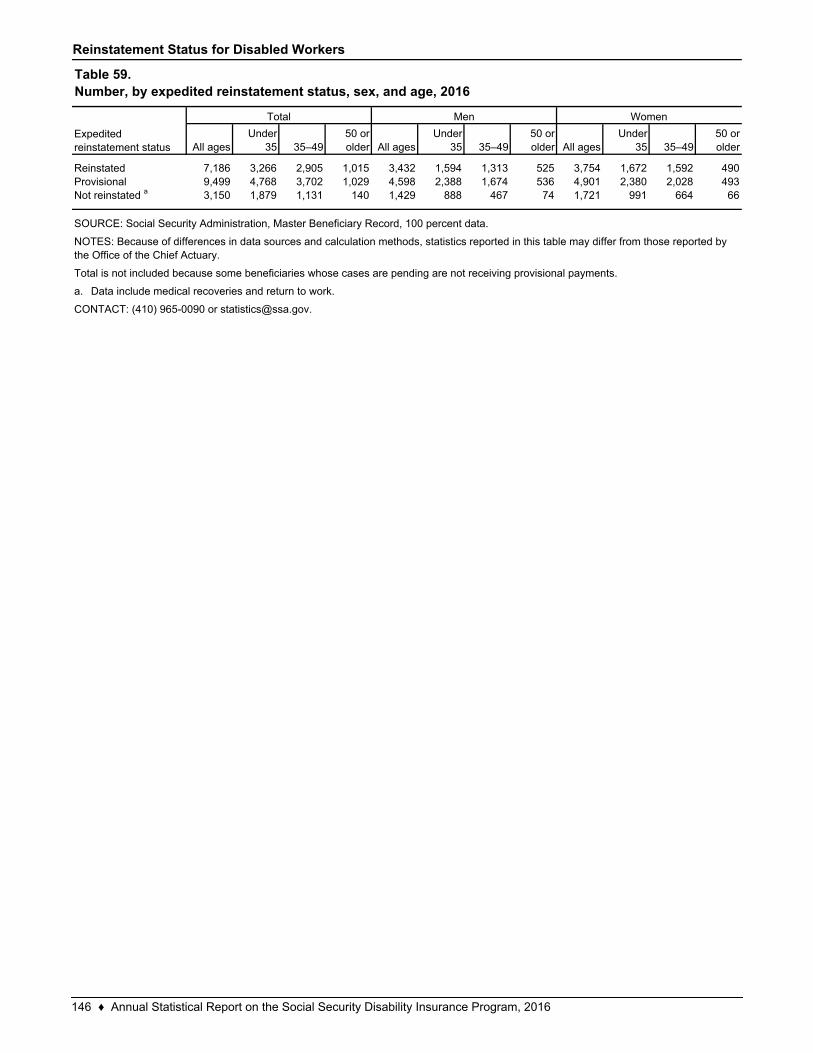
Reinstatement Status for Disabled Workers
All agesUnder
35 35–4950 or older All ages
Under 35 35–49
50 or older All ages
Under 35 35–49
50 or older
7,186 3,266 2,905 1,015 3,432 1,594 1,313 525 3,754 1,672 1,592 4909,499 4,768 3,702 1,029 4,598 2,388 1,674 536 4,901 2,380 2,028 4933,150 1,879 1,131 140 1,429 888 467 74 1,721 991 664 66
a.
CONTACT: (410) 965-0090 or [email protected].
ReinstatedProvisionalNot reinstated a
Data include medical recoveries and return to work.
SOURCE: Social Security Administration, Master Beneficiary Record, 100 percent data.
NOTES: Because of differences in data sources and calculation methods, statistics reported in this table may differ from those reported by the Office of the Chief Actuary.
Total is not included because some beneficiaries whose cases are pending are not receiving provisional payments.
Table 59.Number, by expedited reinstatement status, sex, and age, 2016
Total Men Women
Expedited reinstatement status
146 ♦ Annual Statistical Report on the Social Security Disability Insurance Program, 2016
Outcomes of Applications for Disability Benefits
148 ♦ Annual Statistical Report on the Social Security Disability Insurance Program, 2016
Notes
The tables in this section provide data on the outcomes of applications for disability benefits. The data on appli-cations are derived from the Social Security Administration’s (SSA’s) Disability Research File maintained by the Office of Disability Programs. Each year this file is updated with information about applications for disability benefits that is then used to determine the outcome of those applications. The outcome data in these tables are reported by year of filing and include decisions made through the administrative appeals process.
Table 60 shows the total number of applications filed in a year, the number denied for nonmedical reasons before a medical decision is made (technical denials), the number that are pending a final decision, the outcome of applications for which a medical allowance or denial was made, and award and allowance rates. Applications for which a medical allowance or denial decision was made but which were subsequently denied for nonmedical reasons are shown under the medical decision header as subsequent denials. The most common nonmedical reason for denying a claim is insufficient number of recent work credits.
The allowance rate is calculated by dividing the number of medical allowances (including subsequent technical denials) by the total number of medical decisions made for a 1-year cohort. The award rate is a broader program measure that is calculated as the number of allowances minus subsequent denials divided by total applications (minus pending claims) filed for a given year.
Claims that remain pending after 6 years are probably the result of imperfect data rather than excessive delays in the decision-making process. It is highly probable that decisions have been rendered on most of the older claims. For more recent years, the award and allowance rates will change as decisions are made on pending claims.
Tables 61–63 show the allowance rate for Social Security only and the Social Security portion of concurrent applications (which are claims for both Social Security and Supplemental Security Income disability benefits). Each table shows a different level in the administrative decision-making process; that is, initial adjudicative, reconsideration, and hearing or higher level.
Beginning with 2000, the proportion of claims awarded at each level of the process changed as a result of the Prototype Process being tested in 10 states. Under this test, the reconsideration step of the appeals process was eliminated for applications filed October 1, 1999, or later. Elimination of the reconsideration level in these states results in a decrease in the aggregate proportion of claims awarded at this step.
This section also includes one table that shows the reason for medical allowance and one that shows the rea-son for medical denial (Tables 64 and 65). The reasons are derived from the sequential evaluation process used by decision makers. SSA maintains a list of impairments that are considered disabling under its regulations. An applicant can be found to be disabled if he or she—
• has a listed impairment,
• has a severe impairment that is equal to a listed impairment,
• has a severe impairment when medical and vocational factors are considered, or
• had previously established entitlement to a disability benefit.
An applicant can be denied benefits if he or she—
• has an impairment that is not expected to last 12 months,
• has an impairment that is not considered severe,
• is able to perform his or her usual type of work,
• is able to perform another type of work, or
• has an impairment resulting from drug addiction or alcoholism, provides insufficient medical evidence, fails to cooperate, fails to follow prescribed treatment, does not want to continue development of the claim, or returns to substantial work before disability can be established.
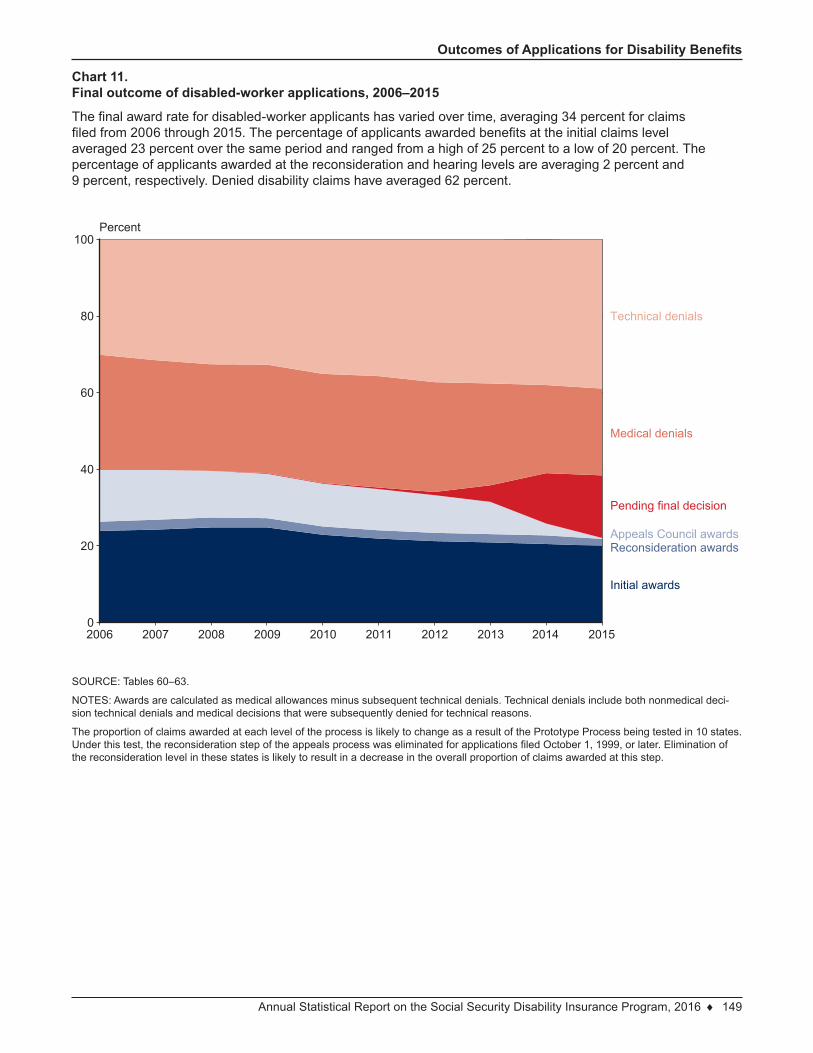
Annual Statistical Report on the Social Security Disability Insurance Program, 2016 ♦ 149
Outcomes of Applications for Disability Benefits
Chart 11.Final outcome of disabled-worker applications, 2006–2015
The final award rate for disabled-worker applicants has varied over time, averaging 34 percent for claims filed from 2006 through 2015. The percentage of applicants awarded benefits at the initial claims level averaged 23 percent over the same period and ranged from a high of 25 percent to a low of 20 percent. The percentage of applicants awarded at the reconsideration and hearing levels are averaging 2 percent and 9 percent, respectively. Denied disability claims have averaged 62 percent.
SOURCE: Tables 60–63.
NOTES: Awards are calculated as medical allowances minus subsequent technical denials. Technical denials include both nonmedical deci-sion technical denials and medical decisions that were subsequently denied for technical reasons.
The proportion of claims awarded at each level of the process is likely to change as a result of the Prototype Process being tested in 10 states. Under this test, the reconsideration step of the appeals process was eliminated for applications filed October 1, 1999, or later. Elimination of the reconsideration level in these states is likely to result in a decrease in the overall proportion of claims awarded at this step.
2006 2007 2008 2009 2010 2011 2012 2013 2014 20150
20
40
60
80
100Percent
Initial awards
Reconsideration awardsAppeals Council awards
Pending final decision
Medical denials
Technical denials
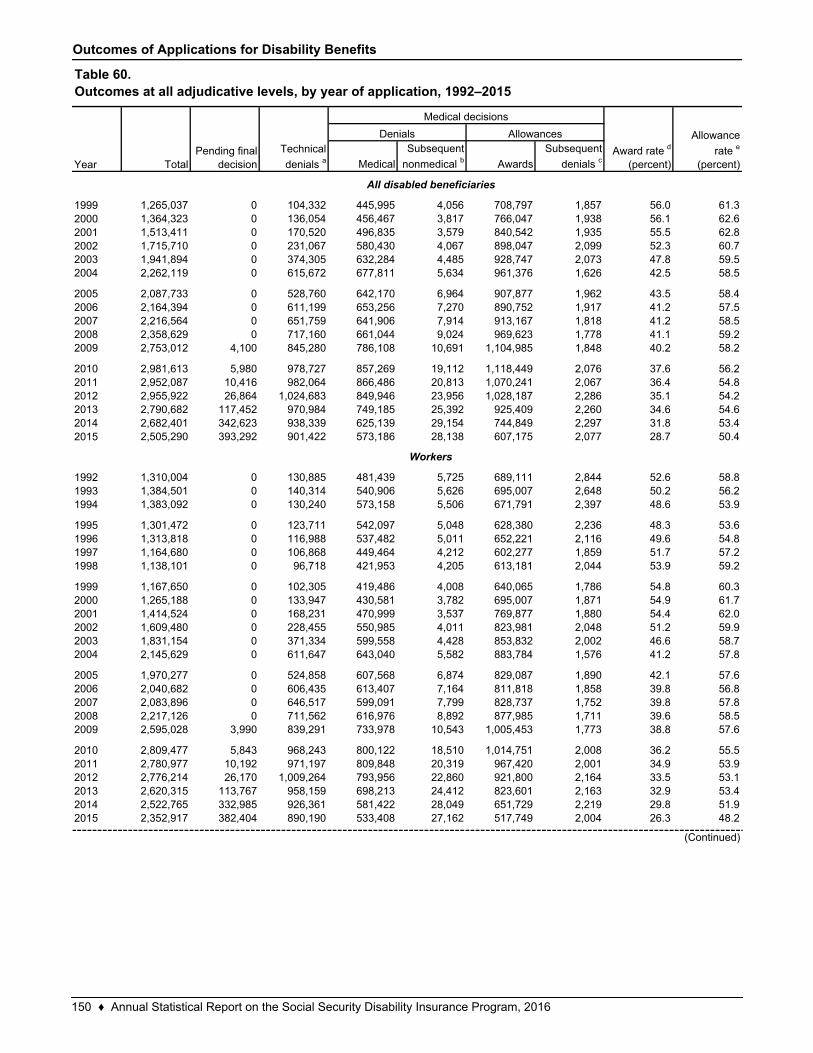
Outcomes of Applications for Disability Benefits
Medical
Subsequent
nonmedical b Awards
Subsequent
denials c
1,265,037 0 104,332 445,995 4,056 708,797 1,857 56.0 61.31,364,323 0 136,054 456,467 3,817 766,047 1,938 56.1 62.61,513,411 0 170,520 496,835 3,579 840,542 1,935 55.5 62.81,715,710 0 231,067 580,430 4,067 898,047 2,099 52.3 60.71,941,894 0 374,305 632,284 4,485 928,747 2,073 47.8 59.52,262,119 0 615,672 677,811 5,634 961,376 1,626 42.5 58.5
2,087,733 0 528,760 642,170 6,964 907,877 1,962 43.5 58.42,164,394 0 611,199 653,256 7,270 890,752 1,917 41.2 57.52,216,564 0 651,759 641,906 7,914 913,167 1,818 41.2 58.52,358,629 0 717,160 661,044 9,024 969,623 1,778 41.1 59.22,753,012 4,100 845,280 786,108 10,691 1,104,985 1,848 40.2 58.2
2,981,613 5,980 978,727 857,269 19,112 1,118,449 2,076 37.6 56.22,952,087 10,416 982,064 866,486 20,813 1,070,241 2,067 36.4 54.82,955,922 26,864 1,024,683 849,946 23,956 1,028,187 2,286 35.1 54.22,790,682 117,452 970,984 749,185 25,392 925,409 2,260 34.6 54.62,682,401 342,623 938,339 625,139 29,154 744,849 2,297 31.8 53.42,505,290 393,292 901,422 573,186 28,138 607,175 2,077 28.7 50.4
1,310,004 0 130,885 481,439 5,725 689,111 2,844 52.6 58.81,384,501 0 140,314 540,906 5,626 695,007 2,648 50.2 56.21,383,092 0 130,240 573,158 5,506 671,791 2,397 48.6 53.9
1,301,472 0 123,711 542,097 5,048 628,380 2,236 48.3 53.61,313,818 0 116,988 537,482 5,011 652,221 2,116 49.6 54.81,164,680 0 106,868 449,464 4,212 602,277 1,859 51.7 57.21,138,101 0 96,718 421,953 4,205 613,181 2,044 53.9 59.2
1,167,650 0 102,305 419,486 4,008 640,065 1,786 54.8 60.31,265,188 0 133,947 430,581 3,782 695,007 1,871 54.9 61.71,414,524 0 168,231 470,999 3,537 769,877 1,880 54.4 62.01,609,480 0 228,455 550,985 4,011 823,981 2,048 51.2 59.91,831,154 0 371,334 599,558 4,428 853,832 2,002 46.6 58.72,145,629 0 611,647 643,040 5,582 883,784 1,576 41.2 57.8
1,970,277 0 524,858 607,568 6,874 829,087 1,890 42.1 57.62,040,682 0 606,435 613,407 7,164 811,818 1,858 39.8 56.82,083,896 0 646,517 599,091 7,799 828,737 1,752 39.8 57.82,217,126 0 711,562 616,976 8,892 877,985 1,711 39.6 58.52,595,028 3,990 839,291 733,978 10,543 1,005,453 1,773 38.8 57.6
2,809,477 5,843 968,243 800,122 18,510 1,014,751 2,008 36.2 55.52,780,977 10,192 971,197 809,848 20,319 967,420 2,001 34.9 53.92,776,214 26,170 1,009,264 793,956 22,860 921,800 2,164 33.5 53.12,620,315 113,767 958,159 698,213 24,412 823,601 2,163 32.9 53.42,522,765 332,985 926,361 581,422 28,049 651,729 2,219 29.8 51.92,352,917 382,404 890,190 533,408 27,162 517,749 2,004 26.3 48.2
20072008
19971998
1999200020012002
2015
2009
20102011201220132014
Year
1999200020012002
Denials Allowances
All disabled beneficiaries
Workers
2015
199219931994
19951996
Table 60.Outcomes at all adjudicative levels, by year of application, 1992–2015
TotalPending final
decision
Technical
denials a
Medical decisions
Award rate d
(percent)
Allowance
rate e
(percent)
(Continued)
20032004
20052006200720082009
20102011201220132014
20032004
20052006
150 ♦ Annual Statistical Report on the Social Security Disability Insurance Program, 2016
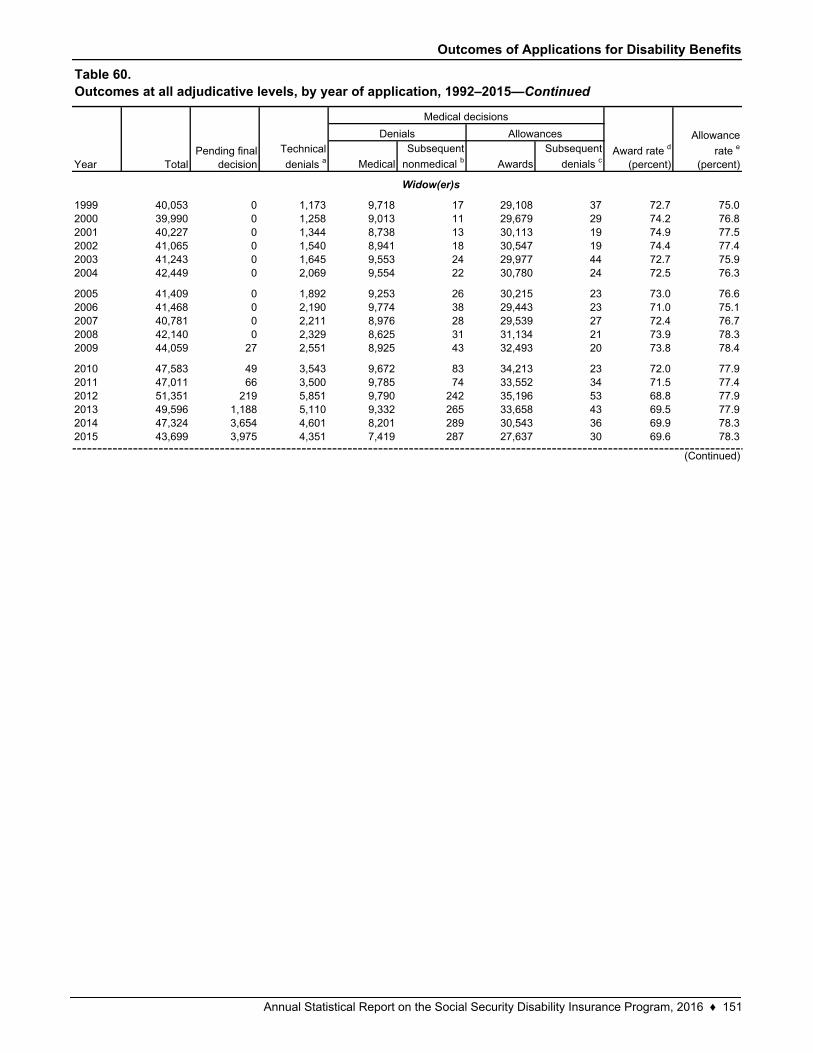
Outcomes of Applications for Disability Benefits
Medical
Subsequent
nonmedical b Awards
Subsequent
denials c
40,053 0 1,173 9,718 17 29,108 37 72.7 75.039,990 0 1,258 9,013 11 29,679 29 74.2 76.840,227 0 1,344 8,738 13 30,113 19 74.9 77.541,065 0 1,540 8,941 18 30,547 19 74.4 77.441,243 0 1,645 9,553 24 29,977 44 72.7 75.942,449 0 2,069 9,554 22 30,780 24 72.5 76.3
41,409 0 1,892 9,253 26 30,215 23 73.0 76.641,468 0 2,190 9,774 38 29,443 23 71.0 75.140,781 0 2,211 8,976 28 29,539 27 72.4 76.742,140 0 2,329 8,625 31 31,134 21 73.9 78.344,059 27 2,551 8,925 43 32,493 20 73.8 78.4
47,583 49 3,543 9,672 83 34,213 23 72.0 77.947,011 66 3,500 9,785 74 33,552 34 71.5 77.451,351 219 5,851 9,790 242 35,196 53 68.8 77.949,596 1,188 5,110 9,332 265 33,658 43 69.5 77.947,324 3,654 4,601 8,201 289 30,543 36 69.9 78.343,699 3,975 4,351 7,419 287 27,637 30 69.6 78.3
200720082009
Widow(er)s
Table 60.Outcomes at all adjudicative levels, by year of application, 1992–2015—Continued
TotalPending final
decision
Technical
denials a
Medical decisions
Award rate d
(percent)
Allowance
rate e
(percent)
Denials Allowances
(Continued)
19992000200120022003
Year
201020112012201320142015
2004
20052006
Annual Statistical Report on the Social Security Disability Insurance Program, 2016 ♦ 151
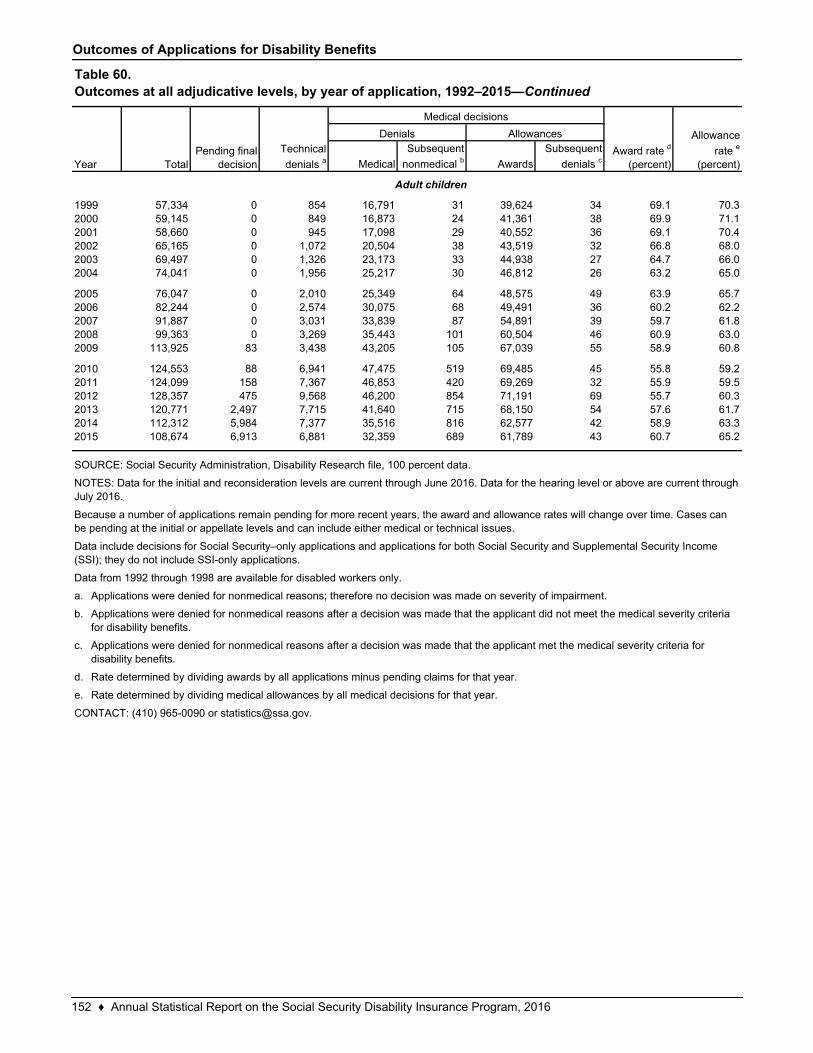
Outcomes of Applications for Disability Benefits
Medical
Subsequent
nonmedical b Awards
Subsequent
denials c
57,334 0 854 16,791 31 39,624 34 69.1 70.359,145 0 849 16,873 24 41,361 38 69.9 71.158,660 0 945 17,098 29 40,552 36 69.1 70.465,165 0 1,072 20,504 38 43,519 32 66.8 68.069,497 0 1,326 23,173 33 44,938 27 64.7 66.074,041 0 1,956 25,217 30 46,812 26 63.2 65.0
76,047 0 2,010 25,349 64 48,575 49 63.9 65.782,244 0 2,574 30,075 68 49,491 36 60.2 62.291,887 0 3,031 33,839 87 54,891 39 59.7 61.899,363 0 3,269 35,443 101 60,504 46 60.9 63.0
113,925 83 3,438 43,205 105 67,039 55 58.9 60.8
124,553 88 6,941 47,475 519 69,485 45 55.8 59.2124,099 158 7,367 46,853 420 69,269 32 55.9 59.5128,357 475 9,568 46,200 854 71,191 69 55.7 60.3120,771 2,497 7,715 41,640 715 68,150 54 57.6 61.7112,312 5,984 7,377 35,516 816 62,577 42 58.9 63.3108,674 6,913 6,881 32,359 689 61,789 43 60.7 65.2
a.
b.
c.
d.
e.
Applications were denied for nonmedical reasons after a decision was made that the applicant did not meet the medical severity criteria for disability benefits.
Applications were denied for nonmedical reasons after a decision was made that the applicant met the medical severity criteria for disability benefits.
Rate determined by dividing awards by all applications minus pending claims for that year.
Rate determined by dividing medical allowances by all medical decisions for that year.
20112012201320142015
Applications were denied for nonmedical reasons; therefore no decision was made on severity of impairment.
20052006200720082009
2010
199920002001200220032004
CONTACT: (410) 965-0090 or [email protected].
SOURCE: Social Security Administration, Disability Research file, 100 percent data.
NOTES: Data for the initial and reconsideration levels are current through June 2016. Data for the hearing level or above are current through July 2016.
Because a number of applications remain pending for more recent years, the award and allowance rates will change over time. Cases can be pending at the initial or appellate levels and can include either medical or technical issues.
Data include decisions for Social Security–only applications and applications for both Social Security and Supplemental Security Income (SSI); they do not include SSI-only applications.
Data from 1992 through 1998 are available for disabled workers only.
Adult children
Table 60.Outcomes at all adjudicative levels, by year of application, 1992–2015—Continued
Year TotalPending final
decision
Technical
denials a
Medical decisions
Award rate d
(percent)
Allowance
rate e
(percent)
Denials Allowances
152 ♦ Annual Statistical Report on the Social Security Disability Insurance Program, 2016
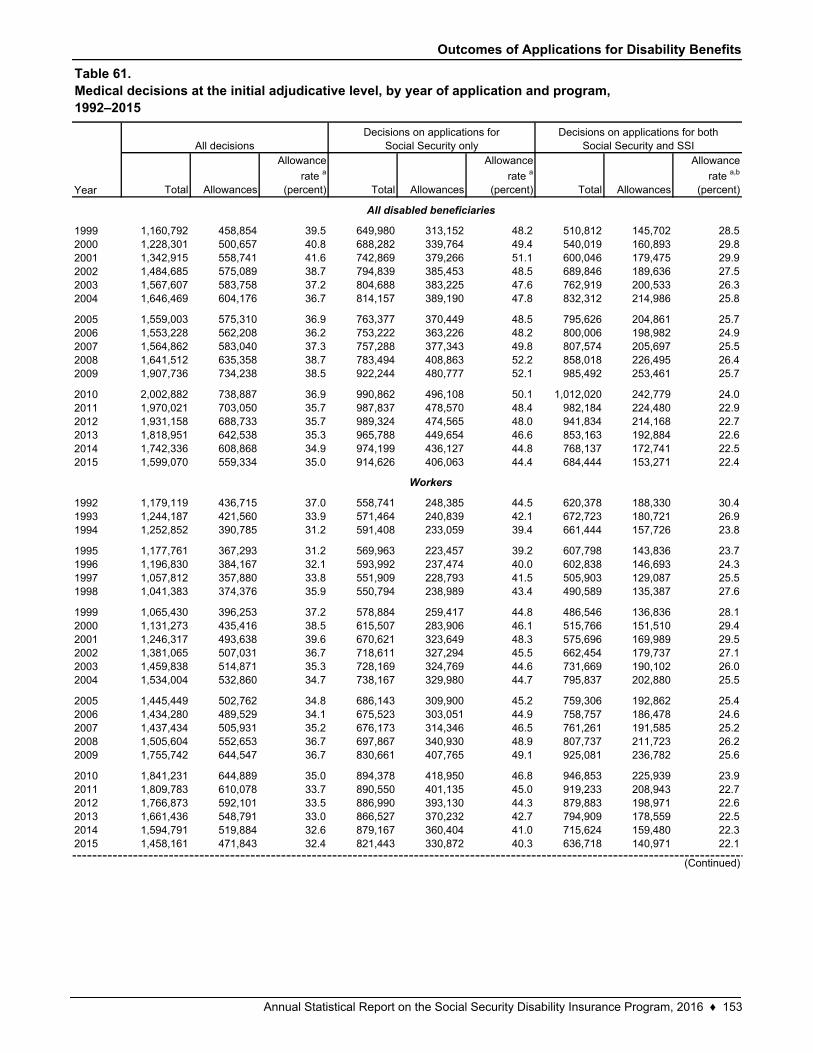
Outcomes of Applications for Disability Benefits
Total Allowances
Allowance
rate a
(percent) Total Allowances
Allowance
rate a
(percent) Total Allowances
Allowance
rate a,b
(percent)
1,160,792 458,854 39.5 649,980 313,152 48.2 510,812 145,702 28.51,228,301 500,657 40.8 688,282 339,764 49.4 540,019 160,893 29.81,342,915 558,741 41.6 742,869 379,266 51.1 600,046 179,475 29.91,484,685 575,089 38.7 794,839 385,453 48.5 689,846 189,636 27.51,567,607 583,758 37.2 804,688 383,225 47.6 762,919 200,533 26.31,646,469 604,176 36.7 814,157 389,190 47.8 832,312 214,986 25.8
1,559,003 575,310 36.9 763,377 370,449 48.5 795,626 204,861 25.71,553,228 562,208 36.2 753,222 363,226 48.2 800,006 198,982 24.91,564,862 583,040 37.3 757,288 377,343 49.8 807,574 205,697 25.51,641,512 635,358 38.7 783,494 408,863 52.2 858,018 226,495 26.41,907,736 734,238 38.5 922,244 480,777 52.1 985,492 253,461 25.7
2,002,882 738,887 36.9 990,862 496,108 50.1 1,012,020 242,779 24.01,970,021 703,050 35.7 987,837 478,570 48.4 982,184 224,480 22.91,931,158 688,733 35.7 989,324 474,565 48.0 941,834 214,168 22.71,818,951 642,538 35.3 965,788 449,654 46.6 853,163 192,884 22.61,742,336 608,868 34.9 974,199 436,127 44.8 768,137 172,741 22.51,599,070 559,334 35.0 914,626 406,063 44.4 684,444 153,271 22.4
1,179,119 436,715 37.0 558,741 248,385 44.5 620,378 188,330 30.41,244,187 421,560 33.9 571,464 240,839 42.1 672,723 180,721 26.91,252,852 390,785 31.2 591,408 233,059 39.4 661,444 157,726 23.8
1,177,761 367,293 31.2 569,963 223,457 39.2 607,798 143,836 23.71,196,830 384,167 32.1 593,992 237,474 40.0 602,838 146,693 24.31,057,812 357,880 33.8 551,909 228,793 41.5 505,903 129,087 25.51,041,383 374,376 35.9 550,794 238,989 43.4 490,589 135,387 27.6
1,065,430 396,253 37.2 578,884 259,417 44.8 486,546 136,836 28.11,131,273 435,416 38.5 615,507 283,906 46.1 515,766 151,510 29.41,246,317 493,638 39.6 670,621 323,649 48.3 575,696 169,989 29.51,381,065 507,031 36.7 718,611 327,294 45.5 662,454 179,737 27.11,459,838 514,871 35.3 728,169 324,769 44.6 731,669 190,102 26.01,534,004 532,860 34.7 738,167 329,980 44.7 795,837 202,880 25.5
1,445,449 502,762 34.8 686,143 309,900 45.2 759,306 192,862 25.41,434,280 489,529 34.1 675,523 303,051 44.9 758,757 186,478 24.61,437,434 505,931 35.2 676,173 314,346 46.5 761,261 191,585 25.21,505,604 552,653 36.7 697,867 340,930 48.9 807,737 211,723 26.21,755,742 644,547 36.7 830,661 407,765 49.1 925,081 236,782 25.6
1,841,231 644,889 35.0 894,378 418,950 46.8 946,853 225,939 23.91,809,783 610,078 33.7 890,550 401,135 45.0 919,233 208,943 22.71,766,873 592,101 33.5 886,990 393,130 44.3 879,883 198,971 22.61,661,436 548,791 33.0 866,527 370,232 42.7 794,909 178,559 22.51,594,791 519,884 32.6 879,167 360,404 41.0 715,624 159,480 22.31,458,161 471,843 32.4 821,443 330,872 40.3 636,718 140,971 22.1
201320142015
20082009
201020112012
2012201320142015
2004
19931994
1995199619971998
19992000200120022003
Year
199920002001200220032004
20052006
All disabled beneficiaries
2011
Workers
(Continued)
1992
200520062007
200720082009
2010
Table 61.Medical decisions at the initial adjudicative level, by year of application and program,1992–2015
All decisionsDecisions on applications for
Social Security onlyDecisions on applications for both
Social Security and SSI
Annual Statistical Report on the Social Security Disability Insurance Program, 2016 ♦ 153
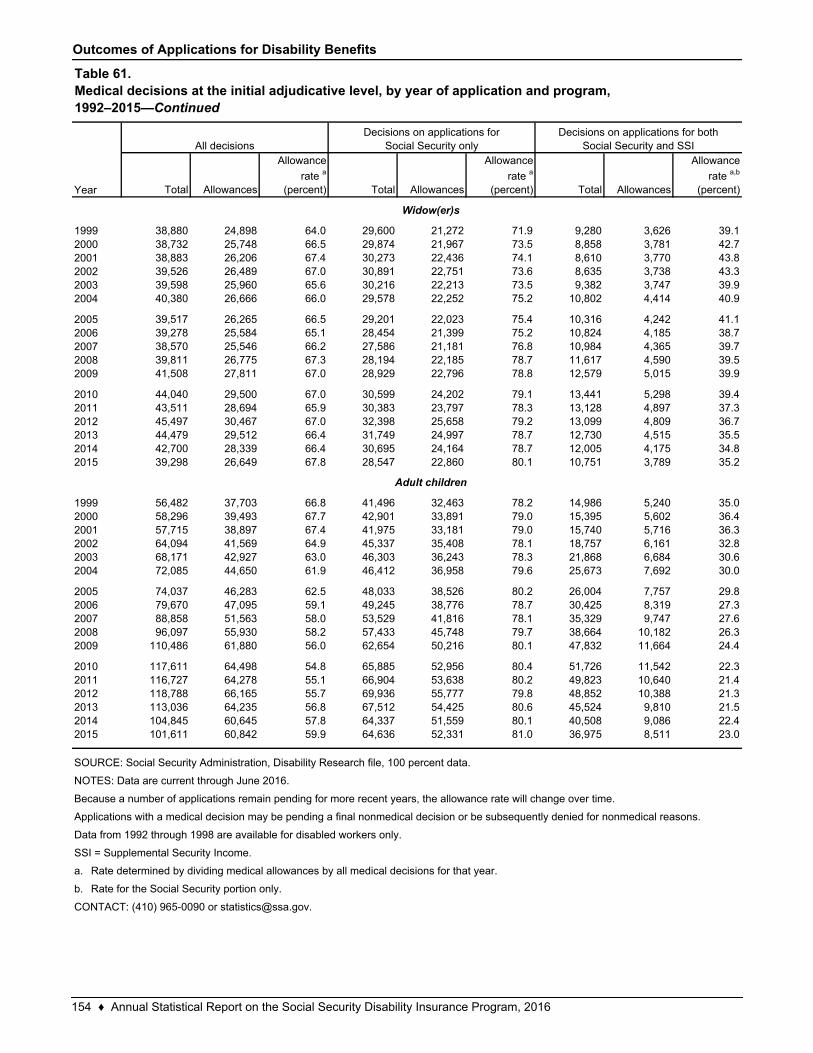
Outcomes of Applications for Disability Benefits
Total Allowances
Allowance
rate a
(percent) Total Allowances
Allowance
rate a
(percent) Total Allowances
Allowance
rate a,b
(percent)
38,880 24,898 64.0 29,600 21,272 71.9 9,280 3,626 39.138,732 25,748 66.5 29,874 21,967 73.5 8,858 3,781 42.738,883 26,206 67.4 30,273 22,436 74.1 8,610 3,770 43.839,526 26,489 67.0 30,891 22,751 73.6 8,635 3,738 43.339,598 25,960 65.6 30,216 22,213 73.5 9,382 3,747 39.940,380 26,666 66.0 29,578 22,252 75.2 10,802 4,414 40.9
39,517 26,265 66.5 29,201 22,023 75.4 10,316 4,242 41.139,278 25,584 65.1 28,454 21,399 75.2 10,824 4,185 38.738,570 25,546 66.2 27,586 21,181 76.8 10,984 4,365 39.739,811 26,775 67.3 28,194 22,185 78.7 11,617 4,590 39.541,508 27,811 67.0 28,929 22,796 78.8 12,579 5,015 39.9
44,040 29,500 67.0 30,599 24,202 79.1 13,441 5,298 39.443,511 28,694 65.9 30,383 23,797 78.3 13,128 4,897 37.345,497 30,467 67.0 32,398 25,658 79.2 13,099 4,809 36.744,479 29,512 66.4 31,749 24,997 78.7 12,730 4,515 35.542,700 28,339 66.4 30,695 24,164 78.7 12,005 4,175 34.839,298 26,649 67.8 28,547 22,860 80.1 10,751 3,789 35.2
56,482 37,703 66.8 41,496 32,463 78.2 14,986 5,240 35.058,296 39,493 67.7 42,901 33,891 79.0 15,395 5,602 36.457,715 38,897 67.4 41,975 33,181 79.0 15,740 5,716 36.364,094 41,569 64.9 45,337 35,408 78.1 18,757 6,161 32.868,171 42,927 63.0 46,303 36,243 78.3 21,868 6,684 30.672,085 44,650 61.9 46,412 36,958 79.6 25,673 7,692 30.0
74,037 46,283 62.5 48,033 38,526 80.2 26,004 7,757 29.879,670 47,095 59.1 49,245 38,776 78.7 30,425 8,319 27.388,858 51,563 58.0 53,529 41,816 78.1 35,329 9,747 27.696,097 55,930 58.2 57,433 45,748 79.7 38,664 10,182 26.3
110,486 61,880 56.0 62,654 50,216 80.1 47,832 11,664 24.4
117,611 64,498 54.8 65,885 52,956 80.4 51,726 11,542 22.3116,727 64,278 55.1 66,904 53,638 80.2 49,823 10,640 21.4118,788 66,165 55.7 69,936 55,777 79.8 48,852 10,388 21.3113,036 64,235 56.8 67,512 54,425 80.6 45,524 9,810 21.5104,845 60,645 57.8 64,337 51,559 80.1 40,508 9,086 22.4101,611 60,842 59.9 64,636 52,331 81.0 36,975 8,511 23.0
a.
b. Rate for the Social Security portion only.
2012201320142015
Rate determined by dividing medical allowances by all medical decisions for that year.
200720082009
20102011
2006
2012201320142015
199920002001200220032004
2005
2011
20002001200220032004
20052006200720082009
2010
CONTACT: (410) 965-0090 or [email protected].
Because a number of applications remain pending for more recent years, the allowance rate will change over time.
Applications with a medical decision may be pending a final nonmedical decision or be subsequently denied for nonmedical reasons.
Data from 1992 through 1998 are available for disabled workers only.
SSI = Supplemental Security Income.
Widow(er)s
Adult children
SOURCE: Social Security Administration, Disability Research file, 100 percent data.
NOTES: Data are current through June 2016.
Table 61.Medical decisions at the initial adjudicative level, by year of application and program,1992–2015—Continued
Year
All decisionsDecisions on applications for
Social Security onlyDecisions on applications for both
Social Security and SSI
1999
154 ♦ Annual Statistical Report on the Social Security Disability Insurance Program, 2016
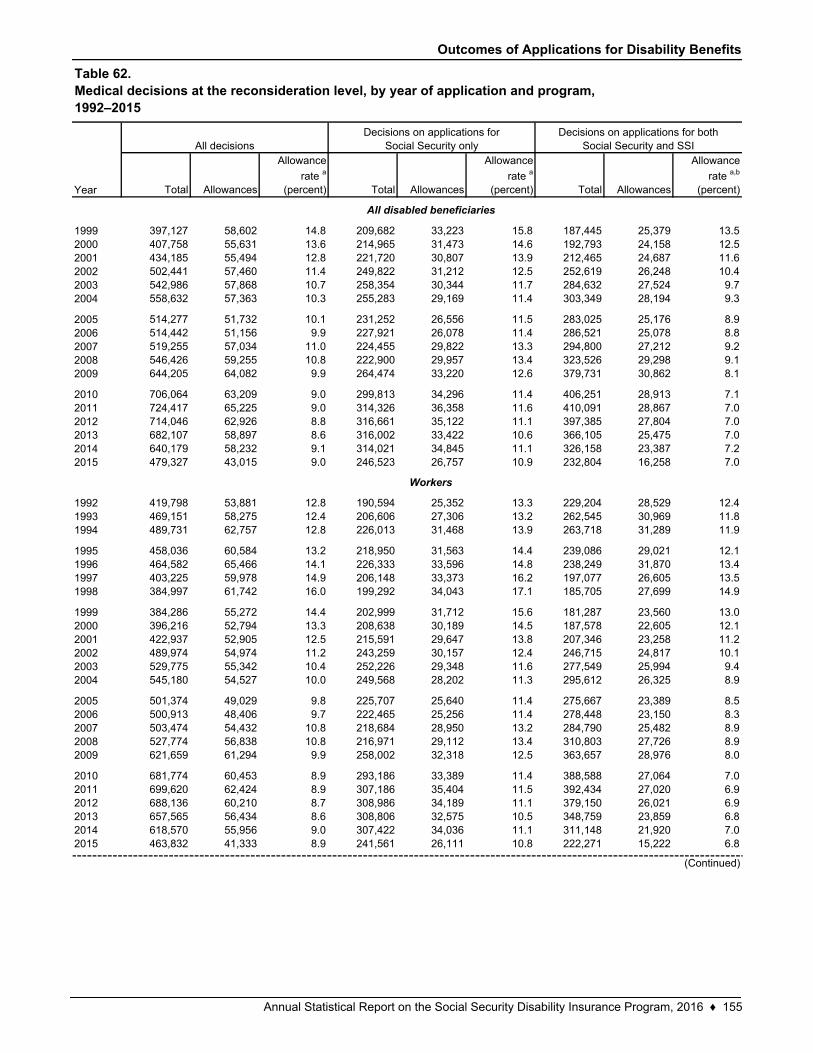
Outcomes of Applications for Disability Benefits
Total Allowances
Allowance
rate a
(percent) Total Allowances
Allowance
rate a
(percent) Total Allowances
Allowance
rate a,b
(percent)
397,127 58,602 14.8 209,682 33,223 15.8 187,445 25,379 13.5407,758 55,631 13.6 214,965 31,473 14.6 192,793 24,158 12.5434,185 55,494 12.8 221,720 30,807 13.9 212,465 24,687 11.6502,441 57,460 11.4 249,822 31,212 12.5 252,619 26,248 10.4542,986 57,868 10.7 258,354 30,344 11.7 284,632 27,524 9.7558,632 57,363 10.3 255,283 29,169 11.4 303,349 28,194 9.3
514,277 51,732 10.1 231,252 26,556 11.5 283,025 25,176 8.9514,442 51,156 9.9 227,921 26,078 11.4 286,521 25,078 8.8519,255 57,034 11.0 224,455 29,822 13.3 294,800 27,212 9.2546,426 59,255 10.8 222,900 29,957 13.4 323,526 29,298 9.1644,205 64,082 9.9 264,474 33,220 12.6 379,731 30,862 8.1
706,064 63,209 9.0 299,813 34,296 11.4 406,251 28,913 7.1724,417 65,225 9.0 314,326 36,358 11.6 410,091 28,867 7.0714,046 62,926 8.8 316,661 35,122 11.1 397,385 27,804 7.0682,107 58,897 8.6 316,002 33,422 10.6 366,105 25,475 7.0640,179 58,232 9.1 314,021 34,845 11.1 326,158 23,387 7.2479,327 43,015 9.0 246,523 26,757 10.9 232,804 16,258 7.0
419,798 53,881 12.8 190,594 25,352 13.3 229,204 28,529 12.4469,151 58,275 12.4 206,606 27,306 13.2 262,545 30,969 11.8489,731 62,757 12.8 226,013 31,468 13.9 263,718 31,289 11.9
458,036 60,584 13.2 218,950 31,563 14.4 239,086 29,021 12.1464,582 65,466 14.1 226,333 33,596 14.8 238,249 31,870 13.4403,225 59,978 14.9 206,148 33,373 16.2 197,077 26,605 13.5384,997 61,742 16.0 199,292 34,043 17.1 185,705 27,699 14.9
384,286 55,272 14.4 202,999 31,712 15.6 181,287 23,560 13.0396,216 52,794 13.3 208,638 30,189 14.5 187,578 22,605 12.1422,937 52,905 12.5 215,591 29,647 13.8 207,346 23,258 11.2489,974 54,974 11.2 243,259 30,157 12.4 246,715 24,817 10.1529,775 55,342 10.4 252,226 29,348 11.6 277,549 25,994 9.4545,180 54,527 10.0 249,568 28,202 11.3 295,612 26,325 8.9
501,374 49,029 9.8 225,707 25,640 11.4 275,667 23,389 8.5500,913 48,406 9.7 222,465 25,256 11.4 278,448 23,150 8.3503,474 54,432 10.8 218,684 28,950 13.2 284,790 25,482 8.9527,774 56,838 10.8 216,971 29,112 13.4 310,803 27,726 8.9621,659 61,294 9.9 258,002 32,318 12.5 363,657 28,976 8.0
681,774 60,453 8.9 293,186 33,389 11.4 388,588 27,064 7.0699,620 62,424 8.9 307,186 35,404 11.5 392,434 27,020 6.9688,136 60,210 8.7 308,986 34,189 11.1 379,150 26,021 6.9657,565 56,434 8.6 308,806 32,575 10.5 348,759 23,859 6.8618,570 55,956 9.0 307,422 34,036 11.1 311,148 21,920 7.0463,832 41,333 8.9 241,561 26,111 10.8 222,271 15,222 6.8
201020112012201320142015
1999200020012002
1997
201020112012201320142015
199219931994
19951996
20032004
2005
2009
1998
199920002001200220032004
20052006
Workers
2006200720082009
(Continued)
20072008
Table 62.Medical decisions at the reconsideration level, by year of application and program,1992–2015
All decisionsDecisions on applications for
Social Security onlyDecisions on applications for both
Social Security and SSI
All disabled beneficiaries
Year
Annual Statistical Report on the Social Security Disability Insurance Program, 2016 ♦ 155
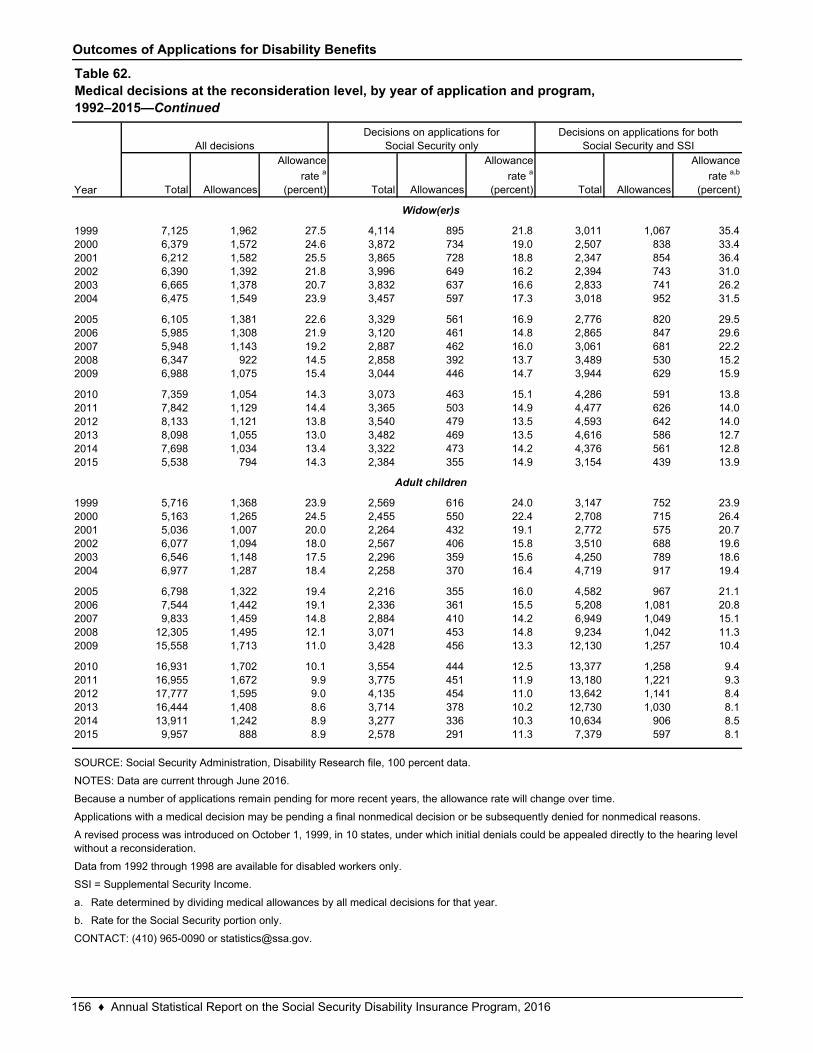
Outcomes of Applications for Disability Benefits
Total Allowances
Allowance
rate a
(percent) Total Allowances
Allowance
rate a
(percent) Total Allowances
Allowance
rate a,b
(percent)
7,125 1,962 27.5 4,114 895 21.8 3,011 1,067 35.46,379 1,572 24.6 3,872 734 19.0 2,507 838 33.46,212 1,582 25.5 3,865 728 18.8 2,347 854 36.46,390 1,392 21.8 3,996 649 16.2 2,394 743 31.06,665 1,378 20.7 3,832 637 16.6 2,833 741 26.26,475 1,549 23.9 3,457 597 17.3 3,018 952 31.5
6,105 1,381 22.6 3,329 561 16.9 2,776 820 29.55,985 1,308 21.9 3,120 461 14.8 2,865 847 29.65,948 1,143 19.2 2,887 462 16.0 3,061 681 22.26,347 922 14.5 2,858 392 13.7 3,489 530 15.26,988 1,075 15.4 3,044 446 14.7 3,944 629 15.9
7,359 1,054 14.3 3,073 463 15.1 4,286 591 13.87,842 1,129 14.4 3,365 503 14.9 4,477 626 14.08,133 1,121 13.8 3,540 479 13.5 4,593 642 14.08,098 1,055 13.0 3,482 469 13.5 4,616 586 12.77,698 1,034 13.4 3,322 473 14.2 4,376 561 12.85,538 794 14.3 2,384 355 14.9 3,154 439 13.9
5,716 1,368 23.9 2,569 616 24.0 3,147 752 23.95,163 1,265 24.5 2,455 550 22.4 2,708 715 26.45,036 1,007 20.0 2,264 432 19.1 2,772 575 20.76,077 1,094 18.0 2,567 406 15.8 3,510 688 19.66,546 1,148 17.5 2,296 359 15.6 4,250 789 18.66,977 1,287 18.4 2,258 370 16.4 4,719 917 19.4
6,798 1,322 19.4 2,216 355 16.0 4,582 967 21.17,544 1,442 19.1 2,336 361 15.5 5,208 1,081 20.89,833 1,459 14.8 2,884 410 14.2 6,949 1,049 15.1
12,305 1,495 12.1 3,071 453 14.8 9,234 1,042 11.315,558 1,713 11.0 3,428 456 13.3 12,130 1,257 10.4
16,931 1,702 10.1 3,554 444 12.5 13,377 1,258 9.416,955 1,672 9.9 3,775 451 11.9 13,180 1,221 9.317,777 1,595 9.0 4,135 454 11.0 13,642 1,141 8.416,444 1,408 8.6 3,714 378 10.2 12,730 1,030 8.113,911 1,242 8.9 3,277 336 10.3 10,634 906 8.59,957 888 8.9 2,578 291 11.3 7,379 597 8.1
a.
b. Rate for the Social Security portion only.
CONTACT: (410) 965-0090 or [email protected].
A revised process was introduced on October 1, 1999, in 10 states, under which initial denials could be appealed directly to the hearing level without a reconsideration.
Data from 1992 through 1998 are available for disabled workers only.
SSI = Supplemental Security Income.
2012201320142015
Rate determined by dividing medical allowances by all medical decisions for that year.
2011
20002001200220032004
20052006200720082009
2010
1999
20052006200720082009
201020112012201320142015
2004
19992000200120022003
Because a number of applications remain pending for more recent years, the allowance rate will change over time.
Applications with a medical decision may be pending a final nonmedical decision or be subsequently denied for nonmedical reasons.
NOTES: Data are current through June 2016.
Widow(er)s
Adult children
SOURCE: Social Security Administration, Disability Research file, 100 percent data.
Table 62.Medical decisions at the reconsideration level, by year of application and program,1992–2015—Continued
Year
All decisionsDecisions on applications for
Social Security onlyDecisions on applications for both
Social Security and SSI
156 ♦ Annual Statistical Report on the Social Security Disability Insurance Program, 2016
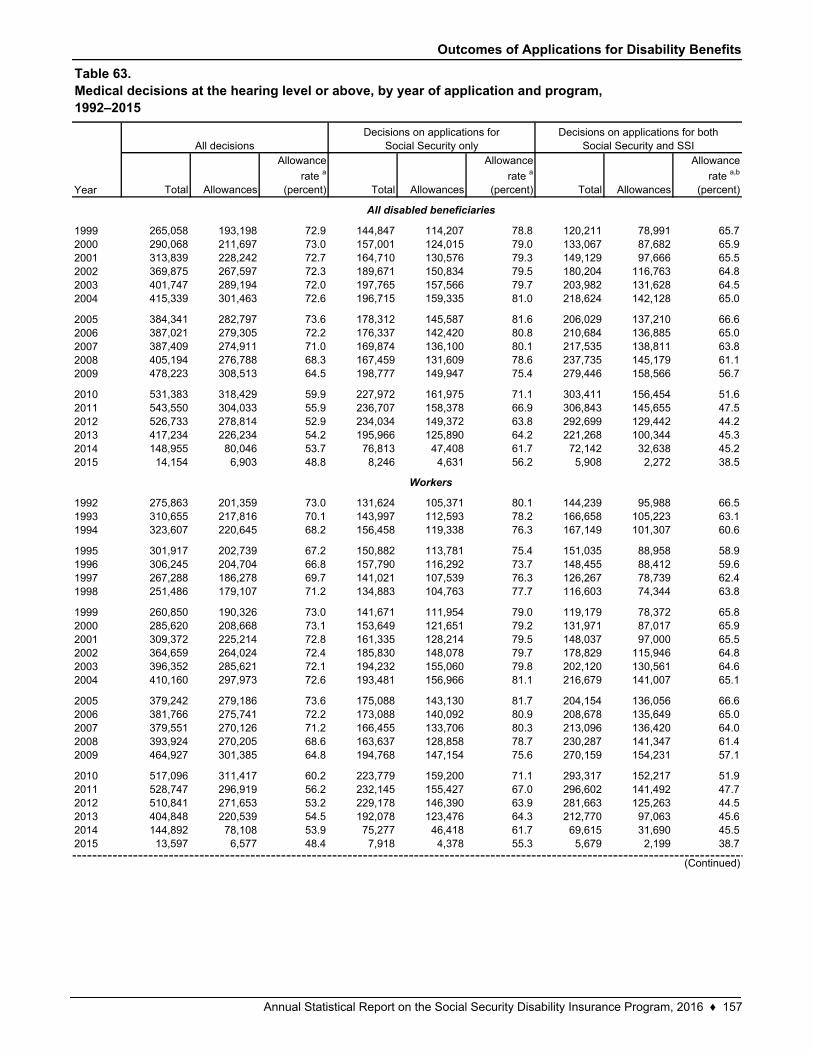
Outcomes of Applications for Disability Benefits
Total Allowances
Allowance
rate a
(percent) Total Allowances
Allowance
rate a
(percent) Total Allowances
Allowance
rate a,b
(percent)
265,058 193,198 72.9 144,847 114,207 78.8 120,211 78,991 65.7290,068 211,697 73.0 157,001 124,015 79.0 133,067 87,682 65.9313,839 228,242 72.7 164,710 130,576 79.3 149,129 97,666 65.5369,875 267,597 72.3 189,671 150,834 79.5 180,204 116,763 64.8401,747 289,194 72.0 197,765 157,566 79.7 203,982 131,628 64.5415,339 301,463 72.6 196,715 159,335 81.0 218,624 142,128 65.0
384,341 282,797 73.6 178,312 145,587 81.6 206,029 137,210 66.6387,021 279,305 72.2 176,337 142,420 80.8 210,684 136,885 65.0387,409 274,911 71.0 169,874 136,100 80.1 217,535 138,811 63.8405,194 276,788 68.3 167,459 131,609 78.6 237,735 145,179 61.1478,223 308,513 64.5 198,777 149,947 75.4 279,446 158,566 56.7
531,383 318,429 59.9 227,972 161,975 71.1 303,411 156,454 51.6543,550 304,033 55.9 236,707 158,378 66.9 306,843 145,655 47.5526,733 278,814 52.9 234,034 149,372 63.8 292,699 129,442 44.2417,234 226,234 54.2 195,966 125,890 64.2 221,268 100,344 45.3148,955 80,046 53.7 76,813 47,408 61.7 72,142 32,638 45.214,154 6,903 48.8 8,246 4,631 56.2 5,908 2,272 38.5
275,863 201,359 73.0 131,624 105,371 80.1 144,239 95,988 66.5310,655 217,816 70.1 143,997 112,593 78.2 166,658 105,223 63.1323,607 220,645 68.2 156,458 119,338 76.3 167,149 101,307 60.6
301,917 202,739 67.2 150,882 113,781 75.4 151,035 88,958 58.9306,245 204,704 66.8 157,790 116,292 73.7 148,455 88,412 59.6267,288 186,278 69.7 141,021 107,539 76.3 126,267 78,739 62.4251,486 179,107 71.2 134,883 104,763 77.7 116,603 74,344 63.8
260,850 190,326 73.0 141,671 111,954 79.0 119,179 78,372 65.8285,620 208,668 73.1 153,649 121,651 79.2 131,971 87,017 65.9309,372 225,214 72.8 161,335 128,214 79.5 148,037 97,000 65.5364,659 264,024 72.4 185,830 148,078 79.7 178,829 115,946 64.8396,352 285,621 72.1 194,232 155,060 79.8 202,120 130,561 64.6410,160 297,973 72.6 193,481 156,966 81.1 216,679 141,007 65.1
379,242 279,186 73.6 175,088 143,130 81.7 204,154 136,056 66.6381,766 275,741 72.2 173,088 140,092 80.9 208,678 135,649 65.0379,551 270,126 71.2 166,455 133,706 80.3 213,096 136,420 64.0393,924 270,205 68.6 163,637 128,858 78.7 230,287 141,347 61.4464,927 301,385 64.8 194,768 147,154 75.6 270,159 154,231 57.1
517,096 311,417 60.2 223,779 159,200 71.1 293,317 152,217 51.9528,747 296,919 56.2 232,145 155,427 67.0 296,602 141,492 47.7510,841 271,653 53.2 229,178 146,390 63.9 281,663 125,263 44.5404,848 220,539 54.5 192,078 123,476 64.3 212,770 97,063 45.6144,892 78,108 53.9 75,277 46,418 61.7 69,615 31,690 45.513,597 6,577 48.4 7,918 4,378 55.3 5,679 2,199 38.7
201020112012201320142015
1999200020012002
1997
201020112012201320142015
199219931994
19951996
20032004
2005
2009
1998
199920002001200220032004
20052006
Workers
2006200720082009
(Continued)
20072008
Table 63.Medical decisions at the hearing level or above, by year of application and program,1992–2015
All decisionsDecisions on applications for
Social Security onlyDecisions on applications for both
Social Security and SSI
All disabled beneficiaries
Year
Annual Statistical Report on the Social Security Disability Insurance Program, 2016 ♦ 157
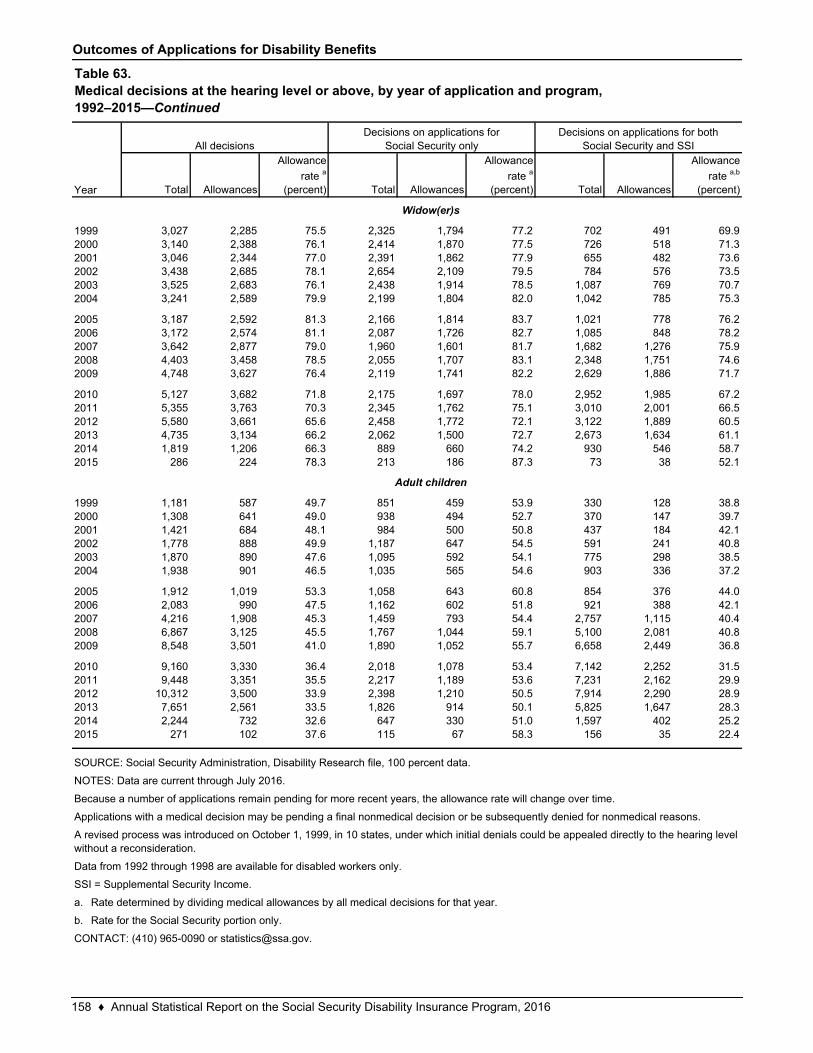
Outcomes of Applications for Disability Benefits
Total Allowances
Allowance
rate a
(percent) Total Allowances
Allowance
rate a
(percent) Total Allowances
Allowance
rate a,b
(percent)
3,027 2,285 75.5 2,325 1,794 77.2 702 491 69.93,140 2,388 76.1 2,414 1,870 77.5 726 518 71.33,046 2,344 77.0 2,391 1,862 77.9 655 482 73.63,438 2,685 78.1 2,654 2,109 79.5 784 576 73.53,525 2,683 76.1 2,438 1,914 78.5 1,087 769 70.73,241 2,589 79.9 2,199 1,804 82.0 1,042 785 75.3
3,187 2,592 81.3 2,166 1,814 83.7 1,021 778 76.23,172 2,574 81.1 2,087 1,726 82.7 1,085 848 78.23,642 2,877 79.0 1,960 1,601 81.7 1,682 1,276 75.94,403 3,458 78.5 2,055 1,707 83.1 2,348 1,751 74.64,748 3,627 76.4 2,119 1,741 82.2 2,629 1,886 71.7
5,127 3,682 71.8 2,175 1,697 78.0 2,952 1,985 67.25,355 3,763 70.3 2,345 1,762 75.1 3,010 2,001 66.55,580 3,661 65.6 2,458 1,772 72.1 3,122 1,889 60.54,735 3,134 66.2 2,062 1,500 72.7 2,673 1,634 61.11,819 1,206 66.3 889 660 74.2 930 546 58.7
286 224 78.3 213 186 87.3 73 38 52.1
1,181 587 49.7 851 459 53.9 330 128 38.81,308 641 49.0 938 494 52.7 370 147 39.71,421 684 48.1 984 500 50.8 437 184 42.11,778 888 49.9 1,187 647 54.5 591 241 40.81,870 890 47.6 1,095 592 54.1 775 298 38.51,938 901 46.5 1,035 565 54.6 903 336 37.2
1,912 1,019 53.3 1,058 643 60.8 854 376 44.02,083 990 47.5 1,162 602 51.8 921 388 42.14,216 1,908 45.3 1,459 793 54.4 2,757 1,115 40.46,867 3,125 45.5 1,767 1,044 59.1 5,100 2,081 40.88,548 3,501 41.0 1,890 1,052 55.7 6,658 2,449 36.8
9,160 3,330 36.4 2,018 1,078 53.4 7,142 2,252 31.59,448 3,351 35.5 2,217 1,189 53.6 7,231 2,162 29.9
10,312 3,500 33.9 2,398 1,210 50.5 7,914 2,290 28.97,651 2,561 33.5 1,826 914 50.1 5,825 1,647 28.32,244 732 32.6 647 330 51.0 1,597 402 25.2
271 102 37.6 115 67 58.3 156 35 22.4
a.
b. Rate for the Social Security portion only.
CONTACT: (410) 965-0090 or [email protected].
A revised process was introduced on October 1, 1999, in 10 states, under which initial denials could be appealed directly to the hearing level without a reconsideration.
Data from 1992 through 1998 are available for disabled workers only.
SSI = Supplemental Security Income.
2012201320142015
Rate determined by dividing medical allowances by all medical decisions for that year.
2011
20002001200220032004
20052006200720082009
2010
1999
20052006200720082009
201020112012201320142015
2004
19992000200120022003
Because a number of applications remain pending for more recent years, the allowance rate will change over time.
Applications with a medical decision may be pending a final nonmedical decision or be subsequently denied for nonmedical reasons.
NOTES: Data are current through July 2016.
Widow(er)s
Adult children
SOURCE: Social Security Administration, Disability Research file, 100 percent data.
Table 63.Medical decisions at the hearing level or above, by year of application and program,1992–2015—Continued
Year
All decisionsDecisions on applications for
Social Security onlyDecisions on applications for both
Social Security and SSI
158 ♦ Annual Statistical Report on the Social Security Disability Insurance Program, 2016
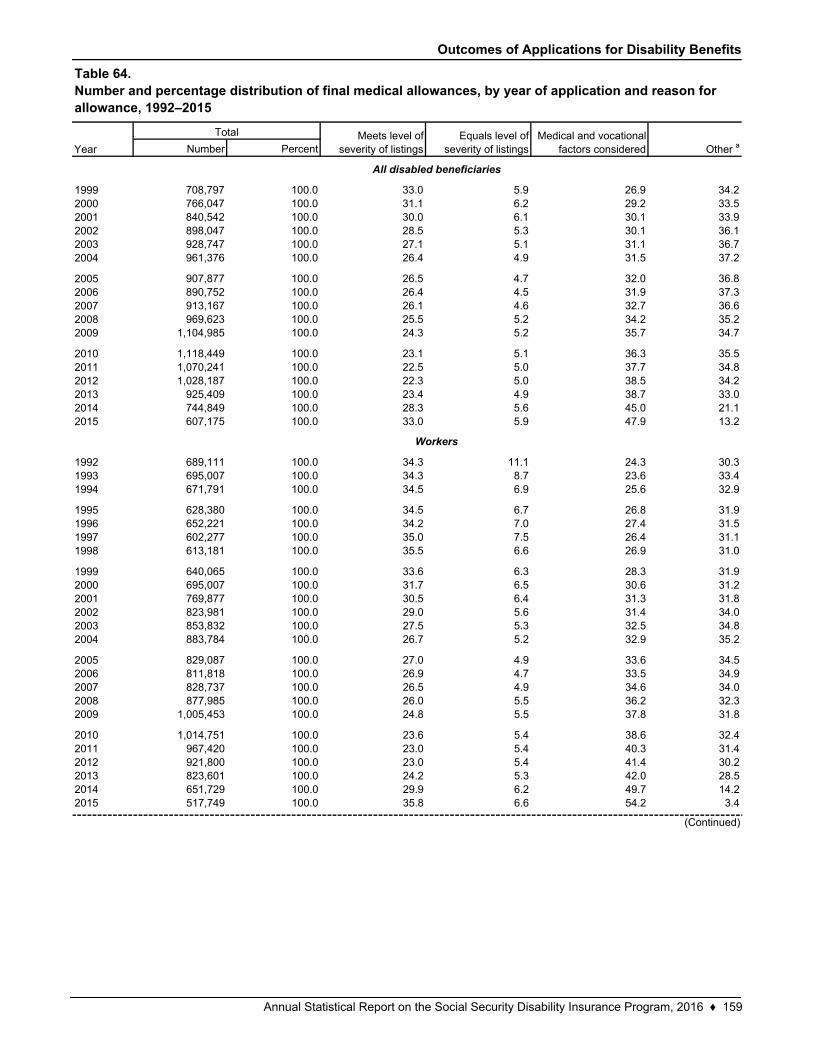
Outcomes of Applications for Disability Benefits
Number Percent
708,797 100.0 33.0 5.9 26.9 34.2766,047 100.0 31.1 6.2 29.2 33.5840,542 100.0 30.0 6.1 30.1 33.9898,047 100.0 28.5 5.3 30.1 36.1928,747 100.0 27.1 5.1 31.1 36.7961,376 100.0 26.4 4.9 31.5 37.2
907,877 100.0 26.5 4.7 32.0 36.8890,752 100.0 26.4 4.5 31.9 37.3913,167 100.0 26.1 4.6 32.7 36.6969,623 100.0 25.5 5.2 34.2 35.2
1,104,985 100.0 24.3 5.2 35.7 34.7
1,118,449 100.0 23.1 5.1 36.3 35.51,070,241 100.0 22.5 5.0 37.7 34.81,028,187 100.0 22.3 5.0 38.5 34.2
925,409 100.0 23.4 4.9 38.7 33.0744,849 100.0 28.3 5.6 45.0 21.1607,175 100.0 33.0 5.9 47.9 13.2
689,111 100.0 34.3 11.1 24.3 30.3695,007 100.0 34.3 8.7 23.6 33.4671,791 100.0 34.5 6.9 25.6 32.9
628,380 100.0 34.5 6.7 26.8 31.9652,221 100.0 34.2 7.0 27.4 31.5602,277 100.0 35.0 7.5 26.4 31.1613,181 100.0 35.5 6.6 26.9 31.0
640,065 100.0 33.6 6.3 28.3 31.9695,007 100.0 31.7 6.5 30.6 31.2769,877 100.0 30.5 6.4 31.3 31.8823,981 100.0 29.0 5.6 31.4 34.0853,832 100.0 27.5 5.3 32.5 34.8883,784 100.0 26.7 5.2 32.9 35.2
829,087 100.0 27.0 4.9 33.6 34.5811,818 100.0 26.9 4.7 33.5 34.9828,737 100.0 26.5 4.9 34.6 34.0877,985 100.0 26.0 5.5 36.2 32.3
1,005,453 100.0 24.8 5.5 37.8 31.8
1,014,751 100.0 23.6 5.4 38.6 32.4967,420 100.0 23.0 5.4 40.3 31.4921,800 100.0 23.0 5.4 41.4 30.2823,601 100.0 24.2 5.3 42.0 28.5651,729 100.0 29.9 6.2 49.7 14.2517,749 100.0 35.8 6.6 54.2 3.4
20062007
2009
201020112012201320142015
20032004
200520062007
1996
2009
201020112012201320142015
199219931994
1995
2008
1999200020012002
(Continued)
2008
19971998
199920002001200220032004
2005
Table 64.Number and percentage distribution of final medical allowances, by year of application and reason for allowance, 1992–2015
Total Meets level of severity of listings
Equals level of severity of listings
Medical and vocational factors considered Other aYear
All disabled beneficiaries
Workers
Annual Statistical Report on the Social Security Disability Insurance Program, 2016 ♦ 159
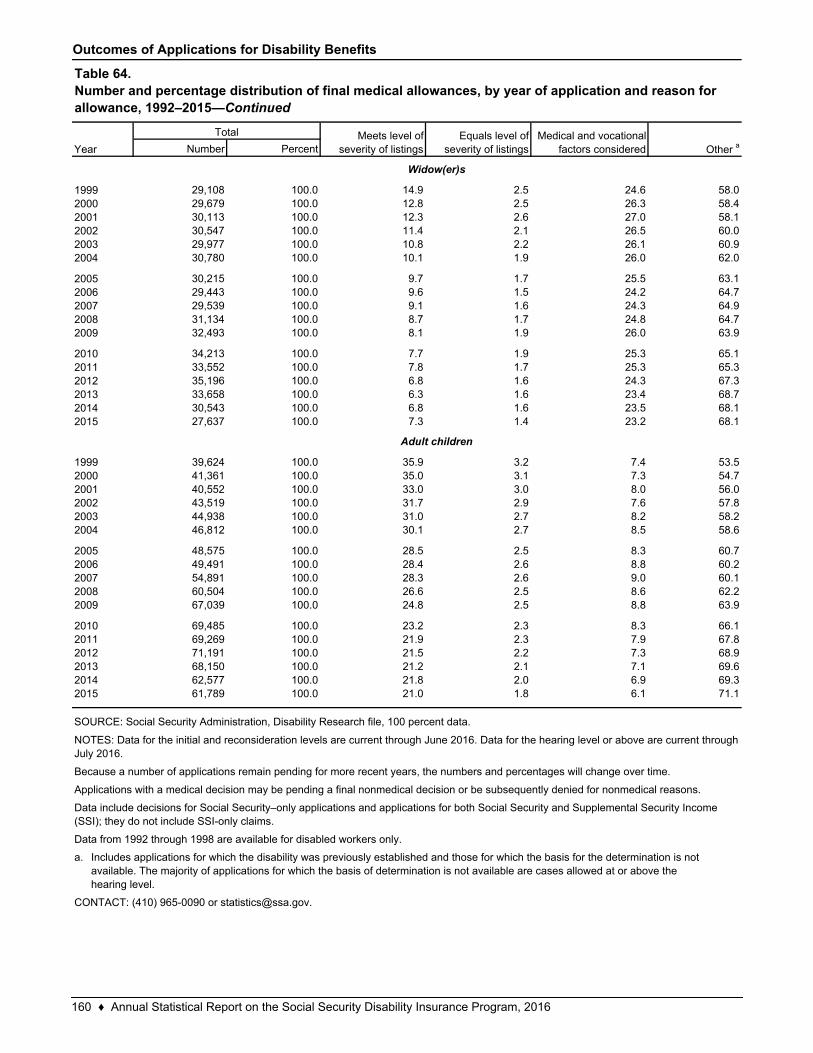
Outcomes of Applications for Disability Benefits
Number Percent
29,108 100.0 14.9 2.5 24.6 58.029,679 100.0 12.8 2.5 26.3 58.430,113 100.0 12.3 2.6 27.0 58.130,547 100.0 11.4 2.1 26.5 60.029,977 100.0 10.8 2.2 26.1 60.930,780 100.0 10.1 1.9 26.0 62.0
30,215 100.0 9.7 1.7 25.5 63.129,443 100.0 9.6 1.5 24.2 64.729,539 100.0 9.1 1.6 24.3 64.931,134 100.0 8.7 1.7 24.8 64.732,493 100.0 8.1 1.9 26.0 63.9
34,213 100.0 7.7 1.9 25.3 65.133,552 100.0 7.8 1.7 25.3 65.335,196 100.0 6.8 1.6 24.3 67.333,658 100.0 6.3 1.6 23.4 68.730,543 100.0 6.8 1.6 23.5 68.127,637 100.0 7.3 1.4 23.2 68.1
39,624 100.0 35.9 3.2 7.4 53.541,361 100.0 35.0 3.1 7.3 54.740,552 100.0 33.0 3.0 8.0 56.043,519 100.0 31.7 2.9 7.6 57.844,938 100.0 31.0 2.7 8.2 58.246,812 100.0 30.1 2.7 8.5 58.6
48,575 100.0 28.5 2.5 8.3 60.749,491 100.0 28.4 2.6 8.8 60.254,891 100.0 28.3 2.6 9.0 60.160,504 100.0 26.6 2.5 8.6 62.267,039 100.0 24.8 2.5 8.8 63.9
69,485 100.0 23.2 2.3 8.3 66.169,269 100.0 21.9 2.3 7.9 67.871,191 100.0 21.5 2.2 7.3 68.968,150 100.0 21.2 2.1 7.1 69.662,577 100.0 21.8 2.0 6.9 69.361,789 100.0 21.0 1.8 6.1 71.1
a.
20112012201320142015
Includes applications for which the disability was previously established and those for which the basis for the determination is not available. The majority of applications for which the basis of determination is not available are cases allowed at or above the hearing level.
CONTACT: (410) 965-0090 or [email protected].
2010
199920002001200220032004
20052006200720082009
2015
2004
20052006200720082009
20102011201220132014
2003
1999200020012002
Because a number of applications remain pending for more recent years, the numbers and percentages will change over time.
Applications with a medical decision may be pending a final nonmedical decision or be subsequently denied for nonmedical reasons.
Data include decisions for Social Security–only applications and applications for both Social Security and Supplemental Security Income (SSI); they do not include SSI-only claims.
Data from 1992 through 1998 are available for disabled workers only.
NOTES: Data for the initial and reconsideration levels are current through June 2016. Data for the hearing level or above are current through July 2016.
Other a
Widow(er)s
Adult children
SOURCE: Social Security Administration, Disability Research file, 100 percent data.
Table 64.Number and percentage distribution of final medical allowances, by year of application and reason for allowance, 1992–2015—Continued
Year
Total Meets level of severity of listings
Equals level of severity of listings
Medical and vocational factors considered
160 ♦ Annual Statistical Report on the Social Security Disability Insurance Program, 2016
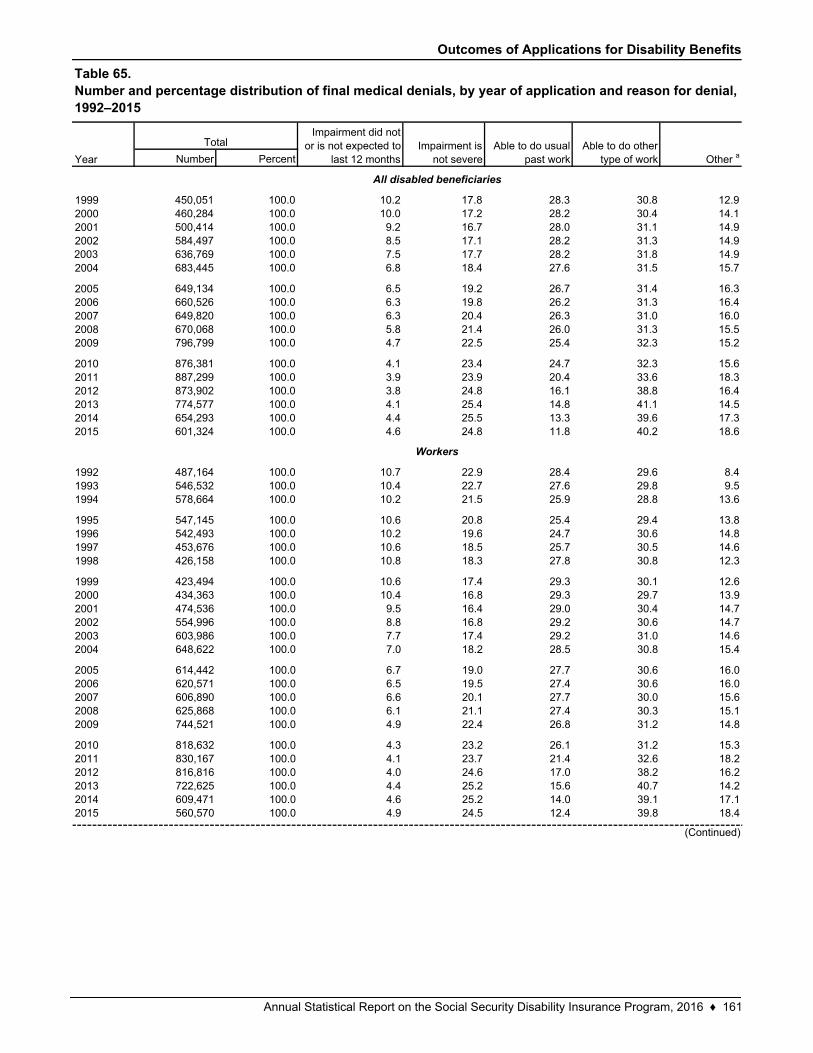
Outcomes of Applications for Disability Benefits
Number Percent
450,051 100.0 10.2 17.8 28.3 30.8 12.9460,284 100.0 10.0 17.2 28.2 30.4 14.1500,414 100.0 9.2 16.7 28.0 31.1 14.9584,497 100.0 8.5 17.1 28.2 31.3 14.9636,769 100.0 7.5 17.7 28.2 31.8 14.9683,445 100.0 6.8 18.4 27.6 31.5 15.7
649,134 100.0 6.5 19.2 26.7 31.4 16.3660,526 100.0 6.3 19.8 26.2 31.3 16.4649,820 100.0 6.3 20.4 26.3 31.0 16.0670,068 100.0 5.8 21.4 26.0 31.3 15.5796,799 100.0 4.7 22.5 25.4 32.3 15.2
876,381 100.0 4.1 23.4 24.7 32.3 15.6887,299 100.0 3.9 23.9 20.4 33.6 18.3873,902 100.0 3.8 24.8 16.1 38.8 16.4774,577 100.0 4.1 25.4 14.8 41.1 14.5654,293 100.0 4.4 25.5 13.3 39.6 17.3601,324 100.0 4.6 24.8 11.8 40.2 18.6
487,164 100.0 10.7 22.9 28.4 29.6 8.4546,532 100.0 10.4 22.7 27.6 29.8 9.5578,664 100.0 10.2 21.5 25.9 28.8 13.6
547,145 100.0 10.6 20.8 25.4 29.4 13.8542,493 100.0 10.2 19.6 24.7 30.6 14.8453,676 100.0 10.6 18.5 25.7 30.5 14.6426,158 100.0 10.8 18.3 27.8 30.8 12.3
423,494 100.0 10.6 17.4 29.3 30.1 12.6434,363 100.0 10.4 16.8 29.3 29.7 13.9474,536 100.0 9.5 16.4 29.0 30.4 14.7554,996 100.0 8.8 16.8 29.2 30.6 14.7603,986 100.0 7.7 17.4 29.2 31.0 14.6648,622 100.0 7.0 18.2 28.5 30.8 15.4
614,442 100.0 6.7 19.0 27.7 30.6 16.0620,571 100.0 6.5 19.5 27.4 30.6 16.0606,890 100.0 6.6 20.1 27.7 30.0 15.6625,868 100.0 6.1 21.1 27.4 30.3 15.1744,521 100.0 4.9 22.4 26.8 31.2 14.8
818,632 100.0 4.3 23.2 26.1 31.2 15.3830,167 100.0 4.1 23.7 21.4 32.6 18.2816,816 100.0 4.0 24.6 17.0 38.2 16.2722,625 100.0 4.4 25.2 15.6 40.7 14.2609,471 100.0 4.6 25.2 14.0 39.1 17.1560,570 100.0 4.9 24.5 12.4 39.8 18.4
20052006
20082009
201020112012201320142015
Year
1999200020012002
1995
20082009
201020112012201320142015
199219931994
2004
200520062007
(Continued)
2007
199619971998
199920002001200220032004
Table 65.Number and percentage distribution of final medical denials, by year of application and reason for denial, 1992–2015
TotalImpairment did not
or is not expected to last 12 months
Impairment is not severe
Able to do usual past work
Able to do other type of work Other a
All disabled beneficiaries
Workers
2003
Annual Statistical Report on the Social Security Disability Insurance Program, 2016 ♦ 161
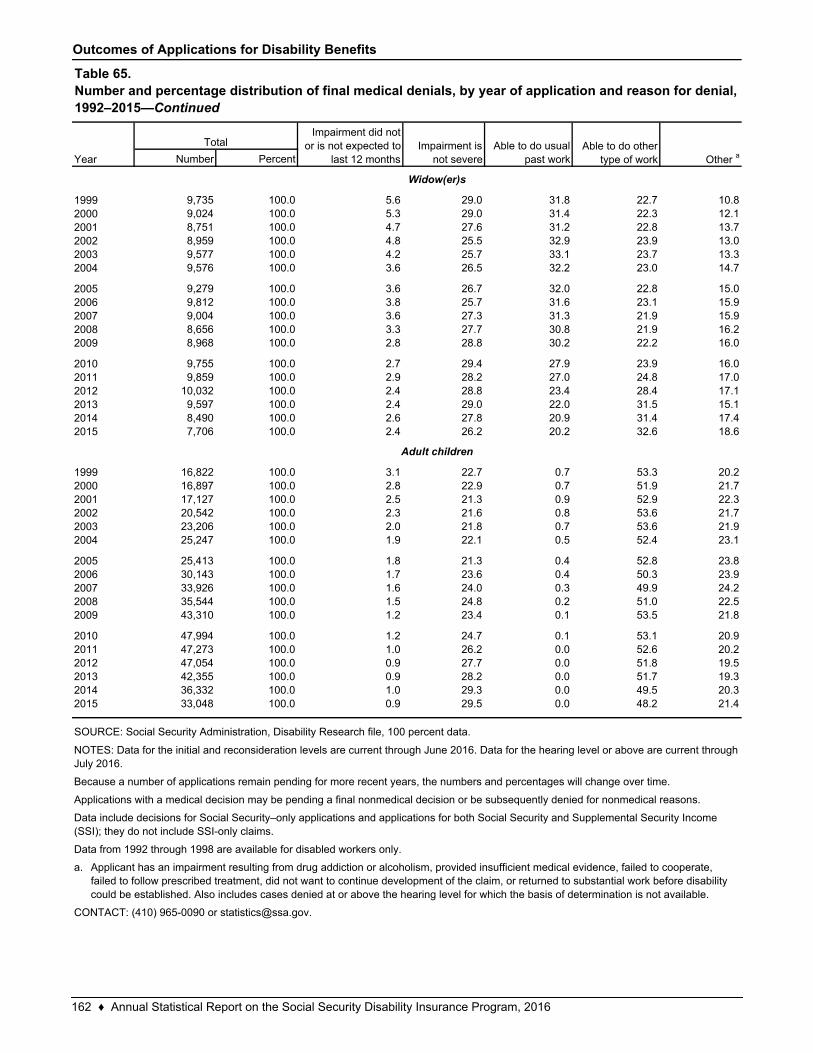
Outcomes of Applications for Disability Benefits
Number Percent
9,735 100.0 5.6 29.0 31.8 22.7 10.89,024 100.0 5.3 29.0 31.4 22.3 12.18,751 100.0 4.7 27.6 31.2 22.8 13.78,959 100.0 4.8 25.5 32.9 23.9 13.09,577 100.0 4.2 25.7 33.1 23.7 13.39,576 100.0 3.6 26.5 32.2 23.0 14.7
9,279 100.0 3.6 26.7 32.0 22.8 15.09,812 100.0 3.8 25.7 31.6 23.1 15.99,004 100.0 3.6 27.3 31.3 21.9 15.98,656 100.0 3.3 27.7 30.8 21.9 16.28,968 100.0 2.8 28.8 30.2 22.2 16.0
9,755 100.0 2.7 29.4 27.9 23.9 16.09,859 100.0 2.9 28.2 27.0 24.8 17.0
10,032 100.0 2.4 28.8 23.4 28.4 17.19,597 100.0 2.4 29.0 22.0 31.5 15.18,490 100.0 2.6 27.8 20.9 31.4 17.47,706 100.0 2.4 26.2 20.2 32.6 18.6
16,822 100.0 3.1 22.7 0.7 53.3 20.216,897 100.0 2.8 22.9 0.7 51.9 21.717,127 100.0 2.5 21.3 0.9 52.9 22.320,542 100.0 2.3 21.6 0.8 53.6 21.723,206 100.0 2.0 21.8 0.7 53.6 21.925,247 100.0 1.9 22.1 0.5 52.4 23.1
25,413 100.0 1.8 21.3 0.4 52.8 23.830,143 100.0 1.7 23.6 0.4 50.3 23.933,926 100.0 1.6 24.0 0.3 49.9 24.235,544 100.0 1.5 24.8 0.2 51.0 22.543,310 100.0 1.2 23.4 0.1 53.5 21.8
47,994 100.0 1.2 24.7 0.1 53.1 20.947,273 100.0 1.0 26.2 0.0 52.6 20.247,054 100.0 0.9 27.7 0.0 51.8 19.542,355 100.0 0.9 28.2 0.0 51.7 19.336,332 100.0 1.0 29.3 0.0 49.5 20.333,048 100.0 0.9 29.5 0.0 48.2 21.4
a.
201020112012201320142015
CONTACT: (410) 965-0090 or [email protected].
Applicant has an impairment resulting from drug addiction or alcoholism, provided insufficient medical evidence, failed to cooperate, failed to follow prescribed treatment, did not want to continue development of the claim, or returned to substantial work before disability could be established. Also includes cases denied at or above the hearing level for which the basis of determination is not available.
2009
2015
199920002001200220032004
2005200620072008
2014
20032004
20052006200720082009
2010201120122013
2002
199920002001
Because a number of applications remain pending for more recent years, the numbers and percentages will change over time.
Applications with a medical decision may be pending a final nonmedical decision or be subsequently denied for nonmedical reasons.
Data include decisions for Social Security–only applications and applications for both Social Security and Supplemental Security Income (SSI); they do not include SSI-only claims.
Data from 1992 through 1998 are available for disabled workers only.
NOTES: Data for the initial and reconsideration levels are current through June 2016. Data for the hearing level or above are current through July 2016.
Able to do other type of work Other a
Widow(er)s
Adult children
SOURCE: Social Security Administration, Disability Research file, 100 percent data.
Table 65.Number and percentage distribution of final medical denials, by year of application and reason for denial, 1992–2015—Continued
Year
TotalImpairment did not
or is not expected to last 12 months
Impairment is not severe
Able to do usual past work
162 ♦ Annual Statistical Report on the Social Security Disability Insurance Program, 2016
Disabled Beneficiaries Receiving Social Security, SSI, or Both

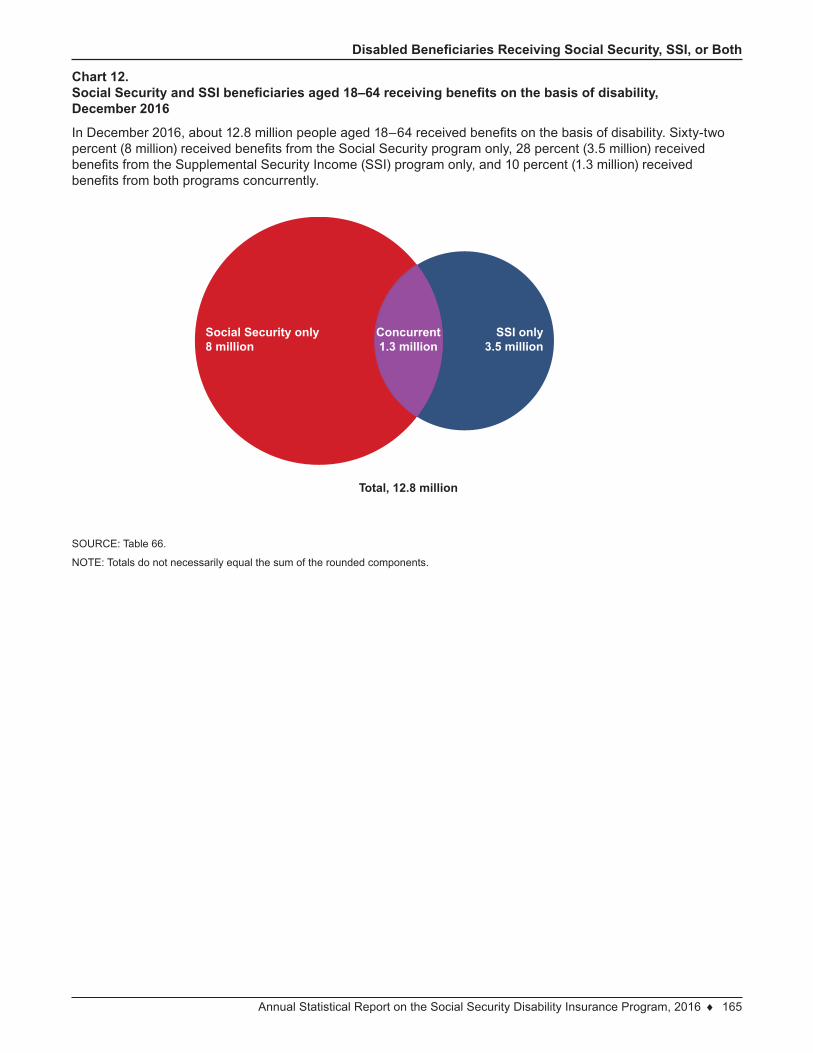
Annual Statistical Report on the Social Security Disability Insurance Program, 2016 ♦ 165
Disabled Beneficiaries Receiving Social Security, SSI, or Both
Chart 12.Social Security and SSI beneficiaries aged 18–64 receiving benefits on the basis of disability, December 2016
In December 2016, about 12.8 million people aged 18–64 received benefits on the basis of disability. Sixty-two percent (8 million) received benefits from the Social Security program only, 28 percent (3.5 million) received benefits from the Supplemental Security Income (SSI) program only, and 10 percent (1.3 million) received benefits from both programs concurrently.
SOURCE: Table 66.
NOTE: Totals do not necessarily equal the sum of the rounded components.
Total, 12.8 million
Social Security only8 million
SSI only3.5 million
Concurrent1.3 million
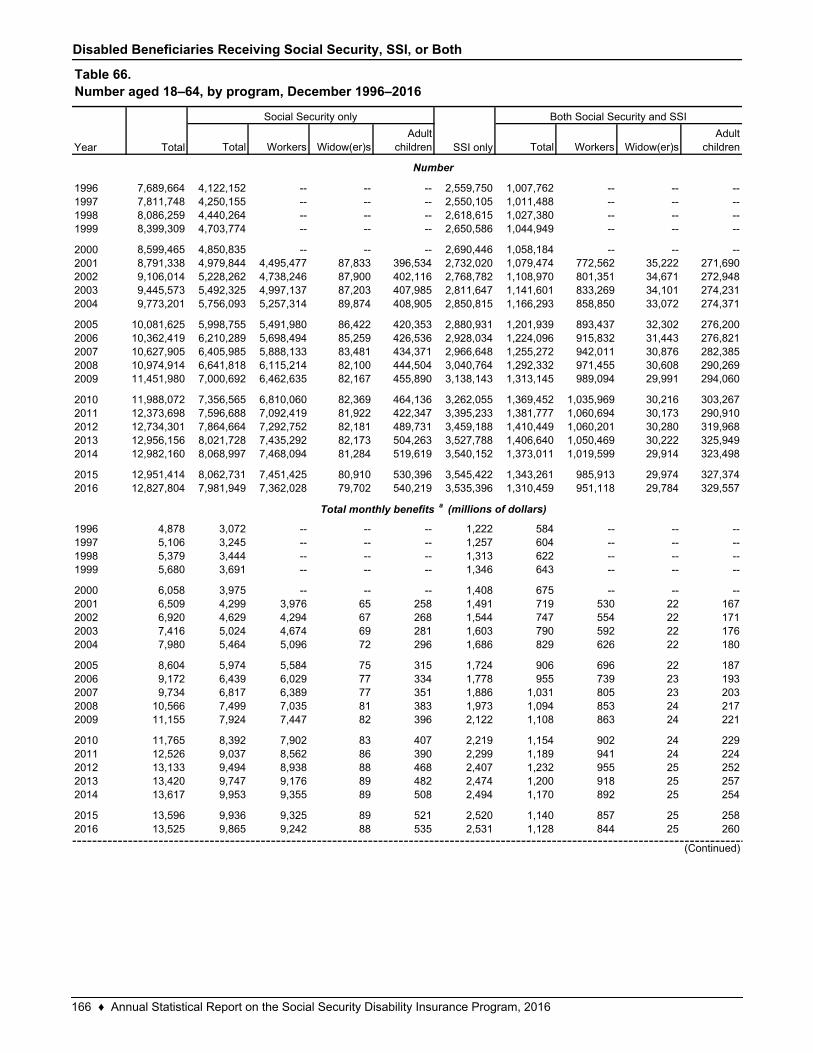
Disabled Beneficiaries Receiving Social Security, SSI, or Both
Total Workers Widow(er)sAdult
children Total Workers Widow(er)sAdult
children
7,689,664 4,122,152 -- -- -- 2,559,750 1,007,762 -- -- --7,811,748 4,250,155 -- -- -- 2,550,105 1,011,488 -- -- --8,086,259 4,440,264 -- -- -- 2,618,615 1,027,380 -- -- --8,399,309 4,703,774 -- -- -- 2,650,586 1,044,949 -- -- --
8,599,465 4,850,835 -- -- -- 2,690,446 1,058,184 -- -- --8,791,338 4,979,844 4,495,477 87,833 396,534 2,732,020 1,079,474 772,562 35,222 271,6909,106,014 5,228,262 4,738,246 87,900 402,116 2,768,782 1,108,970 801,351 34,671 272,9489,445,573 5,492,325 4,997,137 87,203 407,985 2,811,647 1,141,601 833,269 34,101 274,2319,773,201 5,756,093 5,257,314 89,874 408,905 2,850,815 1,166,293 858,850 33,072 274,371
10,081,625 5,998,755 5,491,980 86,422 420,353 2,880,931 1,201,939 893,437 32,302 276,20010,362,419 6,210,289 5,698,494 85,259 426,536 2,928,034 1,224,096 915,832 31,443 276,82110,627,905 6,405,985 5,888,133 83,481 434,371 2,966,648 1,255,272 942,011 30,876 282,38510,974,914 6,641,818 6,115,214 82,100 444,504 3,040,764 1,292,332 971,455 30,608 290,26911,451,980 7,000,692 6,462,635 82,167 455,890 3,138,143 1,313,145 989,094 29,991 294,060
11,988,072 7,356,565 6,810,060 82,369 464,136 3,262,055 1,369,452 1,035,969 30,216 303,26712,373,698 7,596,688 7,092,419 81,922 422,347 3,395,233 1,381,777 1,060,694 30,173 290,91012,734,301 7,864,664 7,292,752 82,181 489,731 3,459,188 1,410,449 1,060,201 30,280 319,96812,956,156 8,021,728 7,435,292 82,173 504,263 3,527,788 1,406,640 1,050,469 30,222 325,94912,982,160 8,068,997 7,468,094 81,284 519,619 3,540,152 1,373,011 1,019,599 29,914 323,498
12,951,414 8,062,731 7,451,425 80,910 530,396 3,545,422 1,343,261 985,913 29,974 327,37412,827,804 7,981,949 7,362,028 79,702 540,219 3,535,396 1,310,459 951,118 29,784 329,557
4,878 3,072 -- -- -- 1,222 584 -- -- --5,106 3,245 -- -- -- 1,257 604 -- -- --5,379 3,444 -- -- -- 1,313 622 -- -- --5,680 3,691 -- -- -- 1,346 643 -- -- --
6,058 3,975 -- -- -- 1,408 675 -- -- --6,509 4,299 3,976 65 258 1,491 719 530 22 1676,920 4,629 4,294 67 268 1,544 747 554 22 1717,416 5,024 4,674 69 281 1,603 790 592 22 1767,980 5,464 5,096 72 296 1,686 829 626 22 180
8,604 5,974 5,584 75 315 1,724 906 696 22 1879,172 6,439 6,029 77 334 1,778 955 739 23 1939,734 6,817 6,389 77 351 1,886 1,031 805 23 203
10,566 7,499 7,035 81 383 1,973 1,094 853 24 21711,155 7,924 7,447 82 396 2,122 1,108 863 24 221
11,765 8,392 7,902 83 407 2,219 1,154 902 24 22912,526 9,037 8,562 86 390 2,299 1,189 941 24 22413,133 9,494 8,938 88 468 2,407 1,232 955 25 25213,420 9,747 9,176 89 482 2,474 1,200 918 25 25713,617 9,953 9,355 89 508 2,494 1,170 892 25 254
13,596 9,936 9,325 89 521 2,520 1,140 857 25 25813,525 9,865 9,242 88 535 2,531 1,128 844 25 260
2009
20102011201220132014
20152016
2008
199719981999
20002001200220032004
200520062007
1996199719981999
1996
2006200720082009
20102011201220132014
20152016
20002001
Number
Total monthly benefits a (millions of dollars)
200220032004
2005
(Continued)
Table 66.Number aged 18–64, by program, December 1996–2016
Total
Social Security only
SSI only
Both Social Security and SSI
Year
166 ♦ Annual Statistical Report on the Social Security Disability Insurance Program, 2016
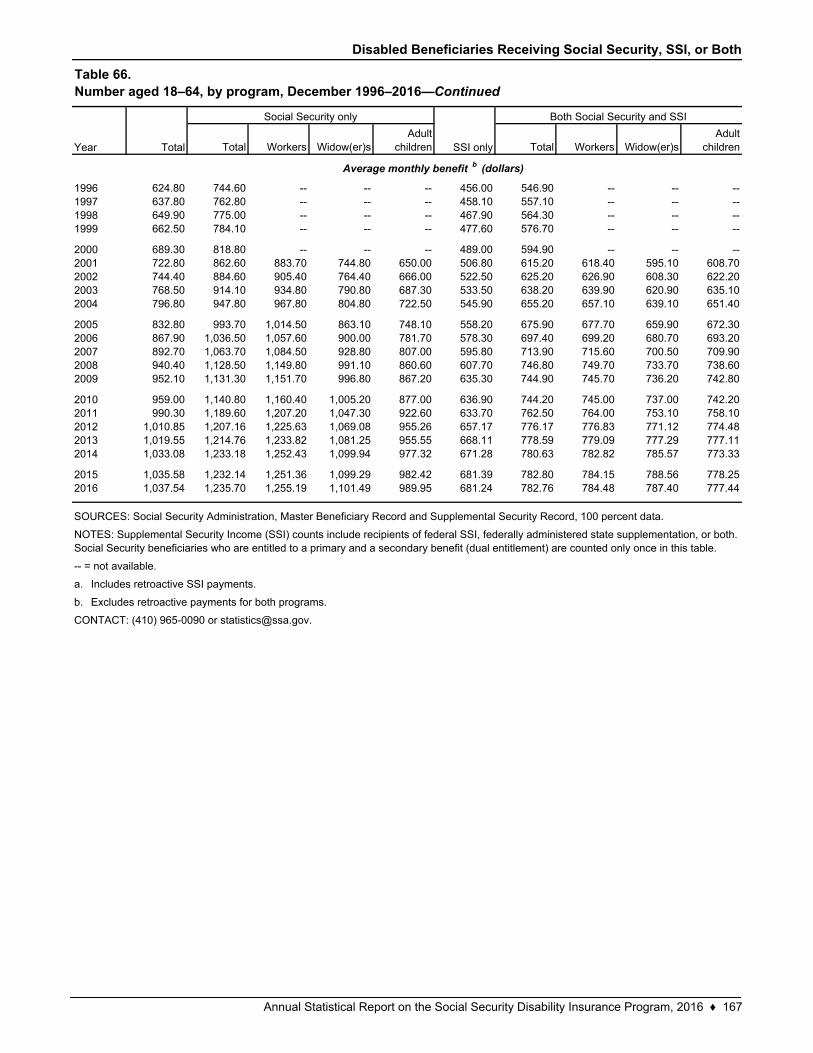
Disabled Beneficiaries Receiving Social Security, SSI, or Both
Total Workers Widow(er)sAdult
children Total Workers Widow(er)sAdult
children
624.80 744.60 -- -- -- 456.00 546.90 -- -- --637.80 762.80 -- -- -- 458.10 557.10 -- -- --649.90 775.00 -- -- -- 467.90 564.30 -- -- --662.50 784.10 -- -- -- 477.60 576.70 -- -- --
689.30 818.80 -- -- -- 489.00 594.90 -- -- --722.80 862.60 883.70 744.80 650.00 506.80 615.20 618.40 595.10 608.70744.40 884.60 905.40 764.40 666.00 522.50 625.20 626.90 608.30 622.20768.50 914.10 934.80 790.80 687.30 533.50 638.20 639.90 620.90 635.10796.80 947.80 967.80 804.80 722.50 545.90 655.20 657.10 639.10 651.40
832.80 993.70 1,014.50 863.10 748.10 558.20 675.90 677.70 659.90 672.30867.90 1,036.50 1,057.60 900.00 781.70 578.30 697.40 699.20 680.70 693.20892.70 1,063.70 1,084.50 928.80 807.00 595.80 713.90 715.60 700.50 709.90940.40 1,128.50 1,149.80 991.10 860.60 607.70 746.80 749.70 733.70 738.60952.10 1,131.30 1,151.70 996.80 867.20 635.30 744.90 745.70 736.20 742.80
959.00 1,140.80 1,160.40 1,005.20 877.00 636.90 744.20 745.00 737.00 742.20990.30 1,189.60 1,207.20 1,047.30 922.60 633.70 762.50 764.00 753.10 758.10
1,010.85 1,207.16 1,225.63 1,069.08 955.26 657.17 776.17 776.83 771.12 774.481,019.55 1,214.76 1,233.82 1,081.25 955.55 668.11 778.59 779.09 777.29 777.111,033.08 1,233.18 1,252.43 1,099.94 977.32 671.28 780.63 782.82 785.57 773.33
1,035.58 1,232.14 1,251.36 1,099.29 982.42 681.39 782.80 784.15 788.56 778.251,037.54 1,235.70 1,255.19 1,101.49 989.95 681.24 782.76 784.48 787.40 777.44
a.
b.
CONTACT: (410) 965-0090 or [email protected].
SOURCES: Social Security Administration, Master Beneficiary Record and Supplemental Security Record, 100 percent data.
NOTES: Supplemental Security Income (SSI) counts include recipients of federal SSI, federally administered state supplementation, or both. Social Security beneficiaries who are entitled to a primary and a secondary benefit (dual entitlement) are counted only once in this table.
-- = not available.
Excludes retroactive payments for both programs.
201220132014
20152016
Includes retroactive SSI payments.
2011
20002001200220032004
20052006200720082009
2010
1999
199619971998
Average monthly benefit b (dollars)
Table 66.Number aged 18–64, by program, December 1996–2016—Continued
Year Total
Social Security only
SSI only
Both Social Security and SSI
Annual Statistical Report on the Social Security Disability Insurance Program, 2016 ♦ 167
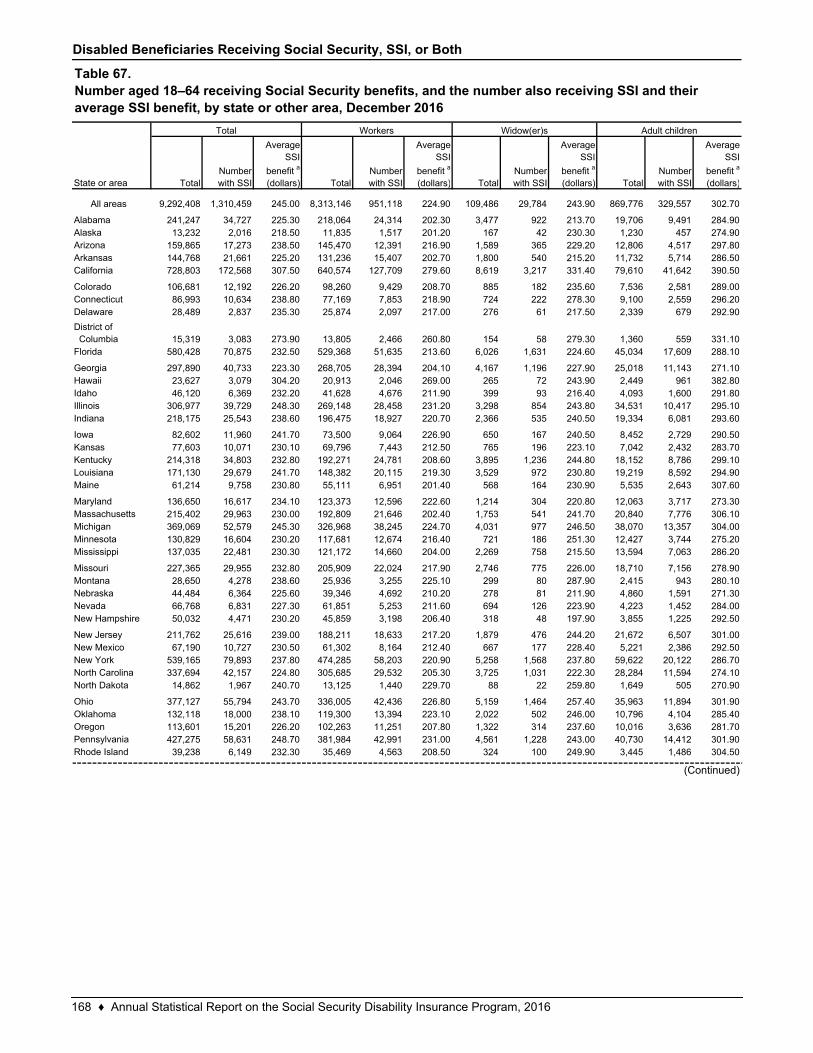
Disabled Beneficiaries Receiving Social Security, SSI, or Both
Total Number with SSI
Average SSI
benefit a
(dollars) TotalNumber with SSI
Average SSI
benefit a
(dollars) TotalNumber with SSI
Average SSI
benefit a
(dollars) TotalNumber with SSI
Average SSI
benefit a
(dollars)
All areas 9,292,408 1,310,459 245.00 8,313,146 951,118 224.90 109,486 29,784 243.90 869,776 329,557 302.70
241,247 34,727 225.30 218,064 24,314 202.30 3,477 922 213.70 19,706 9,491 284.9013,232 2,016 218.50 11,835 1,517 201.20 167 42 230.30 1,230 457 274.90
159,865 17,273 238.50 145,470 12,391 216.90 1,589 365 229.20 12,806 4,517 297.80144,768 21,661 225.20 131,236 15,407 202.70 1,800 540 215.20 11,732 5,714 286.50728,803 172,568 307.50 640,574 127,709 279.60 8,619 3,217 331.40 79,610 41,642 390.50
106,681 12,192 226.20 98,260 9,429 208.70 885 182 235.60 7,536 2,581 289.0086,993 10,634 238.80 77,169 7,853 218.90 724 222 278.30 9,100 2,559 296.2028,489 2,837 235.30 25,874 2,097 217.00 276 61 217.50 2,339 679 292.90
15,319 3,083 273.90 13,805 2,466 260.80 154 58 279.30 1,360 559 331.10580,428 70,875 232.50 529,368 51,635 213.60 6,026 1,631 224.60 45,034 17,609 288.10
297,890 40,733 223.30 268,705 28,394 204.10 4,167 1,196 227.90 25,018 11,143 271.1023,627 3,079 304.20 20,913 2,046 269.00 265 72 243.90 2,449 961 382.8046,120 6,369 232.20 41,628 4,676 211.90 399 93 216.40 4,093 1,600 291.80
306,977 39,729 248.30 269,148 28,458 231.20 3,298 854 243.80 34,531 10,417 295.10218,175 25,543 238.60 196,475 18,927 220.70 2,366 535 240.50 19,334 6,081 293.60
82,602 11,960 241.70 73,500 9,064 226.90 650 167 240.50 8,452 2,729 290.5077,603 10,071 230.10 69,796 7,443 212.50 765 196 223.10 7,042 2,432 283.70
214,318 34,803 232.80 192,271 24,781 208.60 3,895 1,236 244.80 18,152 8,786 299.10171,130 29,679 241.70 148,382 20,115 219.30 3,529 972 230.80 19,219 8,592 294.9061,214 9,758 230.80 55,111 6,951 201.40 568 164 230.90 5,535 2,643 307.60
136,650 16,617 234.10 123,373 12,596 222.60 1,214 304 220.80 12,063 3,717 273.30215,402 29,963 230.00 192,809 21,646 202.40 1,753 541 241.70 20,840 7,776 306.10369,069 52,579 245.30 326,968 38,245 224.70 4,031 977 246.50 38,070 13,357 304.00130,829 16,604 230.20 117,681 12,674 216.40 721 186 251.30 12,427 3,744 275.20137,035 22,481 230.30 121,172 14,660 204.00 2,269 758 215.50 13,594 7,063 286.20
227,365 29,955 232.80 205,909 22,024 217.90 2,746 775 226.00 18,710 7,156 278.9028,650 4,278 238.60 25,936 3,255 225.10 299 80 287.90 2,415 943 280.1044,484 6,364 225.60 39,346 4,692 210.20 278 81 211.90 4,860 1,591 271.3066,768 6,831 227.30 61,851 5,253 211.60 694 126 223.90 4,223 1,452 284.0050,032 4,471 230.20 45,859 3,198 206.40 318 48 197.90 3,855 1,225 292.50
211,762 25,616 239.00 188,211 18,633 217.20 1,879 476 244.20 21,672 6,507 301.0067,190 10,727 230.50 61,302 8,164 212.40 667 177 228.40 5,221 2,386 292.50
539,165 79,893 237.80 474,285 58,203 220.90 5,258 1,568 237.80 59,622 20,122 286.70337,694 42,157 224.80 305,685 29,532 205.30 3,725 1,031 222.30 28,284 11,594 274.1014,862 1,967 240.70 13,125 1,440 229.70 88 22 259.80 1,649 505 270.90
377,127 55,794 243.70 336,005 42,436 226.80 5,159 1,464 257.40 35,963 11,894 301.90132,118 18,000 238.10 119,300 13,394 223.10 2,022 502 246.00 10,796 4,104 285.40113,601 15,201 226.20 102,263 11,251 207.80 1,322 314 237.60 10,016 3,636 281.70427,275 58,631 248.70 381,984 42,991 231.00 4,561 1,228 243.00 40,730 14,412 301.9039,238 6,149 232.30 35,469 4,563 208.50 324 100 249.90 3,445 1,486 304.50
North Dakota
OhioOklahomaOregonPennsylvaniaRhode Island
North Carolina
MichiganMinnesotaMississippi
MissouriMontanaNebraskaNevadaNew Hampshire
New JerseyNew MexicoNew York
Massachusetts
GeorgiaHawaiiIdahoIllinoisIndiana
IowaKansasKentuckyLouisianaMaine
Maryland
California
ColoradoConnecticutDelaware
District of ColumbiaFlorida
State or area
AlabamaAlaskaArizonaArkansas
(Continued)
Table 67.Number aged 18–64 receiving Social Security benefits, and the number also receiving SSI and their average SSI benefit, by state or other area, December 2016
Total Workers Widow(er)s Adult children
168 ♦ Annual Statistical Report on the Social Security Disability Insurance Program, 2016
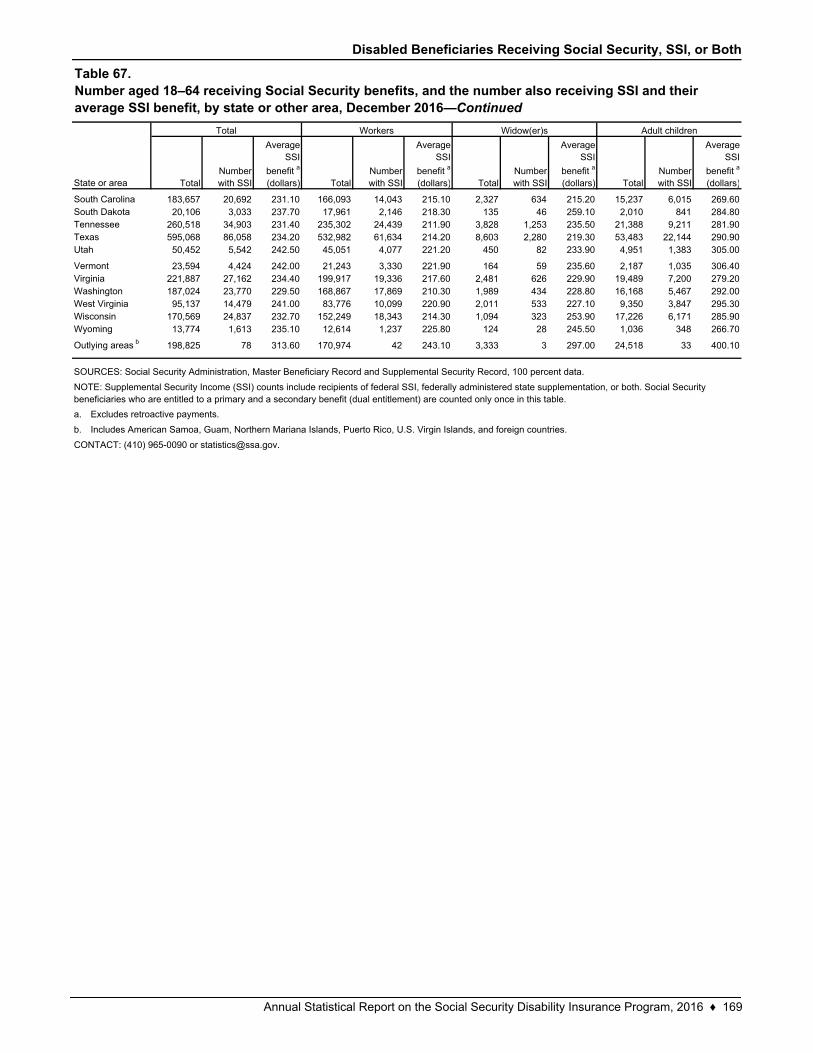
Disabled Beneficiaries Receiving Social Security, SSI, or Both
Total Number with SSI
Average SSI
benefit a
(dollars) TotalNumber with SSI
Average SSI
benefit a
(dollars) TotalNumber with SSI
Average SSI
benefit a
(dollars) TotalNumber with SSI
Average SSI
benefit a
(dollars)
183,657 20,692 231.10 166,093 14,043 215.10 2,327 634 215.20 15,237 6,015 269.6020,106 3,033 237.70 17,961 2,146 218.30 135 46 259.10 2,010 841 284.80
260,518 34,903 231.40 235,302 24,439 211.90 3,828 1,253 235.50 21,388 9,211 281.90595,068 86,058 234.20 532,982 61,634 214.20 8,603 2,280 219.30 53,483 22,144 290.9050,452 5,542 242.50 45,051 4,077 221.20 450 82 233.90 4,951 1,383 305.00
23,594 4,424 242.00 21,243 3,330 221.90 164 59 235.60 2,187 1,035 306.40221,887 27,162 234.40 199,917 19,336 217.60 2,481 626 229.90 19,489 7,200 279.20187,024 23,770 229.50 168,867 17,869 210.30 1,989 434 228.80 16,168 5,467 292.0095,137 14,479 241.00 83,776 10,099 220.90 2,011 533 227.10 9,350 3,847 295.30
170,569 24,837 232.70 152,249 18,343 214.30 1,094 323 253.90 17,226 6,171 285.9013,774 1,613 235.10 12,614 1,237 225.80 124 28 245.50 1,036 348 266.70
198,825 78 313.60 170,974 42 243.10 3,333 3 297.00 24,518 33 400.10
a.
b.
Excludes retroactive payments.
Includes American Samoa, Guam, Northern Mariana Islands, Puerto Rico, U.S. Virgin Islands, and foreign countries.
VirginiaWashingtonWest VirginiaWisconsinWyoming
Outlying areas b
Vermont
South CarolinaSouth DakotaTennesseeTexasUtah
SOURCES: Social Security Administration, Master Beneficiary Record and Supplemental Security Record, 100 percent data.
NOTE: Supplemental Security Income (SSI) counts include recipients of federal SSI, federally administered state supplementation, or both. Social Security beneficiaries who are entitled to a primary and a secondary benefit (dual entitlement) are counted only once in this table.
CONTACT: (410) 965-0090 or [email protected].
Table 67.Number aged 18–64 receiving Social Security benefits, and the number also receiving SSI and their average SSI benefit, by state or other area, December 2016—Continued
State or area
Total Workers Widow(er)s Adult children
Annual Statistical Report on the Social Security Disability Insurance Program, 2016 ♦ 169
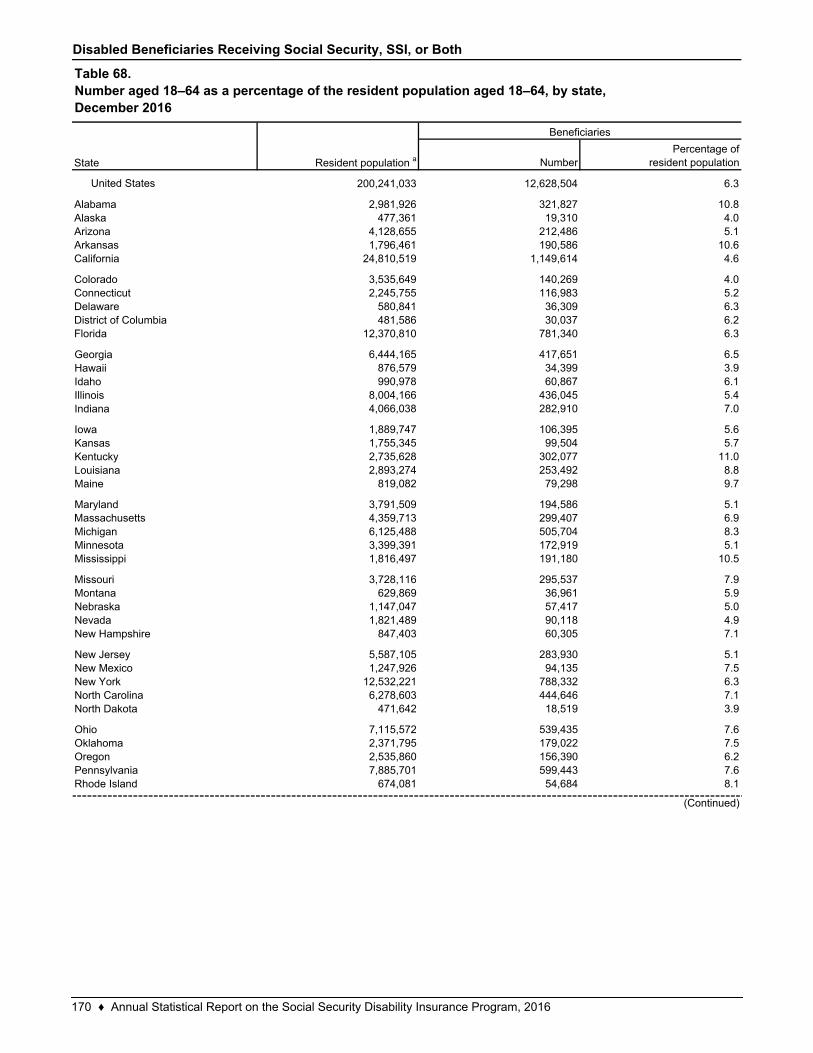
Disabled Beneficiaries Receiving Social Security, SSI, or Both
NumberPercentage of
resident population
United States 200,241,033 12,628,504 6.3
2,981,926 321,827 10.8477,361 19,310 4.0
4,128,655 212,486 5.11,796,461 190,586 10.6
24,810,519 1,149,614 4.6
3,535,649 140,269 4.02,245,755 116,983 5.2
580,841 36,309 6.3481,586 30,037 6.2
12,370,810 781,340 6.3
6,444,165 417,651 6.5876,579 34,399 3.9990,978 60,867 6.1
8,004,166 436,045 5.44,066,038 282,910 7.0
1,889,747 106,395 5.61,755,345 99,504 5.72,735,628 302,077 11.02,893,274 253,492 8.8
819,082 79,298 9.7
3,791,509 194,586 5.14,359,713 299,407 6.96,125,488 505,704 8.33,399,391 172,919 5.11,816,497 191,180 10.5
3,728,116 295,537 7.9629,869 36,961 5.9
1,147,047 57,417 5.01,821,489 90,118 4.9
847,403 60,305 7.1
5,587,105 283,930 5.11,247,926 94,135 7.5
12,532,221 788,332 6.36,278,603 444,646 7.1
471,642 18,519 3.9
7,115,572 539,435 7.62,371,795 179,022 7.52,535,860 156,390 6.27,885,701 599,443 7.6
674,081 54,684 8.1Rhode Island
North Dakota
OhioOklahomaOregonPennsylvania
Maryland
North Carolina
MichiganMinnesotaMississippi
MissouriMontanaNebraskaNevadaNew Hampshire
New JerseyNew MexicoNew York
IowaKansasKentuckyLouisianaMaine
GeorgiaHawaiiIdahoIllinoisIndiana
Table 68.Number aged 18–64 as a percentage of the resident population aged 18–64, by state,December 2016
Resident population a
Beneficiaries
(Continued)
State
AlabamaAlaskaArizonaArkansas
Florida
California
ColoradoConnecticutDelawareDistrict of Columbia
Massachusetts
170 ♦ Annual Statistical Report on the Social Security Disability Insurance Program, 2016
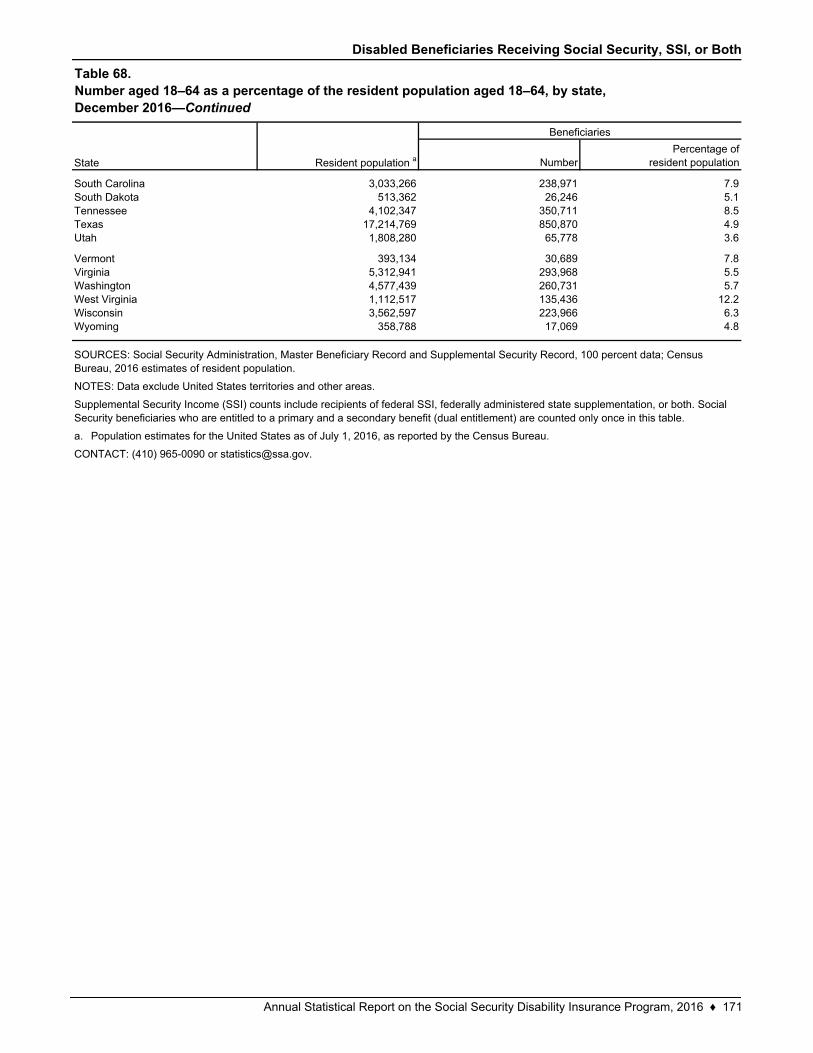
Disabled Beneficiaries Receiving Social Security, SSI, or Both
NumberPercentage of
resident population
3,033,266 238,971 7.9513,362 26,246 5.1
4,102,347 350,711 8.517,214,769 850,870 4.91,808,280 65,778 3.6
393,134 30,689 7.85,312,941 293,968 5.54,577,439 260,731 5.71,112,517 135,436 12.23,562,597 223,966 6.3
358,788 17,069 4.8
a.
South CarolinaSouth DakotaTennesseeTexas
SOURCES: Social Security Administration, Master Beneficiary Record and Supplemental Security Record, 100 percent data; Census Bureau, 2016 estimates of resident population.
NOTES: Data exclude United States territories and other areas.
Supplemental Security Income (SSI) counts include recipients of federal SSI, federally administered state supplementation, or both. Social Security beneficiaries who are entitled to a primary and a secondary benefit (dual entitlement) are counted only once in this table.
CONTACT: (410) 965-0090 or [email protected].
Table 68.Number aged 18–64 as a percentage of the resident population aged 18–64, by state,December 2016—Continued
State Resident population a
Beneficiaries
Vermont
Utah
VirginiaWashingtonWest VirginiaWisconsinWyoming
Population estimates for the United States as of July 1, 2016, as reported by the Census Bureau.
Annual Statistical Report on the Social Security Disability Insurance Program, 2016 ♦ 171
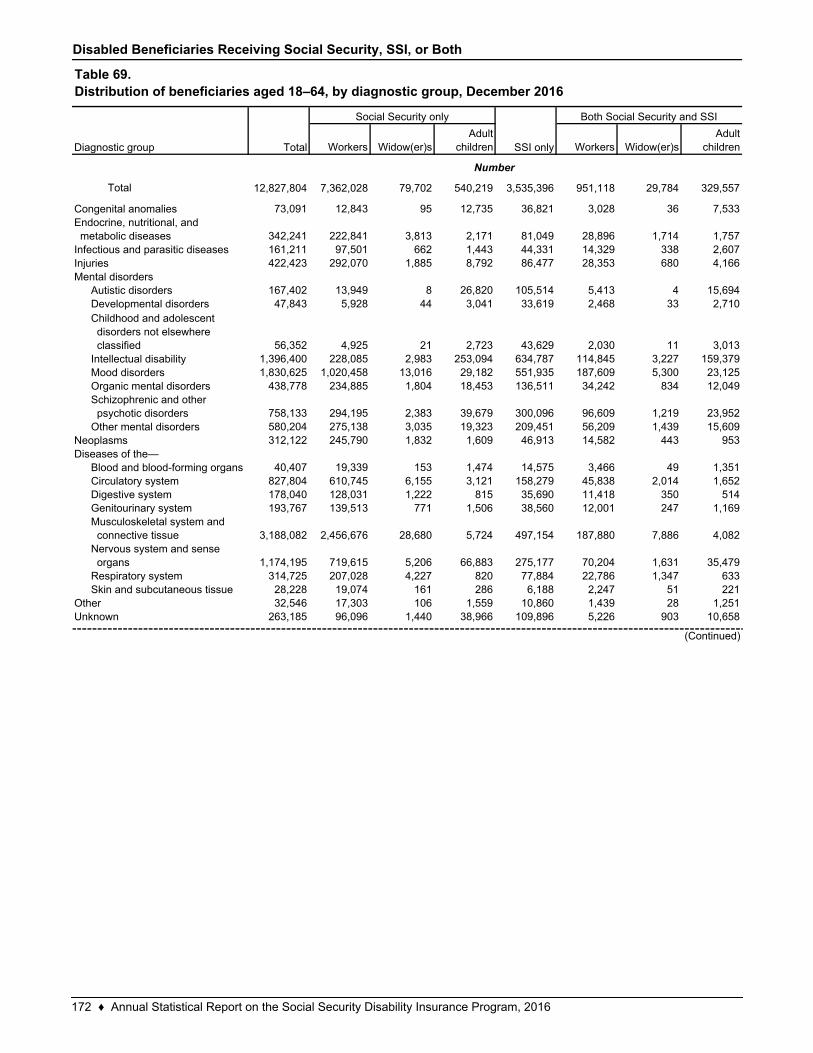
Disabled Beneficiaries Receiving Social Security, SSI, or Both
Workers Widow(er)sAdult
children Workers Widow(er)sAdult
children
Total 12,827,804 7,362,028 79,702 540,219 3,535,396 951,118 29,784 329,557
73,091 12,843 95 12,735 36,821 3,028 36 7,533
342,241 222,841 3,813 2,171 81,049 28,896 1,714 1,757161,211 97,501 662 1,443 44,331 14,329 338 2,607422,423 292,070 1,885 8,792 86,477 28,353 680 4,166
167,402 13,949 8 26,820 105,514 5,413 4 15,69447,843 5,928 44 3,041 33,619 2,468 33 2,710
56,352 4,925 21 2,723 43,629 2,030 11 3,0131,396,400 228,085 2,983 253,094 634,787 114,845 3,227 159,3791,830,625 1,020,458 13,016 29,182 551,935 187,609 5,300 23,125
438,778 234,885 1,804 18,453 136,511 34,242 834 12,049
758,133 294,195 2,383 39,679 300,096 96,609 1,219 23,952580,204 275,138 3,035 19,323 209,451 56,209 1,439 15,609312,122 245,790 1,832 1,609 46,913 14,582 443 953
40,407 19,339 153 1,474 14,575 3,466 49 1,351827,804 610,745 6,155 3,121 158,279 45,838 2,014 1,652178,040 128,031 1,222 815 35,690 11,418 350 514193,767 139,513 771 1,506 38,560 12,001 247 1,169
3,188,082 2,456,676 28,680 5,724 497,154 187,880 7,886 4,082
1,174,195 719,615 5,206 66,883 275,177 70,204 1,631 35,479314,725 207,028 4,227 820 77,884 22,786 1,347 63328,228 19,074 161 286 6,188 2,247 51 22132,546 17,303 106 1,559 10,860 1,439 28 1,251
263,185 96,096 1,440 38,966 109,896 5,226 903 10,658
Digestive systemGenitourinary systemMusculoskeletal system and connective tissueNervous system and sense organsRespiratory systemSkin and subcutaneous tissue
OtherUnknown
Congenital anomaliesEndocrine, nutritional, and metabolic diseasesInfectious and parasitic diseasesInjuries
Circulatory system
Autistic disordersDevelopmental disordersChildhood and adolescent disorders not elsewhere classifiedIntellectual disabilityMood disordersOrganic mental disordersSchizophrenic and other psychotic disordersOther mental disorders
NeoplasmsDiseases of the—
Blood and blood-forming organs
Mental disorders
Number
Table 69.Distribution of beneficiaries aged 18–64, by diagnostic group, December 2016
Total
Social Security only
SSI only
Both Social Security and SSI
(Continued)
Diagnostic group
172 ♦ Annual Statistical Report on the Social Security Disability Insurance Program, 2016
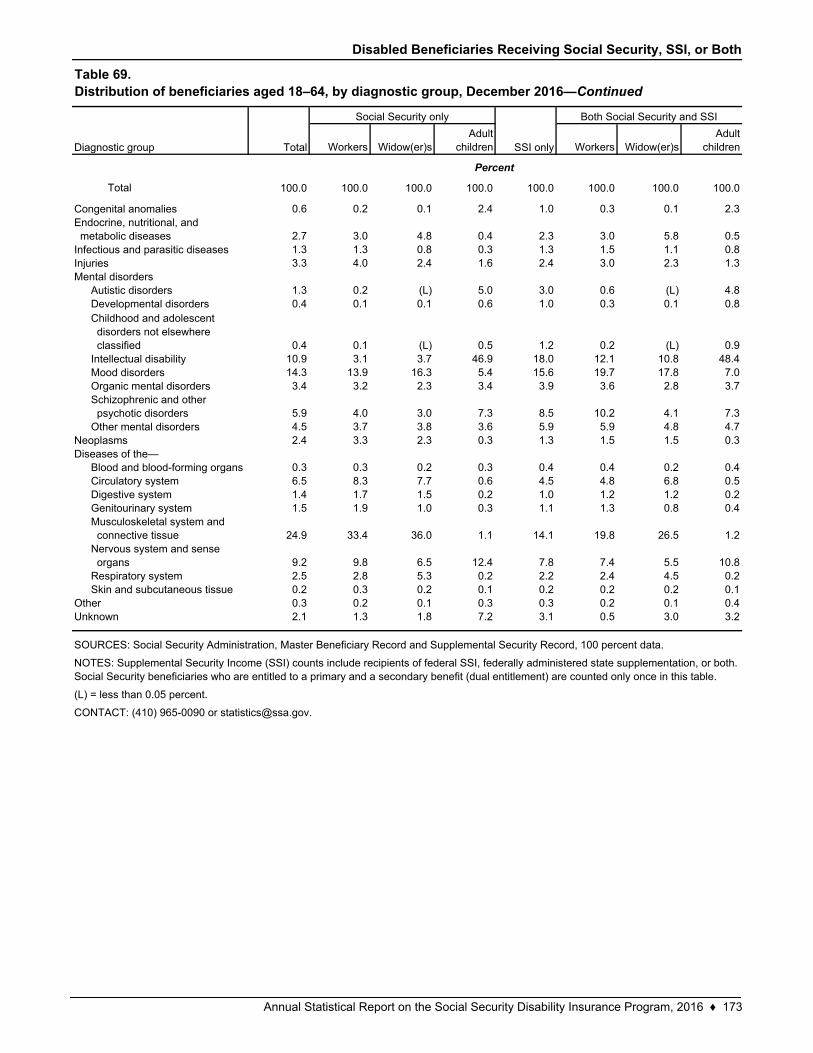
Disabled Beneficiaries Receiving Social Security, SSI, or Both
Workers Widow(er)sAdult
children Workers Widow(er)sAdult
children
Total 100.0 100.0 100.0 100.0 100.0 100.0 100.0 100.0
0.6 0.2 0.1 2.4 1.0 0.3 0.1 2.3
2.7 3.0 4.8 0.4 2.3 3.0 5.8 0.51.3 1.3 0.8 0.3 1.3 1.5 1.1 0.83.3 4.0 2.4 1.6 2.4 3.0 2.3 1.3
1.3 0.2 (L) 5.0 3.0 0.6 (L) 4.80.4 0.1 0.1 0.6 1.0 0.3 0.1 0.8
0.4 0.1 (L) 0.5 1.2 0.2 (L) 0.910.9 3.1 3.7 46.9 18.0 12.1 10.8 48.414.3 13.9 16.3 5.4 15.6 19.7 17.8 7.03.4 3.2 2.3 3.4 3.9 3.6 2.8 3.7
5.9 4.0 3.0 7.3 8.5 10.2 4.1 7.34.5 3.7 3.8 3.6 5.9 5.9 4.8 4.72.4 3.3 2.3 0.3 1.3 1.5 1.5 0.3
0.3 0.3 0.2 0.3 0.4 0.4 0.2 0.46.5 8.3 7.7 0.6 4.5 4.8 6.8 0.51.4 1.7 1.5 0.2 1.0 1.2 1.2 0.21.5 1.9 1.0 0.3 1.1 1.3 0.8 0.4
24.9 33.4 36.0 1.1 14.1 19.8 26.5 1.2
9.2 9.8 6.5 12.4 7.8 7.4 5.5 10.82.5 2.8 5.3 0.2 2.2 2.4 4.5 0.20.2 0.3 0.2 0.1 0.2 0.2 0.2 0.10.3 0.2 0.1 0.3 0.3 0.2 0.1 0.42.1 1.3 1.8 7.2 3.1 0.5 3.0 3.2
SOURCES: Social Security Administration, Master Beneficiary Record and Supplemental Security Record, 100 percent data.
NOTES: Supplemental Security Income (SSI) counts include recipients of federal SSI, federally administered state supplementation, or both. Social Security beneficiaries who are entitled to a primary and a secondary benefit (dual entitlement) are counted only once in this table.
(L) = less than 0.05 percent.
CONTACT: (410) 965-0090 or [email protected].
Skin and subcutaneous tissueOtherUnknown
Circulatory systemDigestive systemGenitourinary systemMusculoskeletal system and connective tissueNervous system and sense organsRespiratory system
Blood and blood-forming organs
Mental disordersAutistic disordersDevelopmental disordersChildhood and adolescent disorders not elsewhere classifiedIntellectual disabilityMood disordersOrganic mental disordersSchizophrenic and other psychotic disordersOther mental disorders
NeoplasmsDiseases of the—
Injuries
Congenital anomaliesEndocrine, nutritional, and metabolic diseasesInfectious and parasitic diseases
Percent
Table 69.Distribution of beneficiaries aged 18–64, by diagnostic group, December 2016—Continued
Diagnostic group Total
Social Security only
SSI only
Both Social Security and SSI
Annual Statistical Report on the Social Security Disability Insurance Program, 2016 ♦ 173

Appendix and Glossary

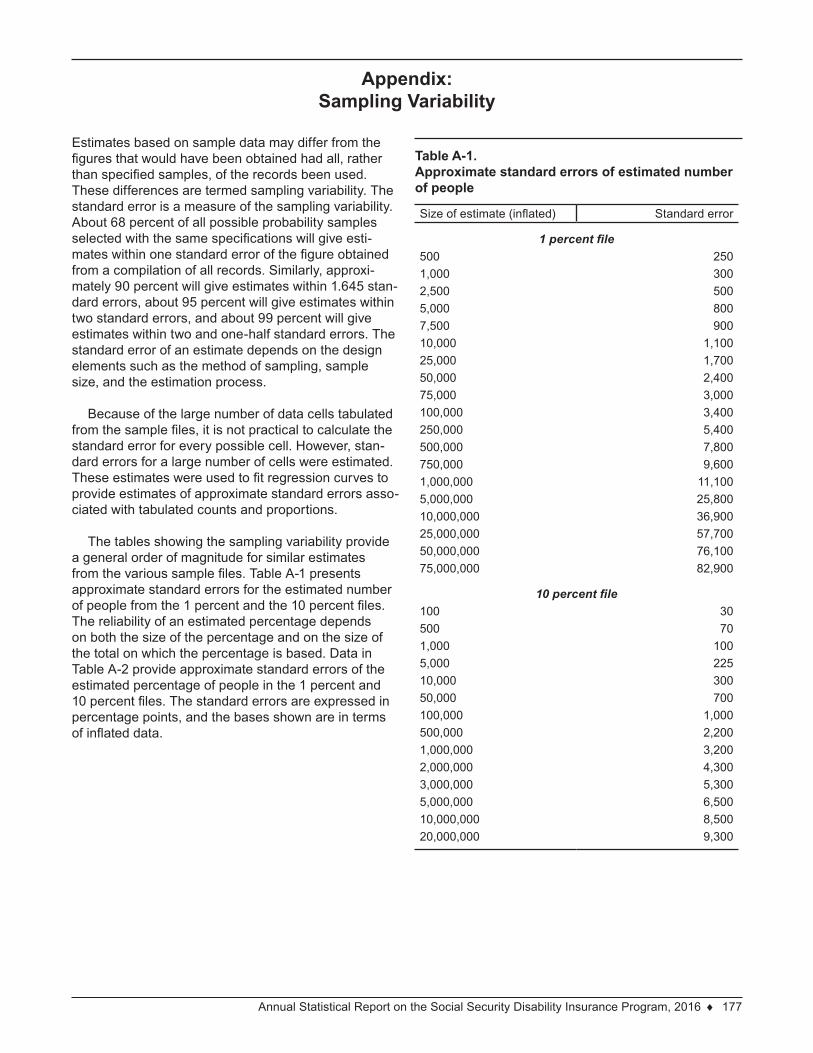
Annual Statistical Report on the Social Security Disability Insurance Program, 2016 ♦ 177
Appendix: Sampling Variability
Estimates based on sample data may differ from the figures that would have been obtained had all, rather than specified samples, of the records been used. These differences are termed sampling variability. The standard error is a measure of the sampling variability. About 68 percent of all possible probability samples selected with the same specifications will give esti-mates within one standard error of the figure obtained from a compilation of all records. Similarly, approxi-mately 90 percent will give estimates within 1.645 stan-dard errors, about 95 percent will give estimates within two standard errors, and about 99 percent will give estimates within two and one-half standard errors. The standard error of an estimate depends on the design elements such as the method of sampling, sample size, and the estimation process.
Because of the large number of data cells tabulated from the sample files, it is not practical to calculate the standard error for every possible cell. However, stan-dard errors for a large number of cells were estimated. These estimates were used to fit regression curves to provide estimates of approximate standard errors asso-ciated with tabulated counts and proportions.
The tables showing the sampling variability provide a general order of magnitude for similar estimates from the various sample files. Table A-1 presents approximate standard errors for the estimated number of people from the 1 percent and the 10 percent files. The reliability of an estimated percentage depends on both the size of the percentage and on the size of the total on which the percentage is based. Data in Table A-2 provide approximate standard errors of the estimated percentage of people in the 1 percent and 10 percent files. The standard errors are expressed in percentage points, and the bases shown are in terms of inflated data.
Table A-1. Approximate standard errors of estimated number of people
Size of estimate (inflated) Standard error
1 percent file500 2501,000 3002,500 5005,000 8007,500 90010,000 1,10025,000 1,70050,000 2,40075,000 3,000100,000 3,400250,000 5,400500,000 7,800750,000 9,6001,000,000 11,1005,000,000 25,80010,000,000 36,90025,000,000 57,70050,000,000 76,10075,000,000 82,900
10 percent file100 30500 701,000 1005,000 22510,000 30050,000 700100,000 1,000500,000 2,2001,000,000 3,2002,000,000 4,3003,000,000 5,3005,000,000 6,50010,000,000 8,50020,000,000 9,300
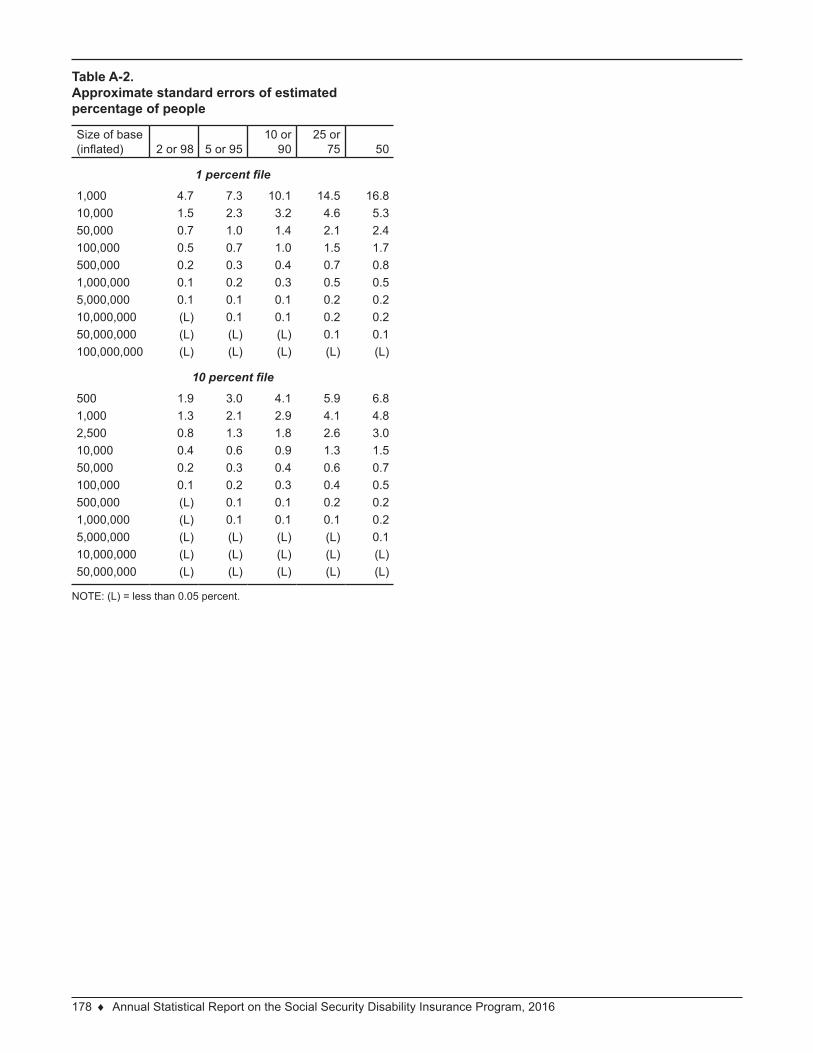
178 ♦ Annual Statistical Report on the Social Security Disability Insurance Program, 2016
Table A-2. Approximate standard errors of estimated percentage of people
Size of base (inflated) 2 or 98 5 or 95
10 or 90
25 or 75 50
1 percent file
1,000 4.7 7.3 10.1 14.5 16.810,000 1.5 2.3 3.2 4.6 5.350,000 0.7 1.0 1.4 2.1 2.4100,000 0.5 0.7 1.0 1.5 1.7500,000 0.2 0.3 0.4 0.7 0.81,000,000 0.1 0.2 0.3 0.5 0.55,000,000 0.1 0.1 0.1 0.2 0.210,000,000 (L) 0.1 0.1 0.2 0.250,000,000 (L) (L) (L) 0.1 0.1100,000,000 (L) (L) (L) (L) (L)
10 percent file
500 1.9 3.0 4.1 5.9 6.81,000 1.3 2.1 2.9 4.1 4.82,500 0.8 1.3 1.8 2.6 3.010,000 0.4 0.6 0.9 1.3 1.550,000 0.2 0.3 0.4 0.6 0.7100,000 0.1 0.2 0.3 0.4 0.5500,000 (L) 0.1 0.1 0.2 0.21,000,000 (L) 0.1 0.1 0.1 0.25,000,000 (L) (L) (L) (L) 0.110,000,000 (L) (L) (L) (L) (L)50,000,000 (L) (L) (L) (L) (L)
NOTE: (L) = less than 0.05 percent.
Annual Statistical Report on the Social Security Disability Insurance Program, 2016 ♦ 179
Glossary
administrative law judge (ALJ). An official of the Social Security Administration’s (SSA’s) Office of Hearings and Appeals who is specially qualified by education and experience to hold hearings and make independent decisions regarding eligibility for SSA programs on the basis of all evidence and testimony. ALJs conduct impartial hearings and issue decisions to claimants who have appealed previous determinations by SSA. See also administrative review process.
administrative review process. The procedures followed by the Social Security Administration (SSA) in deter-mining one’s rights under Title II and Title XVI of the Social Security Act. The administrative review process consists of several steps, which must usually be requested in the following order within certain time peri-ods: initial determination, reconsideration, decision of the administrative law judge, and a review by SSA’s Appeals Council.
age. In tables showing beneficiaries in current-payment status, the age classification is based on the beneficia-ry’s current age. In tables showing awards, age is the beneficiary’s age in the month of entitlement.
allowance. A determination by the Disability Determination Services, an administrative law judge, or the Appeals Council that an applicant meets the medical definition of disability under the law. See also disability.
allowance rate. The percentage of allowed disability applications in a given time period calculated as the num-ber of medically allowed applications divided by the total number of applications with a medical decision. At the hearing level, allowance rates are computed either as a percentage of dispositions (including dismissals) or as a percentage of decisions (excluding dismissals). In this publication, hearing level allowance rates are computed as a percentage of dispositions. An allowance rate provides a narrower view of the disability pro-gram than does an award rate because it excludes nonmedical determinations from its base.
Appeals Council. The organization within the Social Security Administration’s Office of Hearings and Appeals that makes the final decision in the administrative review process. See also administrative review process.
auxiliary benefit. A monthly benefit payable to a spouse or child of a retired or disabled worker (dependents benefit) or to a survivor of a deceased worker (survivors benefit).
average. See mean.
average current earnings. Earnings used to determine whether the workers’ compensation or public disability benefit offset applies. Average current earnings are defined as the highest of the following:
• The average monthly earnings used to figure a person’s Social Security disability benefit.
• The average monthly earnings from any work covered by Social Security that a person did (including self-employment) during the 5 highest consecutive years after 1950.
• The average monthly earnings from work or self-employment during the year a person became disabled or in the highest year of earnings that a person had during the 5-year period just before that person became disabled. (Divide the total year’s earnings by 12 to get the average current earnings.)
All earnings covered by Social Security, including amounts above the maximum taxable by Social Secu-rity, may be used when figuring average current earnings. See also workers’ compensation and public disability benefit offset.
average indexed monthly earnings (AIME). The amount of earnings used in determining the primary insurance amount (PIA) for most workers who attain age 62, become disabled, or die after 1978. A worker’s actual past earnings are adjusted by changes in the average wage index to bring them up to their approximately equiva-lent value at the time of eligibility for benefits. If the person attained age 62, became disabled, or died before 1979, the average monthly wage is used to calculate the PIA. See also primary insurance amount.
180 ♦ Annual Statistical Report on the Social Security Disability Insurance Program, 2016
average monthly wage (AMW). The dollar amount used in calculating a person’s monthly primary insurance amount (PIA) if that person attained age 62, became disabled, or died before 1979. The AMW is determined by dividing the total earnings in the “computation years” by the number of months in those same years. If the person attained age 62, became disabled or died after 1978, average indexed monthly earnings are used to calculate the PIA. See also primary insurance amount.
average wage index. The average amount of total wages for each year after 1950, including wages in noncov-ered employment and wages in covered employment in excess of the Social Security contribution and benefit base. Those average yearly amounts are used to index the earnings of most workers who first become eligible for benefits in 1979 or later and to make automatic adjustments in the contribution and benefit base, bend points, earnings test exempt amounts, and other wage-indexed amounts.
award. An administrative determination that an individual is entitled to receive monthly benefits or a lump-sum death payment. Awards can represent not only new entrants to the benefit rolls but also persons already on the rolls who become entitled to a different type of benefit. See also conversion of benefits.
award rate. The percentage of awarded applications in a given time period calculated as the number of awarded applications divided by the total number of applications decided, including technical denials and dismissals. An award rate provides a broader view of the program than does an allowance rate because an award rate includes as its base all applications decided.
bend points. The dollar amounts defining the average indexed monthly earnings or primary insurance amount brackets in the benefit formulas. See also average indexed monthly earnings and primary insurance amount.
beneficiary. A person who is entitled to Social Security benefits. The Social Security benefit may be either in current-payment status or withheld.
benefits in force. The sum of the number of persons with benefits in current-payment status and the number of persons with benefits withheld.
benefit termination. See termination.
benefits withheld. See withholding.
blind. Blindness, for Social Security purposes, means either central visual acuity of 20/200 or less in the better eye with the use of a correcting lens, or a limitation in the fields of vision so that the widest diameter of the visual field subtends an angle of 20 degrees or less (tunnel vision).
child’s benefit. A monthly benefit payable to the children of a retired or disabled worker or of a deceased worker who died either fully or currently insured. Benefits are payable to unmarried children under age 18 (up to age 19 if attending elementary or secondary school full time) and to disabled children aged 18 or older who became disabled before age 22. Under certain circumstances, benefits can be paid to stepchildren, grand-children, or adopted children. Benefits for disabled children may be continued if they marry certain other Social Security beneficiaries.
closed period award. An administrative determination that an individual is entitled to receive benefits for a lim-ited period of time. The determination is usually made after the period of entitlement has ended.
cost-of-living adjustment (COLA). The annual increases in benefits, effective for December, reflecting the increase in the cost of living. The benefit increase equals the percentage increase in the consumer price index for urban wage earners and clerical workers (CPI-W) measured from the average over July, August, and September of the preceding year to the average for the same 3 months in the current year. If the increase is less than one-tenth of 1 percent, when rounded, there is no automatic increase for the current year; the increase for the next year would reflect the increase in the cost of living over a 2-year period. See also consumer price index.
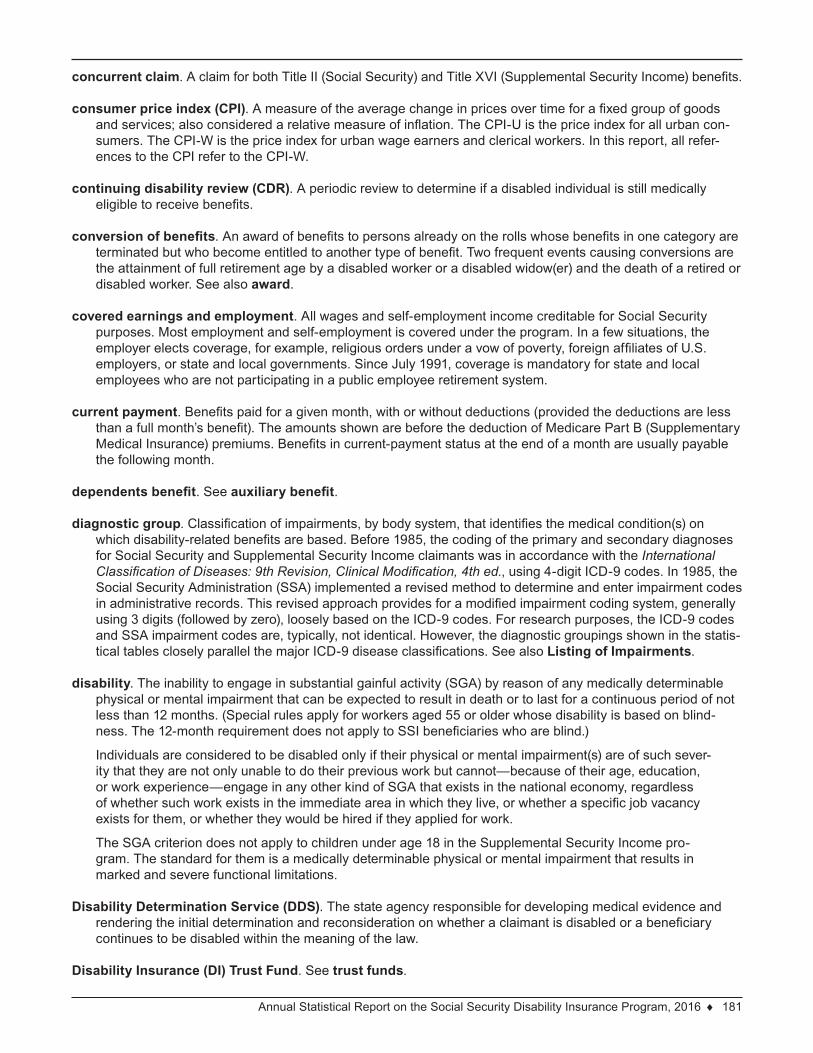
Annual Statistical Report on the Social Security Disability Insurance Program, 2016 ♦ 181
concurrent claim. A claim for both Title II (Social Security) and Title XVI (Supplemental Security Income) benefits.
consumer price index (CPI). A measure of the average change in prices over time for a fixed group of goods and services; also considered a relative measure of inflation. The CPI-U is the price index for all urban con-sumers. The CPI-W is the price index for urban wage earners and clerical workers. In this report, all refer-ences to the CPI refer to the CPI-W.
continuing disability review (CDR). A periodic review to determine if a disabled individual is still medically eligible to receive benefits.
conversion of benefits. An award of benefits to persons already on the rolls whose benefits in one category are terminated but who become entitled to another type of benefit. Two frequent events causing conversions are the attainment of full retirement age by a disabled worker or a disabled widow(er) and the death of a retired or disabled worker. See also award.
covered earnings and employment. All wages and self-employment income creditable for Social Security purposes. Most employment and self-employment is covered under the program. In a few situations, the employer elects coverage, for example, religious orders under a vow of poverty, foreign affiliates of U.S. employers, or state and local governments. Since July 1991, coverage is mandatory for state and local employees who are not participating in a public employee retirement system.
current payment. Benefits paid for a given month, with or without deductions (provided the deductions are less than a full month’s benefit). The amounts shown are before the deduction of Medicare Part B (Supplementary Medical Insurance) premiums. Benefits in current-payment status at the end of a month are usually payable the following month.
dependents benefit. See auxiliary benefit.
diagnostic group. Classification of impairments, by body system, that identifies the medical condition(s) on which disability-related benefits are based. Before 1985, the coding of the primary and secondary diagnoses for Social Security and Supplemental Security Income claimants was in accordance with the International Classification of Diseases: 9th Revision, Clinical Modification, 4th ed., using 4-digit ICD-9 codes. In 1985, the Social Security Administration (SSA) implemented a revised method to determine and enter impairment codes in administrative records. This revised approach provides for a modified impairment coding system, generally using 3 digits (followed by zero), loosely based on the ICD-9 codes. For research purposes, the ICD-9 codes and SSA impairment codes are, typically, not identical. However, the diagnostic groupings shown in the statis-tical tables closely parallel the major ICD-9 disease classifications. See also Listing of Impairments.
disability. The inability to engage in substantial gainful activity (SGA) by reason of any medically determinable physical or mental impairment that can be expected to result in death or to last for a continuous period of not less than 12 months. (Special rules apply for workers aged 55 or older whose disability is based on blind-ness. The 12-month requirement does not apply to SSI beneficiaries who are blind.)
Individuals are considered to be disabled only if their physical or mental impairment(s) are of such sever-ity that they are not only unable to do their previous work but cannot—because of their age, education, or work experience—engage in any other kind of SGA that exists in the national economy, regardless of whether such work exists in the immediate area in which they live, or whether a specific job vacancy exists for them, or whether they would be hired if they applied for work.
The SGA criterion does not apply to children under age 18 in the Supplemental Security Income pro-gram. The standard for them is a medically determinable physical or mental impairment that results in marked and severe functional limitations.
Disability Determination Service (DDS). The state agency responsible for developing medical evidence and rendering the initial determination and reconsideration on whether a claimant is disabled or a beneficiary continues to be disabled within the meaning of the law.
Disability Insurance (DI) Trust Fund. See trust funds.
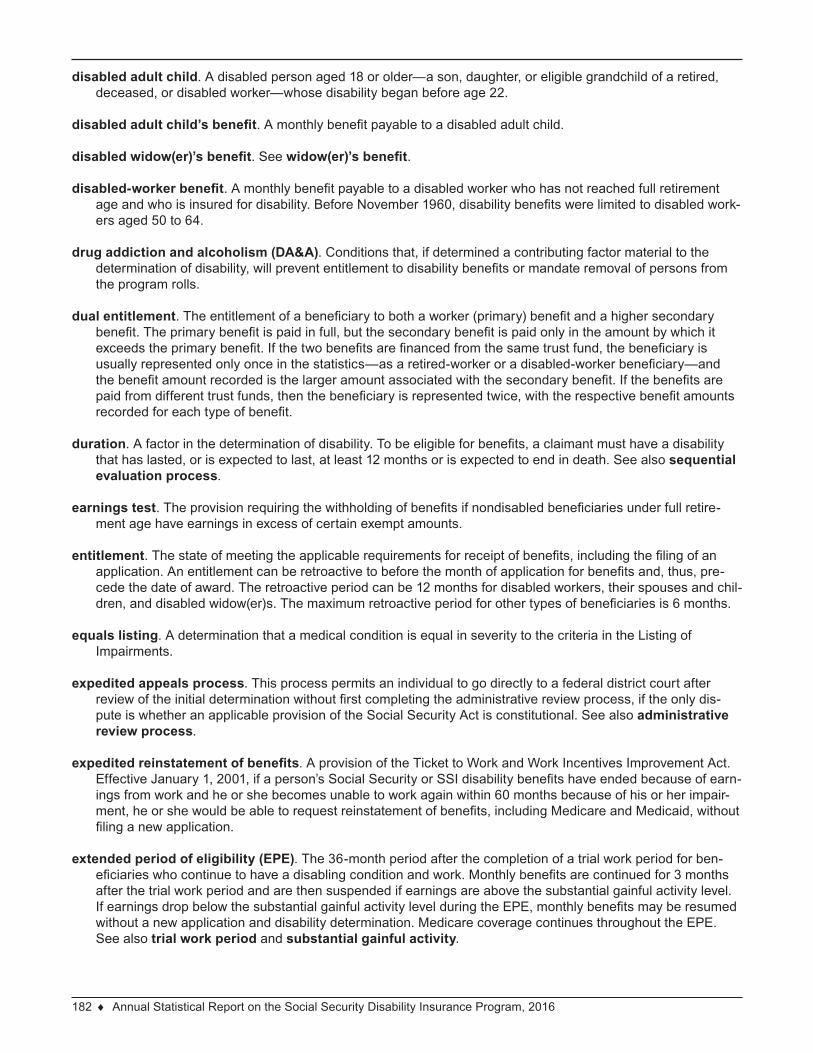
182 ♦ Annual Statistical Report on the Social Security Disability Insurance Program, 2016
disabled adult child. A disabled person aged 18 or older—a son, daughter, or eligible grandchild of a retired, deceased, or disabled worker—whose disability began before age 22.
disabled adult child’s benefit. A monthly benefit payable to a disabled adult child.
disabled widow(er)’s benefit. See widow(er)’s benefit.
disabled-worker benefit. A monthly benefit payable to a disabled worker who has not reached full retirement age and who is insured for disability. Before November 1960, disability benefits were limited to disabled work-ers aged 50 to 64.
drug addiction and alcoholism (DA&A). Conditions that, if determined a contributing factor material to the determination of disability, will prevent entitlement to disability benefits or mandate removal of persons from the program rolls.
dual entitlement. The entitlement of a beneficiary to both a worker (primary) benefit and a higher secondary benefit. The primary benefit is paid in full, but the secondary benefit is paid only in the amount by which it exceeds the primary benefit. If the two benefits are financed from the same trust fund, the beneficiary is usually represented only once in the statistics—as a retired-worker or a disabled-worker beneficiary—and the benefit amount recorded is the larger amount associated with the secondary benefit. If the benefits are paid from different trust funds, then the beneficiary is represented twice, with the respective benefit amounts recorded for each type of benefit.
duration. A factor in the determination of disability. To be eligible for benefits, a claimant must have a disability that has lasted, or is expected to last, at least 12 months or is expected to end in death. See also sequential evaluation process.
earnings test. The provision requiring the withholding of benefits if nondisabled beneficiaries under full retire-ment age have earnings in excess of certain exempt amounts.
entitlement. The state of meeting the applicable requirements for receipt of benefits, including the filing of an application. An entitlement can be retroactive to before the month of application for benefits and, thus, pre-cede the date of award. The retroactive period can be 12 months for disabled workers, their spouses and chil-dren, and disabled widow(er)s. The maximum retroactive period for other types of beneficiaries is 6 months.
equals listing. A determination that a medical condition is equal in severity to the criteria in the Listing of Impairments.
expedited appeals process. This process permits an individual to go directly to a federal district court after review of the initial determination without first completing the administrative review process, if the only dis-pute is whether an applicable provision of the Social Security Act is constitutional. See also administrative review process.
expedited reinstatement of benefits. A provision of the Ticket to Work and Work Incentives Improvement Act. Effective January 1, 2001, if a person’s Social Security or SSI disability benefits have ended because of earn-ings from work and he or she becomes unable to work again within 60 months because of his or her impair-ment, he or she would be able to request reinstatement of benefits, including Medicare and Medicaid, without filing a new application.
extended period of eligibility (EPE). The 36-month period after the completion of a trial work period for ben-eficiaries who continue to have a disabling condition and work. Monthly benefits are continued for 3 months after the trial work period and are then suspended if earnings are above the substantial gainful activity level. If earnings drop below the substantial gainful activity level during the EPE, monthly benefits may be resumed without a new application and disability determination. Medicare coverage continues throughout the EPE. See also trial work period and substantial gainful activity.
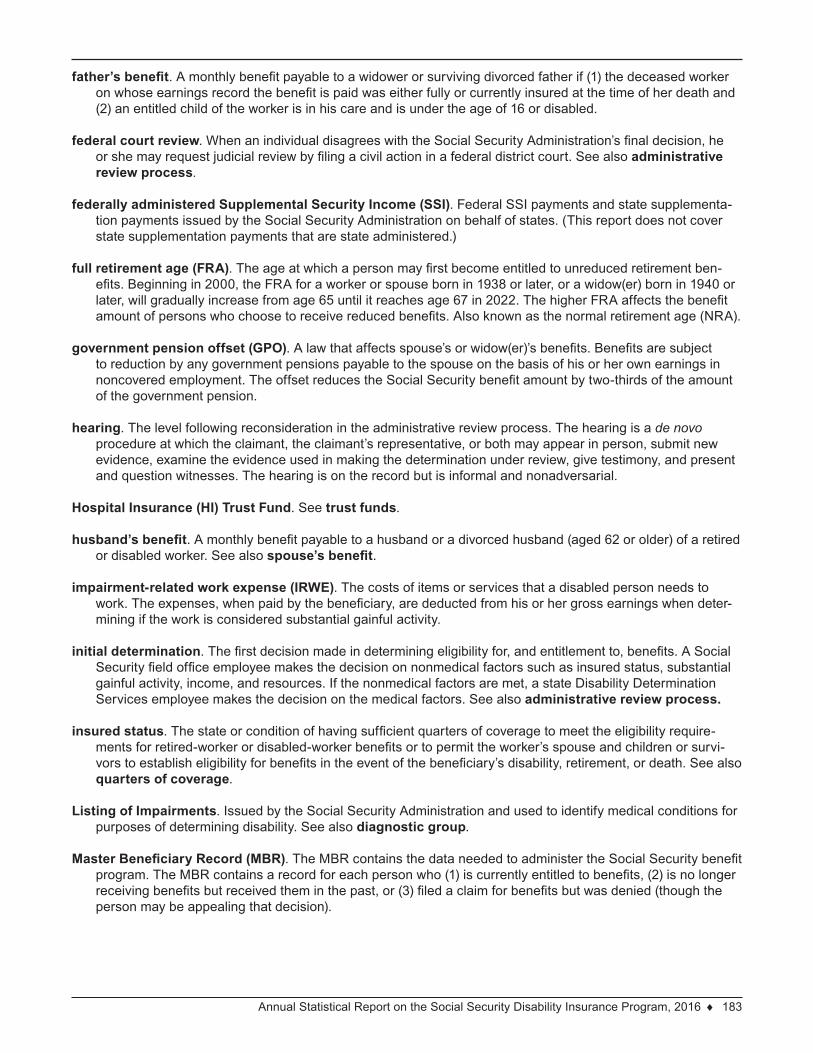
Annual Statistical Report on the Social Security Disability Insurance Program, 2016 ♦ 183
father’s benefit. A monthly benefit payable to a widower or surviving divorced father if (1) the deceased worker on whose earnings record the benefit is paid was either fully or currently insured at the time of her death and (2) an entitled child of the worker is in his care and is under the age of 16 or disabled.
federal court review. When an individual disagrees with the Social Security Administration’s final decision, he or she may request judicial review by filing a civil action in a federal district court. See also administrative review process.
federally administered Supplemental Security Income (SSI). Federal SSI payments and state supplementa-tion payments issued by the Social Security Administration on behalf of states. (This report does not cover state supplementation payments that are state administered.)
full retirement age (FRA). The age at which a person may first become entitled to unreduced retirement ben-efits. Beginning in 2000, the FRA for a worker or spouse born in 1938 or later, or a widow(er) born in 1940 or later, will gradually increase from age 65 until it reaches age 67 in 2022. The higher FRA affects the benefit amount of persons who choose to receive reduced benefits. Also known as the normal retirement age (NRA).
government pension offset (GPO). A law that affects spouse’s or widow(er)’s benefits. Benefits are subject to reduction by any government pensions payable to the spouse on the basis of his or her own earnings in noncovered employment. The offset reduces the Social Security benefit amount by two-thirds of the amount of the government pension.
hearing. The level following reconsideration in the administrative review process. The hearing is a de novo procedure at which the claimant, the claimant’s representative, or both may appear in person, submit new evidence, examine the evidence used in making the determination under review, give testimony, and present and question witnesses. The hearing is on the record but is informal and nonadversarial.
Hospital Insurance (HI) Trust Fund. See trust funds.
husband’s benefit. A monthly benefit payable to a husband or a divorced husband (aged 62 or older) of a retired or disabled worker. See also spouse’s benefit.
impairment-related work expense (IRWE). The costs of items or services that a disabled person needs to work. The expenses, when paid by the beneficiary, are deducted from his or her gross earnings when deter-mining if the work is considered substantial gainful activity.
initial determination. The first decision made in determining eligibility for, and entitlement to, benefits. A Social Security field office employee makes the decision on nonmedical factors such as insured status, substantial gainful activity, income, and resources. If the nonmedical factors are met, a state Disability Determination Services employee makes the decision on the medical factors. See also administrative review process.
insured status. The state or condition of having sufficient quarters of coverage to meet the eligibility require-ments for retired-worker or disabled-worker benefits or to permit the worker’s spouse and children or survi-vors to establish eligibility for benefits in the event of the beneficiary’s disability, retirement, or death. See also quarters of coverage.
Listing of Impairments. Issued by the Social Security Administration and used to identify medical conditions for purposes of determining disability. See also diagnostic group.
Master Beneficiary Record (MBR). The MBR contains the data needed to administer the Social Security benefit program. The MBR contains a record for each person who (1) is currently entitled to benefits, (2) is no longer receiving benefits but received them in the past, or (3) filed a claim for benefits but was denied (though the person may be appealing that decision).
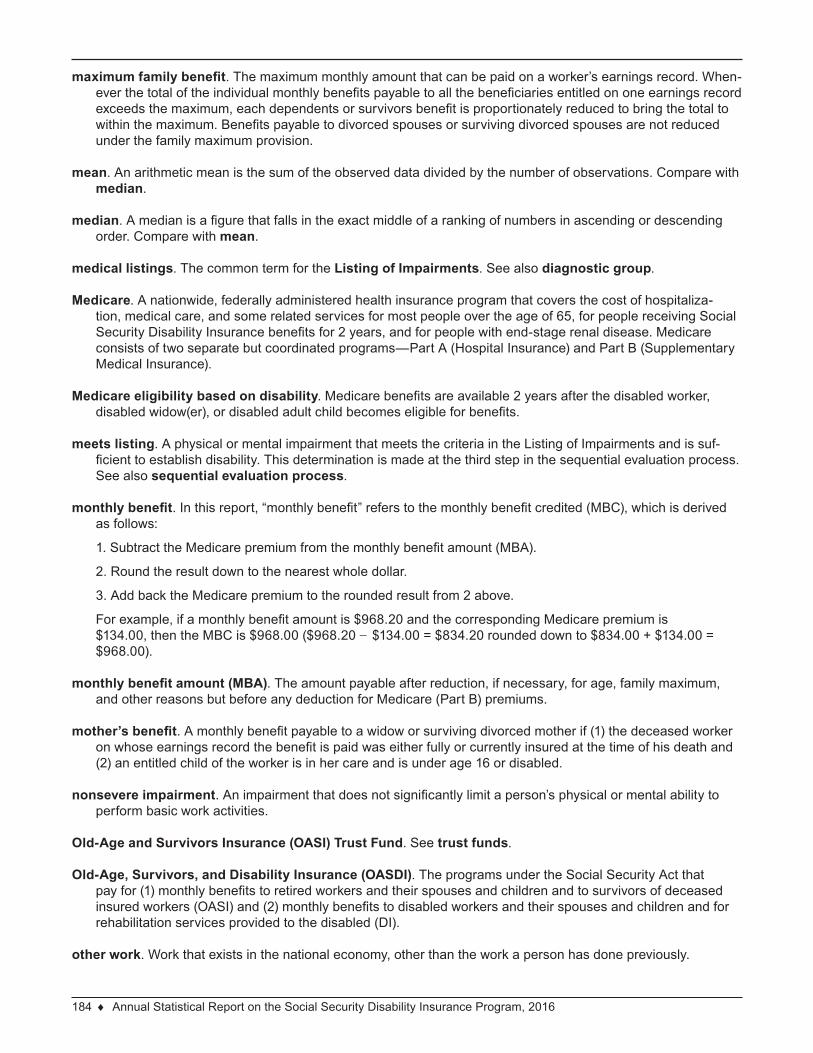
184 ♦ Annual Statistical Report on the Social Security Disability Insurance Program, 2016
maximum family benefit. The maximum monthly amount that can be paid on a worker’s earnings record. When-ever the total of the individual monthly benefits payable to all the beneficiaries entitled on one earnings record exceeds the maximum, each dependents or survivors benefit is proportionately reduced to bring the total to within the maximum. Benefits payable to divorced spouses or surviving divorced spouses are not reduced under the family maximum provision.
mean. An arithmetic mean is the sum of the observed data divided by the number of observations. Compare with median.
median. A median is a figure that falls in the exact middle of a ranking of numbers in ascending or descending order. Compare with mean.
medical listings. The common term for the Listing of Impairments. See also diagnostic group.
Medicare. A nationwide, federally administered health insurance program that covers the cost of hospitaliza-tion, medical care, and some related services for most people over the age of 65, for people receiving Social Security Disability Insurance benefits for 2 years, and for people with end-stage renal disease. Medicare consists of two separate but coordinated programs—Part A (Hospital Insurance) and Part B (Supplementary Medical Insurance).
Medicare eligibility based on disability. Medicare benefits are available 2 years after the disabled worker, disabled widow(er), or disabled adult child becomes eligible for benefits.
meets listing. A physical or mental impairment that meets the criteria in the Listing of Impairments and is suf-ficient to establish disability. This determination is made at the third step in the sequential evaluation process. See also sequential evaluation process.
monthly benefit. In this report, “monthly benefit” refers to the monthly benefit credited (MBC), which is derived as follows:
1. Subtract the Medicare premium from the monthly benefit amount (MBA).
2. Round the result down to the nearest whole dollar.
3. Add back the Medicare premium to the rounded result from 2 above.
For example, if a monthly benefit amount is $968.20 and the corresponding Medicare premium is $134.00, then the MBC is $968.00 ($968.20 − $134.00 = $834.20 rounded down to $834.00 + $134.00 = $968.00).
monthly benefit amount (MBA). The amount payable after reduction, if necessary, for age, family maximum, and other reasons but before any deduction for Medicare (Part B) premiums.
mother’s benefit. A monthly benefit payable to a widow or surviving divorced mother if (1) the deceased worker on whose earnings record the benefit is paid was either fully or currently insured at the time of his death and (2) an entitled child of the worker is in her care and is under age 16 or disabled.
nonsevere impairment. An impairment that does not significantly limit a person’s physical or mental ability to perform basic work activities.
Old-Age and Survivors Insurance (OASI) Trust Fund. See trust funds.
Old-Age, Survivors, and Disability Insurance (OASDI). The programs under the Social Security Act that pay for (1) monthly benefits to retired workers and their spouses and children and to survivors of deceased insured workers (OASI) and (2) monthly benefits to disabled workers and their spouses and children and for rehabilitation services provided to the disabled (DI).
other work. Work that exists in the national economy, other than the work a person has done previously.
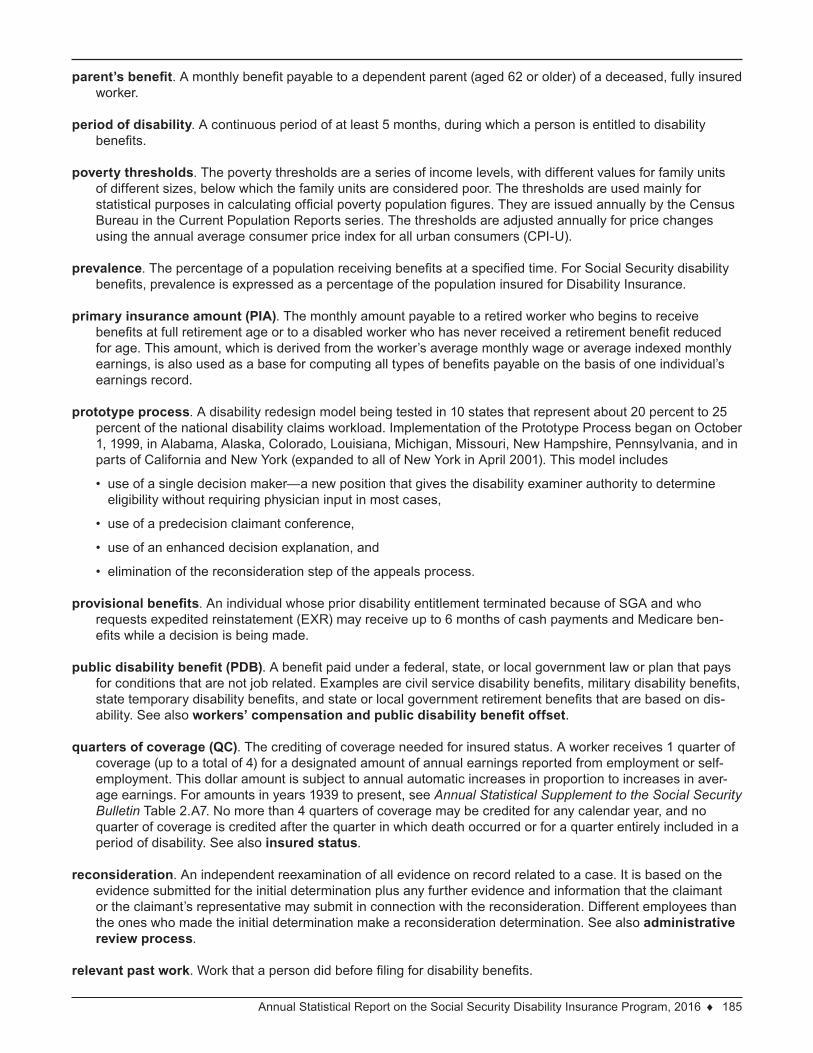
Annual Statistical Report on the Social Security Disability Insurance Program, 2016 ♦ 185
parent’s benefit. A monthly benefit payable to a dependent parent (aged 62 or older) of a deceased, fully insured worker.
period of disability. A continuous period of at least 5 months, during which a person is entitled to disability benefits.
poverty thresholds. The poverty thresholds are a series of income levels, with different values for family units of different sizes, below which the family units are considered poor. The thresholds are used mainly for statistical purposes in calculating official poverty population figures. They are issued annually by the Census Bureau in the Current Population Reports series. The thresholds are adjusted annually for price changes using the annual average consumer price index for all urban consumers (CPI-U).
prevalence. The percentage of a population receiving benefits at a specified time. For Social Security disability benefits, prevalence is expressed as a percentage of the population insured for Disability Insurance.
primary insurance amount (PIA). The monthly amount payable to a retired worker who begins to receive benefits at full retirement age or to a disabled worker who has never received a retirement benefit reduced for age. This amount, which is derived from the worker’s average monthly wage or average indexed monthly earnings, is also used as a base for computing all types of benefits payable on the basis of one individual’s earnings record.
prototype process. A disability redesign model being tested in 10 states that represent about 20 percent to 25 percent of the national disability claims workload. Implementation of the Prototype Process began on October 1, 1999, in Alabama, Alaska, Colorado, Louisiana, Michigan, Missouri, New Hampshire, Pennsylvania, and in parts of California and New York (expanded to all of New York in April 2001). This model includes
• use of a single decision maker—a new position that gives the disability examiner authority to determine eligibility without requiring physician input in most cases,
• use of a predecision claimant conference,
• use of an enhanced decision explanation, and
• elimination of the reconsideration step of the appeals process.
provisional benefits. An individual whose prior disability entitlement terminated because of SGA and who requests expedited reinstatement (EXR) may receive up to 6 months of cash payments and Medicare ben-efits while a decision is being made.
public disability benefit (PDB). A benefit paid under a federal, state, or local government law or plan that pays for conditions that are not job related. Examples are civil service disability benefits, military disability benefits, state temporary disability benefits, and state or local government retirement benefits that are based on dis-ability. See also workers’ compensation and public disability benefit offset.
quarters of coverage (QC). The crediting of coverage needed for insured status. A worker receives 1 quarter of coverage (up to a total of 4) for a designated amount of annual earnings reported from employment or self-employment. This dollar amount is subject to annual automatic increases in proportion to increases in aver-age earnings. For amounts in years 1939 to present, see Annual Statistical Supplement to the Social Security Bulletin Table 2.A7. No more than 4 quarters of coverage may be credited for any calendar year, and no quarter of coverage is credited after the quarter in which death occurred or for a quarter entirely included in a period of disability. See also insured status.
reconsideration. An independent reexamination of all evidence on record related to a case. It is based on the evidence submitted for the initial determination plus any further evidence and information that the claimant or the claimant’s representative may submit in connection with the reconsideration. Different employees than the ones who made the initial determination make a reconsideration determination. See also administrative review process.
relevant past work. Work that a person did before filing for disability benefits.
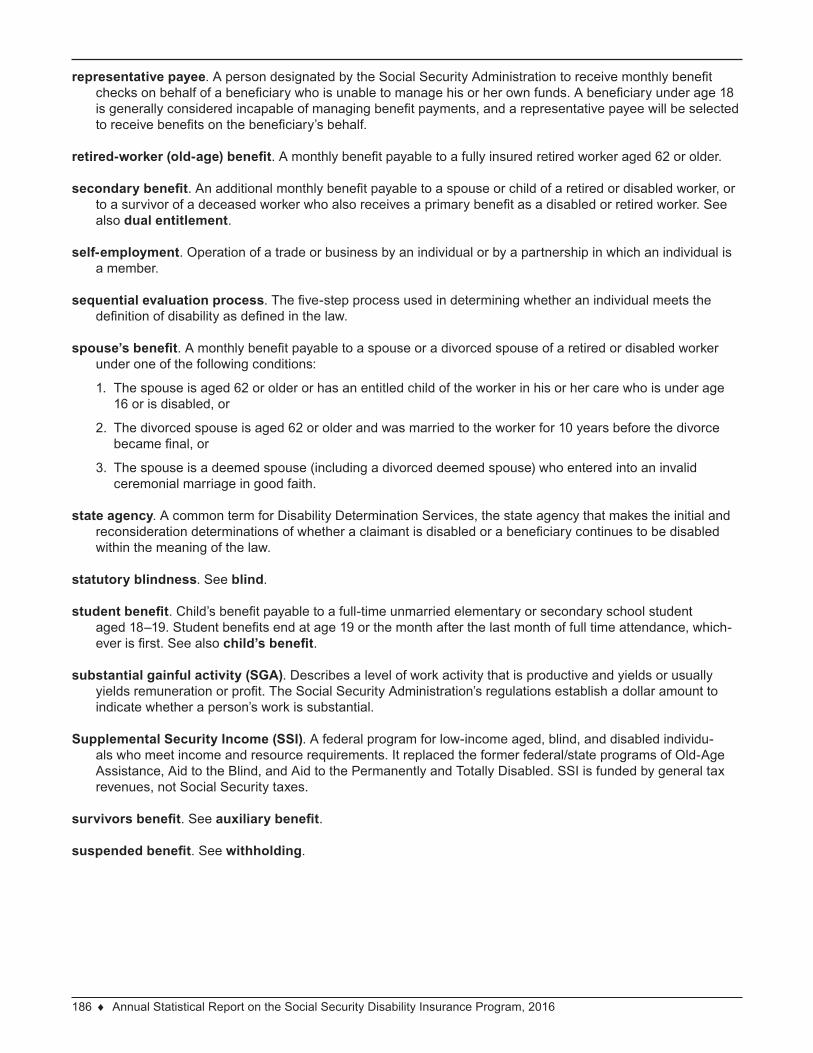
186 ♦ Annual Statistical Report on the Social Security Disability Insurance Program, 2016
representative payee. A person designated by the Social Security Administration to receive monthly benefit checks on behalf of a beneficiary who is unable to manage his or her own funds. A beneficiary under age 18 is generally considered incapable of managing benefit payments, and a representative payee will be selected to receive benefits on the beneficiary’s behalf.
retired-worker (old-age) benefit. A monthly benefit payable to a fully insured retired worker aged 62 or older.
secondary benefit. An additional monthly benefit payable to a spouse or child of a retired or disabled worker, or to a survivor of a deceased worker who also receives a primary benefit as a disabled or retired worker. See also dual entitlement.
self-employment. Operation of a trade or business by an individual or by a partnership in which an individual is a member.
sequential evaluation process. The five-step process used in determining whether an individual meets the definition of disability as defined in the law.
spouse’s benefit. A monthly benefit payable to a spouse or a divorced spouse of a retired or disabled worker under one of the following conditions:
1. The spouse is aged 62 or older or has an entitled child of the worker in his or her care who is under age 16 or is disabled, or
2. The divorced spouse is aged 62 or older and was married to the worker for 10 years before the divorce became final, or
3. The spouse is a deemed spouse (including a divorced deemed spouse) who entered into an invalid ceremonial marriage in good faith.
state agency. A common term for Disability Determination Services, the state agency that makes the initial and reconsideration determinations of whether a claimant is disabled or a beneficiary continues to be disabled within the meaning of the law.
statutory blindness. See blind.
student benefit. Child’s benefit payable to a full-time unmarried elementary or secondary school student aged 18–19. Student benefits end at age 19 or the month after the last month of full time attendance, which-ever is first. See also child’s benefit.
substantial gainful activity (SGA). Describes a level of work activity that is productive and yields or usually yields remuneration or profit. The Social Security Administration’s regulations establish a dollar amount to indicate whether a person’s work is substantial.
Supplemental Security Income (SSI). A federal program for low-income aged, blind, and disabled individu-als who meet income and resource requirements. It replaced the former federal/state programs of Old-Age Assistance, Aid to the Blind, and Aid to the Permanently and Totally Disabled. SSI is funded by general tax revenues, not Social Security taxes.
survivors benefit. See auxiliary benefit.
suspended benefit. See withholding.
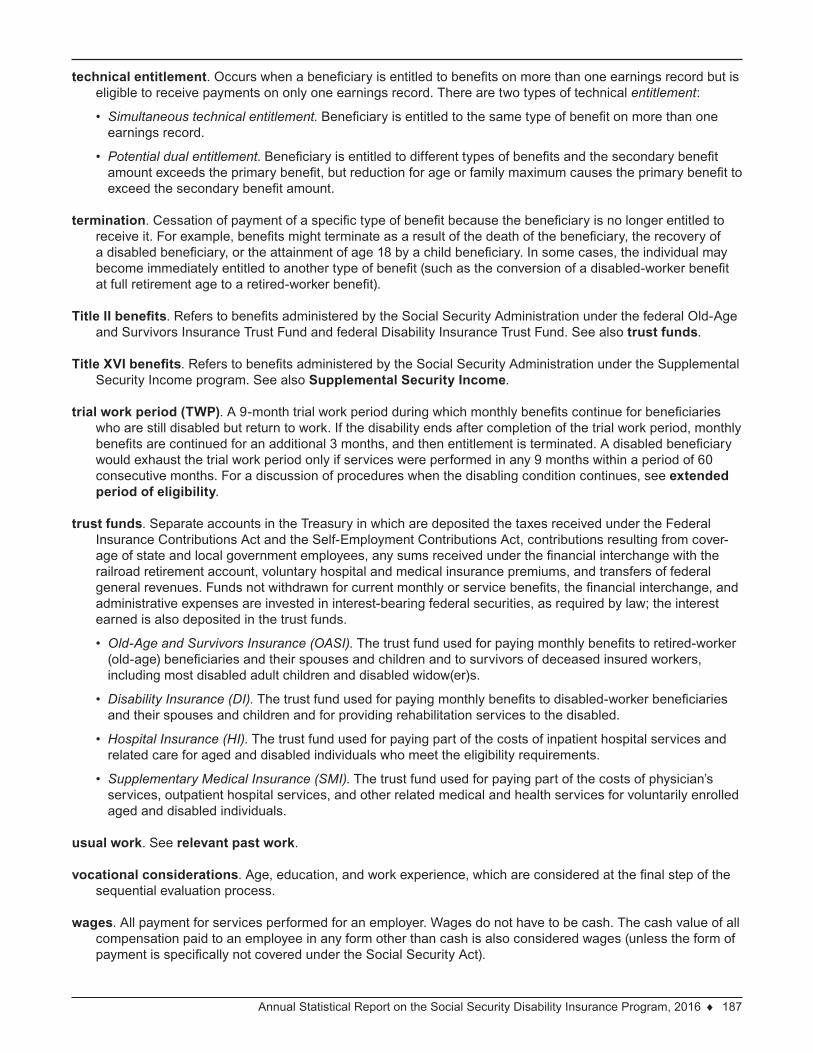
Annual Statistical Report on the Social Security Disability Insurance Program, 2016 ♦ 187
technical entitlement. Occurs when a beneficiary is entitled to benefits on more than one earnings record but is eligible to receive payments on only one earnings record. There are two types of technical entitlement:
• Simultaneous technical entitlement. Beneficiary is entitled to the same type of benefit on more than one earnings record.
• Potential dual entitlement. Beneficiary is entitled to different types of benefits and the secondary benefit amount exceeds the primary benefit, but reduction for age or family maximum causes the primary benefit to exceed the secondary benefit amount.
termination. Cessation of payment of a specific type of benefit because the beneficiary is no longer entitled to receive it. For example, benefits might terminate as a result of the death of the beneficiary, the recovery of a disabled beneficiary, or the attainment of age 18 by a child beneficiary. In some cases, the individual may become immediately entitled to another type of benefit (such as the conversion of a disabled-worker benefit at full retirement age to a retired-worker benefit).
Title II benefits. Refers to benefits administered by the Social Security Administration under the federal Old-Age and Survivors Insurance Trust Fund and federal Disability Insurance Trust Fund. See also trust funds.
Title XVI benefits. Refers to benefits administered by the Social Security Administration under the Supplemental Security Income program. See also Supplemental Security Income.
trial work period (TWP). A 9-month trial work period during which monthly benefits continue for beneficiaries who are still disabled but return to work. If the disability ends after completion of the trial work period, monthly benefits are continued for an additional 3 months, and then entitlement is terminated. A disabled beneficiary would exhaust the trial work period only if services were performed in any 9 months within a period of 60 consecutive months. For a discussion of procedures when the disabling condition continues, see extended period of eligibility.
trust funds. Separate accounts in the Treasury in which are deposited the taxes received under the Federal Insurance Contributions Act and the Self-Employment Contributions Act, contributions resulting from cover-age of state and local government employees, any sums received under the financial interchange with the railroad retirement account, voluntary hospital and medical insurance premiums, and transfers of federal general revenues. Funds not withdrawn for current monthly or service benefits, the financial interchange, and administrative expenses are invested in interest-bearing federal securities, as required by law; the interest earned is also deposited in the trust funds.
• Old-Age and Survivors Insurance (OASI). The trust fund used for paying monthly benefits to retired-worker (old-age) beneficiaries and their spouses and children and to survivors of deceased insured workers, including most disabled adult children and disabled widow(er)s.
• Disability Insurance (DI). The trust fund used for paying monthly benefits to disabled-worker beneficiaries and their spouses and children and for providing rehabilitation services to the disabled.
• Hospital Insurance (HI). The trust fund used for paying part of the costs of inpatient hospital services and related care for aged and disabled individuals who meet the eligibility requirements.
• Supplementary Medical Insurance (SMI). The trust fund used for paying part of the costs of physician’s services, outpatient hospital services, and other related medical and health services for voluntarily enrolled aged and disabled individuals.
usual work. See relevant past work.
vocational considerations. Age, education, and work experience, which are considered at the final step of the sequential evaluation process.
wages. All payment for services performed for an employer. Wages do not have to be cash. The cash value of all compensation paid to an employee in any form other than cash is also considered wages (unless the form of payment is specifically not covered under the Social Security Act).
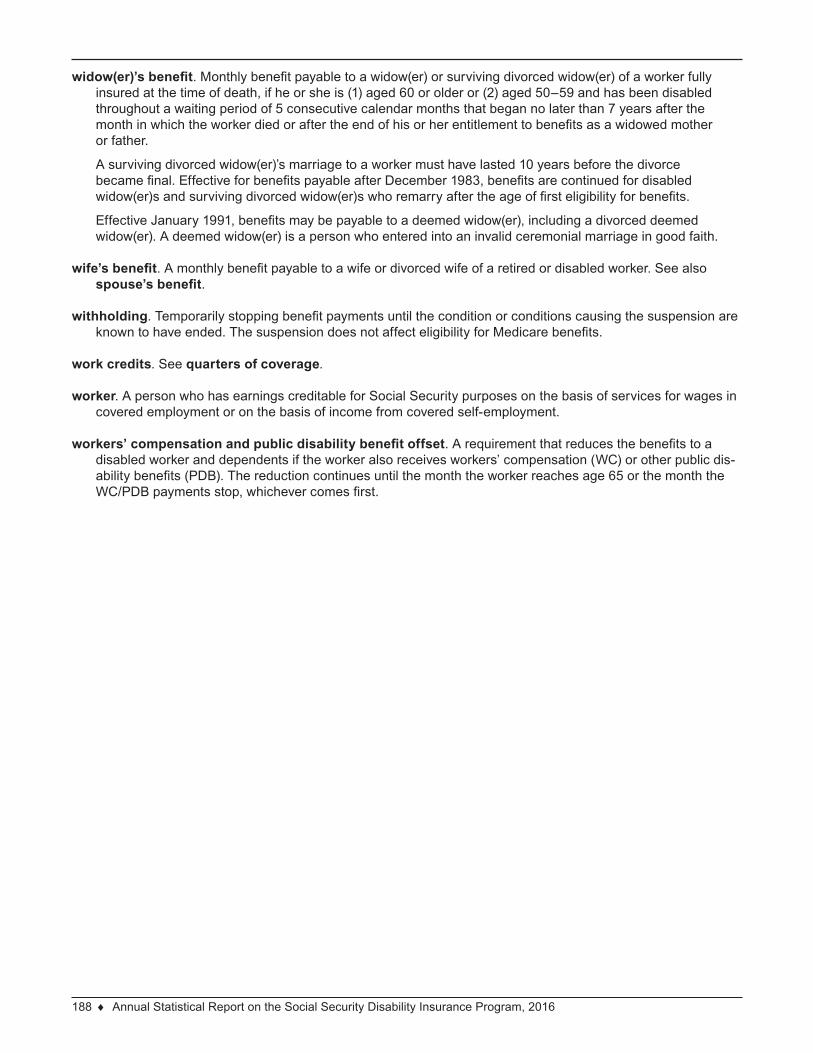
188 ♦ Annual Statistical Report on the Social Security Disability Insurance Program, 2016
widow(er)’s benefit. Monthly benefit payable to a widow(er) or surviving divorced widow(er) of a worker fully insured at the time of death, if he or she is (1) aged 60 or older or (2) aged 50–59 and has been disabled throughout a waiting period of 5 consecutive calendar months that began no later than 7 years after the month in which the worker died or after the end of his or her entitlement to benefits as a widowed mother or father.
A surviving divorced widow(er)’s marriage to a worker must have lasted 10 years before the divorce became final. Effective for benefits payable after December 1983, benefits are continued for disabled widow(er)s and surviving divorced widow(er)s who remarry after the age of first eligibility for benefits.
Effective January 1991, benefits may be payable to a deemed widow(er), including a divorced deemed widow(er). A deemed widow(er) is a person who entered into an invalid ceremonial marriage in good faith.
wife’s benefit. A monthly benefit payable to a wife or divorced wife of a retired or disabled worker. See also spouse’s benefit.
withholding. Temporarily stopping benefit payments until the condition or conditions causing the suspension are known to have ended. The suspension does not affect eligibility for Medicare benefits.
work credits. See quarters of coverage.
worker. A person who has earnings creditable for Social Security purposes on the basis of services for wages in covered employment or on the basis of income from covered self-employment.
workers’ compensation and public disability benefit offset. A requirement that reduces the benefits to a disabled worker and dependents if the worker also receives workers’ compensation (WC) or other public dis-ability benefits (PDB). The reduction continues until the month the worker reaches age 65 or the month the WC/PDB payments stop, whichever comes first.