Social profitability of combustion technology in poultry ...
92
Social profitability of combustion technology in poultry manure management – A cost-benefit analysis of co-combustion of poultry manure and natural gas in the Leningrad region, Russia Master’s Thesis Ville Laasonen Environmental Economics Department of Economics and Management University of Helsinki February 2014
Transcript of Social profitability of combustion technology in poultry ...

Social profitability of combustion technology in poultry manure
management –
A cost-benefit analysis of co-combustion of poultry manure and
natural gas in the Leningrad region, Russia
Master’s Thesis
Ville Laasonen
Environmental Economics
Department of Economics and
Management
University of Helsinki
February 2014

Faculty
Faculty of Agriculture and Forestry
Department
Department of Economics and Management
Author
Ville Tuomas Laasonen
Title
Social profitability of combustion technology in poultry manure management - Cost-benefit
analysis from co-combustion of poultry manure and natural gas in the Leningrad region, Russia
Subject
Environmental Economics
Level
Master’s Thesis
Month and year
February 2014
Number of pages
89
Abstract
The objective of this thesis was to study the social profitability of combustion technology in
poultry manure management in the Leningrad region, Russia. The method was environmental
cost-benefit analysis (ECBA), in which two combustion power plant scenarios and a reference
scenario were considered. All scenarios would treat 94000 tons of manure annually over a
project lifetime of 12 years. Scenario 1 (S1) is a combustion power plant that produces only
thermal energy and scenario 2 (S2) is a combustion power plant that produces combined heat and
power (CHP). Scenario 0 (S0) is a reference point to the power production scenarios and it
assumes that the poultry manure would be disposed untreated by stockpiling or to lagoons,
causing nutrient leaching to the surface waters. The final objective of the ECBA was to find out
if the scenarios are socially profitable and which one is preferable.
The ECBA showed that from the viewpoint of a private producer or investor and under the
current market conditions and policy environment, the power plant scenarios were not profitable.
However, when environmental benefits of the power plant scenarios were added to the
calculations, both scenarios were found to be socially profitable. The social net present values
(NPV) of S1 and S2 were EUR 21,2 million and EUR 8,2 million respectively. The reference
scenario (S0) led to significant social costs, causing EUR 27,6 million losses to society over the
scenarios lifetime. Thus according to the NPV criteria, S1 should be carried out, because it
showed the highest NPV. For S0 and S1, the results held constant under all sensitivities, but for
S2 several critical parameters were found, from which investment cost was the most significant.
Implementation of economic policy instruments would improve the profitability of the scenarios
and it would be beneficial to all parties that the main environmental impacts concern (e.g.
Sweden and Finland). The nutrient load reduction benefits were the crucial factor that made the
power plant scenarios socially profitable. The climate benefits from manure FBC were also
significant although moderate if compared to the eutrophication benefits. If the future focus of
policies is to reduce the nutrient loads from poultry manure in the Leningrad region, poultry
manure combustion with FBC technology could be an effective way to meet that goal.
Keywords
Eutrophication of Baltic Sea, poultry manure, renewable energy, environmental cost-benefit
analysis, fluidized bed combustion (FBC)
Where deposited
Viikin kampuskirjasto, Viikinkaari 11 A (PL 62), 00014 Helsingin yliopisto

Tiedekunta
Maatalous-metsätieteellinen tiedekunta
Laitos
Taloustieteen laitos
Tekijä
Ville Tuomas Laasonen
Työn nimi
Social profitability of combustion technology in poultry manure management - Cost-benefit
analysis from co-combustion of poultry manure and natural gas in the Leningrad region, Russia
Oppiaine
Ympäristöekonomia
Työn laji
Pro Gradu tutkielma
Aika
Helmikuu 2014
Sivumäärä
89
Tiivistelmä
Tutkielman tarkoituksena oli tutkia kananlannan polton yhteiskunnallista kannattavuutta
Leningradin alueella, Venäjällä. Tutkielman menetelmänä oli kustannus-hyötyanalyysi, jonka
avulla arvioitiin kahta eri hypoteettista voimalahankevaihtoehtoa sekä referenssivaihtoehtoa, jotka
käsittelisivät vuosittain 94 000 tonnia kananlantaa kahdentoista vuoden ajan. Polttamalla yhdessä
kananlantaa ja maakaasua voimalahankevaihtoehto S1 tuottaisi vain lämpöenergiaa, ja
voimalahankevaihtoehto S2 tuottaisi sekä lämpöenergiaa että sähköä. Lisäksi tarkasteltiin
referenssitapausta (S0), jossa että kananlanta sijoitettaisiin nykyisellä tavalla suuriin lantakasoihin
tai laguuneihin, joista aiheutuu ravinteiden huuhtoutumista vesistöihin. Tutkielman lopullinen
tavoite oli selvittää, ottamalla huomioon ravinnepäästöt ja ilmastohyödyt, ovatko käsitellyt
hankevaihtoehdot yhteiskunnallisesti kannattavia ja mikä niistä paras vaihtoehto.
Kustannus-hyötyanalyysi osoitti, että nykyisissä markkinaolosuhteissa yksityisen tuottajan tai
sijoittajan kannalta voimalahankevaihtoehdot (S1 ja S2) eivät olleet kannattavia. Kuitenkin, kun
hankevaihtoehtojen tärkeimmät ympäristövaikutukset lisättiin laskelmiin rahamääräisenä,
molemmat voimalahankevaihtoehdot osoittautuivat yhteiskunnallisesti kannattaviksi.
Hankevaihtoehto S1:n yhteiskunnallinen nettonykyarvo (NPV) oli S1 21,2 miljoonaa euroa ja
S2:n 8,2 miljoonaa euroa. Referenssivaihtoehdon (S0) todettiin johtavan merkittäviin
yhteiskunnallisiin kustannuksiin. Kustannus-hyötyanalyysin tulosten perusteella parhaaksi
hankevaihtoehdoksi osoittautui siis S1, koska sillä oli korkein nettonykyarvo (NPV).
Herkkyysanalyysissa ei löytynyt kriittisiä parametreja S0:lle ja S1:lle, mutta S2:n tapauksessa
niitä oli useita, joista merkittävin oli investointikustannus.
Taloudelliset kannustimet voisivat parantaa voimalahankevaihtoehtojen kannattavuutta selvästi ja
niiden käyttöön ottaminen olisi hyödyllistä kaikille osapuolille, joita vaihtoehtojen
ympäristövaikutukset koskettavat (esim. Ruotsi ja Suomi). Kananlannan polttoon liittyvä
ravinnepäästöjen väheneminen oli ratkaiseva tekijä, joka teki voimalahankevaihtoehdoista
yhteiskunnallisesti kannattavia. Ilmastohyödyt olivat myös merkittäviä, mutta vain kohtalaisia
verrattuna ravinnepäästöjen vähenemisestä johtuviin hyötyihin. Jos tulevaisuudessa politiikan
tavoitteena on vähentää kananlannasta aiheutuvia ravinnepäästöjä Leningradin alueella, niin
kananlannan polttaminen leijupolttotekniikalla voisi olla yksi toimiva tapa, jolla tämä tavoite
voidaan saavuttaa.
Avainsana
Itämeren rehevöityminen, kananlanta, uusiutuva energia, kustannus-hyötyanalyysi,
leijupolttoteknologia Säilytyspaikka
Viikin kampuskirjasto, Viikinkaari 11 A (PL 62), 00014 Helsingin yliopisto

1
Table of contents
1 Introduction ........................................................................................................... 4
1.1 Eutrophication of the Baltic Sea and Russia ............................................................ 4
1.2 Purpose and objectives of the study ....................................................................... 6
1.3 Structure .................................................................................................................. 9
2 Poultry production in the Leningrad region and environmental impacts ............... 11
2.1 Poultry production in the Leningrad region .......................................................... 11
2.2 Nutrient cycles in the Leningrad region ................................................................ 12
2.3 Priority farms and current management practices ............................................... 14
2.4 Nutrient runoff from priority farms ...................................................................... 18
2.5 Other environmental impacts of current poultry manure management practices in the Leningrad area ................................................................................................... 20
3 Technological alternatives for poultry manure management: Fluidized bed
combustion (FBC) ................................................................................................... 22
3.1 Properties and composition of poultry manure .................................................... 23
3.2 Co-combustion of poultry manure with natural gas ............................................. 27
3.3 Fluidized bed combustion (FBC) ............................................................................ 28
3.4 End-products of combustion ................................................................................. 30
4 Life cycle of poultry manure combustion and environmental effects..................... 33
4.1 Reference scenario (S0) ......................................................................................... 33
4.2 Power plant scenarios (S1, S2) .............................................................................. 35
4.3 Environmental damage and marginal cost estimates ........................................... 39
5 Theory and method ............................................................................................. 41
5.1 CBA ........................................................................................................................ 41
5.3 Discounting of cost and benefit flows ................................................................... 43
5.4 Discount rate ......................................................................................................... 44
5.5 Costs and benefits ................................................................................................. 46
5.5.1 Investment costs ............................................................................................. 46
5.5.2 Annual costs .................................................................................................... 47
5.5.3 Annual market revenues................................................................................. 47
5.5.4 Annual environmental benefits ...................................................................... 48
5.6 Net Present Value (NPV) ....................................................................................... 49
5.6 Sensitivity analysis ................................................................................................. 50
2
6 ECBA from co-combustion of poultry manure with natural gas ............................. 51
6.1 Description of the scenarios .................................................................................. 51
6.2 Input and output prices ......................................................................................... 54
6.3 Results ................................................................................................................... 58
6.3.1 Investment costs ............................................................................................. 58
6.3.2 Annual costs .................................................................................................... 60
6.3.3 Annual market revenues................................................................................. 61
6.3.4 Annual environmental benefits ...................................................................... 62
6.3.5 Total annual costs and benefits ...................................................................... 65
6.3.6 NPVs ................................................................................................................ 66
6.4 Sensitivity analysis ................................................................................................. 67
7 Conclusions and discussion .................................................................................. 72
References ............................................................................................................. 76
Appendices ............................................................................................................. 88
Appendix 1. Calculation method of nutrient concentration of manure. .................... 88
Appendix 2. Partial sensitivity analysis: Parameters, value changes and corresponding social NPV of S0. .................................................................................. 89

3
Acronyms
BP Business plan
BSAP Baltic Sea Action Plan
C Carbon
CH4 Methane
CO2 Carbon dioxide
CO2 –eq. Carbon dioxide equivalent
CBA Cost-benefit analysis
EC European Commission
EUA EU emission allowance
FBC Fluidized bed combustion
HELCOM Helsinki Commission – Baltic Marine Environment Protection Commission
H2S Hydrogen sulfide
K Potassium
KCl Potassium chloride
KO2 Potassium superoxide
LHV Lower heating value
NEFCO Nordic Environmental Finance Corporation
N Nitrogen
NH3 Ammonia
N2O Nitrous oxide
NO3 Nitrate
NPV Net present value
P Phosphorus
SCC Social cost of carbon
TCC Thermochemical conversion
Units
tC Per metric ton of carbon
% wt. Weight percent
MJ Megajoule
MWh Megawatt hour
TJ Terajoule
4
1 Introduction
Nutrient loads to the Baltic Sea have been a “hot potato” in the news in recent years,
and a great deal of effort has been devoted by the Baltic Sea coastal countries to
reduce the nutrient emissions. A particular concern has been the nutrient loads caused
by the extensive animal farming in the Leningrad region. I will investigate the
profitability of combustion technology as a solution for poultry manure management
in the Leningrad region by conducting a cost-benefit analysis (CBA) of two poultry
manure combustion scenarios, in order to find out if they are profitable. Ultimately,
the goal is to search for options to reduce the nutrient loading to the Baltic Sea and
promote the utilization of manure as a renewable energy source.
1.1 Eutrophication of the Baltic Sea and Russia
Eutrophication might be the greatest single threat that the Baltic Sea is facing, and it is
starting to be a major problem in both coastal and open sea areas (HELCOM 2009, 3).
According to Wulff, Stigebrandt and Rahm (1990, 126), the Baltic Sea is particularly
vulnerable to eutrophication because the nutrient resilience of the sea is low due to
the physical qualities of the sea. The connection to larger ocean is very narrow and it
causes the water in the sea to change slowly. The catchment area is also relatively
large compared to the volume of the sea and approximately 80 million people live in
the catchment area, which causes a high anthropogenic stress to the Baltic Sea
(Bonsdorff, Rönnberg and Aarnio 2002, 373).
The eutrophication is caused by enrichment of nutrients, particularly phosphorus (P)
and nitrogen (N) that flow from land sources in the catchment area of the Baltic Sea
and from atmospheric deposition. Internal loads are also significant, but the main
source of nutrients is waterborne inputs (HELCOM 2009, 77). When excess amounts of
nutrients are present in the Baltic Sea, it leads to a vicious cycle of increased
phytoplankton growth and high levels of organic matter, sinking of the plankton
biomass to the bottom, lack of oxygen in the sea bottom, and to the release of even
more nutrients from the oxygenless seafloor (Vahtera et al. 2007, 1). Because

5
enrichment of nutrients causes rapid increase in the microscopic phytoplankton and
massive algae blooms become more frequent, the water of the Baltic Sea becomes less
transparent (HELCOM 2009, 14). High production of algae and development of huge
blooms of toxic cyanobacteria ultimately cause changes in the balance of the whole
ecosystem, different species thriving in the new balance with more biomass (HELCOM
2011b, 11). Even though the total amount of fish in the sea can increase because of the
eutrophication, the new ecosystem balance usually means degradation of the
commercially valuable fish stocks and other commercial activities.
As can be seen from Figure 1.1, Russia is among the largest polluters and sources of
waterborne loads of N and P to the Baltic Sea. In 2006 the total amount of phosphorus
(P) and nitrogen (N) from Russia was 4,070 tons and 107,600 tons respectively
(HELCOM 2011b, 31). Poland is by far the biggest polluter in both P and N, and alone it
contributes 34% of the total P load to the Baltic Sea. However, Russia is a good second
with 19 % share in the total load of P. Russia is also the third biggest polluter in N loads
with the share of 14 %. According to HELCOM (2011a, 79), some uncertainty about the
nutrients loads from Russia exists and acquiring a complete picture of the nutrient
loading from Russia has been a challenge.
Figure 1.1. The average annual proportions of total nitrogen (left diagram) and
phosphorus (right diagram) inputs to the Baltic Sea by HELCOM countries in the
period of 2001–2006. Modified from HELCOM 2009, 77.
3% 5%
8% 5%
10%
11%
17%
14%
27%
Total N
Germany
Estonia
Denmark
Lithuania
Latvia
Finland
Sweden
Russia
2% 4%
5%
7%
8%
10%
11% 19%
34%
Total P
Germany
Estonia
Denmark
Lithuania
Latvia
Finland
Sweden
Russia
6
According to studies by HELCOM (e.g. 2010a), the poultry farms in the Leningrad
region might cause a significant share of Russia’s nutrient inputs to the Baltic Sea,
because of inadequate manure management practices. At the moment, the current
management practices in some priority farms lead to considerable nutrient leaching to
the Baltic Sea (HELCOM 2010b, 13). In some priority farms, close to 6 % of the
nutrients in the produced manure is leached to the surface waters, causing significant
environmental effects (Knuuttila statement 9.9.2012). The current poultry manure
management practices in the Leningrad region are examined in more detail in chapter
2. With the term poultry manure, I refer generally to all excreta and litter from poultry
production.
Using renewable energy sources, such as poultry manure, is an important way of
reducing GHG emissions and thus slowing down global warming. Some of the
solutions for manure management, for example combustion technology, can utilize the
manure as a renewable energy source, therefore bringing potentially significant GHG
reductions. At the moment it is considered by some scholars that biomass co-
combustion is one of the most efficient, least expensive and lowest risk options
available in the world for producing renewable energy (Khan, Johng, Jansens and
Spliethoff 2009, 45).
1.2 Purpose and objectives of the study
The purpose of this master’s thesis is to study the social profitability of combustion
technology as an alternative for poultry manure handling in the Leningrad region. The
goal is to give a new more holistic view of the manure problem in the Leningrad region
by including the main environmental impacts of the poultry manure management
solutions into the decision making process. This way the investment decision making
process can be extended from only the private viewpoint to include social costs and
benefits.
Preliminary financial investment studies from poultry manure handling have been
made in the Leningrad region, but mainly from the point of view of private economic
7
profitability (e.g. Ramboll 2009). The environmental impacts have not yet been
included in the analysis in monetary terms. The previous studies from combustion
technology have not been able to show clear financial profitability (HELCOM 2011c,
PÖYRYa 2011, Ramboll 2009). My emphasis will be on the environmental impacts of
the studied scenarios, particularly on the nutrient load reductions to the Baltic Sea and
GHG emission reductions, and their monetary value. By incorporating the key
nonmarket benefits in the profitability calculations, a cost-benefit analysis (CBA)
calculation can be formed.
Manure combustion technology has received academic and commercial interest in the
past and it is a proven technology for manure handling (Abelha et al. 2003, Zhu and
Lee 2005, Lynch et al. 2013, Font-Palma 2012, 95, Khan 2009, 30). Combustion
technology was chosen as the alternative for the poultry manure management, first of
all, because it has a very good potential to reduce some of the environmental effects
that the current management practices are causing, most of all nutrient leaching.
Particularly, fluidized bed combustion (FBC) technology was chosen because it can
avoid some of the operation problems that are often related to manure combustion
(Khan et al. 2009, 31). FBC is capable of reducing the volume of the poultry manure to
10 % of original mass, transforming the phosphorus (P) and potassium (K) in the
manure into a concentrated and dry form (Abelha et al. 2003, 688&691, Lynch 2013,
203). However, all nitrogen (N) is lost during combustion and the ash from combustion
contains only minimal amounts of N. A more detailed explanation of FBC technology
can be found in chapter 3. The technical data and economic costs of the power plant
scenarios are obtained from an investment study made by Ramboll (2009).
The method of this thesis is cost-benefit analysis (CBA), or more specifically
environmental cost-benefit analysis (ECBA). According to Boardman, Greenberg, Vining
and Weimer (2006, 7-17), CBA is a well-defined systematic economic analysis of a
project or a policy. Its purpose is to calculate and compare the different costs and
benefits related to a certain project in a structured way, so that the feasibility of the
project can be determined. CBA is a good tool for determining socially sound
investment decisions and comparing different alternatives to each other. ECBA means
8
social evaluation of a project or a policy that causes significant environmental impacts
(Kuosmanen and Kortelainen 2007, 57). ECBA is nowadays the standard approach in
many countries, such as the USA and EU, to public projects that cause significant
economic and environmental effects (Pearce et al. 2006, 36-37). By applying the ECBA
method, I can provide necessary information for the public planners and private
investors to make socially correct and efficient investment decisions. The data is based
on common practices of ECBA method, scientific papers, official reports by HELCOM
and data provided to NEFCO by suppliers of poultry manure combustion plants.
In the ECBA, I will consider two hypothetical investment scenarios for a poultry manure
combustion power plant using FBC technology. Both scenarios co-combust poultry
manure with natural gas and thus produce energy for a nearby poultry farm and
residence area. Natural gas is needed as a support fuel to keep the combustion process
going because I assume that the poultry manure is mostly undried. The scenarios
considered in the ECBA are the following and later referred to as:
Scenario 1 (S1) consists of a combustion power plant which co-combusts poultry
manure and natural gas producing thermal energy.
Scenario 2 (S2) consists of a combustion power plant which co-combusts poultry
manure and natural gas producing combined heat and power (CHP).
Also a status quo scenario (S0), in which no power plants are built, is established to
serve as a reference point to the power production scenarios. S0 assumes the current
situation of poultry manure management on a marginal priority farm in the Leningrad
region, which causes significant nutrient leaching to the surface waters (5,63 % of
produced P and 5,69 % of produced N). S0 also assumes that all the energy needed in
the nearby poultry farm and residential area is bought from the market.
The final objective is to find out which alternative is socially the most profitable to
carry out, and at the same time to see if the reference scenario leads to welfare losses
in society level. When the environmental benefits are added to the private revenues,
some scenarios of the case study might turn out to be more profitable than only the

9
private economic profitability suggests. The precise financial model of the investment
scenarios will not be discussed within the scope of this thesis.
1.3 Structure
In chapter 2, I will examine the Leningrad region poultry industry’s current manure
management practices and the environmental impacts of these practices with the
focus on nutrient emissions. This is necessary in order to form a reference scenario
(S0) for the case study, which assumes the poultry manure management practices on a
marginal farm in the Leningrad region.
In chapter 3, I will shortly describe the alternative technical processes for poultry
manure management and the properties of the poultry manure. The focus of the
chapter is on co-combustion of poultry manure with natural gas using FBC technology.
This chapter will serve as a basis and background information for the power plant
scenarios (S1 and S2) of the case study.
In chapter 4, I will determine the life cycle chains for the scenarios and define the
limits of this study and the most significant environmental impacts that will be taken
into account. I will also give the principles for the calculation of the environmental
impacts in monetary terms.
In chapter 5, I am going to explain the principles of environmental cost-benefit analysis
(ECBA), which was chosen as the method of analyzing, because of its advantages in
assessing the social profitability of projects and policies, and comparing different
solutions.
Chapter 6 is the actual ECBA that examines the profitability of two different poultry
manure combustion scenarios: thermal production and combined heat and power
production (CHP). The environmental benefits will be added to the private costs and
revenues of the scenarios to find out the social desirability of the alternatives. The risks
and uncertainties involving the manure handling scenarios are taken into account by
providing a partial sensitivity analysis.

10
In the last chapter, I will draw conclusions from the investigated case study and discuss
further the viability of the considered manure handling alternatives. I will also suggest
some further research topics.

11
2 Poultry production in the Leningrad region and
environmental impacts
On a global scale, the intensification of farming and the growing amounts of generated
manure along with inappropriate manure management have significantly influenced
the emergence of environmental problems (Prapaspongsa, Christensen, Schmidt and
Thrane 2010, 1413). This exact development has also been the case in the Leningrad
region, where the situation in some places could be described in western standards as
a local environmental crisis. At the moment there seems to be a potentially significant
nutrient leakage and other environmental hindrances from the poultry production in
the Leningrad region, making the manure problem of the poultry farms a very topical
issue. Poultry industry’s environmental impacts and their quantity have to be well
defined in order to accurately calculate the monetary value of their reductions in the
ECBA.
2.1 Poultry production in the Leningrad region
According to HELCOM (2011d, 34), there is a major agricultural and livestock
production sector in the Leningrad region and it has been growing rapidly in the recent
years. As stated by the Federal Statistical Service of Russia, there was altogether 22
947 000 heads of poultry, 274 000 heads of pigs, 489 000 heads of cattle and 157 000
sheep/goats in the Leningrad region in 2009 (FSSR 2009). The amounts of livestock in
the Leningrad region and in Finland are gathered to the figure 2.1. The Leningrad
region became the biggest egg production region in Russia after the year 2000, as it
produced 8,5 % of the total egg production in the Russian Federation. It is also the
third largest poultry meat producing region, with the share of 5,5 % of the total
production in the Russian Federation.

12
Figure 2.1 Number of livestock in Leningrad region and Finland in millions (FSSR
2009, Matilda 2010).
According to HELCOM (2011c, 13), the production does not show any signs of slowing
down, on the contrary, it seems to grow every year and the total amount of chicken in
the region is increasing. Especially the biggest producers that own the largest share of
the entire production are planning to increase their capacity and are making significant
investments to expand production. Increasing the production is also the goal of the
agricultural policies in the region (USDA 2010, 2). The profitability of the poultry
industry in the Leningrad Region has been on average sound, the turnover being
approximately 20 % and for the biggest producers up to 30 % (HELCOM 2011c, 6).
During three years from 2007-2009, the profit from poultry meat production increased
by 9,2 % and egg production by 28,9 % HELCOM (2011d, 36). The rapid development of
the animal farming industry has created a new origin of point source nutrient
emissions to the Baltic Sea. The poultry industry in the Leningrad region might be
financially successful, but it still faces serious and complex environmental problems
that must be solved (HELCOM 2011a, 14).
2.2 Nutrient cycles in the Leningrad region
Since the invention of artificial fertilizers, the traditional nutrient cycle in agriculture
has been broken. The spatial distribution of farming systems has changed radically in
the past and the farming systems have become fragmented due to the separation of
0 5 10 15 20 25
Poultry
Pigs
Cattle
Millions
Finland
Leningradregion
13
grain and livestock production (Sharpley 2013, 95). The cycles of nutrients are no
longer closed systems, making the nutrient distribution between different ecosystems
unbalanced. The separation of grain and livestock production is a problem especially in
the Leningrad region (Leningradskaja oblast), which is situated entirely in the
catchment of the Baltic Sea (HELCOM 2010a, 14).
It is clear that the actual amounts of produced manure and nutrients in the Leningrad
region are huge, hence causing potentially a high risk of nutrient leakage from the
sector. However, it seems that there is some dispersion in the estimates of the
produced nutrients by poultry farming in the region, because there are no
systematically collected data about the amounts of produced manure in individual
poultry farms. HELCOM (2010a) reported that the manure created per year by the
animal farming industry in the Leningrad and Kaliningrad regions, contained
approximately 9600 tons of P. In comparison, the nutrient load from the whole of
Finland to the Baltic Sea in the year 2006 was 3490 tons of phosphorus and 78 900
tons of nitrogen (HELCOM 2011b, 31). HELCOM (2010a) came to the conclusion that
animal farming creates the biggest nutrient pool in the Leningrad region and produces
serious risk of nutrient leakage into the ground and surface waters and therefore
contributes to the eutrophication of the Baltic Sea. However, because of the high
volumes of manure produced and relatively concentrated production, there might be
promising business opportunities in manure handling and possibilities for cost-
effective nutrient emission reductions.
PÖYRY (2011a, 9) gave a rough estimate of the amount of manure created by the
poultry farming industry in the Leningrad region in a year (600 000- 1 000 000 t/a),
which would contain more than 5 000 tons of phosphorus and 20 000 tons of nitrogen.
However, the most accurate nutrient amount estimate would be based on 22 947 000
chickens (FSSR 2009) and nutrient excretion of Russian animals (HELCOM 2010a, 20).
Therefore, calculated with the Russian averages, the poultry industry in the Leningrad
region would produce 5737 tons of phosphorus and 23 406 tons of nitrogen. The
recommendation of the Finnish Ministry of Environment for animal places in a farm
per hectare of cultivated land is around 100 animals per hectare (Ympäristöhallinnon
14
ohjeita 1/2010). Translated to the Leningrad region poultry production rates, it would
mean that 229 470 hectares of cultivated land area would be needed to absorb the
amount of nutrients created by poultry in the region. However, the total forage crops
area in Leningrad region is approximately 194 000 hectares (PÖYRY 2011a, 10).
According to studies by HELCOM (2010a, 50) and PÖYRY (2011a, 13) the total
production of manure in the Leningrad region exceeds the need for fertilizing the
arable land in the area. The manure cannot be spread out to nearby fields because of
the limited availability of arable land in the region compared to the volumes of the
manure produced. Especially poultry farms are separated from crop production and
they own very little or no field resources at all. According to Sims et al. (2000, 60), the
typical nutrient ratio of P and N in poultry manure is different compared to the ratio of
how plants use the nutrients. Therefore there is a risk that if poultry manure is spread
on agricultural land based on the needed nitrogen rates, excessive amounts of
phosphorus will be applied at the same time. The phosphorus might thus accumulate
into the soil, leading to increased leaching of phosphorus and nutrient run-off to the
surface waters.
Local fodder production is minor and the imported fodder has increased the amount of
nutrients in the nutrient cycle of the region. It has been proven that the poultry
production relies heavily on nutrient flows outside the region, and there is a
substantial nutrient surplus in the Leningrad area (HELCOM 2010a, 50, PÖYRY 2011a,
13). The problem is that if the created manure is not handled properly and utilized in
the region, the nutrients of the manure will cumulate and pose a serious threat to the
environment, both on local and regional scale, and thus causing considerable nutrient
emissions to the Baltic Sea (HELCOM 2010a).
2.3 Priority farms and current management practices
HELCOM Projects (PRIMER, BALTHAZAR) have investigated the potential nutrient
loading of animal farming in the Leningrad region (HELCOM 2010a, 2010b). They
encountered difficulties in getting information about the nutrient leakage from
Leningrad region to the Baltic Sea. Although reliable risk assessment is hard because of
15
lack of information, HELCOM (2010a) managed to identify and locate the “hotspots” or
priority farms that compose the biggest risk of nutrient leaking and should be first on
the agenda. In this context, “hot spots” mean places that impose the highest risk to the
marine ecosystem of the Baltic Sea region.
According to HELCOM (2010a, 30), there were 16 large poultry farms and 9 pig farms in
the region in 2008 with approximately 20 million chickens and 157 000 pigs
respectively. Five of the poultry farms contributed the most, having together some two
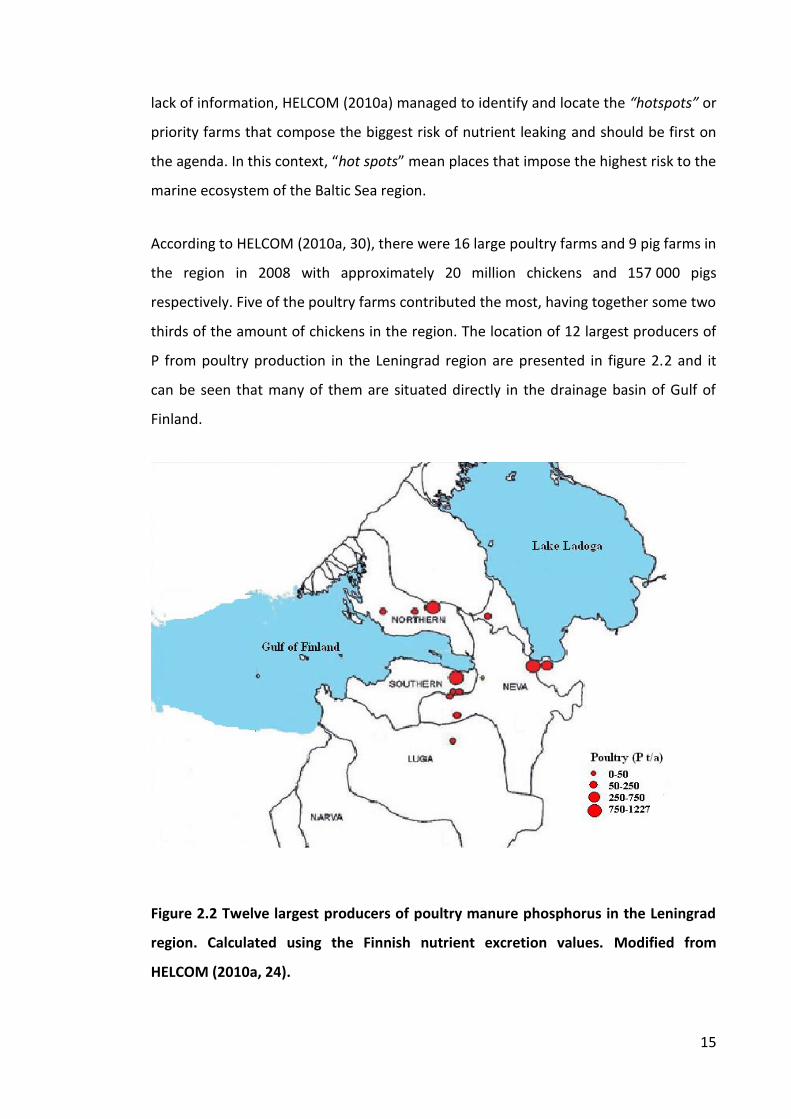
thirds of the amount of chickens in the region. The location of 12 largest producers of
P from poultry production in the Leningrad region are presented in figure 2.2 and it
can be seen that many of them are situated directly in the drainage basin of Gulf of
Finland.
Figure 2.2 Twelve largest producers of poultry manure phosphorus in the Leningrad
region. Calculated using the Finnish nutrient excretion values. Modified from
HELCOM (2010a, 24).
16
An important factor influencing the risk from a particular poultry factory or farm is the
amount of nutrients the produced manure contains. The amount of nutrients depends
on many things, such as the shares of egg-laying and broiler chickens. To make more
accurate predictions, information on the annual animal inventory, average number of
days each animal is kept in the facility, water content of the manure and the number
of animals produced is needed. Unfortunately in the Leningrad area this information is
usually not available, and estimates of the nutrient amounts have to be used (HELCOM
2010a, 33).
HELCOM Balthazar project gathered information about the manure management
practices of the animal farms. The project found out that the large poultry factories
had the highest nutrient leakage risk from the animal farms in the Leningrad region.
The manure handling practices of the poultry factories differed from other production
lines, such as cattle farming. At the moment the manure management in the majority
of the largest farms is not done in a sustainable way, and the manure management
does not follow the modern standards of agricultural practices (HELCOM 2010a, 50).
Table 2.1 lists the 12 largest poultry farms and some variables concerning their
nutrient leakage risk. The risk class of all the farms in table 2.1 is considered to be high.
As can be seen from table 2.1, the manure handling in poultry farms is done mostly by
stockpiling, which means piling the manure to open field storages and lagoons.
Stockpiling seems to become gradually the standard practice and a habit in the region.
According to HELCOM (2010b, 14), the condition of the manure storages is often not
satisfactory, and they are in most cases only unsafe open heaps and pits exposed to
the weather and rain. There seems to be a lack of appropriate storages and technology
even in Russian standards. HELCOM researchers found serious problems in the
following farms: PF Sinyavinskaya PF Roskar PF Udarnik, PF, PF Nevskaya JSC Rurik
Agro, Lomonosovskaya and OAO Rassvet (HELCOM 2010b, 13). The nutrient leakage
from the manure storages of these farms, were undeniable and visible, and the risk of
contamination of the groundwater is obvious.

17
Table 2.1. The largest phosphorus (P) producing farms in the Leningrad region.
Modified from HELCOM (2010a, 30).
Retention = Probability of nutrient inflow to the Baltic Sea in the Leningrad region: high
(H), medium (M) and low (L). Distance = Manure treatment place distance to closest
water way. Priority = nutrient transport risk: low (x), average (xx), high (xxx).
# Name of the farm Phosphorus production (t/y)
Retention (H, M, L)
Distance (m)
Manure treatment method
Main product
Priority
1 PF Lomonosovskaya
1227 H Composting, Meat xxx
Manure storage <100 stockpiling 2 PF Severnaya 1188 M Stockpiling Meat xxx Manure storage > 1 000 3 PF Roskar 853 H Land
spreading, Eggs xxx
Manure storage 10 Granulation, stockpiling
4 PF Sinyavinskaya 563 M Stockpiling Eggs xxx Manure storage 1 000 5 PF Russko-
Vysotskaya 249 H Composting Meat xx
Manure storage 500 6 PF Voyskovitsy 215 H 2 000 Stockpiling Meat xx Manure storage 7 PF
Lenoblptitseprom 203 H Stockpiling Eggs x
Manure storage 2 000 8 PF Primorskaya 181 H Storage in
lagoons, Eggs xx
Manure storage 10 stockpiling 9 PF Nevskaya 164 M Stockpiling Eggs,
meat xxx
Manure storage 10 10 PF Udarnik 160 H Stockpiling,
composting Eggs, meat
xxx
Manure storage 200 11 Agrocompleks
Oredezh 147 H 500 Composting Eggs xxx
Manure storage 12 PF Lagolovo 98 H Composting Eggs xxx Manure storage no data

18
As can be seen from Table 2.1, the biggest farms have a large share of the P created in
the Leningrad region. Together the twelve largest producers create 5248 tons of
phosphorus, calculated with the Russian nutrient excretion values for P.
2.4 Nutrient runoff from priority farms
Even though HELCOM (2010b, 14) states that in general the nutrient leaching from the
animal producing sector in the region into the Gulf of Finland was only moderate,
there is still a high risk of potential nutrient loading to the Baltic Sea from the high
priority farms. HELCOM (2010b, 14) also concluded that more research is needed for
reliable quantification of nutrient leakage from the large poultry farms. The key
importance should be on the constant monitoring of the highest threats.
I am going to use the most recent available scientific information about the nutrient
emission and discharges from the current situation of the poultry manure handling,
and expert opinion from Mr. Seppo Knuuttila, who is an expert researcher in
assessment of pollution loads into the Baltic Sea in Finnish Environment Institute
(SYKE). According to a recent study made by SYKE and the expert opinion, the nutrient
loading from current practices of manure management might not be as radical as has
been suggested in the media (HS 14.6.2012) in recent years, and as the NEFCO Report
(2010) assumes (50%). The HELCOM (2010b, 9) study tried to measure the average
nutrient leakage from the manure produced in ten priority farms, and it suggests that
leakage might be only around 1 % or 2% of the nutrients the manure contains.
Although the leakage from some of the farms was less than the average (Roskar) and
in control, there were some farms (Udarnik) where the leakages were obvious and
considerably higher, and even close to 6 % nutrient leakages were measured (see table
2.2). Almost all of the leached nutrients were in soluble form, and directly available for
plants.
19
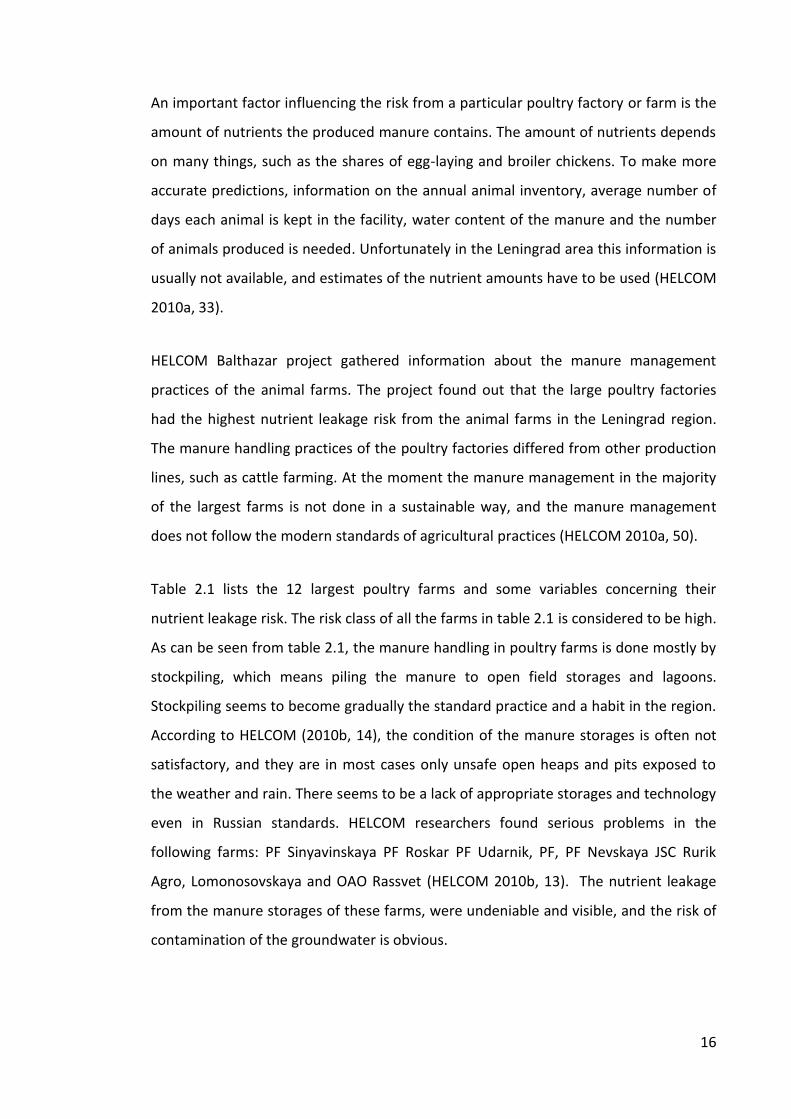
Table 2.2. Nutrient run-off from example farms (Knuuttila statement 9.9.2012).
Annually produced nutrient amount (ton)
Leached amount (ton)
Nutrient run-off from production
PF Udarnik, P 160 9 5,63 %
PF Udarnik, N 580 33 5,69 %
PF Roskar, P 850 2 0,0024 %
PF Roskar, N 3070 12 0,0039 %
The measurements made by Mr. Knuuttila, SYKE considered the nutrient leakages from
annual manure production of the farms to the surface waters and to the nearby rivers.
This kind of calculation can give an overestimate from the nutrient leakage percent of
the produced manure because it does not take into account the existing manure heaps
and storages that are accumulated to the area during many years that also might
contribute to the nutrient run-off.
Although the study might have overestimated the nutrient emissions on the account
described above, it could underestimated them on other accounts because the study
did not consider the emissions from the manure to the ground water and ammonia
(NH3) emissions to air. These pathways of effect can be considerable and may lead to
underestimation of the total nutrient emissions. Because of some bias to opposite
directions in the study of Mr. Knuuttila, the results can be considered reliable enough
for the use of this thesis. Mr. Knuuttila also suggested that the nutrient run-off to the
surface and ground waters from the farms might be even bigger if the manure would
be spread in excess amounts to the nearby fields. In the current operating
environment, the ordinary custom of stockpiling manure into large heaps might be
better in the point of view of the environment, than forcibly try to spread the manure
to fields that already have enough nutrients. In the future, climate change will
probably increase the nutrient flow to the Baltic Sea because of increased predicted
precipitation will cause higher risk of the occasional overflowing of the storage
lagoons.
20
I will assume that the power plants in S1 and S2 will handle manure that comes from
the highest priority farms, where the risk of retention to nearby waters is high.
However, to investigate how the amount of nutrient leakage from the current situation
will affect the investment profitability, I will test different nutrient leakage percentages
in the sensitivity analysis.
2.5 Other environmental impacts of current poultry manure
management practices in the Leningrad area
The prevailing practices of manure management in the Leningrad region and
overapplication of the manure to fields can cause other significant environmental
problems as well. The current manure management practices create GHGs such as
methane (CH4), carbon dioxide (CO2), Nitrous oxide (N2O) (Font-Palma 2012, 92).
Anaerobic decomposition of the manure in large heaps causes CH4 emissions, which is
a powerful greenhouse gas that has 25 times higher greenhouse factor compared to
carbon dioxide (Forster et al. 2007). When the volume of the manure production in the
Leningrad region is taken into account, the climate effect of the poultry factories could
be significant.
Odour emissions in form of hydrogen sulfides (H2S) and ammonia (NH3) can also be
significant (Cantrell et al. 2007, 8918, Font-Palma 2012, 92). Ammonia (NH3) emission
can cause atmospheric nutrient deposition directly to the Baltic Sea, even though the
eutrophication effects of atmospheric deposition to the Baltic Sea are still small
compared with the potential runoff to surface and ground waters (Interview Knuuttila
4.9.2012).
Furthermore, improper handling of manure can cause increased spreading of
pathogens and release pharmaceutically active compounds. Piling the manure into
large heaps can possibly contaminate not only the surface water resources, but also
the groundwater with pathogenic organisms (Lynch et al. 2013, 197). If the nutrients
can infiltrate the ground water, it might lead to the elevated levels of nitrate (NO3) in
the drinking water of the nearby settlements. Nitrate in drinking water can cause
problems to the exposed population, such as respiratory disease and cancer (Kelleher
21
et al.2002, 27). It can also cause fetal abortion in livestock and other diseases (Font-
Palma 2012, 92). On the whole, the excess poultry manure causes a local health hazard
in the region to both human and livestock populations.
From the studies made so far, some of the most important environmental impact
indicators can be recognized. Lopez-Riduara et al. (2009, 1296) suggest that the main
issues of manure management are aquatic eutrophication, GHG emissions, and
acidification from NH3 emissions. To keep the calculations somewhat simple, I will only
take into account the nutrient loading effects of the poultry manure.
22
3 Technological alternatives for poultry manure
management: Fluidized bed combustion (FBC)
The main focus of this chapter will be on one currently available combustion
technology, fluidized bed combustion (FBC), which is the technology chosen for the
two energy producing scenarios (S1 and S2). The scenarios use FBC to co-combustion
the poultry manure with natural gas to produce only heat (H) or combined heat and
power (CHP). CHP means the production of both thermal energy and electricity in an
integrated system (Sashirekha 2013, 421).
Alternative technical processes can be used to treat organic waste, such as poultry
manure. The biomass conversion processes can be designed to address a variety of
problems relating to animal manure, and achieve variable goals, such as to reduce
environmental effects of the waste, create renewable energy, recycle nutrients and
reduce the need for artificial fertilizers (McKendry 2002, 47, Cantrell et al. 2008, 7941).
The selection of the conversion process should be based on the quantity and quality of
the used feedstock, the desired end-product and energy form, end-use requirements,
environmental benefits, economic conditions, and project specific factors (McKendry
2002, 47). The possible end-products and energy form has, in many cases, been the
determining factor in choosing the conversion process (McKendry 2002, 48).
Furthermore, the wanted end-product depends heavily on the possible acquired
market price for that product and on the market structure.
According to Cantrell et al. (2008, 7942), there are two primary ways of converting
biomass from organic sources, which are biochemical and thermochemical conversion
(TCC). Bio-chemical conversion technologies have two main process alternatives, which
are anaerobic digestion (production of biogas) and fermentation (production of
ethanol or hydrogen). Poultry manure thermochemical conversion (TCC) has four main
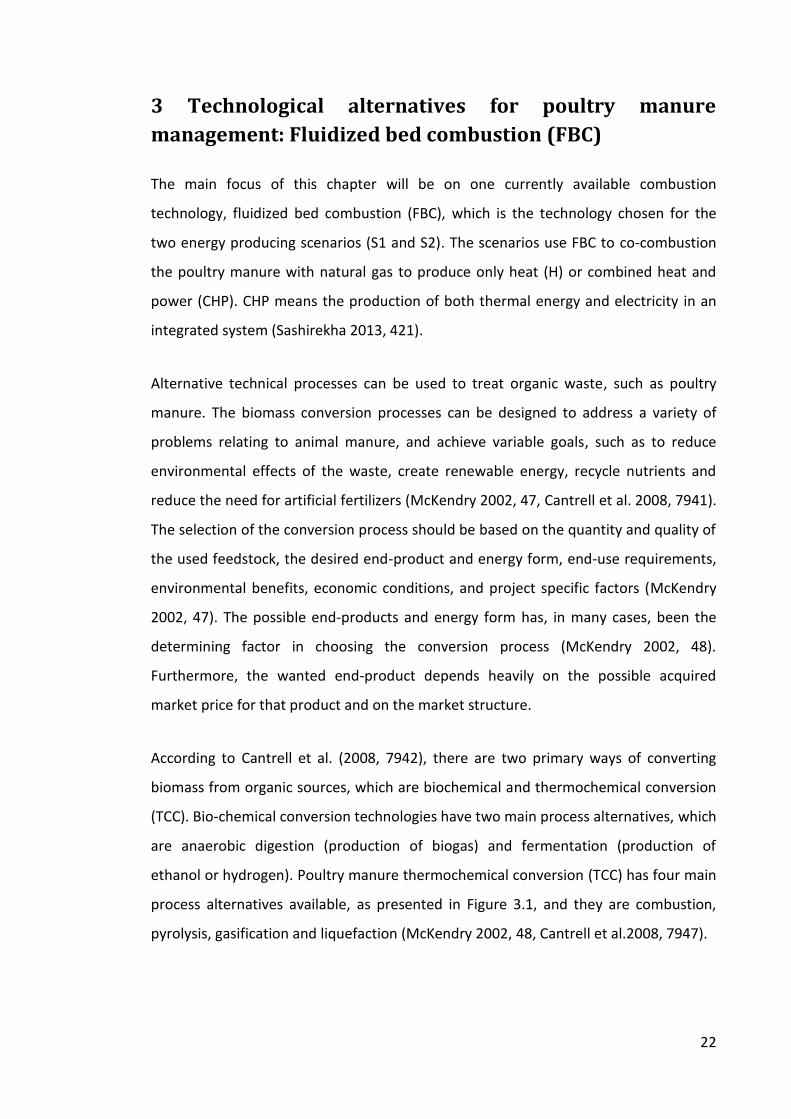
process alternatives available, as presented in Figure 3.1, and they are combustion,
pyrolysis, gasification and liquefaction (McKendry 2002, 48, Cantrell et al.2008, 7947).
23
Figure 3.1 Main TCC processes, outputs and possible end use. Modified from Cantrell
et al. (2008, 7947).
In thermochemical conversion (TCC) the meaning is to induce a reaction in high
temperature, where organic matter bonds break and reform the intermediate
compounds into synthesis gas, hydrocarbon fuels, and char or ash residual (Cantrell et
al. 2008, 7946). TCC processes are not only able to use all the available organic matter
in the manure and transform it into energy, but also gather and preserve the nutrients
it contains (Font-Palma 2012, 92). According to Cantrell et al. (2008, 7946) and Ro et al.
(2007, 8844), TCC processes have the benefits of small land area need, efficient
nutrient recovery, short process time, effective elimination of pathogens, low fugitive
gas emissions and flexibility in feedstock quality.
3.1 Properties and composition of poultry manure
Poultry manure is material that can be either considered a waste or a valuable
resource. For the purpose of this study, it is important to determine the average
24
composition of the poultry manure in the Leningrad area because the manure handling
alternatives depend heavily on it.
Broiler production, egg production and hatcheries produce waste as a side product of
their normal operations. The type of waste depends on the orientation and production
type of the poultry farm. According to Kelleher et al. (2002, 27), there are two main
types of waste that are generated in poultry farming. Firstly, poultry farming creates
poultry litter which comes from broiler meat production and hatcheries. Secondly, it
creates solid (or liquid) chicken manure that comes from egg production in cages.
Egg production can be done either in cage housing or in rearing houses. Cage housing
typically generates liquid manure that is gathered from under the cages. Egg
production in the Leningrad region, for example in Roskar PF farm, is done mostly in
cages, which generates mainly manure, but some litter as well (Ramboll 2009, 13). Egg
production could also be done in rearing houses, which generates mostly poultry litter,
but they are not common in the Leningrad area. Broiler meat production generates
only poultry litter.
As stated by Lynch et al. (2013, 198), poultry litter is actually a mixture of manure,
bedding material, feathers and feed. The rearing house floors need to have bedding
materials on them in order to absorb all liquid fractions of the excreta. The shares of
manure and bedding material in the litter are not constants, and they affect the
composition and the chemical properties of the litter. Many materials can be used as
bedding material, for example sawdust, straw, shredded paper and wood shavings
(Kelleher et al. 2002, 28). The composition of the poultry litter from different types of
production is quite similar, even though some differences in the chemical composition
exist.
Both types of generated waste, poultry litter and solid manure, consist mostly of
carbon (C) and water with smaller fractions of nitrogen (N), phosphorus (P) and
potassium (K). In addition, there are usually significant amounts of secondary plant
nutrient and traces of magnesium, calcium, chlorine, sodium, manganese, iron,

25
copper, zinc and arsenic (Kelleher et al. 2002, 28.) The typical ratios of N:P:K are 6:2:2
for layer manure and 6:2:3 for poultry litter (Nicholson, Cambers and Smith 1996, 279).
The shares of the elements and the properties of the waste depend on the litter origin
and management practices of the farm, for example type of feed, bedding material,
production line (egg or meat) and chicken breed (Font-Palma 2012, 93). The poultry
litter and manure from different production lines are often mixed together during the
production cycle (Kelleher et al. 2002, 28). Hereinafter, I will refer to this mix of poultry
litter and manure only as poultry manure.
The P and N contents of fresh poultry manure are presented in Table 3.1. According to
Eurofins Viljavuuspalvelu Oy statistics (2006-2009), the average Finnish poultry manure
contains in total 18,3 kg of total P per ton of manure and 8,3 kg of soluble P (Psol). It
also contains 6,7 kg of N per ton of manure, from which practically all N is in soluble
form. Only the soluble part of P and N are taken into account when calculating the
eutrophication effects of the manure later on.
Table 3.1. P and N content of fresh poultry manure. Source: Eurofins V.p. Oy (2006-
2009).
Mineral Unit Value
Concentration of fresh poultry manure
Ptot kg/ton 18,3
Psol kg/ton 8,3
N kg/ton 6,7
In general, manure is quite complicated and heterogeneous material for thermal
treatment. According to Font-Palma (2012, 92), the most important properties of
biomass as a fuel for thermal treatment are the moisture content, elemental
composition, ash content, calorific value, fixed carbon fractions and volatiles. These
properties have an effect on the thermal processes, and thus on the quality of the end-
product and their yields. Therefore, the composition and characteristics of the manure
have direct effect on the operation and feasibility of the technical solutions, for
example the moisture content of the manure affects the transportation costs directly.

26
For combustion purposes, the most important characteristic of the manure is its lower
heating value (LHV) because it indicates the amount of energy that can be obtained
from the manure during its combustion. Lower heating value (LHV), on the other hand,
is directly negatively dependent on the moisture content of the manure: the higher the
moisture content, the lower the LHV. Air dried poultry litter usually has a calorific value
of about half of coals calorific value (Abelha et al. 2003, 688).
Averages of the elemental composition of poultry waste from different studies are
shown in table 3.2. The elemental compositions are presented in percentages in solid
fraction of the waste. In addition, the higher and lower heating values are presented.
Table 3.2. Characteristics of poultry manure in different studies.
Mean values of components (wt.%)
Font-Palma *(2012)
Quiroga et al. *(2010)
Ramboll (2009, 76)
Main type of fuel
Litter Manure Manure, sample mix
Components
Fixed carbon 10,53
Volatile matter
53,63 67,30
Moisture 17,92 75,53 65,60
Ash 23,75 33,65 23,10
Carbon 29,19 36,20 38,00
Hydrogen 3,83 4,60 4,60
Oxygen 28,89 27,50
Nitrogen 3,48 5,90 6,30
Sulfur 1,13 0,11 0,47
Clorine 1,61 0,64 0,71
Phosphorus 0,65 2,3
HHV (MJ/kg)
wet 16,15 13,08
dry 14,39 15,14
LHV (MJ/kg)
wet 2,66 3,27
dry 12,15 14,14
*Values are based on multiple sources.

27
I will assume that the poultry manure used as fuel for combustion in scenarios S1 and
S2, has the same concentration of P and K as measured in the manure and litter mix in
the Ramboll (2009, 75) study. I do so, because these values are measured from an
actual priority farm (ROSKAR) that is situated in the Leningrad region. Compared to
other studies, the moisture content of the manure mix in the Ramboll (2009, 75) is
quite high and the LHV is low. The Ramboll (2009, 76) manure mix has 23 g/kg of P
and 26 g/kg of K in dry basis, and converted to wet manure it would be 7,9 g/kg and
8,9 g/kg respectively (see Appendix 1). These results fit well in line with academic
research findings (Nicholson et al. 1996, 279, Szogi and Vanotti 2009, 5462, Font-Palma
2012, 93, Eurofins V.p. Oy 2009).
3.2 Co-combustion of poultry manure with natural gas
Combustion of biomass is, in other words, burning of organic material. It is actually a
fairly complicated phenomenon and in the words of Jenkins et al. (1998, 18) “It
involves simultaneous coupled heat and mass transfer with chemical reaction and fluid
flow”. A more detailed description of biomass combustion is beyond the scope of this
thesis.
Compared to some other TCC technologies, such as pyrolysis, combustion of manure is
a well proven technology to produce renewable energy, and it has received a lot of
attention as a way of producing heat and power at large facilities (Szogi and Vanotti
2009, 5463, Khan et al. 2009, 28). Combustion technology has received considerable
academic interest in recent years and is an established technology in treating poultry
manure (Abelha et al. 2003, Zhu and Lee 2005, Lynch et al. 2013, Font-Palma 2012,
95). Poultry manure incineration has been done in large scale in the UK and the
Netherlands. As an example, a plant operating in Thetford, UK uses 420 000 tons of
manure annually as fuel and generates 38,5 MW of power. Another example is a FBC
power plant in Westfield, UK, which consumes annually 110 000 tons of manure and
produces 9,8 MW of power (EPR 2013, Quiroga et al. 2010, 880).
Co-combustion means simply combustion of two different fuels together at the same
time, renewable fuel along with some fossil support fuel (Sami, Annamalai and
28
Woodridge 2001, 172). Poultry manure can be burned alone as such, but co-firing is
usually necessary because of low LHV of the manure. The moisture percent of the
manure should be under 25%, for it to burn without support fuel (Abelha et al. 2003,
687). According to McIlveen-Wright, Huang, Rezvania and Wang (2007, 2041) and Khan
et al. (2009, 28), the burning of biomass with coal impacts the power generation
efficiency of a plant only slightly or not at all when compared to a only coal fired plant.
With reservation, the same result could also be assumed for natural gas fired boilers.
According to the first and second law of thermodynamics, the efficiency of an energy
conversion machine is the balance between its energy input and useful energy output.
The efficiency of heat and power production can therefore be calculated as in equation
(1).
mn
outout
in
out
ElH
Q
W
(1)
where η is power conversion efficiency, Wout is total work out of the system, Qin is total
heat-equivalent energy input into the system, Hout is heat output, Elout is electricity
output, Qn is the heat-equivalent natural gas input and Qm is the heat-equivalent
manure input.
3.3 Fluidized bed combustion (FBC)
From the technologies for combustion, fluidized bed combustion (FBC) is turning out to
be one of the most feasible because of its fuel flexibility, reaction stability and
efficiency (Khan et al. 2009, 45, Calvo et al. 2013, 59). Because of relatively low and
stable temperature, FBC can avoid some of the operation problems related to manure
combustion (Khan et al. 2009, 31).
There are two types of commercially available FBC boilers, depending on the sand bed
used in combustion. They are bubbling and circulating bed FBC boilers. Drawing on
publicly-available data from Ramboll (2009) and academic studies, a schematic
description of the generic FBC process is presented in Figure 3.2.

29
Figure 3.2. Generic version of FBC. Modified from Lynch (2013, 199).
According to Kelleher et al. (2002, 33), all the FBC boiler types have an initially
stationary sand bed, which is in the furnace chamber. The primary combustion air is
blown from below to the sand bed. The sand particles in the bed are fluidized, when
the airflow is adjusted to the appropriate level. The sand is then circulated back to the
bed by placing cyclones to the furnace. In Ramboll (2009, 21), the fuel is dropped to
the furnace from above the fluidized sand bed. The temperature of the furnace is
controlled usually to be somewhere between 800–900 °C (Khan et al. 2009, 31).
Fluidized beds enable fast ignition of low LHV fuels, because they are compact and
have high heat transfer rates and heat-storage (Kelleher et al. 2002, 33). The recovery
of the heat from the process is done in a heat recovery boiler, which is placed after the
actual FBC boiler (Ramboll 2009, 21).
The impurities in fuel, such as biomass, have been a concern because they could cause
problems in the burning process and corrosion problems (McIlveen-Wright et al. 2007,
2033). According to Ramboll (2009, 21), the FBC process can be controlled by
preheating the combustion air or by flue gas recycling, when using heterogeneous fuel
30
like poultry manure. If the water content of the fuel is high and the furnace
temperature drops, natural gas can be used as additional support fuel. Among
combustion techniques, FBC is a flexible technology that is capable of using a variety of
fuels and producing only relatively low emissions (Calvo et al. 2013, 59). In most cases,
standard combustion practices and optimized process design are enough to keep air
pollution emissions in the limits of the environmental norms (Khan et al. 2009, 45).
Henihan et al. (2003, 294) investigated the emissions from FBC of poultry manure and
concluded that the emissions are below the guidelines and limits set by EU and that
the gaseous emissions are not hazardous.
3.4 End-products of combustion
The main end-product of poultry manure combustion is ash. As can be seen from
figure 3.2, the ash is gathered from three different parts of the process. The boiler ash
is mixed with sand, and it is gathered from the bottom of the FBC boiler. The quality of
this ash is good, and it has low amount of impurities (Ramboll 2009, 41). It can be
utilized as part of a fertilizer if regulation for heavy metal traces is met. The second
available ash from combustion is fly ash. It has small particle size and high quality, thus
it can be used directly as a fertilizer or as feed (Ramboll 2009, 41). The third source of
ash in the combustion process is the flue gas cleaning system. Residues from flue gas
cleaning cannot be utilized as a fertilizer, and they are gathered separately from other
ash types (Ramboll 2009, 41). The flue gas cleaning residue ash must be disposed
according to local regulations and a cost from its disposition must be assumed.
The ash from combustion of poultry manure has been proved to be a valuable fertilizer
because it contains a lot of nutrients and micronutrients (Fibrophobos). Also, some
academic research on the elemental content of the FBC ash has been done in recent
years. According to Abelha et al. (2003, 688&691), most of the phosphorus (P) and
close to 100 % of the potassium (K) in the manure is still present in the ash. For
example, Lynch et al. (2013, 203) found out that the content of P and K in the FBC ash
was 110 kg/ton and 170 kg/ton respectively. Different poultry manure management
alternatives are compared in table 3.3, according to the P content of their end-

31
product. The P content of the end-product of a process can also be seen as an indicator
for other nutrients.
Table 3.3. Alternative manure management processes, technologies and output P
contents. Gathered by Szogi and Vanotti (2009, 5462).
Process Technology Phosphorus output
P content (kg/t)
Reference
Untreated None Raw manure 8,0 - 23,0 Edwards and Daniel
(1992) 18,3 (8,3*) Eurofins V.p. Oy (2009)
7,9 Calculated from Ramboll (2009, 75) (see Appendix 1)
Densification Screening Fine screened
fraction used as fertilizer
14 - 15 Ndegwa et al. (1991); Kelley et al. (1996); Coloma (2005)
Pelletizing Fertilizer, feed, soil amendment
25 Hammac et al. (2007)
Biological Composting Fertilizer 16 Sikora and Enkiri (2003) 6,4 - 12,2 Sharpley and Moyer
(2000) Anaerobic
digestion Solid fertilizer 13 - 20 Liedl et al. (2006)
Liquid fertilizer 0,33 TCC Direct
combustion Fertilizer, feed supplement
53 - 100 Codling et al. (2002); Zhu and Lee (2005); Blake et al. (2007)
FBC Fertilizer 110 Lynch et al. (2013) Pyrolysis Bio-char 48 -73 Lima and Marshall
(2005); Lima et al. (2007)
Gasification Fertilizer 62 Priyadarsan et al. (2004)
* Soluable P

32
As can be seen from table 3.3, combustion processes would increase the P content of
the end-product very effectively, thus presenting a very interesting option in the
Leningrad region. Combustion technologies could also solve the manure problem
relatively fast and they would be able to handle large amounts of manure. Combustion
of manure would also not largely affect the land use in the Leningrad region. The lack
of arable land in the Leningrad region means that biochemical conversion technologies
cannot be the only solution to the manure problem, because biochemical conversion
technologies would still leave the problem of what to do with the end-product and the
nutrients that it consists of.
Combustion technologies have the advantage of easier transportability of end-
products and lower disposal charges associated with fuel and tipping, which suggest a
longer distance where the nutrients can be transported cost-effectively (Cantrell et al.
2007, 8918, Kelleher 2002, 32). FBC technology can reduce the volume of the poultry
manure to 10 % of original mass, and it transforms almost all the P and K in the
manure into a concentrated and dry form (Abelha et al. 2003, 688&691, Lynch 2013,
203). On the other hand, all N is lost to the atmosphere during the combustion
process, and the ash contains only a fraction of the N.
33
4 Life cycle of poultry manure combustion and
environmental effects
I will not consider the whole life cycle of poultry products, even though that would be
necessary to accurately consider the impacts of the manure management stage. To
limit the study, I will concentrate on the combustion part of the life cycle and its main
environmental impacts. The functional units when considering the environmental
effects are MWh and the nutrient content of one ton of wet poultry manure.
The environmental effects of different poultry manure management practices can be
described by using life cycle analysis (LCA) methodology. LCA (i.e. cradle-to-grave
analysis) methodology framework can be used to evaluate potential environmental
impacts of a good or service in order to identify opportunities for pollution prevention
and reduce the overall impact on the environment, taking the goods whole life cycle
into consideration (ISO 14040). LCA measures the environmental impacts of all
processes and stages of a life cycle of a certain good. Taking all the environmental
effects into account would require a lot of data and time, thus making it quite
complicated and hard. Because of the impossibility of investigating all the different
impacts, it is important in every study to recognize the most important impacts and
their indicators. The impact categories should be chosen according to the goal of the
study (Poritosh et al., 2009, 2). The impact categories taken into account in the studied
scenarios are the climate change impacts and the nutrient loading to the Baltic Sea.
The climate change impacts are considered in form of carbon offsets from biomass
combustion in S1 and S2. The nutrient loading reductions will be studied in regard to
reduced P and N leakage to the Baltic Sea in S1 and S2. Later in chapter 6 I will
calculate the nutrient load reductions and carbon offsets of the studied scenarios in
monetary terms.
4.1 Reference scenario (S0)
The main environmental impacts of the current situation can be described simply in
figure 4.1, which is based on chapter 2. I assume that all energy needed in poultry
production in the reference scenario (S0), is bought from the Russian energy market. I

34
also assume that the manure is transported to its final storage site after little or no
treatment. Some of the manure might be dried in order to reduce the volume of the
transported mass, but mainly the nutrients remain in the manure, which is stored by
stockpiling or to a lagoon without a concrete floor.
Figure 4.1. Life cycle of manure in the current situation and system boundary (S0).
I assume that the power plant would not be further from the poultry farm than the
final storage site in the reference scenario, because as Table 2.1 shows, the distance of
the final storage site of the manure in the current situation can sometimes be quite
long. The same average distance of transportation of manure is assumed in the
reference scenario (S0) and in the power production scenarios (S1, S2). This way the
costs of transportation of the manure to the final storage site or to the power plant,
and the resulting GHG emissions can be excluded from the analysis.
It is clear that intermediate storages are a potential source of nutrient and GHG
emissions, because some decomposition might take place in the manure heaps. The
emissions from the intermediate storages would be quite hard to determine and
measure, and they would probably be equal in all scenarios. Thus the emissions from
the intermediate storages are not considered. Current manure management practices
can create GHGs in the final storage site if the manure it is not properly handled, which
is often the case in the Leningrad region. However, I will not consider these additional
Manure production
Transport & Intermediate storage
Final Storage

35
GHG emissions from the final storage, because there is a lack of reliable data from the
situation.
The nutrient emissions from the current situation were described thoroughly in
chapter 2, and the nutrient run-off was considered to be somewhere between 0,0024
% to 5,63 % of the produced P and 0,0039 % to 5,69 % of produced N. I assume that
the power plants in S1 and S2 will take care of the manure that comes from the highest
priority farms that are situated in the areas, where the risk of retention to nearby
waters is high (e.g. PF Roskar). The actual leakage from these top priority farms would
be in the high margin of the nutrient leakage scale. I will also assume that the nutrient
run-off remains constant in time without increasing or decreasing, and that the
manure will only cause emissions in the same year as it is produced. After that the
manure is sedimented to the soil layers, thus having only a low risk of retention.
Considering that the manure has on average the same nutrient composition as the
Finnish poultry manure described in table 3.1 (8,3 kg of Psol/ton and 6,7 kg of N/ton) ,
the nutrient leakage in S0 (or the avoided nutrient leakage in S1 and S2) would be 0,47
kg of P and 0,38 kg of N per ton of treated manure. In order to investigate how the
amount of nutrient leakage from the current situation will affect the investment
feasibility, I will test 30 % changes in the possible nutrient leakages in the sensitivity
analysis chapter.
4.2 Power plant scenarios (S1, S2)
The main stages of the life cycle and system boundaries of the two power plant
scenarios are described in figure 4.2. The life cycle starts when the manure enters the
power plant and ends when the manure residuals leave the power plant either as
fertilizer or emissions. The main environmental impacts of the two power production
scenarios are described by arrows, which are the avoided nutrient run-off and the
avoided GHGs from energy production. The main stages of combustion by FBC were
described in more detail in chapter 3.3.
36
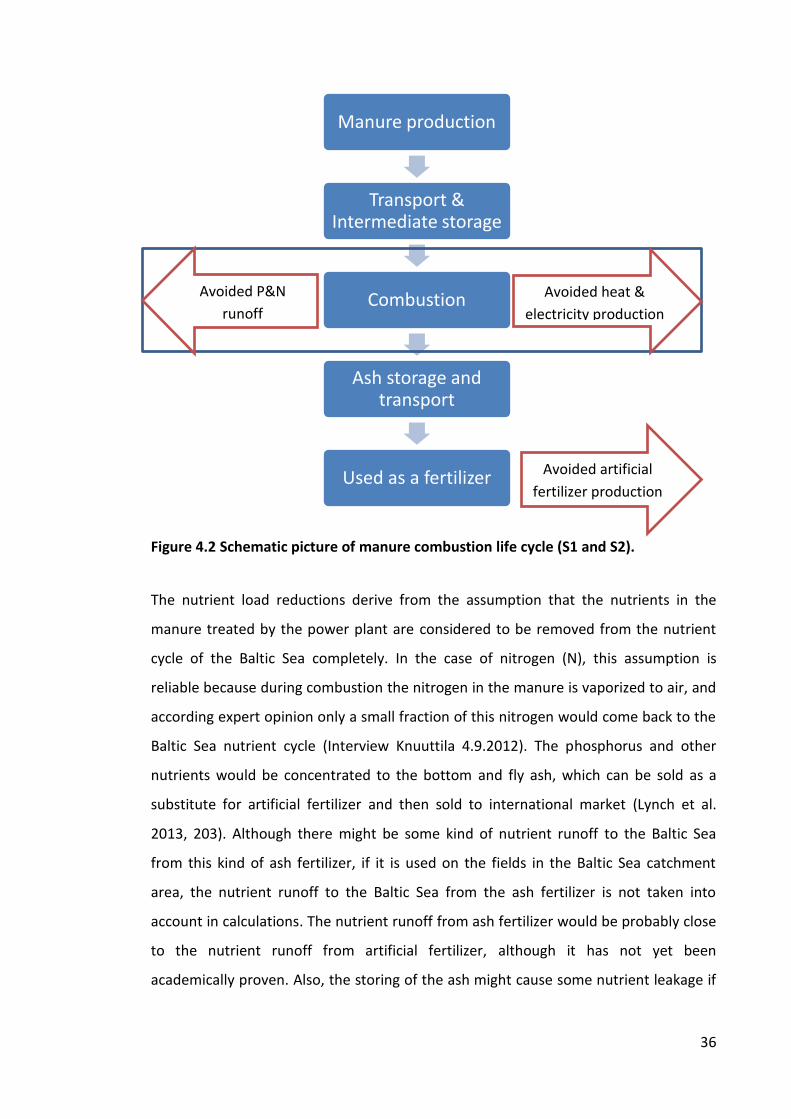
Figure 4.2 Schematic picture of manure combustion life cycle (S1 and S2).
The nutrient load reductions derive from the assumption that the nutrients in the
manure treated by the power plant are considered to be removed from the nutrient
cycle of the Baltic Sea completely. In the case of nitrogen (N), this assumption is
reliable because during combustion the nitrogen in the manure is vaporized to air, and
according expert opinion only a small fraction of this nitrogen would come back to the
Baltic Sea nutrient cycle (Interview Knuuttila 4.9.2012). The phosphorus and other
nutrients would be concentrated to the bottom and fly ash, which can be sold as a
substitute for artificial fertilizer and then sold to international market (Lynch et al.
2013, 203). Although there might be some kind of nutrient runoff to the Baltic Sea
from this kind of ash fertilizer, if it is used on the fields in the Baltic Sea catchment
area, the nutrient runoff to the Baltic Sea from the ash fertilizer is not taken into
account in calculations. The nutrient runoff from ash fertilizer would be probably close
to the nutrient runoff from artificial fertilizer, although it has not yet been
academically proven. Also, the storing of the ash might cause some nutrient leakage if
Manure production
Transport & Intermediate storage
Combustion
Ash storage and transport
Used as a fertilizer
Avoided heat &
electricity production
Avoided P&N
runoff
Avoided artificial
fertilizer production

37
it is not done in a proper way, but I assume that the ash storing is done responsively
thus not causing any nutrient leakage.
In addition to the effects above, the power plant scenarios can have a secondary
environmental effect because a manure based fertilizer would replace artificial
fertilizer production and offset phosphorus extraction, therefore avoiding the GHG and
nutrient emissions from fertilizer production (Azuara, Kersten and Kootstra 2013, 179).
In the light of the new nutrient leakage findings of HELCOM from fertilizer production
(e.g. Kingisepp), these secondary effects might be significant. However, to keep the
calculations somewhat simple, this secondary effect of the scenarios is not taken into
account.
The theoretical GHG reductions are based on the fact that manure as a fuel is
comparable with renewable energy from waste materials, which is carbon dioxide
(CO2) neutral. The same amount of carbon (C), which is released to the atmosphere
during combustion of a biomass fuel, is consumed from the atmosphere during the
growth of the biomass (Zhu and Lee 2005, 512). Therefore, the substitution of fossil
fuels by biomass, such as manure, offset the carbon emissions from the marginal
production technology in S0 and will lead to reductions in GHGs (Quiroga et al. 2010,
881). In co-combustion of biomass with fossil fuels, only the part of the produced
energy that comes from the manure can be assumed to cause no GHG emissions. The
avoided GHG emissions are therefore defined by the share of biomass in the fuel.
The theoretical avoided amount of GHG emissions depend on the marginal energy
production system. In many cases, the marginal energy production source in Russia is
natural gas or coal (Abdurafikov 2009, 64). For example, the poultry farm Roskar PF in
the Leningrad region produces its heat by using natural gas fired boilers and buys its
electricity from the market (Ramboll 2009, 8). Therefore, I will consider that both heat
and electricity produced from the manure, would replace heat and electricity
produced with natural gas.

38
According to Statistics of Finland (2013) and Motiva (2010, 4) the emission coefficient
(or rate) for natural gas is 55,04 ton of CO2 per TJ or converted 198 kg CO2 per MWh. In
addition, natural gas has indirect emissions coming from raw material production, fuel
refinement and transportation, which are not taken into account in the Statistics of
Finland (2013) calculations. According to Wihersaari (2005, 441), the indirect GHG
emissions from combusting natural gas are about 25 % of the emissions from
combustion. When the indirect emissions are taken into account, the emission factor
of the power plant is 248 kgCO2/MWh. In basic calculations, the emissions factor is
often considered accurate enough to estimate the CO2 emissions (Motiva 2010),
although the final CO2 emissions from produced energy depend on the efficiency of
the combustion boiler of the particular plant (Lappi, Ollikka & Ollikainen 2010, 1083),
which can be calculated using equation (1).
When calculating the GHG emissions of power production, it is recommended to use a
functional unit of produced energy. However, I calculate the GHG emission reductions
on fuel basis, because I assume the marginal market production efficiency in S0 is close
to what it is in the scenarios S1 and S2, and that the efficiency of power generation is
not significantly affected by the biomass co-combustion in natural gas fired boilers.
This has been proved for at least for coal fired power plants (McIlveen-Wright et al.
2007, 2041).
Combustion of the manure also creates other GHGs emissions, but usually these
emissions are considered relatively low (Wihersaari 2005, 438). Also Mikkola et al.
(2002, 140) have concluded, although with reservation, that the emissions from
combustion of biomass using modern technology were not significantly bigger than
those from fossil fuels. Other poisonous gas emissions from the FBC power plant are
possible, but according to Henihan et al. (2003, 294), the gaseous emissions from co-
combustion of poultry litter in FBC are not hazardous. I also assume that all the power
plant scenarios would comply with the emission limits and end product treatment
requirements of the EU Directive 2000/76/EC, which frames strict guidelines and
regulations for modern waste incineration plants. It can therefore be expected that
the air quality limits of the Russian Federation will not be exceeded.

39
4.3 Environmental damage and marginal cost estimates
To calculate the monetary values of the climate change effects and nutrient loading of
a project, one needs the estimates of marginal social costs of producing carbon
emissions and the marginal cost of P and N load to the Baltic Sea.
Some estimates can be found for marginal cost of N (Gren 2001, Markowska and Zylicz
1999), but it is not a widely studied topic. Gren (2001, 51) estimated a 62 SEK constant
marginal damage from one kg of nitrogen in the Baltic Sea countries in year 1995, with
the assumption that the nitrogen reductions values do not depend on their location.
This assumption gives equal division of marginal benefits among the countries and
thus it can be considered to be ethically credible. I convert the 62 SEK to 2013 value
with the consumer price indices (CPI) of Sweden (OECD 2013). The average monthly
CPI of Sweden in 1995 was 90,9 and 111,9 in 2013, which means that the constant
marginal damage would be about SEK 76,3 in 2013 values. This converted to euros
using the average monthly currency rates from European Central Bank in 2013 (in
average SEK 8,62 was EUR 1), would mean a constant social marginal cost of
approximately € 8,9 per kg of nitrogen. Following Lankoski, Ollikainen and Uusitalo
(2006), the marginal cost of P can then be derived by multiplying the N damage with
the Redfield ratio of 7,2, which is the atomic ratio of N and P found in phytoplankton in
the oceans of the world. Therefore, the total damage function from eutrophication
effects is given by
PNRD nz 2,7 (2)
where Rn is the constant social marginal cost, which was calculated to be € 8,9. N is
amount of nitrogen leakage in kg and P is amount of phosphorus leakage in kg.
According to Mandell (2011, 889), there are many ways to attach value to the CO2
emissions in CBA, but I will derive it by using marginal social cost of carbon (SCC),
which is a direct approach. SCC means the cost of one additional unit of carbon
released to the atmosphere for the society as a whole. In the words of Mandell (2011,
889), ”SCC is the present value of the monetized damage caused by each period of

40
emitting one extra tonne CO2 today as compared to the baseline.” If the SCC is
known, the monetary value of climate change effects can be calculated.
A number of SCC estimates have been published in different studies with various
methods and settings during the recent years (Mandell 2011, 889). Especially Tol
(2005, 2008, 2011) has published interesting literature reviews on the topic. The EU
emission allowance (EUA) price could also be used as an estimate of the mean
marginal CO2 damage, but the EUA price has fluctuated quite a lot in recent years, and
it is directly dependent on political decision making and economic development of the
EU countries. Therefore, I derive the monetary values of climate chance effects from
SCC using estimates from Tol.
Tol (2005, 2070) provided an SCC estimate of DOL 97 tC-1 based on the average of the
estimates in studies made so far. This estimate is used as well in a relatively recent
study by Lankoski and Ollikainen (2011). Tol (2008, 11) considered 211 different SCC
estimates from 47 studies, and concluded that the mean value of C per ton is DOL
104,8, but the distribution is skewed heavily to the right. The most recent study by Tol
(2011) had 311 estimates for the value of SCC, in which the average cost of carbon was
DOL 177 per tC-1. There is a large dispersion in the estimates of SCC found in different
studies, which implies that SCC is quite hard to estimate (Mandell 2010, 889).
Because of many estimates available for SCC, I will use the average of the studies made
by Tol (2005, 2008, 2011), which is DOL 126,3 tC-1. I convert the cost of C ton reported
in Tol’s studies to a cost of CO2 ton following Mandell (2011), which states that a unit
CO2 weighs 3,67 times one unit C. Therefore, a SCC of DOL 126,3 tC-1 converted to CO2
cost in euros is EUR 26,06 per ton of CO2 (ECB 2013). Because there is uncertainty
related to SCC estimates, I will test changes in the values of SCC in the sensitivity
analysis.

41
5 Theory and method
In this chapter, I will describe the cost-benefit analysis (CBA) method and all the basic
equations that are used later in the case study. The theory of CBA relies heavily to the
Kaldor-Hicks criterion, which is often used in social welfare theory. In short, Kaldor-
Hicks principle means that as long as the net benefits from a certain project are
positive, the benefiting party can compensate the costs to the losing party, and
therefore the project should be carried out (Boardman et al. 2006, 31).
5.1 CBA
According to Boardman et al. (2006, 5-6), CBA was developed in the USA to help social
decision making process. The purpose of CBA is to take into account all the social
impacts of a project or policy and calculate their monetary value, and then give
recommendation of the feasibility of the project. CBA is an accepted tool for decision
making and it is used widely in many countries for example in the USA, EU and Canada
(EC 2002 , Pearce et al. 2006, 36-37, US Executive Order 13258). Also the World Bank
and other international financial institutions have been traditionally using CBA based
methods (Dietz and Hepburn 2013, 61). The CBA is typically performed before, during
or after the analyzed project or policy. According to Boardman et al. (2006, 3), ex ante
CBA refers to analysis that is performed before the actual project to determine the
best alternative. In medias res CBA is performed during the project lifetime, and ex
post is done after the project in order to examine the actual realized net benefits. I will
conduct the more common ex ante analysis, because the proposed projects have not
yet been implemented. The purpose of this ex ante analysis is to reveal if the optimal
solution for poultry manure handling.
As stated in Boardman et al. (2006, 7-17), the basic idea in CBA is to calculate the net
present value (NPV) of a project or a policy. NPV is calculated by summarizing and
discounting all cash flows of the project to the start time of the project. The cash flows
can be either negative (costs) or positive (benefits). In typical CBA all the prices that
are used in calculating the costs and benefits are fixed at a base-year and adjusted for
inflation (EC 2002, 26). NPV measures the final financial benefits from the studied

42
project, and therefore its feasibility. The final part of a CBA is to give a
recommendation of the optimal project or policy, on the basis of the calculated NPVs
(Boardman et al. 2006, 17). The project with the highest NPV should be executed
because it will produce the most benefits for the society as a whole.
If the considered impacts in CBA are mostly related to the environment, it can be also
referred as environmental costs-benefit analysis (ECBA). ECBA includes all significant
environmental impacts of a project and policy and translates them to monetary values
(Sáez and Requena 2007, 712). ECBA is an obligatory method for analysis for significant
projects in many countries, and it is used broadly by environmental protection
agencies (Kuosmanen and Kortelainen 2007, 57). The threshold for conducting an
ECBA for a project for example in EU is financial total costs of EUR 50 million (EC 2002,
11). In practice, the ECBA is made in several stages, which typically include the stages
in figure 5.1.
Figure 5.1. Typical stages of ECBA. Modified from Kuosmanen, Bijsterbosch and
Dellink (2009, 1634).
6. Sensitivity analysis
Testing of result robustness to changes in key parameter values
5. Selection of the best scenario according to the NPV criterion
4. Discounting of cost and benefit flows
3. Economic valuation of impacts
2. Measurement of environmental impacts
Identification of the physical impacts of scenarios
1. Problem definition
Setting of objectives, alternative scenarios, standing and project life time
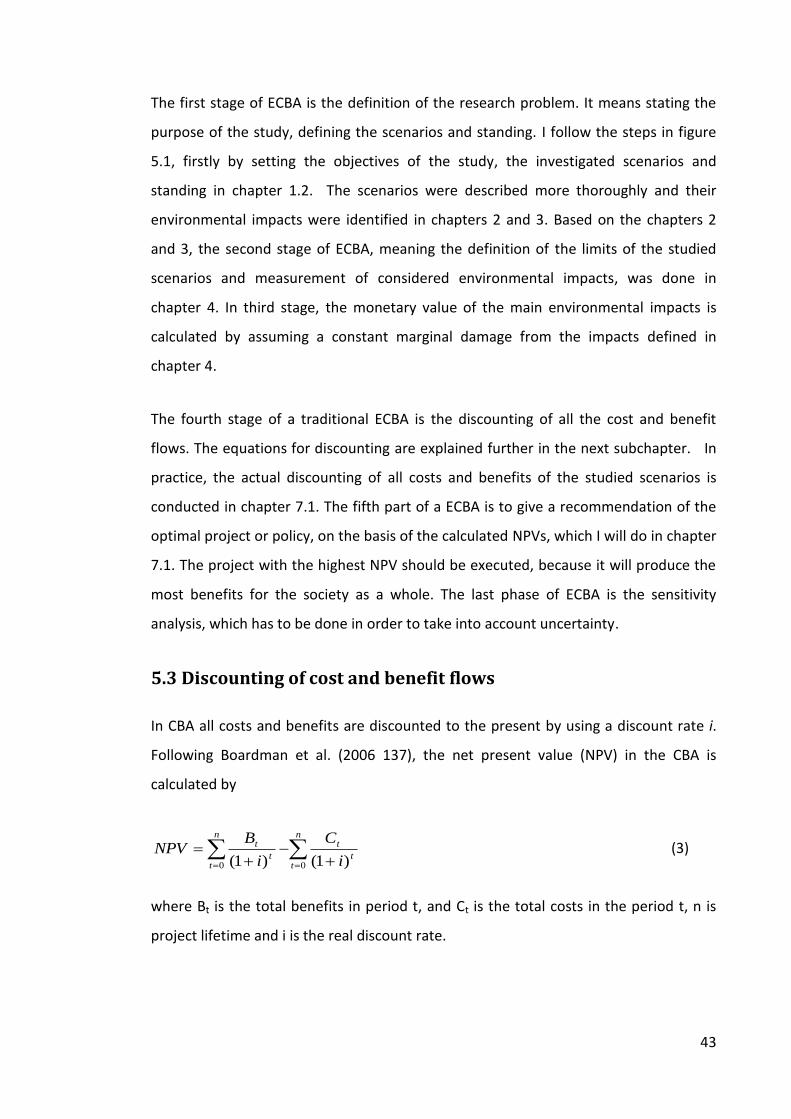
43
The first stage of ECBA is the definition of the research problem. It means stating the
purpose of the study, defining the scenarios and standing. I follow the steps in figure
5.1, firstly by setting the objectives of the study, the investigated scenarios and
standing in chapter 1.2. The scenarios were described more thoroughly and their
environmental impacts were identified in chapters 2 and 3. Based on the chapters 2
and 3, the second stage of ECBA, meaning the definition of the limits of the studied
scenarios and measurement of considered environmental impacts, was done in
chapter 4. In third stage, the monetary value of the main environmental impacts is
calculated by assuming a constant marginal damage from the impacts defined in
chapter 4.
The fourth stage of a traditional ECBA is the discounting of all the cost and benefit
flows. The equations for discounting are explained further in the next subchapter. In
practice, the actual discounting of all costs and benefits of the studied scenarios is
conducted in chapter 7.1. The fifth part of a ECBA is to give a recommendation of the
optimal project or policy, on the basis of the calculated NPVs, which I will do in chapter
7.1. The project with the highest NPV should be executed, because it will produce the
most benefits for the society as a whole. The last phase of ECBA is the sensitivity
analysis, which has to be done in order to take into account uncertainty.
5.3 Discounting of cost and benefit flows
In CBA all costs and benefits are discounted to the present by using a discount rate i.
Following Boardman et al. (2006 137), the net present value (NPV) in the CBA is
calculated by
n
tt
tn
tt
t
i
C
i
BNPV
00 )1()1( (3)
where Bt is the total benefits in period t, and Ct is the total costs in the period t, n is
project lifetime and i is the real discount rate.

44
As stated in Boardman et al. (2006, 134), a positive NPV means that the studied
scenario should be implemented, because it would increase the total welfare of the
society. Negative NPV would on the other hand mean that the scenario is not
profitable to the society, and should therefore not be carried out. The best scenario
should therefore be chosen based on the NPVs of the scenarios. In practice this means
that if the NPV of either of the scenarios S1 and S2 is positive, the particular power
plant should be constructed.
The discounted flow of annually constant B or C can be also described by using annuity
factor ain.
n
i
nn
tt
aBi
iB
i
B
)1(1
)1(1
(4)
where ain is the annuity factor
i
ia
nn
i
)1(1 (5)
The annuity factor can be, for example, used to calculate the annual value of the
investment costs.
5.4 Discount rate
According to Boardman et al. (2006, 146-149), the discount rate, by which the costs
and benefits are discounted, can be either nominal or real. The difference is that real
discount rate means nominal discount rate subtracted by inflation. The selection of
discount rate depends on the costs and benefits. If the costs and benefits are in
nominal values then the discount rate has to be also nominal, and vice versa. In this
study all prices are considered to be real prices, thus the real discount rate has to be
used.
The main problems in discounting the future cost and benefit flows in CBA are often
related to the appropriate discount rate (Pearce et al. 2006, 57, Sáez and Requena
2007, 713). There are actually often many justified discount rates available and the
45
context of the case should be the deciding factor. One of the most agreed on
definitions of financial discount rate is the opportunity cost of capital (Boardman 2006,
236). It refers to the potential benefits from another project on which the capital could
have been used, instead of using it to the chosen project (EU 2002, 103). In the
theoretical literature about the issue most authors tend to think, that the best guess
for discount rate in a project with effects under 40 years is the opportunity cost of
capital (Sáez and Requena 2007, 713).
The discount rate in CBA reflects the society’s view on the future costs and benefits.
Therefore the discount rate in CBA is often referred as the social discount rate (SDR).
According to EC (2002, 104), the SDR may be different than the opportunity cost of
capital, because of imperfections in the capital market. There is many kinds of
approaches to choosing of the SDR, but some authors considered that the most
coherent SDR is the Social Time preference Rate (STPR) (Sáez and Requena 2007, 714-
717). Following Pearce and Turner (1990, 214), the STPR can be given by
pceSTPR (6)
where c is the real per capita consumption rate, e is the elasticity of the consumption
function's marginal utility and p is the type of interest of pure time preference. The
actual STPR is considered by Sáez and Requena (2007, 718) to be somewhere between
3 % and 5 %.
In private calculation higher discount rates are often used, depending on the required
rate of return. In Russia even rates over 10% are used for private investments, but they
are most likely given in nominal terms. The benchmark interest rate in Russia was last
recorded at 8.25 percent (CBRF 2013), and the consumer price index was 6.1 % in
September 2013, so that the real interest rate in Russia would be actually close to 2 %
(OECD 2013).
In sum, many different SDR may be justified and no consensus about the matter yet
exits. Still CBAs are conducted in large scale, and for example European commission
(EC) recommends a 5 % real discount rate to be used in CBA (EC 2002, 105). Therefore
46
in further calculations, I will also use the recommendation of the EC. Different discount
rates and their influence on the profitability will be tested in the sensitivity analysis.
5.5 Costs and benefits
All data of the costs and benefits have to be converted to the values of the same year,
which in this case is 2013. Otherwise they could not be compared with each other. In
CBA, the costs and benefits can occur at different times of the year t, and it affects the
outcome of the analysis slightly. Further, I assume the all the costs and benefits will
occur in the end of the year.
The costs and benefits from the scenarios can be called either private or social costs
and benefits, depending on which party they are actually realized. In this particular
case, all the costs from the scenarios are private costs because they are realized to
private producers who would operate the power plant. The private costs from the
scenarios can be divided to two categories, which are building the combustion plants
and other starting up costs (investment costs), and the yearly operation and fuel costs
(annual costs). Market revenues from the scenarios are also private because they
would be realized to the private producer as well. The environmental benefits from the
scenarios do not show on the balance sheet of the private producer, thus they can be
referred as social benefits.
5.5.1 Investment costs
Investment costs (IC) refer to capital costs that are assumed to occur during the first
year of the investment. Because ICs appear in year 1, they do not have to be
discounted. However, the annuity method can be used to calculate the annual value of
the investment costs. The horizon value of the investment is assumed to be equal to
zero, which is usually close to the truth in private sector (Boardman et al. 2006, 144).
Accurate prediction of the investment costs of the scenarios is hard, because not that
many poultry manure combustion power plants have been constructed in the past
(McIlveen-Wright 2013, 2). Even though a few poultry manure fired power plants exist,
47
the ICs are strongly dependent on the geographical location, and other site specific
issues. These reasons cause uncertainty to the actual investment costs. In the study of
McIlveen-Wright et al. (2011, 14), the investment costs of a biomass power plant were
expected to be up to 30 % higher or lower than in the estimated base scenario. In my
calculations, the IC are based on Ramboll’s experince on similar power plants (Ramboll
2009, 37-38), and different ICs will be tested in the sensitivity analysis.
5.5.2 Annual costs
The annual costs (AC) of operating the power plant can be divided to operation and
maintenance costs (O&MC) and to fuel costs. There are many possible categories of
O&MC for biomass power plants, which often include repair and maintenance cost of
equipment and buildings, insurance costs, labor costs, flue gas cleaning costs, but they
are very dependent on the particular case. The actual O&MC are presented more
thoroughly in chapter 6.3. The annual costs are dependent on the investment costs,
both directly and indirectly. Often in practice, some O&MC are not calculated
individually, but they are assumed to be some percentage of the investment costs. It is
clear that, the larger the investment cost and scale of the study are, the larger the fuel
and labor costs. Fuel costs depend on the amount of used fuel and its price. Therefore
the value of annual costs can be expressed by
n
tt
nnn
tt
t
i
qwMCO
i
AC
00 )1(
&
)1( (7)
where ACt is the annual costs in period t, O&MC are the annual operation and
maintenance costs, wn is the price of natural gas, qn is the amount of used natural gas,
n is project lifetime and i is the real discount rate.
5.5.3 Annual market revenues
Market revenues (MRt) mean the annual revenues that are obtained from the sales of
the output of the scenarios. In practice, they are the revenues from produced thermal

48
energy or heat, revenues from produced electricity and revenues from the ash sales.
Therefore the discounted value of the sum of all MR can be given by
n
tt
aaeehhn
tt
t
i
qpqpqp
i
MR
00 )1()1( (8)
where ph is the price of heat, qh is the amount of produced heat, pe is the price of
electricity, qe is the amount of produced electricity, pa is the price of ash, qa is the
amount of produced ash, t is project lifetime and i is the real discount rate.
5.5.4 Annual environmental benefits
The most debated problems of ECBA relate to the valuation of environmental impacts.
Environmental benefits are non-market benefits that have real effect but they are not
internalized in the decision making of a private investor. The monetary value of the
main environmental impacts can be measured in different ways, and a lot of literature
exists from this subject (see e.g. Freeman 2003). I will calculate the monetary value of
these impacts by using the marginal cost estimates defined in chapter 4.3. If the
marginal damages of eutrophication and climate impacts are known, the monetary
values of the external effects can be then simply calculated by multiplying the marginal
damage with the amount of the impact.
I assume that the environmental impacts of the scenarios are relatively small and do
not affect the marginal damage curve. The total environmental benefits of S1 and S2
can thus be calculated by
n
tt
coconn
tt
t
i
qSCCPNR
i
EB
00 )1(
2,7
)1(
22 (9)
where Rn is the marginal cost of N, N is amount of N leakage from the treated manure,
P is the amount of P leakage from the treated manure, SCCC02 is social marginal cost of
CO2, qC02 is the amount of carbon offsets the scenario produces.

49
5.6 Net Present Value (NPV)
By summarizing and discounting all cost and benefit flows of the project to the start
time of the project, the NPV can be calculated (Boardman et al. 2006, 137). Based on
the equations formed above, the NPVs of the scenarios can be expressed by
n
tt
tn
t
n
tt
t
t
t
i
C
i
EB
i
MRNPV
00 0 )1()1()1( (10)
where MRt is the market revenues in year t and EBt is the environmental benefits in
year t and Ct is the costs in year t. Also more precisely by
n
tt
nnt
n
tt
cocon
n
tt
aaeehh
i
qwMCOIC
i
qSCCPNR
i
qpqpqpNPV
0
0
0
)1(
&
)1(
2,7
)1(
22 (11)
where ph is the price of heat, qh is the amount of produced heat, pe is the price of
electricity, qe is the amount of produced electricity, pa is the price of ash, qa is the
amount of produced ash, Rn is the marginal cost of N, N is amount of N leakage from
the treated manure, P is amount of P leakage from the treated manure, SCCC02 is social
marginal cost of CO2, qC02 is the amount of carbon offsets the scenario produces, IC is
the investment costs, O&MC is the operation and maintenance costs, wn is the price of
natural gas, qn is the amount of used natural gas, n is project lifetime and i is the real
discount rate.
Although NPV is often considered the best investment decision indicator, there are
also other popular investment decision indicators such as internal rate of return (IRR)
and investment payback period (PP). IRR is closely related NPV because it describes the
profitability of a project, and it takes the discount rate into account. The IRR is a
discount rate of a project when NPV is set to zero (Boardman et al. 2006, 155). In PP, is
simply calculates how fast the investment cost is paid back, by the cash flows from the
50
investment. Therefore it does not present the profitability of the project but only its
liquidity effect.
5.6 Sensitivity analysis
The prediction of future events is always uncertain. In CBA uncertainty can be taken
into account in several ways, from which the sensitivity analysis is the most common. It
is a recommended step for all CBAs. According to Boardman et al. (2006, 165&176),
the main purpose of making a sensitivity analysis is recognizing the key parameters
that the results are the most sensitive to. Finding out the parameters that the NPVs are
the most sensitive to, can help to design better policy methods.
Testing all the different combinations of all the parameters involved would be a
dreadful task, because of the sheer amount of possible scenarios. One option to deal
with this is by conducting a partial sensitivity analysis, in which a one parameter is
changed at a time and the other parameters remain at their base value. Only the most
important and uncertain parameters are chosen. Break-even parameter values can be
found by setting the NPVs to zero. The parameters, which change the NPV of a
scenario from positive to negative, or vice versa, are considered as “critical” (EC 2006,
11). If the NPVs of the scenarios are close to the same value, the scenario which is less
sensitive to parameter changes should be considered more appropriate. I will test
several parameters, from which the most important are then chosen to be presented
in the actual partial sensitivity analysis in chapter 6.4.

51
6 ECBA from co-combustion of poultry manure with
natural gas
This chapter is an ECBA of two different hypothetical poultry manure co-combustion
power plant scenarios in the Leningrad region, close to a farm that is on the high priory
list of HELCOM. Also, a reference scenario is established in order to compare the
investigated power plant options to current situation.
6.1 Description of the scenarios
The studied scenarios would be situated in the Leningrad region, where the poultry
production farm sizes are typically very large and need a lot of thermal energy to heat
the poultry houses. Therefore, I assume that the thermal energy produced by the
power plant scenarios can be used as process heat for poultry farms operations or in
district heating. I also assume that the potential produced electricity is consumed by
some nearby poultry farm or settlement and it is sold at the market price. All scenarios
would take care of similar amount of poultry manure, which is 94 000 tons.
The three scenarios considered are the following:
Scenario 0 (S0) is a reference scenario where the final disposal of poultry manure is
done like on a marginal farm described in chapter 4.1, thus causing approximately 5,6
% nutrient leakage from the produced manure. The energy required by the poultry
farm and the nearby settlement would be bought from the Russian energy market.
Scenario 1 (S1) is a new power plant equipped with a FBC boiler, burning poultry
manure and natural gas in the main boiler and a natural gas in the reserve/auxiliary
boiler. This power plant would produce only heat.
Scenario 2 is (S2) a new power plant equipped with a FBC boiler burning poultry
manure and natural gas in the main boiler, and an extraction condensing steam
turbine and a natural gas fired reserve/auxiliary boiler. This would be a CHP plant
producing both heat and electricity.
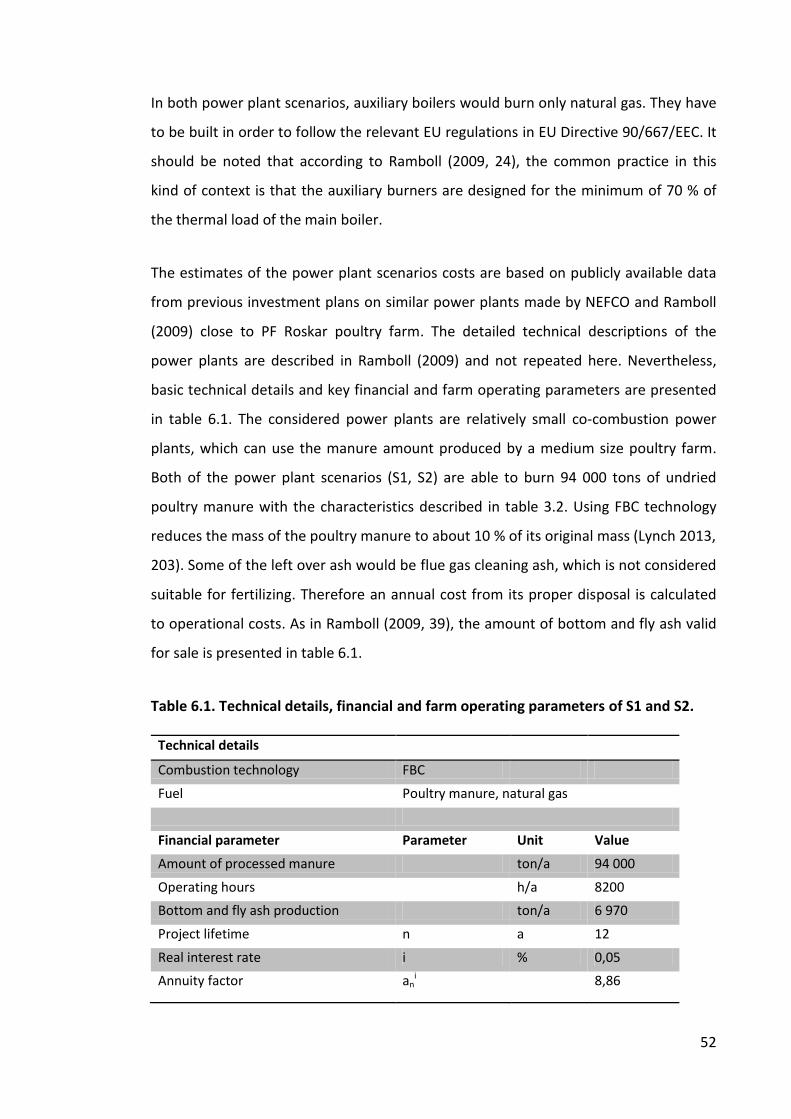
52
In both power plant scenarios, auxiliary boilers would burn only natural gas. They have
to be built in order to follow the relevant EU regulations in EU Directive 90/667/EEC. It
should be noted that according to Ramboll (2009, 24), the common practice in this
kind of context is that the auxiliary burners are designed for the minimum of 70 % of
the thermal load of the main boiler.
The estimates of the power plant scenarios costs are based on publicly available data
from previous investment plans on similar power plants made by NEFCO and Ramboll
(2009) close to PF Roskar poultry farm. The detailed technical descriptions of the
power plants are described in Ramboll (2009) and not repeated here. Nevertheless,
basic technical details and key financial and farm operating parameters are presented
in table 6.1. The considered power plants are relatively small co-combustion power
plants, which can use the manure amount produced by a medium size poultry farm.
Both of the power plant scenarios (S1, S2) are able to burn 94 000 tons of undried
poultry manure with the characteristics described in table 3.2. Using FBC technology
reduces the mass of the poultry manure to about 10 % of its original mass (Lynch 2013,
203). Some of the left over ash would be flue gas cleaning ash, which is not considered
suitable for fertilizing. Therefore an annual cost from its proper disposal is calculated
to operational costs. As in Ramboll (2009, 39), the amount of bottom and fly ash valid
for sale is presented in table 6.1.
Table 6.1. Technical details, financial and farm operating parameters of S1 and S2.
Technical details
Combustion technology FBC
Fuel Poultry manure, natural gas
Financial parameter Parameter Unit Value
Amount of processed manure ton/a 94 000
Operating hours h/a 8200
Bottom and fly ash production ton/a 6 970
Project lifetime n a 12
Real interest rate i % 0,05
Annuity factor ani 8,86

53
The techno-economic lifespan of an engine is closely connected to the amount of
maintenance spent on the engine and the cost of a new engine (Lantz 2012, 505).
Based on Ramboll (2009, IX) the project life time of the scenarios S1 and S2 is assumed
to be 12 years. The annual operation hours of the co-combustions plants is assumed to
be 8200 h/a, which is a quite optimistic number, but it still in line with academic
research of new gas fired turbines (Lantz 2012, 507).
Based on the discussion in chapter 5.4, a discount rate of 5 % was chosen, which is a
quite typical interest rate used in social CBA. However, I will test discount rates from 2
to 8 % in the sensitivity analysis. I calculated the annuity factor using equation (5). It is
needed later when calculating the NPVs of the scenarios.
The energy balances, the efficiencies of power production and biomass fuel shares of
the scenarios in are presented in table 6.2. The power plants utilize an equivalent
amount of poultry manure, but use and produce different amounts of energy. The
total fuel consumption in heat-equivalent energy is 150 100 MWh per year in S1 and
157 500 MWh per year in S2, whereas the total energy production is 97 500 MWH per
year in S1 and 107 500 MWh per year in S2. Using equation (1), it can be seen that the
power production efficiency in the S2 is slightly better than in S1. However, the
increased energy production in S2 comes from burning additional natural gas, so that
the fuel biomass mix is lower in S2.

54
Table 6.2 Energy balances of the alternatives. (MWh/a) Based on Ramboll (2009, 15).
S1 S2
Hot water production 77 100 77 100
Process steam production 20 400 20 400
TOTAL heat production 97 500 97 500
Electricity production 10 000
TOTAL energy production 97500 107 500
Poultry manure consumption 86 500 86 500
Natural gas consumption total 63 600 71 000
TOTAL fuel consumption 150 100 157 500
Operational efficiency 0,65 0,68
Fuel biomass mix 0,58 0,55
6.2 Input and output prices
A summary list of the most important input and output prices of the scenarios is
presented in table 6.3. They are assumed to be constant in time, meaning that they are
adjusted for inflation and fixed to year 2013. All input and output prices in table 6.3
are converted to euros using the average of monthly currency rates of Bank of Finland
in year 2013 (excluding December). Also, all prices in table 6.3 are converted to
present day value of 2013 by using the average consumer price indices (CPIs) of
Russian Federation (OECD 2013), except Potassium chloride and Phosphate rock
prices, which are monthly averages from 2012 (Indexmundi 2012). The prices in table
6.2 are best guess estimates taken or derived from academic literature and official
sources and they will serve as a basis for the sensitivity analysis. Taxes are not
included, because the calculations are done in social level, which would mean that
these kinds of income transfers would anyways sum up to zero (Boardman et al. 2006,
55).

55
Energy prices are derived from data from the Federal Tariff Service of Russian
Federation (FTS). The indicative estimate for electricity price in the scenarios can be
derived from the electricity price in the North West federal district of Russia (FTS
2011), which was 268 kop./kWh, or when converted to RUB 2680 per MWh. The value
in euros is then EUR 63,7 MWh. This is converted to 2013 values in table 6.3 (70,8
EUR/MWh) by using the Russian CPIs from the years 2011 (176,5) and 2013 (196,2)
(OECD 2013).
FTS’s prognosis for the wholesale price of natural gas for industrial consumers in 2013
is DOL 119 per 1000 m3, which can be translated to 9 EUR/MWh (see table 6.3) by
using the currency rate of dollar in table 6.3. The heat price in table 6.3 was calculated
using the heating tariff for district heat in Moscow in 2010 (RUB 1090 per Gcal), which
should be close to the price of heat also in the Leningrad region (Korppoo and
Korobova 2012, 220). Translated to MWh it would be approximately RUB 1268 per
MWh (International Energy Agency), and that converted to euros using the currency
rate for ruble in table 6.3 is EUR 30,1 per MWh. Translated into 2013 values using
Russian CPIs from the years 2010 and 2013, which are 162,8 and 196,2 respectively
(OECD 2013), it would then mean a heat price of EUR 36,3 per MWh (see table 6.3).
According to Abdurafikov (2009, 67), the Russian federal government has set
ambitious renewable energy production targets for the power industry. The state has
planned on giving subsidies in form of fixed regulated premiums on top of normal
market price from producing renewable electricity. This kind of subsidy would affect
the private revenues of the power plant scenarios, but because in social CBA the public
taxes and subsidies sum up to zero, these kinds of subsidies are not taken into account
(Boardman et al. 2006, 55).
The poultry manure used as fuel in scenarios S1 and S2 is assumed to be received free
of charge to the factory gate. This is because by giving the manure to the power plant,
the poultry farm can avoid all final disposal costs and related tipping fees. Also the
poultry farms in the Leningrad region are often large and concentrated in relatively
small area, which would lower collection costs of the manure. According to the PÖYRY

56
(2011b, 11) and HELCOM (2011c, 5), the poultry manure disposal can be significant
cost to the farm. For example, in Russia the basic rate of payment of inappropriate
poultry manure disposal is approximately EUR 12,2 per ton, even though currently the
collection of the payment from farms is not necessarily enforced by the authorities. In
HELCOM (2011c, 9), even an environmental payment as high as 28,3 EUR/ton was
assumed.
Table 6.3. Input and output prices, and currency rates.
Energy prices Unit Value Source
Electricity price €/MWh 70,8 Calculated from FTS 2011
Heat price €/MWh 36,3 Korppoo and Korobova 2012, 220
Natural gas price €/1000m3 89,9 Calculated from FTS 2013
€/MWh 9,0
Mineral prices
Phosphate rock price €/ton 144,6 IndexMundi 2012
Phosphorus (P) price €/ton 0,78 Calculated following Azuara et al. 2013
Phosphorus amount in manure ash
kg/ton 79,12 Calculated from Ramboll (2009) (see Appendix 1)
Phosphorus (P) value in ash €/ton 61,8
Potassium chloride €/ton 357,195 IndexMundi 2012
Potassium (K) price €/kg 0,71439 Calculated following Azuara et al. 2013
Potassium amount in manure ash
kg/ton 89,44 Calculated from Ramboll (2009) (see Appendix 1)
Potassium (K) value in ash €/ton 63,90
Bottom and fly ash price €/ton 125,7
Currency rates per EUR SEK 8,62 ECB 2013
RUB 42,08 ECB 2013
DOL 1,32 ECB 2013
GBP 0,85 ECB 2013
The ash from poultry manure combustion has already proven to be a commercially
traded product. According to Lynch et al. (2013, 203) the composition of ash from FBC
is close to the fertilizer “extra K” by Fibrophos, which also comes from incineration of
57
poultry manure. This “extra K” fertilizer is being sold in England with the price of EUR
234 per ton (average of loads from 10 to 29 tons) (Lime Distributors).
However, there is no direct value or market price for the bottom and fly ash produced
in the scenarios, because the markets for this product in Russia are not developed.
Therefore the ash price from combustion of poultry manure is estimated by calculating
value of phosphorus (P) and potassium (K) in the ash following Azuara et al. (2013,
178). The basic assumptions are that the volume will be reduced to about 10% of the
original mass of the manure, and all P and K in the fresh manure are transported to the
ash. The transportation costs of the ash are not taken into the analysis and the ash is
assumed to be sold at the factory gate. For simplicity reasons all ash is assumed to be
homogenous and have the same concentration of components.
The world monthly average price for phosphate rock was EUR 144,6 per ton in 2012
(IndexMundi 2012), and it contains on average 18,5 % mass friction of phosphorus. The
value of P from this source would then be about 0,78 EUR/kg. According to Azuara et
al. (2013, 178), the ash might be lower quality fertilizer than phosphate rock
considering the phosphorus availability and contaminants, but according to
announcement of Fibrophobos, the P and K in their products is 90 % - 100 % as
effective as in standard phosphate rock and muriate of potash (KCl). Therefore, the ash
is assumed to have the same quality of P and K as the standard phosphate rock and
muriate of potash.
According to Ramboll sample (2009, 76), the manure used as fuel contains 7,9 kg of P
per ton of manure (wet basis) (see Appendix 1). If it is assumed that all the P and K in
the fuel is transported to the ash and that the volume will be reduced to 10% of the
original mass, the P and K concentrations in the ash would be ten times the
concentration in the wet fuel, which would mean a 79,1 kg/ton P content in the ash.
As can be seen from Table 3.1, the P content of the ash from combustion varies in
different studies from 51 to 100 kg per ton. The results from Ramboll (2009, 75-76) fit
well in line with these findings and can be therefore used. The value of P in the ash of
the S1 and S2 would be then 79,12 kg/t * 0,781 EUR/kg = 61,8 EUR/ton.

58
The standard form of potassium (K) traded in the world market is muriate of potash
(Potassium chloride, KCl) which is used as a fertilizer or part of a combination fertilizer
(Indexmundi). The grade of the KCl depends on the potassium superoxide (KO2)
content and its particle size. Agricultural grades are those with 40% to 60% of KO2.
According to Johnston (2003, 5), there is not really any KO2 in the KCl, but it is an
accepted term of announcing the amount of K in fertilizers. The KO2 share in the KCl
can be converted to pure K share by dividing it with 1,2.
The standard grade of KCl contains usually about 60% of KO2 Johnston (2003, 20). The
average monthly price of standard KCL was EUR 357,195 per ton in year 2012. Using
the assumptions above, the price of K from this source would be 0,714 EUR/kg. As with
P, I assume that the K from KCl is as valuable as from the ash of poultry manure
combustion. As in Ramboll sample (2009, 76), I assumed that the manure used as fuel
contains 8,9 kg of K per ton (wet basis) (see Appendix 1). When all K is transported to
the ash, it would mean K content of 89,44 kg/ton in the ash and the value of this would
be 89,44 kg/ton * 0,714 EUR/kg = 63,9 EUR/ton.
As a rough estimate, the bottom and fly ash from the S1 and S2 could be sold at a
price, that is the sum of the values of the P and K it contains, which is 61,8 EUR/ton +
63,9 EUR/ton = 125,7 EUR/ton. Different prices will be tested in the sensitivity analysis.
6.3 Results
6.3.1 Investment costs
The capital costs of the scenarios are presented in Table 6.4 in the prices of the year
2009 and 2013. They cover all mechanical parts, equipment and installation costs of
the power plants. The capital costs are based on Ramboll’s estimates on similar power
plants (Ramboll 2009, 37-38). There are already many different companies that can
produce FBC boilers, and Ramboll’s estimates were based on the offers of Renowa and
Bamag Environment GmbH.
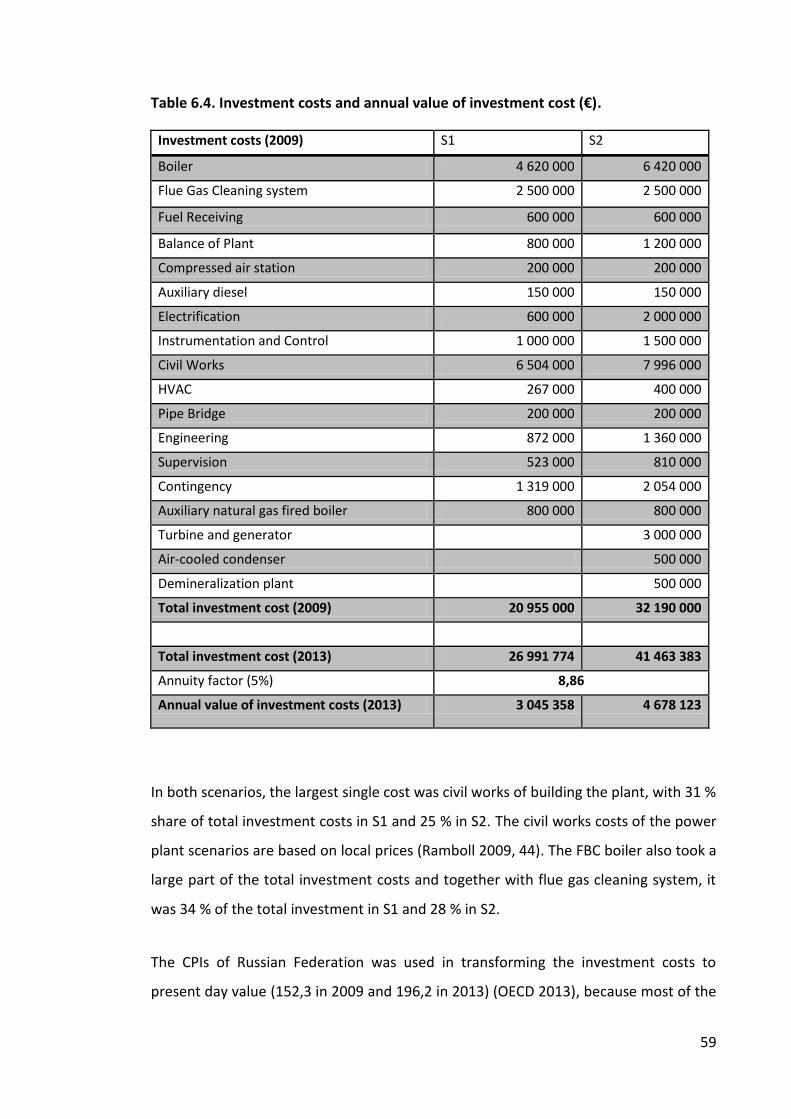
59
Table 6.4. Investment costs and annual value of investment cost (€).
Investment costs (2009) S1 S2
Boiler 4 620 000 6 420 000
Flue Gas Cleaning system 2 500 000 2 500 000
Fuel Receiving 600 000 600 000
Balance of Plant 800 000 1 200 000
Compressed air station 200 000 200 000
Auxiliary diesel 150 000 150 000
Electrification 600 000 2 000 000
Instrumentation and Control 1 000 000 1 500 000
Civil Works 6 504 000 7 996 000
HVAC 267 000 400 000
Pipe Bridge 200 000 200 000
Engineering 872 000 1 360 000
Supervision 523 000 810 000
Contingency 1 319 000 2 054 000
Auxiliary natural gas fired boiler 800 000 800 000
Turbine and generator 3 000 000
Air-cooled condenser 500 000
Demineralization plant 500 000
Total investment cost (2009) 20 955 000 32 190 000
Total investment cost (2013) 26 991 774 41 463 383
Annuity factor (5%) 8,86
Annual value of investment costs (2013) 3 045 358 4 678 123
In both scenarios, the largest single cost was civil works of building the plant, with 31 %
share of total investment costs in S1 and 25 % in S2. The civil works costs of the power
plant scenarios are based on local prices (Ramboll 2009, 44). The FBC boiler also took a
large part of the total investment costs and together with flue gas cleaning system, it
was 34 % of the total investment in S1 and 28 % in S2.
The CPIs of Russian Federation was used in transforming the investment costs to
present day value (152,3 in 2009 and 196,2 in 2013) (OECD 2013), because most of the

60
investment costs are tied to prices in Russia, even though the actual FBC boiler and its
technology would likely be from a EU country were inflation of prices has been more
moderate. Thus the total investment costs in 2013 are approximately EUR 27 million
for S1 and EUR 41,5 million for S2. The investment costs are approximately 35 % higher
in S2 than in S1. That is due to the cost of electricity production turbine, generator and
the extra work in S2, as can be seen from table 6.4. The annuity factor calculated in
table 6.1 was used to convert the total investment costs to annual investment costs.
The annual value of investment costs is approximately EUR 3 million in S1 and EUR 4,7
million in S2.
6.3.2 Annual costs
The annual costs of operating the power plant scenarios are presented in table 6.5.
Following the standard procedures in accounting, repair and maintenance cost, and
insurance costs were calculated as a percentage of the initial investment. Repair and
maintenance costs were assumed to be 2 % of the initial investment for equipment
and 1 % for buildings and also 0,2 % insurance costs was assumed.
Three cost groups had the most significant impact on the total annual costs of
operating in both scenarios. The largest costs came from repair and maintenance of
buildings and equipment (36 % in S1 and 43 % in S2), chemical consumption (28 % in
S1 and 23 % in S2), and fuel (20 % in S1 and 19 % in S2), which in this case is natural
gas.

61
Table 6.5. Operation and maintenance (O&M) costs, annual fuel costs and total
annual costs of operating. Modified from Ramboll 2009, 39.
The total annual costs of operating are in S1 approximately EUR 2,7 million and EUR
3,2 million in S2. The higher O&M costs in S2 arise from higher initial investment cost
and higher consumption of fuel. The total annual O&M costs calculated per ton of
treatment manure would be EUR 28,2 in S1 and EUR 34,0 in S2, assuming both
scenarios use 94 000 tons of manure (see table 6.1).
6.3.3 Annual market revenues
The market revenues from the scenarios are private revenues of the operator of the
power plant. Revenues are received from selling the outputs of the scenarios, which
are heat and ash in S1, and heat, electricity and ash in S2. The market benefits are
calculated in table 6.6 by using the amount of produced outputs from tables 6.1 and
6.2, and relevant prices from table 6.3. If it is assumed that the poultry farm and the
nearby residence would own the power plant, then the revenues from heat and
S1 S2
Operation and maintenance (O&M) costs
€ €/t of burnt manure
€ €/t of burnt manure
Chemical consumption costs 626 823 626 823
Flue gas cleaning costs 73 800 73 800
Comparison measurements 160 000 160 000
Labor 73 000 78 000
Repair and maintenance cost of equipment
419 100 643 800
Repair and maintenance cost of buildings 209 550 321 900
Insurance costs 53 984 82 927
Total O&M costs (2009) 1 616 257 17,2 1 987 250 21,1
Total O&M costs (2013) 2 081 872 22,1 2 559 742 27,2
Annual fuel cost (natural gas) 571498 6,1 637 993 6,8
Total annual costs of operating (2013) 2 653 370 28,2 3 197 735 34,0
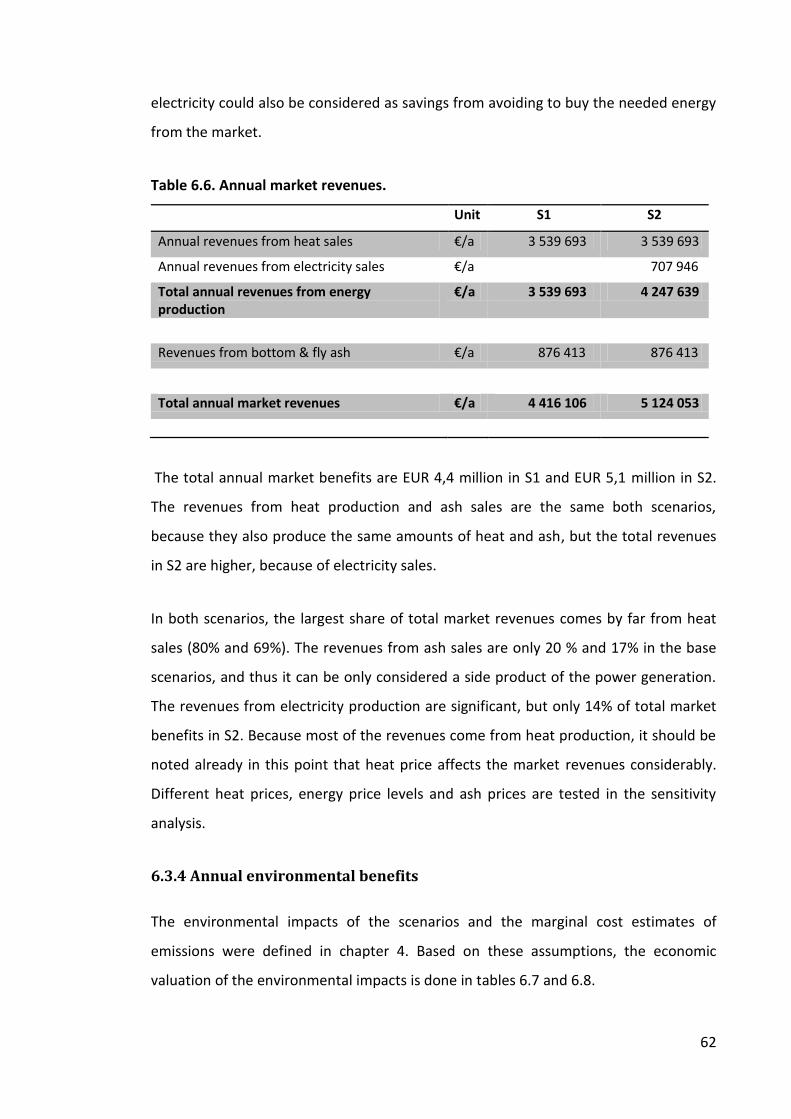
62
electricity could also be considered as savings from avoiding to buy the needed energy
from the market.
Table 6.6. Annual market revenues.
Unit S1 S2
Annual revenues from heat sales €/a 3 539 693 3 539 693
Annual revenues from electricity sales €/a 707 946
Total annual revenues from energy production
€/a 3 539 693 4 247 639
Revenues from bottom & fly ash €/a 876 413 876 413
Total annual market revenues €/a 4 416 106 5 124 053
The total annual market benefits are EUR 4,4 million in S1 and EUR 5,1 million in S2.
The revenues from heat production and ash sales are the same both scenarios,
because they also produce the same amounts of heat and ash, but the total revenues
in S2 are higher, because of electricity sales.
In both scenarios, the largest share of total market revenues comes by far from heat
sales (80% and 69%). The revenues from ash sales are only 20 % and 17% in the base
scenarios, and thus it can be only considered a side product of the power generation.
The revenues from electricity production are significant, but only 14% of total market
benefits in S2. Because most of the revenues come from heat production, it should be
noted already in this point that heat price affects the market revenues considerably.
Different heat prices, energy price levels and ash prices are tested in the sensitivity
analysis.
6.3.4 Annual environmental benefits
The environmental impacts of the scenarios and the marginal cost estimates of
emissions were defined in chapter 4. Based on these assumptions, the economic
valuation of the environmental impacts is done in tables 6.7 and 6.8.

63
Nutrient load reduction benefits
The nutrient load reduction benefits of S1 and S2 are actually avoided damages from
eutrophication related to S0. If the nutrient leakage from manure is as described in
chapter 4 (0,47 kg P / ton of manure and 0,38 kg N / ton of manure), then the avoided
nutrient runoff in the S1 and S2 can be calculated by multiplying the amount of treated
manure with relevant the nutrient leakage (see Table 6.7). The annual benefits from N
and P load reductions are calculated using equation (2), and then summed up to total
annual nutrient load reduction benefits in table 6.7.
Table 6.7. Annual nutrient load reduction benefits of S1 and S2.
Mineral Unit Value
Treated manure ton/a 94 000
Avoided nutrient leakage P kg/ton of manure
0,47
N kg/ton of manure
0,38
Avoided nutrient runoff P kg/a 43 925
N kg/a 35 836
Redfield ratio 7,2
Social marginal cost of N N 8,9
Nutrient load reduction benefits P €/a 2 799 481
N €/a 317 209
P €/ton 29,8
N €/ton 3,3
Total nutrient load reduction benefits
€/a 3 116 690
€/ton of treated manure
33,1
As can be seen from Table 6.7, the total nutrient load reduction benefits of S1 and S2
are annually approximately EUR 3,1 million or EUR 33,1 per ton of treated manure.
Since the estimated tipping fee for poultry manure in Russia was estimated to be at
EUR 12,2 per ton of manure, the results suggest that the tipping fee is not adequate to
cover the costs of nutrient loading of improper manure handling practices in S0. Also,

64
it should be noted that the benefits from P reductions are almost 9 times higher than
from N. This suggests that P should be the focus of nutrient reduction efforts in the
scenarios.
Climate benefits
The carbon offsets and total climate benefits of scenarios S1 and S2 are presented in
table 6.8. The annual carbon offsets are calculated on fuel basis simply by multiplying
the estimated biomass consumption rates from table 6.2 with the natural gas emission
factor of 248 kg CO2/MWh (following Motiva 2004). The total climate benefits from co-
combustion scenarios can be the calculated by multiplying the annual carbon offsets
with the marginal cost of CO2 (EUR 26,06/t CO2–eq.).
Table 6.8. The total annual climate benefits, carbon offsets in S1 and S2, and the
parameters needed for calculation.
Unit S1 S2
Natural gas emission factor kgCO2/MWh 248,00
Marginal cost of CO2 €/t CO2 -eq 26,06
Poultry manure consumption MWh/a 86 500 86 500
Carbon offsets t CO2 -eq 21452 21452
Total climate benefits €/a 559 134 559 134
Using the calculation method above, the total annual climate benefits from S1 and S2
were the same with approximately EUR 560 000. Of course, the total climate benefits
depend on the chosen marginal damage of C02, which is a much debated subject.
Therefore, different marginal climate damage values are tested in the sensitivity
analysis.
Total environmental benefits
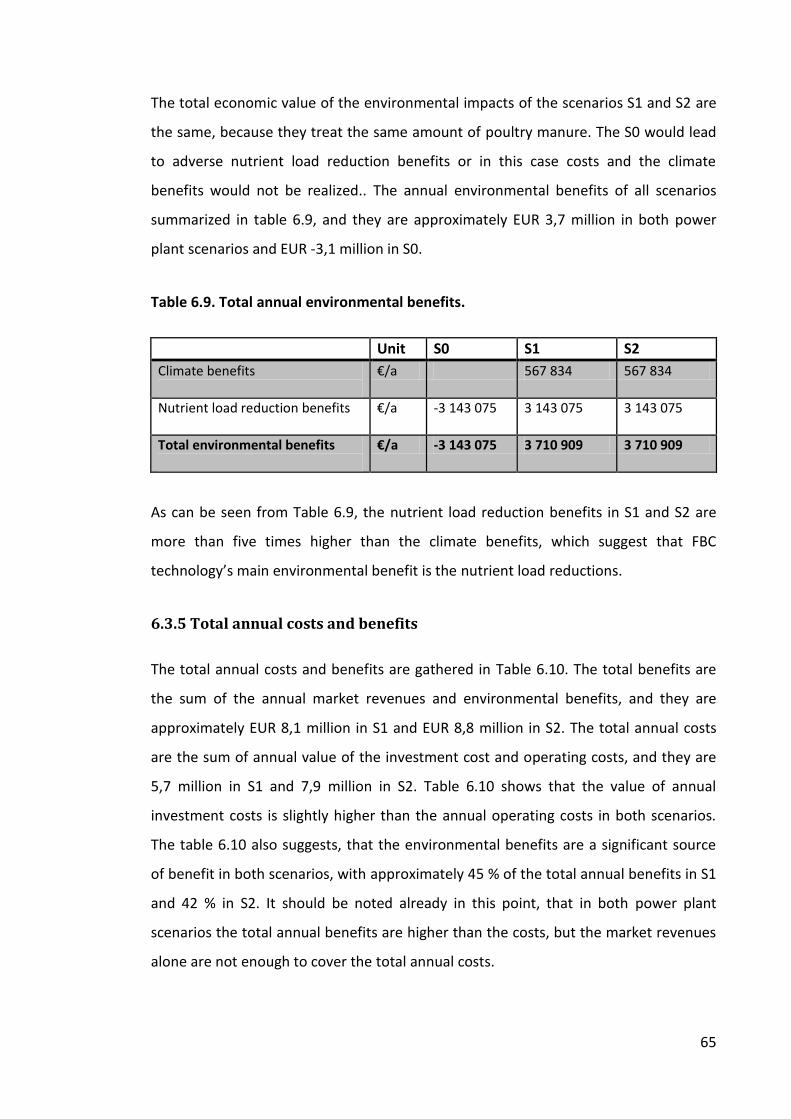
65
The total economic value of the environmental impacts of the scenarios S1 and S2 are
the same, because they treat the same amount of poultry manure. The S0 would lead
to adverse nutrient load reduction benefits or in this case costs and the climate
benefits would not be realized.. The annual environmental benefits of all scenarios
summarized in table 6.9, and they are approximately EUR 3,7 million in both power
plant scenarios and EUR -3,1 million in S0.
Table 6.9. Total annual environmental benefits.
Unit S0 S1 S2
Climate benefits
€/a 567 834 567 834
Nutrient load reduction benefits
€/a -3 143 075 3 143 075 3 143 075
Total environmental benefits
€/a -3 143 075 3 710 909 3 710 909
As can be seen from Table 6.9, the nutrient load reduction benefits in S1 and S2 are
more than five times higher than the climate benefits, which suggest that FBC
technology’s main environmental benefit is the nutrient load reductions.
6.3.5 Total annual costs and benefits
The total annual costs and benefits are gathered in Table 6.10. The total benefits are
the sum of the annual market revenues and environmental benefits, and they are
approximately EUR 8,1 million in S1 and EUR 8,8 million in S2. The total annual costs
are the sum of annual value of the investment cost and operating costs, and they are
5,7 million in S1 and 7,9 million in S2. Table 6.10 shows that the value of annual
investment costs is slightly higher than the annual operating costs in both scenarios.
The table 6.10 also suggests, that the environmental benefits are a significant source
of benefit in both scenarios, with approximately 45 % of the total annual benefits in S1
and 42 % in S2. It should be noted already in this point, that in both power plant
scenarios the total annual benefits are higher than the costs, but the market revenues
alone are not enough to cover the total annual costs.

66
Table 6.10 Total annual costs and benefits (2013).
Unit S0 S1 S2
Annual investment costs
€/a 3 045 358 4 678 123
Annual operating costs €/a 2 653 370 3 197 735
Total annual costs €/a 5 698 728 7 875 858
Market revenues €/a 4 416 106 5 124 053
Environmental benefits €/a -3 143 075 3 675 823 3 675 823
TOTAL annual benefits €/a -3 143 075 8 091 930 8 799 876
6.3.6 NPVs
Although the annual costs and benefits presented above are already valid investment
criteria, the NPVs of the scenarios can be calculated to show the total benefits over the
projects lifetime (Wiesemann, Kuhn and Rustem 2010, 356). The private and social
NPVs of the scenarios are calculated in tables 6.11 and 6.12, using equation (11) (p. 49)
and assuming a discount rate of 5 % and a project life time of 12 years. The private
NPVs were calculated to see if the scenarios are profitable for a private producer or
investor in the current market situation and policy environment. The private NPVs are
calculated without taking into account the environmental benefits.
Table 6.11. Discounted cost and revenues flows and private NPVs of the scenarios.
S0 S1 S2
Market Revenues 0 39 141 062 45 415 767
Total Costs 0 50 509 261 69 805 715
Private NPV 0 -11 368 199 -24 389 947
The private NPVs of S1 and S2 were clearly negative, which means that they are not
profitable for a private investor or producer. However, if one power plant scenario has
to be chosen, S1 would show smaller losses and should thus be carried out.

67
Table 6.12. Discounted total cost and benefit flows and social NPVs, PPs and IRRs of
the scenarios S1 and S2.
S0 S1 S2
Total Benefits 71 720 809 77 995 514
Total Costs 27 624 006 50 509 261 69 805 715
Social NPV -27 624 006 21 211 548 8 189 799
PP (years) - 5,0 7,4
IRR - 17,1 % 8,4 %
The social NPVs of the both power plant scenarios (S1 and S2) were positive, with total
EUR 21,2 million of discounted profits in S1 and 8,2 million in S2. This means, that from
the social point of view, both scenarios are profitable and therefore should be carried
out. When comparing the S1 and S2, S1 should be carried out preferably, since it has a
higher NPV. In turn, the NPV of S0 shows clearly that S0 would yield significant losses
in social level. It should be noted that these losses (EUR 27,6 million), would be even
larger than the losses of the private producer in both of the power plant scenarios. The
internal rate of return (IRR) and payback period (PP) were also calculated as additional
information for decision making in table 7.2. IRR was positive for both power plant
scenarios (17 % in S1 and 8 % in S2) indicating sound investment profitability. PP was 5
years in S1 and 7,4 years in S2.
6.4 Sensitivity analysis
The last phase of CBA is usually the sensitivity analysis (see figure 5.1). The purpose of
sensitivity analysis is to account for the effects of uncertainty about the parameter
estimates and model assumptions (Boardman 2006, 175). I performed a partial
sensitivity analysis, where I examined the sensitivity of the NPVs to 30 % changes in all
the parameters, except interest rate, because it is quite likely that the parameters
would be in that range. I tested interest rates from 2 % to 8 % to make sure, that the
results hold true with relatively high deviation from the base interest rate. Many

68
parameters were tested, from which the most relevant were chosen and
corresponding NPVs are presented in table 6.13.
A 30 % change in nutrient runoff factor, marginal damage from nutrients or nutrient
concentration of fresh manure leads to the same NPV, due to the form of the equation
(2) and the calculation method of the nutrient reduction benefits. Therefore they are
presented together in table 6.13. The importance of different parameters cannot be
read directly from the partial sensitivity analysis because of potentially different risk of
parameter change, but it can still give some indicative results.
The parameters can be divided to environmental and market related parameters.
Environmental parameters depend on the reliability of the natural scientific
information, and they affect only in the social NPVs. Market related parameters are
determined in the market and depend on the uncertainty of the markets. The prices in
the energy markets are often dependent on each other, and thus I included an energy
price parameter to the sensitivity analysis, which assumes that all the energy prices are
totally correlated. It is clear that the price of natural gas affects supply of heat and
electricity in Leningrad region quite directly because it is the marginal energy source in
the region (Abdurafikov 2009, 64), and I also assume that the demand of heat and
electricity does not vary considerably in time. This kind of energy price parameter
affects the NPV in two opposite ways. Higher energy cost would mean cheaper
auxiliary fuel for the power plant but it would also mean reduced revenues from heat
and electricity sales. However, table 6.13 shows that the effect of cheaper fuel is very
minor and the energy sales revenues dominate these effects.
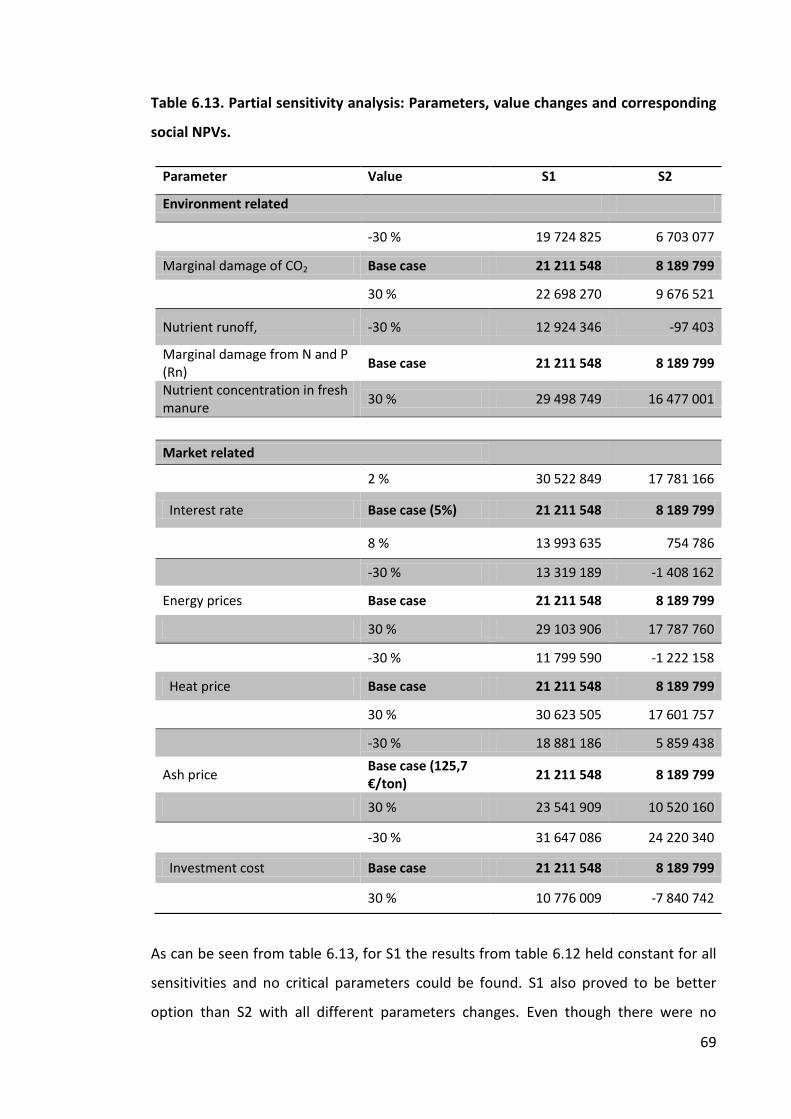
69
Table 6.13. Partial sensitivity analysis: Parameters, value changes and corresponding
social NPVs.
As can be seen from table 6.13, for S1 the results from table 6.12 held constant for all
sensitivities and no critical parameters could be found. S1 also proved to be better
option than S2 with all different parameters changes. Even though there were no
Parameter Value S1 S2
Environment related
-30 % 19 724 825 6 703 077
Marginal damage of CO2 Base case 21 211 548 8 189 799
30 % 22 698 270 9 676 521
Nutrient runoff, -30 % 12 924 346 -97 403
Marginal damage from N and P (Rn)
Base case 21 211 548 8 189 799
Nutrient concentration in fresh manure
30 % 29 498 749 16 477 001
Market related
2 % 30 522 849 17 781 166
Interest rate Base case (5%) 21 211 548 8 189 799
8 % 13 993 635 754 786
-30 % 13 319 189 -1 408 162
Energy prices Base case 21 211 548 8 189 799
30 % 29 103 906 17 787 760
-30 % 11 799 590 -1 222 158
Heat price Base case 21 211 548 8 189 799
30 % 30 623 505 17 601 757
-30 % 18 881 186 5 859 438
Ash price Base case (125,7 €/ton)
21 211 548 8 189 799
30 % 23 541 909 10 520 160
-30 % 31 647 086 24 220 340
Investment cost Base case 21 211 548 8 189 799
30 % 10 776 009 -7 840 742

70
critical parameters for S1, some parameters seem to be more sensitive than others.
The social NPV of S0 remained negative with all the sensitivities (see Appendix 2).
The environmental parameters such as nutrient runoff factor affected the NPVs the
most, except for SCC change, which had only a low effect on the NPVs. Changing the
price of heat had the highest influence to the NPVs of the scenarios, but it is not really
a likely that only the heat price would change and the energy price indicator should be
considered preferably. Therefore, in the case of social NPVs, the most relevant market
parameters were the energy prices, interest rate and investment costs. Partly because
the ash sales revenues were only a small proportion of the total revenues, the ash
price did not have a significant effect on the profitability of either scenario. The
breakeven parameter changes could be calculated by changing one parameter at a
time until the NPV turns to zero. For example if the energy prices in S1 would drop
more than 80 %, which is very unlikely, for the social NPV of S1 to turn into negative.
In S2, a 30 % change in nutrient runoff factor, marginal damage from nutrients and
nutrient concentration of fresh manure would be exactly the breakeven change that
would change the NPV from positive to negative and thus these parameters can be
considered critical for S2. Also heat price, energy prices and investment costs are
critical parameters for S2.
The sensitivities of NPVs for a private producer or investor can be seen in table 6.14. It
shows that the results from table 6.11 are held constant for all sensitivities, and the
NPVs of both scenarios remain negative, and thus not feasible. Only if the energy
prices would rise more than 43 % in S1 and 76 % in S2, the private NPV would turn into
positive. The breakeven heat price would be 36 % (13 EUR/MWh) higher than in the
base scenario for S1 and 78 % (28 EUR/MWh) for S2. Also investment costs would have
to be 33 % lower than in the base case in S1 and 46 % in S2, for the power plant
scenarios to reach profitability.
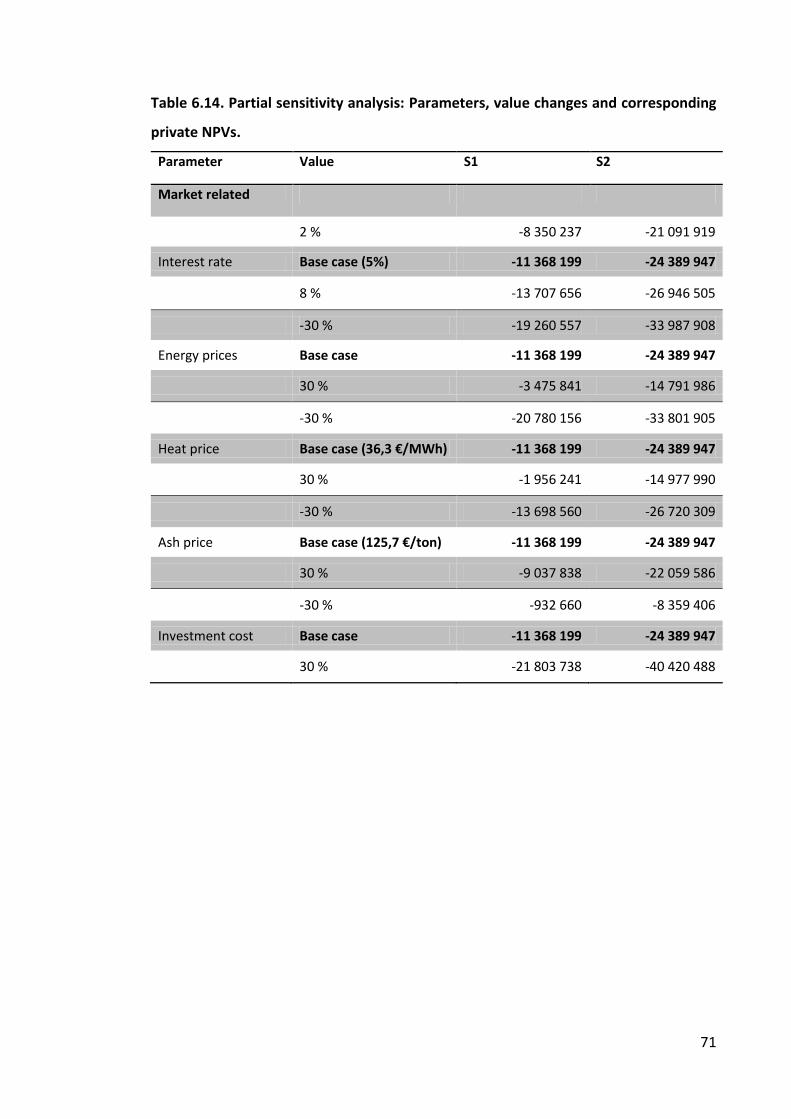
71
Table 6.14. Partial sensitivity analysis: Parameters, value changes and corresponding
private NPVs.
Parameter Value S1 S2
Market related
2 % -8 350 237 -21 091 919
Interest rate Base case (5%) -11 368 199 -24 389 947
8 % -13 707 656 -26 946 505
-30 % -19 260 557 -33 987 908
Energy prices Base case -11 368 199 -24 389 947
30 % -3 475 841 -14 791 986
-30 % -20 780 156 -33 801 905
Heat price Base case (36,3 €/MWh) -11 368 199 -24 389 947
30 % -1 956 241 -14 977 990
-30 % -13 698 560 -26 720 309
Ash price Base case (125,7 €/ton) -11 368 199 -24 389 947
30 % -9 037 838 -22 059 586
-30 % -932 660 -8 359 406
Investment cost Base case -11 368 199 -24 389 947
30 % -21 803 738 -40 420 488

72
7 Conclusions and discussion
The purpose of this master’s thesis was to study the social profitability of combustion
technology as an alternative for poultry manure handling in the Leningrad region. The
method was environmental cost-benefit analysis (ECBA), in which two hypothetical
combustion power plant scenarios and a reference scenario were considered. All
scenarios would treat 94000 tons of manure annually. Scenario 1 (S1) is a combustion
power plant which co-combusts poultry manure and natural gas producing thermal
energy. Scenario 2 (S2) is a combustion power plant which co-combusts poultry
manure and natural gas producing combined heat and power (CHP). Reference
scenario (S0) is a reference point to the power production scenarios and it assumes
that no new power plants are built and that the poultry manure would be disposed
untreated by stockpiling or to lagoons, causing nutrient leaching to the surface waters.
The ECBA took into account the monetary value of the main environmental impacts of
the studied scenarios, which are the nutrient load reductions to the Baltic Sea and
GHG emission reductions. The final objective of the ECBA was to find out if the
scenarios are socially profitable and which one is preferable.
The ECBA showed that from the viewpoint of a private producer or investor and under
the current market conditions and policy environment, the power plant scenarios were
not profitable, although S1 (EUR -11,4 millions) was slightly preferable to S2 (EUR -24,4
millions). However, from the social point of view, both of the power plant scenarios
were found to be profitable. In S1, the net present value (NPV) was EUR 21,2 million
and in S2 EUR 8,2 million. The reference scenario (S0) led to significant social costs,
causing EUR 27,6 million losses to society over the scenarios lifetime. If the scenarios
are considered mutually exclusive, then S1 should be carried out, because it showed
the highest NPV. For S0 and S1, the results held constant under all sensitivities, but for
S2 several critical parameters were found, from which investment cost seemed to be
the most important.

73
The negative private NPVs of the scenarios 1 and 2 suggest that the current renewable
energy subsidies in Russia are not enough for a medium-sized manure burning FBC
power plant to reach profitability, and additional policy instruments are essential in
making poultry manure based power production profitable. Implementation of
economic policy instruments to correct the market failure would be beneficial to all
parties that the main environmental effects concern (Baltic Sea countries), especially
to countries like Sweden and Finland which have been measured to enjoy large
benefits from the Baltic Sea water quality improvement (Markowska and Zylicz 1999,
312).
The results of the sensitivity analysis can be used as guide in developing effecient
policy methods to influence the profitability of the power production from poultry
manure. The policy methods in this case can be divided into two groups. Firstly, to
methods that raise the market revenues and secondly to methods that lower the costs.
The policy methods are implemented by a public planner, which can be the Russian
government or with reservation some other state or organization in the Baltic Sea
region that the environmental effects concern.
Policy methods raising the market revenues in the ECBA would have to raise the price
of the end-products with some form of subsidy. In this case, the most suitable
subsidizing target would be the heat price received from the produced thermal energy,
because revenues from heat had clearly the largest share of the total market revenues.
This kind of policy method would, of course, come to mind only for the Russian
government. In practice, it would mean that the planned biomass subsidy for
electricity production in Russia would be also extended to heat production. The partial
sensitivity analysis revealed that in the studied power plant scenarios, a thermal
energy production subsidy of 13 EUR/MWh in S1 and 28 EUR/MWh in S2 would be
enough to achieve break-even result in the private solution.
The most efficient way of lowering the total costs of the scenarios would be subsidizing
the investment costs of the power plants, because investment costs affect the total
costs both directly and indirectly through O&M costs. Furthermore, the sensitivity
74
analysis revealed that the NPVs were most sensitive to investment cost changes. The
direct investment subsidies to make the studied scenarios reach private profitability
would be approximately EUR 8,9 million for S1 (33% of the investment) and EUR 19,0
million for S2 (46 % of the investment) respectively. Giving direct investment subsidies
is a somewhat simple policy method to influence the market and thus even parties
outside Russia could be able use them. Investment subsidies can be also easily directed
close to the farms that have the most severe problems in manure management, in
order to achieve the most cost-effective nutrient runoff reductions.
In addition to the policy methods mentioned above, the profitability of the reference
scenario can be influenced by tipping fees to poultry manure, and better enforcement
of the existing regulation. At the moment, leaving 94 000 tons of manure untreated
would cause EUR 3,2 million annual costs to society. Adequate tipping fees would
make sound poultry manure treatment technologies more attractive and the poultry
producers might even pay to get rid of the manure.
All policy methods mentioned above are possible, but maybe not likely because their
practical implementation is heavily depended on the attitudes of Russian government.
Although Russia has been part of the agreement to improve the state of the Baltic Sea,
the concrete measures have so far been minor. The underlying problem in Russia has
been that the environmental institutions have eroded in the past decades and
environmental problems have not been high on the government agenda (Mol 2009,
232). Nevertheless the attitudes might be slowly chancing since Russian Federation has
announced new quite ambitious goals for renewable energy production (Abdurafikov
2009, 67). If Russian government is not going to be a significant part of the solution for
manure management in the Leningrad region, similar arrangements like in building the
St. Petersburg waste water treatment plant, which was mainly financed with foreign
assistance, could be considered (Nechiporuk et al 2011, 48).
In the future it would be interesting to see studies that would consider different
qualities and quantities of treated manure, because the composition of the manure
affects the results of the combustion greatly. In the ECBA, I had to assume that the

75
incinerated poultry manure is quite wet and therefore not perfectly suited for
combustion. One suggestion for a topic of study could be to see how additional
investment to drying the manure would influence the combustion process and
profitability. Also a larger scale study would be interesting, because the investment
cost data was limited due to reluctance of producers to give offers on such a small
scale operation (Ramboll 2009, 25).
In both scenarios, the largest share of total market benefits comes from heat sales
(80% in S1 and 69% in S2). Therefore should be made sure that the poultry farm and
the nearby residents really have a sufficient demand to be able to buy all the produced
heat. It should be also emphasized that the primary environmental benefits from the
scenarios came from reductions of P emissions. Therefore, when choosing the
technology for manure treatment in the Leningrad region, the main focus should be on
the potential P emission reductions from the poultry manure to the ground and
surface waters.
The underlying goal of was to search for options to reduce nutrient loading from
Leningrad region to the Baltic Sea and promote the utilization of manure as a
renewable energy source. FBC technology was proved to be, under the given
restrictions, socially profitable and thus a potential candidate when considering
different alternatives for poultry manure handling in the Leningrad region. In the
studied power plant scenarios, the nutrient reduction benefits were the crucial factor
that made the scenarios socially profitable. The climate benefits from poultry manure
FBC were also significant although moderate if compared to the eutrophication
benefits. If the future focus of policies is to reduce nutrient loads from poultry manure
in the Leningrad region, then FBC technology seems to be an effective way to meet
that goal.
76
References
Abdurafikov, R. 2009. Russian electricity market, Current state and perspectives. VTT
Technical Research Centre of Finland. Available online:
http://www.vtt.fi/inf/pdf/workingpapers/2009/W121.pdf. Checked 12.9.2013.
Abelha, P., Gulyurtlu, I., Boavida, D., Seabra Barros, J., Cabrita, I., Leahy, J., Kelleher, B.
and Leahy, M. 2003. Combustion of poultry litter in a fluidised bed combustor. Fuel 82
(6), 687–692.
Azuara, M., Kersten, S.R.A. and Kootstra, A.M.J. 2013. Recycling phosphorus by fast
pyrolysis of pig manure: Concentration and extraction of phosphorus combined with
formation of value-added pyrolysis products. Biomass and Bioenergy 49, 171 - 180.
Bank of Finland. 2013. Currency rates, monthly averages from year 2013. Available
online:
http://www.suomenpankki.fi/fi/tilastot/valuuttakurssit/Pages/tilastot_valuuttakurssit
_valuuttakurssit_short_fi.aspx. Checked 18.12.2013
Baumol, W. J. and Oates, W. E. 1988. The theory of environmental policy. 2nd edition.
Cambridge: Cambridge University Press.
Boardman, B., Greenberg, D., Vining, A. and Weimer, D. 2001. Cost-Benefit Analysis –
Concepts and Practice. 2nd ed. Prentice Hall Inc., Upper Saddle River, New Jersey,USA.
Bonsdorff, E., Rönnberg, C. and Aarnio, K. 2002. Some ecological properties in relation
to eutrophication in the Baltic Sea. Hydrobiologia 475-476 (1), 371-377.
Cantrell, K., Ro, K., Mahajan, D., Anjom, M. and Hunt, G. 2007. Role of thermochemical
conversion in livestock waste-to-energy treatments: obstacles and opportunities.
Industrial & Engineering Chemistry Research 46, 8918–8927.

77
Cantrell, K., Ducey, T., Ro, K. and Hunt, P. 2008. Livestock waste-to-bioenergy
generation opportunities. Bioresource Technology 99 (17), 7941-7953.
CBRF 2013. Central Bank of the Russian Federation 2013. Refinancing Rate of the
Central Bank of the Russian Federation. Available online:
http://www.cbr.ru/eng/print.asp?file=/eng/statistics/credit_statistics/refinancing_rate
s_e.htm. Checked 11.11.2013
Codling, E., Chaney, R.L. and Sherwell, J. 2002. Poultry litter ash as a potential
phosphorus source for agricultural crops. Journal of Environmental Quality 31 (3), 954–
961.
Edwards, D.R., Daniel, T.C. 1992. Environmental impacts of on-farm poultry waste
disposal – a review. Bioresource Technology 41, 9–33.
EPR. 2013. Energy Power Resources Ltd. Available online: http://www.eprl.co.uk/.
Checked 9.8.2013.
EU Directive 90/667/EEC. Council Directive 90/667/EEC of 27 November 1990 laying
down the veterinary rules for the disposal and processing of animal waste, for its
placing on the market and for the prevention of pathogens in feedstuffs of animal or
fish origin and amending Directive 90/425/EEC. Available online: http://eur-
lex.europa.eu/LexUriServ/LexUriServ.do?uri=CELEX:31990L0667:EN:HTML. Checked
11.10.13.
EU Directive 2000/76/EC. Directive 2000/76/EC of the European Parliament and of the
council of 4 December 2000 on the incineration of waste. Official Journal of the
European Communities. Available online: http://eur-
lex.europa.eu/LexUriServ/LexUriServ.do?uri=OJ:L:2000:332:0091:0111:EN:PDF.
Checked 12.9.2013.

78
Eurofins Viljavuuspalvelu Oy 2009. Lantatilastot vuosilta 2006-2009. Available online:
http://www.viljavuuspalvelu.fi/sites/default/files/sites/default/files/tilastot/Lantatilast
o%202005%20-%202009.pdf. Checked 13.12.13.
European Commission. 2002. Guide to cost-benefit analysis of investment projects.
Available online:
http://ec.europa.eu/regional_policy/sources/docgener/guides/cost/guide02_en.pdf.
Checked 9.11.2013.
FIAA. 2011. Making the Baltic Sea Action Plan workable: A nutrient trading scheme
Governing the blue-green Baltic Sea. FIAA Report 31. The Finnish Institute of
International Affairs.
Font-Palma, C. 2012. Characterisation, kinetics and modelling of gasification of poultry
manure and litter: An overview. Energy Conversion and Management 53, 92–98.
Forster, P., Ramaswamy, V., Artaxo, P., Berntsen, T., Betts, R., Fahey, D.W., Haywood,
J., Lean, J., Lowe, D.C., Myhre, G., Nganga, J., Prinn, R., Raga, G., Schulz, M. and Van
Dorland, R. 2007. Changes in Atmospheric Constituents and in Radiative Forcing. Table
2.14. In: Climate Change 2007: The Physical Science Basis. Contribution of Working
Group I to the Fourth Assessment Report of the Intergovernmental Panel on Climate
Change. Cambridge University Press, Cambridge, United Kingdom and New York, NY,
USA.
Freeman, A. M. 2003. The Measurement of Environmental and Resource Values:
Theory and Methods. Resources for the Future. Washington, DC.
Federal Statistical Service of Russia. 2009. Livestock inventory. Available online:
http://www.gks.ru/wps/wcm/connect/rosstat_main/rosstat/en/figures/agriculture/.
Checked 7.12.2013.
FTS. 2010. Federal Tariff Service 2012. Tariff rates for electric power provided for
population in 2009–2011 (kop./kWh). Available online:

79
http://www.fstrf.ru/eng/tariffs/analit_info/electro/n/electro3_n.png. Checked
16.12.2013.
FTS. 2013. Dynamics of gas wholesale prices for industrial consumers. Federal Tariff
Service prognosis 2013. Available online:
http://www.fstrf.ru/eng/tariffs/analit_info/gas/gaz3.png. Checked 16.12.2013.
Gren, I.-M., Söderqvist, T. and Wulff, F. 1997. Nutrient reductions to the Baltic Sea:
Ecology, costs and benefits. Journal of Environmental Management, 51, 123-143.
Gren, I.-M. 2001. International versus National Actions against Nitrogen Pollution of
the Baltic Sea. Environmental and Resource Economics 20 (1), 41–59.
HELCOM. 2007. Baltic Sea Action Plan. Baltic Sea Environment Proceedings. Available
online: http://www.helcom.fi/BSAP/ActionPlan/en_GB/ActionPlan/. Checked
14.8.2012.
HELCOM. 2009. Eutrophication in the Baltic Sea – An integrated thematic assessment
of the effects of nutrient enrichment and eutrophication in the Baltic Sea region. Baltic
Sea Environment Proceedings, No. 115B.
HELCOM. 2010a. BALTHAZAR project 2009-2010: Reducing nutrient loading from large
scale animal farming in Russia. Available online:
http://www.helcom.fi/stc/files/Publications/OtherPublications/agricultural_full_englis
h.pdf. Checked 1.8.2013.
HELCOM. 2010b. BALTHAZAR Screening report. Summary of the water sampling
activities and results of the Balthazar project – Potential impact of selected priority
farms in the Leningrad region. Available online:
http://www.helcom.fi/stc/files/Projects/BALTHAZAR/8new-sampling-LO.pdf. Checked
1.8.2013.

80
HELCOM. 2011a. BALTHAZAR Pilot project report: Lessons learned and future
perspectives of sustainable manure utilisation at the poultry industry – case study of
the poultry factory Primorskaya in the Leningrad Region. Available online:
http://www.helcom.fi/stc/files/Projects/BALTHAZAR/12new-primoskaya-proagria.pdf.
Checked 9.8.2013.
HELCOM. 2011b. The Fifth Baltic Sea Pollution Load Compilation, PLC-5. Baltic Sea
Environment Proceedings, No. 128. Available online:
http://www.helcom.fi/Lists/Publications/BSEP128A.pdf. Checked 13.12.2013
HELCOM. 2011c. A comparative study of the technical solutions for conversion of
chicken manure into fertilizer products at poultry farm Primorskaya in the Leningrad
Region. Available from http://www.helcom.fi/stc/files/Projects/BALTHAZAR/11new-
primorskaya-Proagria.pdf. Checked 9.9.2013.
Helsingin Sanomat. 14.6.2012. Kanankakkapommi jäi suutariksi. Available online:
http://www.hs.fi/digilehti/paakirjoitukset/Kanankakkapommi+j%C3%A4i+suutariksi/a1
339554155566?src=haku&ref=arkisto%2F. Checked 18.9.2012.
IPCC. 2007. Changes in Atmospheric Constituents and in Radiative Forcing. Table 2.14.
Intergovernmental Panel on Climate Change 2007. Available online: Checked
26.9.2013.
Henihan, A.M., Leahy, M.J., Leahy, J.J., Cummins, E. and Kelleher, B.P. 2003. Emissions
modeling of fluidised bed co-combustion of poultry litter and peat. Bioresource
Technology 87, 289-294.
International Energy Agency. Unit converter. Available online:
http://www.iea.org/stats/unit.asp. Checked 16.12.2013.
ISO 14040:2006. Environmental management -- Life cycle assessment -- Principles and
framework.

81
Jenkins, B.M,. Baxter, L. L. and Miles Jr, T.R. 1998. Combustion properties of biomass.
Fuel Processing Technology 54, 17–46.
Johnston, A.E. 2003. Understanding potassium and its use in agriculture. European
Fertilizer Manufacturers Association. Available online:
http://www.pda.org.uk/others/pdf/EFMA_Potassium_booklet_2003.pdf. Checked
11.11.2013.
Kelleher, B.P., Leahy, J.J., Henihan, A.M., O’Dwyer, T.F., Sutton, D. and Leahy, M.J.
2002. Advances in poultry litter disposal technology – a review. Bioresource
Technology 83, 27–36.
Khan, A., Johng, W., Jansens, P.J. and Spliethoff, H. 2009. Biomass combustion in
fluidized bed boilers: potential problems and remedies. Fuel Processing Technology 90,
21–50.
Korppoo, A. and Korobova, N. 2012. Modernizing residential heating in Russia: End-
use practices, legal developments, and future prospects. Energy Policy 42, 213–220.
Kuosmanen, T. and Kortelainen, M. 2007. Valuing environmental factors in cost–
benefit analysis using data envelopment analysis. Ecological Economics 62, 56-65.
Kuosmanen, T., Bijsterbosch, N. and Dellink, R. 2009. Environmental cost–benefit
analysis of alternative timing strategies in greenhouse gas abatement: A data
envelopment analysis approach. Ecological Economics 68, 1633-1642.
Lankoski, J., Ollikainen, M. and Uusitalo P. 2006. No-till technology: benefits to farmers
and the environment? Theoretical analysis and application to Finnish agriculture.
European Review of Agricultural Economics 33, 193–221.
Lantz, M. 2012. The economic performance of combined heat and power from biogas
produced from manure in Sweden – A comparison of different CHP technologies.
Applied Energy 98 502–511.
82
Lappi, P., Ollikka, K., Ollikainen, M. 2010. Optimal fuel-mix in CHP plants under a
stochastic permit price: Risk-neutrality versus risk-aversion. Energy Policy 38, 1079-
1086.
Lime Distributors. Fibrophos Price. Extra K. Available online:
http://www.limedistributors.co.uk/fibrophos.htm. Checked 20.10.2013.
Lopez-Ridaura, S., Werf H., Paillat, JM. and Le Bris, B. 2009. Environmental evaluation
of transfer and treatment of excess pig slurry by life cycle assessment. Journal of
Environmental Management 90 (2), 1296-304.
Lynch, D., Henihan, A.M., Bowen, B., Lynch, D., McDonnel, K., Kwapinski, W. and Leahy,
J.J. 2013. Utilisation of poultry litter as an energy feedstock. Biomass and Bioenergy 49,
197-204.
Matilda Maataloutilastot 2010, Kotieläinten lukumäärät keväällä 2010. Available
online: http://www.maataloustilastot.fi/kotielainten-lukumaarat-kevaalla-2010_fi .
Checked 13.11.2013.
Mandell S. 2011. Carbon emission values in cost benefit analyses. Transport Policy 18
(6), 888-892.
Markowska, A. and Zylicz, T. 1999. Costing an international public good: the case of the
Baltic Sea. Ecological Economics 30, 301-316.
McIlveen-Wright, D.R., Huang, Y., Rezvania, S. and Wang Y. 2007. A technical and
environmental analysis of co-combustion of coal and biomass in fluidised bed
technologies. Fuel 86, 2032-2042.
McIlveen-Wright, D.R., Huang, Y., Rezvani, S., Mondo, J.D, Redpath, D., Anderson, M.,
Hewitt, N.J., Williams, B.C. 2011. A Techno-economic assessment of the reduction of
carbon dioxide emissions through the use of biomass co-combustion. Fuel 90 (1), 11-
18.
83
McIlveen-Wright, D.R., Huang, Y., Rezvani, S., Redpath, D., Anderson, M., Dave, A.,
Hewitt, N.J. 2013. A technical and economic analysis of three large scale biomass
combustion plants in the UK. Applied Energy 112, 396-404.
McKendry, P. 2002. Energy production from biomass (part 2): conversion technologies.
Bioresource Technology 83, 47–54.
McKinsey & Company. 2009. Pathways to an energy and carbon efficient Russia.
Opportunities to increase energy efficiency and reduce greenhouse gas emissions.
Available online:
/http://www.mckinsey.com/en/Clienty/_/y/CO2_Russia_ENG_final.ashxS. Checked:
11.11.2013.
Mikkola, H., Puumala, M., Kallioniemi, M., Grönroos, J., Nikander, A. and Holma, M.
2002. Paras käytettävissä oleva tekniikka kotieläintaloudessa. Suomen ympäristö 564.
Helsinki. Available online:
https://helda.helsinki.fi/bitstream/handle/10138/40464/SY_564.pdf?sequence=1.
Checked 22.5.2013.
Mol, A. 2009. Environmental Deinstitutionalization in Russia. Journal of Environmental
Policy & Planning 11 (3), 223-241. Special Issue: The Project State.
Motiva. 2004. Yksittäisen kohteen CO2 -päästöjen laskentaohjeistus sekä käytettävät
CO2-päästökertoimet. Available online:
http://motiva.fi/files/209/Laskentaohje_CO2_kohde_040622.pdf. Checked 20.5.2013.
Motiva. 2010. Polttoaineiden lämpöarvot, hyötysuhteet ja hiilidioksidin
ominaispäästökertoimet sekä energian hinnat. Energiatehokkuus-sopimukset.
Available online:
http://www.motiva.fi/files/3193/Polttoaineiden_lampoarvot_hyotysuhteet_ja_hiilidio
ksidin_ominaispaastokertoimet_seka_energianhinnat_19042010.pdf. Checked
20.5.2013.

84
Nechiporuk, D., Nozhenko, M. and Belokurova, E. 2011. Russia – a special actor in
Baltic Sea environmental governance. Governing the blue-green Baltic Sea. Societal
challenges of marine eutrophication prevention. Finnish Institute of International
Affairs, Report 31.
NEFCO. 2010. Improving manure management in poultry factories in Leningrad region.
NEFCO Report 1. Available online http://www.nib.int/filebank/2267-
NIB_LeningradOblast.pdf Checked: 13.11.2013
Nicholson, F. A., Chambers, B. J. and Smith, K. A. 1996. Nutrient composition of poultry
manures in England and Wales. Bioresource Technology 58, 279-284.
OECD. 2013. OECD Statistics. Consumer price indices. Available online:
http://stats.oecd.org/index.aspx?querytype=view&queryname=221#. Checked:
1.10.2013
Pearce, D., Turner, R.K., 1990. Economics of Natural Resources and the Environment.
Harvester Weats Leaf, Hertfordshire.
Poritosh, R., Daisuke, N., Takahiro, O., Qingyi, X., Hiroshi, O., Nobutaka, N. and Takeo,
S. 2009. A review of life cycle assessment (LCA) on some food products. Journal of
Food Engineering 90, 1–10.
Prapaspongsa, T., Christensen, P., Schmidt, J. and Thrane, M. 2010. LCA of
comprehensive pig manure management incorporating integrated technology systems.
Journal of Cleaner Production 18, 1413-1422.
PRIMER. 2009. Identification of Priority Measures to Reduce Eutrophication from
North-West Russia into the Gulf of Finland. Finnish Environment Institute 2009.
PÖYRY. 2011a. Summary Report, Preparation of a Business Plan for Improving Manure
Management in Poultry Factories in the Leningrad Region, Russia. Available online:

85
http://www.nefco.org/sites/nefco.viestinta.org/files/BPs%20for%20Manure%20Mgmt
_%20Summary%20Report_Volume%20I_Eng_20111018.pdf. Checked: 11.11.2013.
PÖYRY. 2011b. Preparation of a business plan for improving manure management in
poultry factories in the Leningrad region task 3: updating the legislative requirements
and related environmental costs. Available on request from NEFCO.
Quiroga, G., Castrillón, L., Fernández-Nava, Y. and Marañón, E. 2010. Physico-chemical
analysis and calorific values of poultry manure. Waste Management 30 (5), 880-884.
Ramboll. 2009. Muoniovaara, M., Aittola, J.-P., Hakala, H., Jalovaara, J., Kettunen, A.
and Lommi, M. Preparation of Technical Concept for the Incineration of Chicken
Manure in Leningrad Oblast/01.12.2008.
Ro, K., Cantrell, K., Elliott, D.C. and Hunt, P.G. 2007. Catalytic wet gasification of
municipal and animal wastes. Industrial & Engineering Chemistry Research 46, 8839-
8845.
Sáez C.,A., Requena, J., C. 2007. Reconciling sustainability and discounting in Cost–
Benefit Analysis: A methodological proposal. Ecological Economics, 60, 712-725.
Sami, M., Annamalai, K. and Woodridge, M., 2001. Co-firing of coal and biomass fuel
blends. Progress in Energy and Combustion Science 27, 171–214.
Sharpley, A., Moyer, B., 2000. Phosphorus forms in manure and compost and their
release during simulated rainfall. Soil Science Society of America Journal 29, 1462-
1469.
Sharpley, A. N. 2013. Agriculture, Nutrient Management, and Water Quality.
Encyclopedia of Biodiversity. 2nd ed. 95-110.
86
Sims, J.T., Edwards, A.C., Schoumans, O.F. and Simard, R.R. 2000. Integrating soil
phosphorus testing into environmentally based agricultural management practices.
Journal of Environmental Quality 29, 60–71.
Statistics of Finland. 2011. Statistics: Fuel classification and emissions coefficients.
Available online: http://www.stat.fi/tup/khkinv/khkaasut_polttoaineluokitus.html.
Checked: 13.9.2013.
Szogi, A. A. and Vanotti, M.B. 2009. Prospects for phosphorus recovery from poultry
litter. Bioresource Technology, 100, 5461-5465.
Tol, R.S.J. 2005. The marginal damage costs of carbon dioxide emissions: an
assessment of the uncertainties. Energy Policy 33, 2064-2074.
Tol, R.S.J. 2008. The social cost of carbon: trends, outliers and catastrophes.
Economics: The Open-Access, Open-Assessment E-Journal, 2, 1–24.
Tol, R. S. J. 2011. The Social Cost of Carbon. Annual Review of Resource Economics 3
(1), 419-443.
USDA 2010. United States Department of agriculture. Foreign Agricultural Service.
Global agricultural information network. Russian Federation Poultry and Products
Semi-annual, Big moves to Self-sufficiency. Available online:
http://gain.fas.usda.gov/Recent%20GAIN%20Publications/Poultry%20and%20Products
%20Semi-annual_Moscow_Russian%20Federation_4-16-2010.pdf Checked 7.11.2013
Vahtera, E., Conley, D.J., Gustafsson, B.G., Kuosa, H., Pitkänen, H., Savchuk, O.P.,
Tamminen, T., Viitasalo, M., Voss, M., Wasmund, N. and Wulff, F. 2007. Internal
ecosystem feedbacks enhance nitrogen-fixing cyanobacteria blooms and complicate
management in the Baltic Sea. Ambio 36, 186–194.
Wihersaari, M. 2005. Greenhouse gas emissions from final harvest fuel chip production
in Finland. Biomass and Bioenergy 28, 435-443.

87
Ympäristöhallinnon ohjeita 1/2010, Ympäristönsuojelu, s. 112. Ympäristöministeriö.
ISBN 978-952-11-3725-9. Available online: http://www.ym.fi/fi-
FI/Ajankohtaista/Julkaisut/Ymparistohallinnon_ohjeita_OH Checked 12.9.2013.
Zhu, S. and Lee, S. W. 2005. Co-combustion performance of poultry wastes and natural
gas in the advanced Swirling Fluidized Bed Combustor (SFBC). Waste Management 25
(5), 511-518.
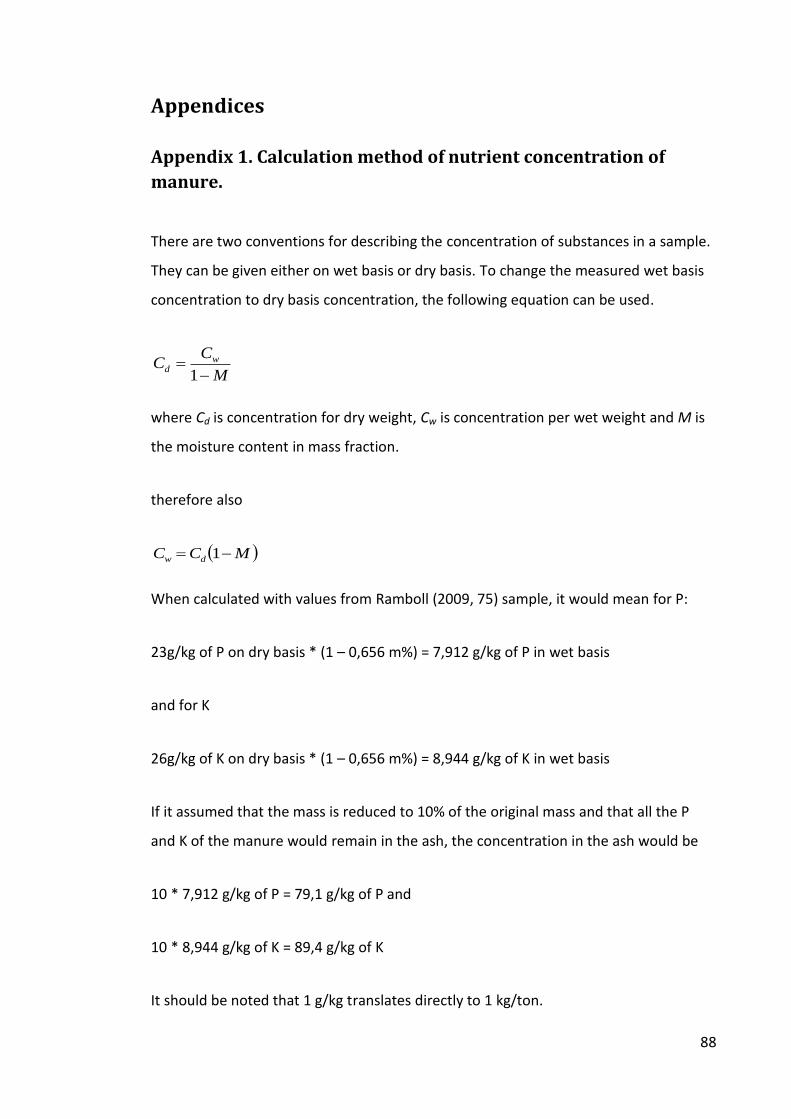
88
Appendices
Appendix 1. Calculation method of nutrient concentration of
manure.
There are two conventions for describing the concentration of substances in a sample.
They can be given either on wet basis or dry basis. To change the measured wet basis
concentration to dry basis concentration, the following equation can be used.
M
CC w
d
1
where Cd is concentration for dry weight, Cw is concentration per wet weight and M is
the moisture content in mass fraction.
therefore also
MCC dw 1
When calculated with values from Ramboll (2009, 75) sample, it would mean for P:
23g/kg of P on dry basis * (1 – 0,656 m%) = 7,912 g/kg of P in wet basis
and for K
26g/kg of K on dry basis * (1 – 0,656 m%) = 8,944 g/kg of K in wet basis
If it assumed that the mass is reduced to 10% of the original mass and that all the P
and K of the manure would remain in the ash, the concentration in the ash would be
10 * 7,912 g/kg of P = 79,1 g/kg of P and
10 * 8,944 g/kg of K = 89,4 g/kg of K
It should be noted that 1 g/kg translates directly to 1 kg/ton.

89
Appendix 2. Partial sensitivity analysis: Parameters, value
changes and corresponding social NPV of S0.
Parameter Value S0
Environment related
Marginal damage from N and P (Rn) -30 % -2 740 816
Nutrient run-off Base case -3 675 823
Nutrient concentration in fresh manure
30 % -4 610 830