Social Interaction Effects in the Laboratory and Society: Conformism
35
Social Interaction Effects in the Laboratory and Society: Conformism and Reciprocity in Public Good Provision By Nicholas Bardsley † and Rupert Sausgruber ‡ DRAFT – please don’t quote without permission † University of Nottingham, UK: [email protected] ‡ University of Innsbruck, Austria: [email protected] * Acknowledgements. The authors would like to thank Professor Frans van Winden plus participants in informal seminars at CREED, the University of Amsterdam and New York University for helpful comments. The experiments were conducted while Bardsley was a member of the ENDEAR research group at CREED, the University of Amsterdam, and were funded by ENDEAR.
Transcript of Social Interaction Effects in the Laboratory and Society: Conformism

Social Interaction Effects in the Laboratory and Society:
Conformism and Reciprocity in Public Good Provision
By Nicholas Bardsley† and Rupert Sausgruber‡
DRAFT – please don’t quote without permission
† University of Nottingham, UK: [email protected]‡ University of Innsbruck, Austria: [email protected]
* Acknowledgements. The authors would like to thank Professor Frans van Winden plus
participants in informal seminars at CREED, the University of Amsterdam and New York
University for helpful comments. The experiments were conducted while Bardsley was a
member of the ENDEAR research group at CREED, the University of Amsterdam, and were
funded by ENDEAR.

2
Social Interaction Effects in the Laboratory and Society: Conformism and
Reciprocity in Public Good Provision
Abstract
People contribute more to public goods, the more others give (“crowding-in”). We investigate
two possible causes of crowding-in: reciprocity, the usual explanation, and conformism, a
neglected alternative. The issue is important since conformism has more scope to bring about
endogenous social interaction effects outside the laboratory. We use Bardsley’s (2000)
Conditional Information Lottery design to control “others’ behaviour” without deception. We
observe how contributions correlate within a group and between groups. Our main result is
that conformism does cause crowding-in. The common presumption of reciprocity therefore
deserves to be questioned, even in the laboratory.
Keywords: public goods, reciprocity, conformism, social interaction, deception
JEL-codes: C9, C92, H41
1 Introduction
Experiments on voluntary contributions to public goods have found, inter alia, that there is a
positive correlation between the amount people contribute and expected contributions from
others (see, for example, Croson 1998, Keser and van Winden 2000, and Fischbacher et al.
2001). This fact is referred to as the “crowding-in” of voluntary contributions.1 Further, there
is evidence about the direction of causation (Weimann 1994, Bardsley 2000): low
contributions from others cause low contributions in response; it is not just that subjects
believe their own contributions to be representative. Field studies of voluntary contributions
also frequently find crowding-in, in contrast to the strict crowding-out prediction of economic
theory. We believe that both methods are picking up the same phenomenon. It is an intriguing
one because crowding-in is at odds with altruism, the economist’s stock departure from the
self-interest assumption, in either its pure or impure (warm-glow) varieties. Altruism predicts
crowding-out, that someone contributes less rather than more as others contribute more
1 We define “crowding-in” as the fact that 0>∂∂
−i
iG
g , where gi is the contribution of individual i, and G-i
denotes the sum of others’ contributions. gi is assumed to be a function of, inter-alia, others’ contributions andthe productivity of the public good, defined here by equation 1 in the main text.

3
(Sugden 1984) while the motive of warm glow giving is self-centered and therefore
independent of others’ behaviour (Andreoni 1998).2
Economists have proposed theories of reciprocity that provide a straightforward explanation
of crowding-in (see Sugden (1984) and Rabin (1993) and, for a recent survey, Falk and Fehr
2002). According to reciprocity theories, if enough contributions are made towards the public
good by others, the individual will feel obliged to make contributions in return. Conversely, if
the benefit from the public good turns out to be low because others do not contribute much, he
or she will feel entitled to withhold contributions. So reciprocity predicts crowding-in. Note
that the crowding-in prediction also implies one of uniformity in public good provision; if
there is enough crowding-in then in equilibrium agents will be making similar contributions.
For this reason, some economists (Falk and Fischbacher 2002, Gächter et al. 2002) have
recently posited reciprocity as a plausible mechanism for bringing about a variety of
endogenous “social interaction effects”. For the purposes of this article, these are understood
as processes by which agents who share membership of a particular group come to exhibit
similar behaviour. “Endogenous” restricts these processes to those that come about through
the behaviour of the agents, rather than through their prior characteristics. An often cited
example is the correlation of criminal activity within a neighbourhood, after controlling for
known social and economic determinants of crime (Glaeser et al. 1996, Case and Katz 1991).
We wish to concentrate on another possible explanation of crowding-in, however, which has
thus far been largely ignored by both economic theorists and experimentalists. A positive
correlation between individuals’ contributions might show conformism, that is, imitative
behaviour, not reciprocity.3 It is central to the economist’s notion of reciprocal motives that
others’ behaviour matters through its effect on the individual’s welfare. We believe this is
implausible for various well-known examples of social interaction effects. These might better
be thought of as effects of conformism.
2 It is in interior equilibrium contexts such as modelled in the standard theory of public good provision(Bernheim et al. 1986) that standard selfishness, or altruism, predicts crowding-out (someone contributes less asothers contribute more). Field studies should, therefore, find crowding-out but often find crowding-in. Labgames usually have corner solutions, so there is no crowding-out prediction. 3 Conformism is sometimes referred to as “social influence”. We use the first term to avoid confusion withinfluences which affect expected payoffs - as they do in Becker’s well-known 1991 article, for example.

4
There appears to be crowding-in of voluntary contributions to charities, for example. Bryan
and Test (1967) find crowding-in of contributions to charities in field experiments. Andreoni
(1998) reports that charitable fund-raisers anticipate crowding-in, through their awareness of
the importance of “seed money”. Contributors often have no, or very diffuse, prospects of
being beneficiary of the charities’ activities,4 though, which makes reciprocity seem out of
place. Consider, for examples, overseas famine relief efforts such as Live Aid, or voluntarily
funded children’s homes such as Dr. Bernado’s homes in the UK. Andreoni and Petrie (2001)
and List and Lucking-Reiley (2001) both suggest social motives other than reciprocity as
potential explanation for such observations.
Another example is provided by a study of Ichino and Maggi (2000). Investigating shirking
behaviour in regional branches of a national bank, these authors find a clear positive
relationship between a worker’s shirking level and the average shirking level of his
coworkers. Since the bank is national, however, this seems to involve local crowding-in of
contributions to a national public good. This study forms part of a growing body of empirical
literature on social-interaction effects (for a survey see Mansky 2000). Whilst reciprocity
might explain aspects of these effects, it is not clear why we should regard it as the only or
even most plausible mechanism. If, for example, some youths engage in car crime following
the example of their peers, one cannot interpret this as reciprocity since those who are
influenced are not the owners of vehicles. Their peers’ actions impact on the welfare of a
different set of agents.
In this paper we examine conformism as an alternative explanation for crowding-in and, by
extension, social interaction effects in general. Conformism is a central concern of social
psychology; the relevant literature there is vast (see Moscovici (1985) for a review).
Conformism differs from reciprocity since appropriate reciprocal behaviour depends on the
welfare effects of the stimulus behaviour, whilst conformist behaviour does not. For example,
a conformist would contribute to a useless public “good”, which benefits no-one, if he
observes enough others making contributions. A reciprocally motivated agent would not,
since he does not benefit from their behaviour.
4 Except perhaps in a formal sense. Charitable contributions are in fact often modelled as public good problems(see, for example, Sugden (1982)). One problem with reciprocity as an account of charity provision is that it ishard to see, for example, how overseas famine relief is motivated by a desire to return benefits obtained fromother donors. If A helps someone, B, that C cares about, it is (in natural language) B that benefits, not C. SeeSchwartz (1982) for relevant philosophical analysis of the concept of welfare.

5
We adopt a formulation of conformism by Cialdini (1993) called “social proof” in our
discussion, because it ought to apply in a public good context and because it contrasts in
interesting ways to standard economic rationality. However, we do not depend on a specific
version of conformism to formulate our experimental prediction. Our main concern is more
modest: to test a null hypothesis that reciprocity can account for all the crowding-in present in
our data.
According to Cialdini’s “principle of social proof”, “We view a behaviour as correct in a
given situation to the degree that we see others performing it” (1993, p95). Social proof is
supposedly more powerful the more similar are the others performing the action to ourselves,
and “…when we are unsure of ourselves, when the situation is unclear or ambiguous, when
uncertainty reigns” (p106). In a one-shot public good context, though there is no uncertainty
in the standard sense, there may be ambiguity since there is a conflict to be resolved between
collective and individual interests. A person’s estimation of how reasonable it is to free-ride
might be influenced by the observed behaviour of others, independently of its effect on her.
Notice that the interpretation of “correct” behaviour in Cialdini’s formulation is left open,
whilst in economics it is usually defined as utility maximisation.5 We find it plausible that
conformism might operate normatively in a public good context, that is, on the agent’s
conception of social or moral norms. If the former is modified, this could explain local
variation in provision of national public goods (as in the Maggi (2000) study), since social
norms are by definition local, that is, specific to a community.6
To isolate conformism, we provide individuals with welfare-irrelevant information about
others’ behaviour and see to what extent it changes their own behaviour. Our broad strategy
therefore is the same as that of Cason and Mui (1998). In their study subjects make two
consecutive choices in a dictator game. Before the second choice each subject receives
information about another subject’s first choice. The authors find no significant difference
between this treatment and a control providing irrelevant information only. A weak indirect
effect is found only in that decisions are more self-regarding in the irrelevant information
5 This definition is preserved in the (very different) economic formulations of conformism in “informationcascade” models (for which consult Bikhchandani et al. (1998)). Unlike social proof, these do not apply in apublic good context since there is no uncertainty about the utility maximising action to be resolved.6 This is what distinguishes them conceptually from moral norms, which are in some sense universal.

6
treatment. Asking subjects to choose contingent on all possible first choices did not reveal any
indication for conformism, either.
In a related experiment by Brandts and Fatás (2001) subjects in a first round participate in a
two-person sequential game, of the following form. Each subject is paired with a second
subject with whom they have to play a public good game. Next, average first stage donations
are revealed. Then each subject is re-matched with a second subject. Finally, each person a
has to submit a strategy conditioning play on their new partner’s first stage decision. That is,
each person’s first stage decision is matched with another subject’s second stage decision and
vice versa. The authors find conformism (the effect of the average donations information on a
subject’s second stage decision) to be rather a weak force and conclude that models of social
behaviour need not incorporate it.
We believe that such a conclusion is premature. In the Cason and Mui (1998) study, very little
social information was imparted; the decision of just one other individual was revealed.
Almost no information about normal behaviour was therefore imparted. In the Brandts and
Fatás study, payoffs are such that first stage contributions might be entirely egoistic, driven by
a desire to trigger return donations in the second stage. Therefore no clear information is
given about the normality of the nonselfish behaviour required of second movers. The use of a
summary statistic about others’ behaviour might also suppress conformism since it conceals
the variance it exhibits. Furthermore, both experiments make use of the strategy method,
which requires subjects to submit a complete strategy at one point in time. This involves a
loss of spontaneity in subjects’ decisions, which could interfere with the operation of
conformism.7
In contrast, our experiment exposes subjects to a large amount of social information,
maintains a clear distinction between selfish and nonselfish action, and uses a more natural
procedure than the strategy method. The remainder of the paper is organized as follows.
Section 2 describes the experimental design in full detail. Section 3 reports our results. In
section 4 we discuss possible economic implications. Section 5 concludes.
7 The Brandts and Fatás (2001) and Cason and Mui (1998) studies exhaust examinations of conformism byexperimental economists. The study by Falk and Fischbacher (2002) elides reciprocity and conformism both inthe text and experiment.

7
2. The Design
2.i Operational Distinction Between Conformism and Reciprocity
The basic design is as follows. Two groups of experimental subjects, groups A and B,
participate in a sequential public good game. Groups A and B correspond to treatments; in
treatment/group A subjects observe only their own group’s behaviour. In treatment/group B
they also observe another group’s behaviour, that of group A.8 In both groups, in stage one, n-
1 subjects decide on the use of their endowment, whilst in stage two the nth agent decides.
Subjects in group B make their contributions after having seen the contributions of group A.
What happens in A is irrelevant for the payoff of B subjects and vice versa. We are interested
in comparing behaviour in the following types of situation:
1. An agent (in group B) sees members of his own group contributing on average 90% of their
endowment, and members of group A 95% of theirs, before making his contribution.
2. An agent (in group B) sees 90% contributions in his group, and 5% in group A, before
making his contribution.
If reciprocity is the only cause of crowding-in, contributions will be the same in these two
situations. Alternatively, if there is conformism, contributions will be lower in the second
situation.9 To test a hypothesis such as this we need a method of controlling “others’
behaviour”, without using deception.10 We use the Conditional Information Lottery (CIL)
procedure developed in Bardsley (2000), which dramatises branches of the game tree of
interest. This means that in each task, a situation unfolds which could arise during the game
described above, and a subject must decide how to behave in that situation. A real play of the
game is also included as one of these tasks, and only this determines payoffs for the whole
experiment. In this task, since it depicts a real situation, actual choices are shown from all
subjects. In the other, fictional, situations, subjects are shown dummy contributions entered
into the software by the experimenters, but decisions made do not affect payoffs. This
8 From this point on, “A” refers to group A, six subjects in an implementation of our design, whilst “A” refers totreatment A, comprising 78 subjects (the 13 group As) – and similarly for group B / treatment B.9 This hypothesis is simpler than the test we in fact use (see next section), and is for illustrative purposes only.The test we report in section 3.i combines all the relevant data for a single test.10 Deception is prohibited by economic experimentalists because of the fear that it may pollute the subject pool.See Bonetti (1998) and Hertwig and Ortmann (2002) for recent discussions.
8
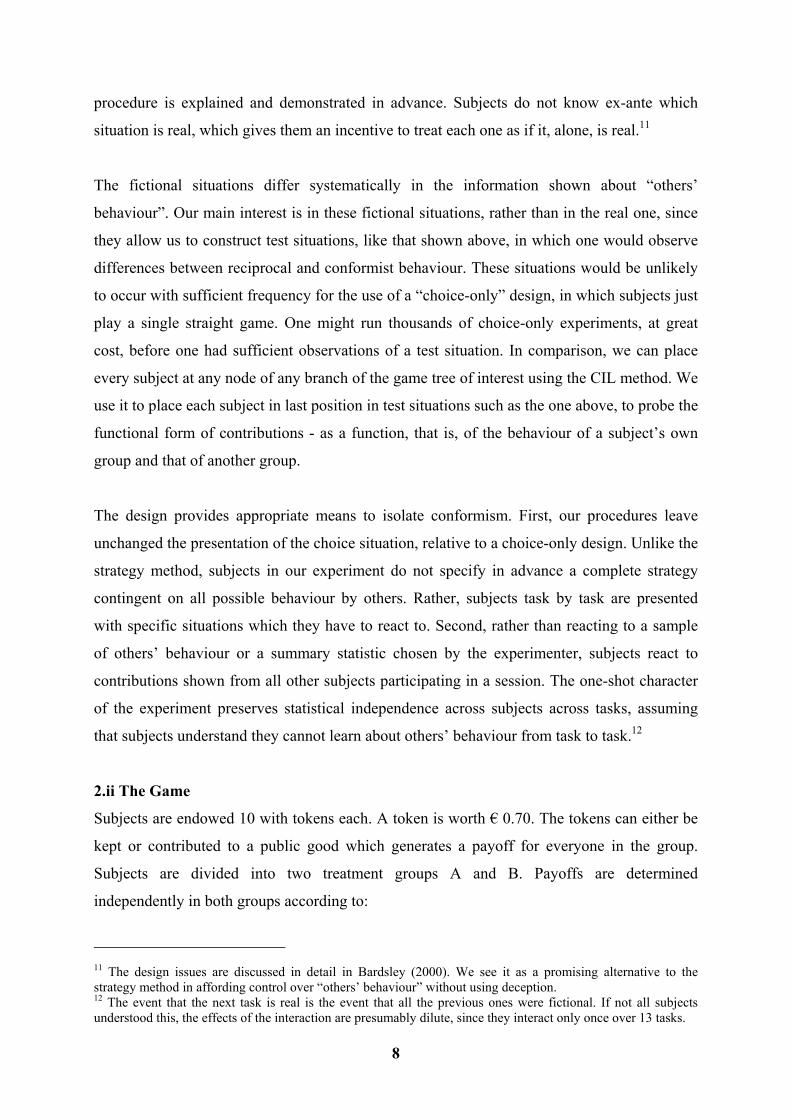
procedure is explained and demonstrated in advance. Subjects do not know ex-ante which
situation is real, which gives them an incentive to treat each one as if it, alone, is real.11
The fictional situations differ systematically in the information shown about “others’
behaviour”. Our main interest is in these fictional situations, rather than in the real one, since
they allow us to construct test situations, like that shown above, in which one would observe
differences between reciprocal and conformist behaviour. These situations would be unlikely
to occur with sufficient frequency for the use of a “choice-only” design, in which subjects just
play a single straight game. One might run thousands of choice-only experiments, at great
cost, before one had sufficient observations of a test situation. In comparison, we can place
every subject at any node of any branch of the game tree of interest using the CIL method. We
use it to place each subject in last position in test situations such as the one above, to probe the
functional form of contributions - as a function, that is, of the behaviour of a subject’s own
group and that of another group.
The design provides appropriate means to isolate conformism. First, our procedures leave
unchanged the presentation of the choice situation, relative to a choice-only design. Unlike the
strategy method, subjects in our experiment do not specify in advance a complete strategy
contingent on all possible behaviour by others. Rather, subjects task by task are presented
with specific situations which they have to react to. Second, rather than reacting to a sample
of others’ behaviour or a summary statistic chosen by the experimenter, subjects react to
contributions shown from all other subjects participating in a session. The one-shot character
of the experiment preserves statistical independence across subjects across tasks, assuming
that subjects understand they cannot learn about others’ behaviour from task to task.12
2.ii The Game
Subjects are endowed 10 with tokens each. A token is worth € 0.70. The tokens can either be
kept or contributed to a public good which generates a payoff for everyone in the group.
Subjects are divided into two treatment groups A and B. Payoffs are determined
independently in both groups according to:
11 The design issues are discussed in detail in Bardsley (2000). We see it as a promising alternative to thestrategy method in affording control over “others’ behaviour” without using deception.12 The event that the next task is real is the event that all the previous ones were fictional. If not all subjectsunderstood this, the effects of the interaction are presumably dilute, since they interact only once over 13 tasks.
9
∑ =+−=
n
a aii ggC1
5.010 (equation 1)
where Ci is subject i’s payoff in tokens and gi is an individual i’s contribution to the public
good. The number of players is n = 6 both in groups A and B. The following order of events
is observed in each task:
Stage 1. In Group A, agents 1-5 decide.
Stage 2. Agent 6 in A sees their decisions then decides.
Stage 3. Group B see group A’s decisions then subjects 1-5 decide.
Stage 4. Agent 6 in B sees their decisions then decides.
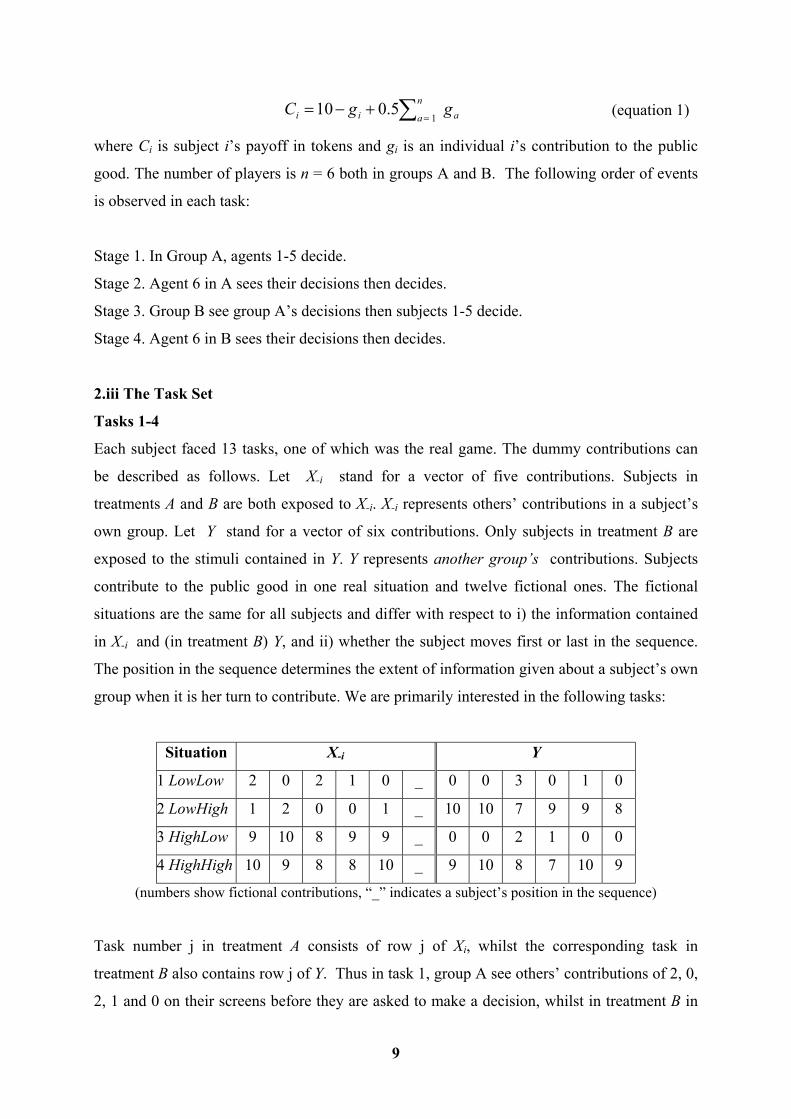
2.iii The Task Set
Tasks 1-4
Each subject faced 13 tasks, one of which was the real game. The dummy contributions can
be described as follows. Let X-i stand for a vector of five contributions. Subjects in
treatments A and B are both exposed to X-i. X-i represents others’ contributions in a subject’s
own group. Let Y stand for a vector of six contributions. Only subjects in treatment B are
exposed to the stimuli contained in Y. Y represents another group’s contributions. Subjects
contribute to the public good in one real situation and twelve fictional ones. The fictional
situations are the same for all subjects and differ with respect to i) the information contained
in X-i and (in treatment B) Y, and ii) whether the subject moves first or last in the sequence.
The position in the sequence determines the extent of information given about a subject’s own
group when it is her turn to contribute. We are primarily interested in the following tasks:
Situation X-i Y
1 LowLow 2 0 2 1 0 _ 0 0 3 0 1 0
2 LowHigh 1 2 0 0 1 _ 10 10 7 9 9 8
3 HighLow 9 10 8 9 9 _ 0 0 2 1 0 0
4 HighHigh 10 9 8 8 10 _ 9 10 8 7 10 9
(numbers show fictional contributions, “_” indicates a subject’s position in the sequence)
Task number j in treatment A consists of row j of Xi, whilst the corresponding task in
treatment B also contains row j of Y. Thus in task 1, group A see others’ contributions of 2, 0,
2, 1 and 0 on their screens before they are asked to make a decision, whilst in treatment B in

10
task 1, subjects first see contributions in the other group of 0, 0, 3, 0, 1 and 0, then they see 2,
0, 2, 1 and 0 from other members of their own group before being asked to allocate their
endowment.
In tasks 1-4, our aim is to observe each subject’s contribution contingent on the contributions
of all others. In these tasks, all subjects in fact were placed at the end of the X-i sequence,
though each subject sees contributions from others in her group before she decides.13 The
tasks are designed to separate reciprocity from conformism. Subjects in treatment B are shown
high and low contributions from their own group, coupled with high and low contributions in
the other group. This enables within-subject comparisons which hold constant the behaviour
of a subject’s own group and vary the contribution levels of the other group (task 1 versus 2, 3
versus 4).14 The information contained in Y is irrelevant from a strategic point of view,
regardless of whether subjects are reciprocal or egoistic. For, placed last in the sequence,
subjects are fully informed about the decisions of others in their own group. Therefore, it is
plausible to assume that effects of the information in Y can be effects of conformism only.
Our null hypothesis for these tasks, of reciprocity being the unique cause of crowding-in, is
H0: ( ) ( )2314 BBBB gggg −=− tested against the alternative H1: ( ) ( )2314 BBBB gggg −≠− .15 This is
the most exacting test we can construct of the null hypothesis. For this difference in
differences should show compound effects of conformism, if it is present. In task 2
contributions should be higher than in task 1, since subjects see much higher contributions in
the other group than in task 1. Whilst in task 3, they should be lower than they are in task 4,
since they see much lower contributions from the other group than in task 4. Under
conformism, therefore, the difference between contributions in tasks 2 and 3 in treatment B,
( )23 BB gg − , should be dampened both by a discouragement of low contributions in task 2 and
a discouragement of high contributions in task 3, compared to the difference in tasks 1 and 4,
13 This does not amount to deception, however, since subjects are told before the experiment starts that, in thefictional situations, the task information is just an artefact of the design.14 There is a limit to the extent to which this constancy is possible, since presenting exactly the same stimuli inX-i or Y might encourage some subjects to think that a certain task cannot possibly be the real game situation (thatis, if they remember the stimuli from a previous task).15 A one-tailed test is inappropriate since inequality aversion predicts an effect in the opposite direction toconformism, if subjects are concerned about inequality relative to both groups A and B.

11
( )14 BB gg − . Note also that this test combines data from all the four tasks into a single test, so
that we avoid running multiple tests of the same hypothesis.16
Tasks 5-6
It is often assumed that subjects react to the mean contribution from others in public good
games (for example, by experimenters seeking workable implementations of the strategy
method in games with a large strategy space). We included two tasks to test this assumption.
We are able to vary “others’ contributions” whilst keeping their mean and median constant,
because we expose subjects to full vectors of others’ contributions rather than to a summary
statistic. Tasks 5 and 6 below test this assumption.
One plausible way in which subjects might be sensitive to the distribution of contributions is
if some of them do not wish to give more than the minimum given by others.17 Tasks 5 and 6
share the same mean and median contribution, but task 6 contains a free-rider:
Situation X-i Y
5 5 10 9 5 9 _ 0 0 3 0 3 2
6 10 0 9 10 9 _ 0 0 3 0 4 2
So, if subjects exhibit such sensitivity to the minimum one would expect lower contributions
in task 6. Our null hypothesis, then, is H0: 65 gg = The alternative is H1: 65 gg ≠ , since
sensitivity to the minimum is not the only conceivable effect. They might also exhibit more
sensitivity to the upper quartile, for example.
Tasks 7-12
In addition to these, in six tasks all subjects are placed first in the sequence (though the task is,
of course, presented as having the same structure as all the others). In these, nobody can
observe anything about their own group before making a decision. That is, each subject in
16 We might instead have expressed our hypothesis between treatments, as H0: ( ) ( )3232 BBAA gggg −=− tested
against the alternative H1: ( ) ( )3232 BBAA gggg −≠− . However, a potentially confounding factor here would be
the greater quantity of information which subjects in treatment B have to digest compared to that in treatment A. 17 A more sophisticated but demanding version of this kind of sensitivity is built into Sugden’s (1984) reciprocitytheory. There, the presence of one free-rider does not negate an obligation towards others who contribute if thereare enough of them to make the public good a worthwhile scheme collectively – as there are in task 6.

12
treatment group A contributes here without any information about others’ behaviour. They are
then shown their own contribution together with four elements of a row of X-i, completing the
first stage, followed by the 5th element of that row of X-i, completing the second stage of the
game. Subjects in group B observe a row of Y (the other group’s behaviour) before being
asked to make a contribution. After this they are also showed the X-i information in the same
manner as for group A. These tasks were to included primarily to camouflage the real task.
They also allow us to see whether, in group B, subjects are influenced by contributions in
group A. Here, though, either reciprocity or conformism could account for such an effect. For
subjects in group B might use the information to update their beliefs about likely contributions
in their own group, using it to work out appropriate reciprocal behaviour.
An issue arose as to whether or not to inform group A subjects that their contributions are, in
the real task, to be shown to subjects in group B. We resolved this as follows. Since we did
not wish to compromise the honesty of the design, in the real task subjects were fully
informed about their decision environment. This entailed that we told them their decisions
were going to be revealed in that task. However, we also told them this during some of the
fictional tasks, whilst in the others they were told that their decisions were not to be revealed.
This procedure kept the design deception-free, since subjects knew that in the fictional tasks
any piece of ostensible information is in fact just an artefact of the experiment, and enabled us
in addition to see if there was an effect of this information. One might expect an effect here,
since it puts A subjects in the role of an example to the other group.18
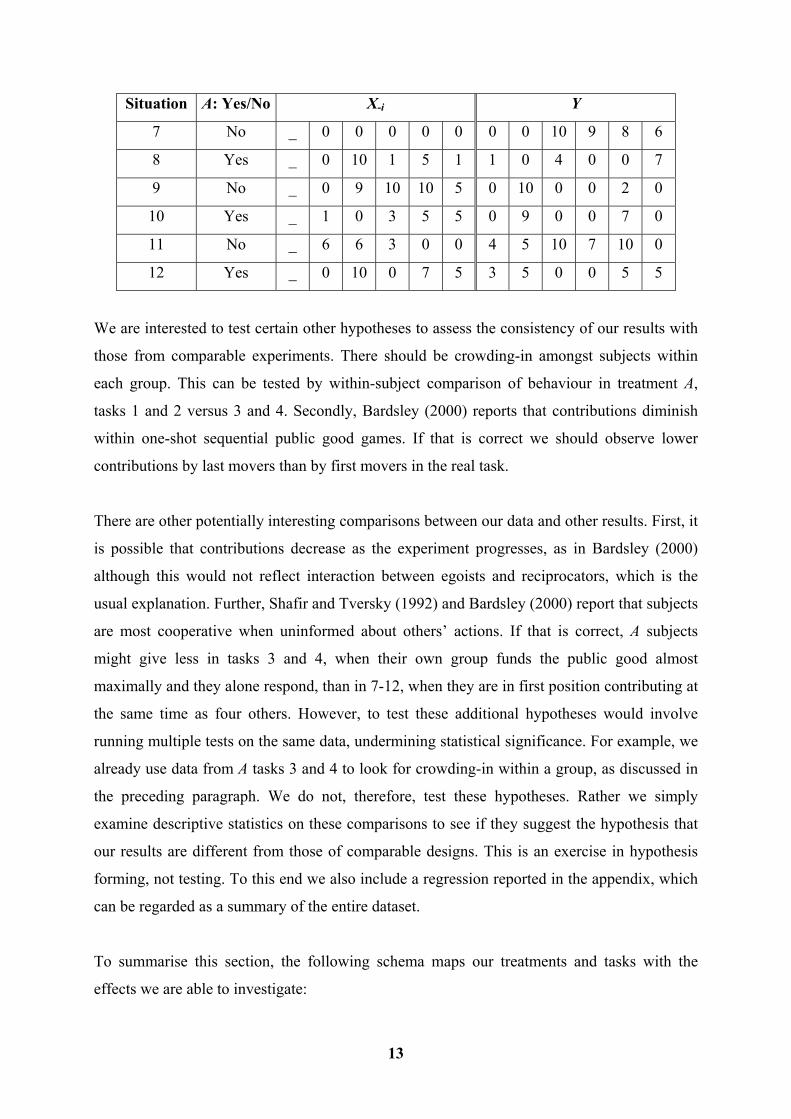
The stimuli for the tasks in which subjects were placed in first position are shown below. The
column headed “A: Yes/No” indicates whether or not subjects in treatment A were told that
their contributions would be shown to the other group. So in task 7, for example, subjects
were told their contributions would be revealed (although in fact treatment B subjects were
shown row 7 of Y), whilst in task 8 they were told they would not be revealed (and B subjects
were shown row 8 of Y).
18 Our expectation was that being in this role should raise contributions of A subjects, since it reduces the “socialdistance” between themselves and B subjects (see below).
13
Situation A: Yes/No X-i Y
7 No _ 0 0 0 0 0 0 0 10 9 8 6
8 Yes _ 0 10 1 5 1 1 0 4 0 0 7
9 No _ 0 9 10 10 5 0 10 0 0 2 0
10 Yes _ 1 0 3 5 5 0 9 0 0 7 0
11 No _ 6 6 3 0 0 4 5 10 7 10 0
12 Yes _ 0 10 0 7 5 3 5 0 0 5 5
We are interested to test certain other hypotheses to assess the consistency of our results with
those from comparable experiments. There should be crowding-in amongst subjects within
each group. This can be tested by within-subject comparison of behaviour in treatment A,
tasks 1 and 2 versus 3 and 4. Secondly, Bardsley (2000) reports that contributions diminish
within one-shot sequential public good games. If that is correct we should observe lower
contributions by last movers than by first movers in the real task.
There are other potentially interesting comparisons between our data and other results. First, it
is possible that contributions decrease as the experiment progresses, as in Bardsley (2000)
although this would not reflect interaction between egoists and reciprocators, which is the
usual explanation. Further, Shafir and Tversky (1992) and Bardsley (2000) report that subjects
are most cooperative when uninformed about others’ actions. If that is correct, A subjects
might give less in tasks 3 and 4, when their own group funds the public good almost
maximally and they alone respond, than in 7-12, when they are in first position contributing at
the same time as four others. However, to test these additional hypotheses would involve
running multiple tests on the same data, undermining statistical significance. For example, we
already use data from A tasks 3 and 4 to look for crowding-in within a group, as discussed in
the preceding paragraph. We do not, therefore, test these hypotheses. Rather we simply
examine descriptive statistics on these comparisons to see if they suggest the hypothesis that
our results are different from those of comparable designs. This is an exercise in hypothesis
forming, not testing. To this end we also include a regression reported in the appendix, which
can be regarded as a summary of the entire dataset.
To summarise this section, the following schema maps our treatments and tasks with the
effects we are able to investigate:
14
Treatment A:
Tasks: 1-4: last mover’s reaction to contributions from other members of her own group
7-12: effect of revelation to the other group on first mover’s contributions
Treatment B:
1-4: effect of the other group’s behaviour on the last mover
7-12: effect of the other group’s behaviour on the first mover
Treatments A and B:
5-6: effect of the distribution of contributions
13 (real): last mover effect.
These six hypotheses are tested in sections 3.i to 3.vi. The rest of section 3 assesses further the
consistency of our results with other experimental findings from a descriptive point of view,
in line with the discussion above.
2.iv Implementation
To make the supposed contributions in these situations appear as realistic as possible, real
decision data from a previous public goods experiment has been used to generate them.19
Secondly, participants are seated distantly from each other in the computer laboratory on
terminals separated by partitions such that it becomes impossible to see anyone else’s screen.
In addition, whenever it is someone’s turn to make a contribution via the keyboard of the
computer everybody else had to enter a letter randomly generated by the program, further
disguising who was doing what when. Finally, within a session the stage of the real decision
round was randomly determined; subjects and experimenters learn about it only after all
rounds were terminated. The order of tasks was randomised across subjects, excepting the real
task of course, to eliminate any confounding timing effects.
Notice again that the procedures enable us to face subjects with situations being exactly the
same for all. The full set of situations used in the experiment is reported in appendix A-I.
Within-subjects comparisons can be applied to test for conformism. In addition, the
19 Data was obtained from Bardsley, from his (2000) simultaneous play, one-shot public good treatment. Thismight look unrealistic if the last placed subject gives more than the others, but this is only the case in one task(task 8). In Bardsley (2000) last-placed subjects (in the sequential condition) did occasionally contribute themost.

15
assignment of groups A and B is equivalent to an assignment to treatments that differ only
with respect to whether or not the contributions of the second group are shown.
156 subjects participated in 13 sessions (12 subjects per session) conducted in the
experimental laboratory of CREED at the University of Amsterdam, in January 2002.
Average earnings were €13.70 per subject in approximately one hour. Subjects went through
detailed instructions on their computer screens (see appendix). They experienced three
practice rounds before the actual experiment started. In addition, a summary containing the
vital elements of the procedures were read aloud to subjects by the experimenter. We checked
subjects’ understanding of how many situations they would be shown (a total of 13) and how
many of these would be real and so relevant for payoffs (only one). We explicitly pointed out
that nothing could be learnt from one situation to another, because of the CIL set-up.
3 Results
Treatment A
Situation Real 1 2 3 4 5 6 7 8 9 10 11 12
Mean 4.83 2.14 1.67 4.49 4.29 4.03 3.87 5.51 4.74 5.09 5.03 5.00 4.88
Std 3.50 3.38 3.12 4.20 4.28 3.80 4.14 3.43 3.61 3.60 3.72 3.56 3.77
Treatment B
Situation Real 1 2 3 4 5 6 7 8 9 10 11 12
Mean 4.71 2.45 2.77 3.97 4.83 4.14 4.69 4.64 4.37 4.62 4.71 5.26 4.62
Std 4.02 3.73 3.86 4.35 4.47 4.25 4.30 4.14 3.81 4.00 4.00 3.95 3.93
Notes: N=156 (78 subjects in each treatment). Table 1: Summary Statistics by Task
3.i. There is crowding-in independently of reciprocity
Inspection of table 1 shows that comparisons both across and within treatments are generally
in the direction predicted by the alternative, conformism hypothesis. This can also be seen in
figure 1 below, representing tasks 1-4.

16
2.141.67
4.49 4.29
2.452.77
3.97
4.83
0
1
2
3
4
5
6
situation
avg.
ow
n co
ntrib
utio
n
Treatment ATreatment B
LowLow HighHighHighLowLowHigh
Figure 1: Mean contributions in test conditions
Key: LowLow = Task1, LowHigh = Task 2, HighLow = Task 3, HighHigh = Task 4
Contributions are higher in treatment B for task 2 than in task 1 and lower in task 3 than they
are in task 4. This suggests that observing flourishing cooperation in another group
discourages low contributions, whilst observing low contributions there discourages high
ones. Inspection of the results across treatments suggests the same interpretation.
Now consider our hypothesis test for reciprocity versus conformism. The difference between
contributions in situations HighHigh (task 4) and LowLow (task 1) is 2.38 tokens. Between
situations HighLow (task 3) and LowHigh (task 2) it is only 1.2 tokens. Under the null-
hypothesis of zero conformism these differences would be the same. A two-tailed Wilcoxon
signed-rank test indicates that a difference of this magnitude would be observed with
probability p = 0.049 under the null hypothesis. We ought, therefore, to reject our null
hypothesis that reciprocity alone can account for the crowding-in in our data.20
We should note that an apparent exception to the general picture outlined above, however, is
provided by task 6. Although intended to test a different hypothesis, this is similar in structure
to task 3. The results, though, appear to be in the other direction than suggested by
20 If we had instead used the between treatment comparison, the corresponding rank sum test would return p =0.026. See note 15 above; this does not constitute additional evidence.

17
conformism if we compare across treatments, though not if we compare within treatments.
One possible reason, other than sampling error, is that seeing low contributions in the other
group, and high ones in their own, caused some subjects to overlook the 0 in their own group
in task 6 or read it as a 10. Subjects have more information to digest in treatment B than in A,
which we already noted might cause confounding effects. This is why we used homogeneous
behaviours within groups to test our conformism hypothesis and do not conduct across
treatment comparisons. Our regression analysis cannot clarify matters further since only tasks
1-6, plus 13 observations from the real task, are used to calculate the coefficient for the other
group’s impact on B second movers.21
3.ii Subjects in first position are also influenced by the other group’s decisions
In our design, all subjects move first in situations 7 to 12. First movers in treatment B
contribute more the higher contributions are in the other group. Total dummy contributions
from the other group were 33, 12, 12, 16, 36 and 18 tokens in tasks 7-12 respectively.
Inspection of table 1 shows contributions from B subjects are weakly monotonic in the order
of total dummy contributions in these tasks. The difference in mean contributions between
situations 8 and 11, with lowest and highest dummy contributions respectively, is statistically
significant (two-tailed Wilcoxon signed rank test, p = 0.00).
3.iii There is substantial crowding-in within a subject’s own group
In both treatments subjects appear to respond with low contributions when contributions in
their own group are low; and they respond with high contributions when contributions in their
own group are high. Recall that treatment A data is to be used to test this hypothesis. We
compare the mean of a subject’s contribution in tasks 1 and 2 with that in tasks 3 and 4. The
Wilcoxon signed rank test on the difference between these means returns p = 0.00 for a two
tailed test, so we reject the null hypothesis of zero crowding-in within a group.
From table 1, our data suggest the hypothesis that crowding-in is stronger vis-à-vis a subject’s
own group than with respect to the other group. For if both sets of contributions exerted
equally powerful influence on B second movers, the latter would give at least as much in task
2 as in task 3. The results suggest the opposite, though. Greater within-group crowding-in is
21 See appendix. The coefficients are of the sign and magnitude suggested by our hypothesis test, but notsignificant (in the regression p = 0.102 for a two-tailed test on the coefficient on the other group’s contributions).

18
also suggested by the regression analysis for treatment B, which estimates a higher coefficient
for the mean of other B group contributions than for that of A group contributions, as
determinants of B subjects’ contributions in last position (see appendix). However, we cannot
test this conjecture since we have already assigned data from each task to test one hypothesis.
3.iv Subjects contribute less when their contributions are to be shown to another group
In tasks 7-12, subjects are placed in first position. Recall that in tasks 8, 10, and 12, subjects
in group A are told that their contributions are going to be shown to subjects in group B, but
that in 7, 9 and 11, they are told that these will not be shown.
Our prior expectation was that subjects would contribute more in tasks 8, 10 and 12, since
there is less social distance. For subjects are placed in the position of examples to the other
group. There was no evidence to this effect however. Our results suggest, on the contrary, that
subjects contribute less. Inspection of table 1 shows that contributions from A subjects are
generally lower for tasks 8, 10, 12 and the real task, than in tasks 7, 9 and 11. A two sided
rank-sum test based on individual averages of A first movers indicates that contributions are
not equal across these two sets of tasks (p = 0.021).
3.v Crowding-in tracks the average of others’ contributions, independently of their
pattern
The comparison between tasks five and six, within subjects, shows no significant difference.
There is no evidence in our dataset, therefore, that subjects react to other features of the
distribution of others’ contributions than their mean or median.
3.vi Last Movers Contribute Less than First Movers
Consider the real task. Here, in treatment A, first movers contributed a mean of 5.08 tokens,
and second movers 5.05. The corresponding medians are 5 and 3 tokens respectively. In
treatment B, first movers gave a mean of 3.61 tokens, and second movers 3. Here the medians
were 5 and zero tokens respectively. Combining data across treatments, this difference is
statistically significant. The rank sum test returns p = 0.033, for two-tailed test (a two sample
test is appropriate, since a subject moves either first or second). The difference between first
and last movers’ contributions is reflected in the regression analysis (see appendix), where a
median contribution of 10 tokens is estimated to produce 6 tokens in response from the
(average) last mover.

19
3.vii Treatment A Subjects appear to contribute at least as much in first position as
when others were extremely cooperative.
Consider tasks 3 and 4. Here, subjects are shown the highest contributions from others in their
group in the task set. In treatment A the mean contribution is always higher, however, in tasks
7-12, where subjects are uninformed about the others’ contributions (since they are in first
position).22
3.viii Contributions appear to decline as the experiment progresses
This emerges from the regression analysis, in which the order in which a task appeared is an
independent variable. See the appendix; the coefficient on the order of tasks is negative and
statistically “significant”,23 indicating that the later tasks are associated with lower
contributions.
4 Discussion
4. i Reciprocity and conformism, or just conformism?
The null hypothesis that reciprocity alone could account for the crowding-in present in our
data is rejected (result 3.i. above). It would probably be unwise to read too much significance
into the results of one experiment. Assume for the purposes of our discussion though, that the
result is robust to further testing, the aim being to examine the consequences to see what is at
stake here. If crowding-in is not all reciprocity-driven, we are left with two alternatives. Either
there is some mixture of reciprocity and conformism responsible or it is all conformism. Our
data do not actually allow us to distinguish these alternatives. We have noted already that our
data suggest the hypothesis that crowding-in is more pronounced within groups than between
them, which one might think is indicative of reciprocity being the stronger force. However,
since we find some conformism with respect to the other group, it is likely that at least part of
the crowding-in within a group is also conformist in nature.
Recall also that social proof is hypothesised to be an effect on behaviour which is more
powerful the more similarity there is between agents who observe each other’s behaviour.
Since agents differ in our experiment principally in their group membership, other
22 The relevant data is for treatment A only, since in treatment B there are confounding influences from the othergroup’s contributions.23 See the main text. The regression is included for descriptive purposes only.

20
characteristics being withheld, it is possible, so far as our experiment is concerned, that
crowding-in is entirely conformist! That is, more crowding-in might occur within groups
because subjects see their group allocation as a respect in which they are similar or different
to the others.24
On the other hand, there is evidence from other experiments that reciprocity is a force to be
reckoned with. In particular, punishment behaviour seems to be well explained as stemming
from negative reciprocity – the desire to inflict harm on those who harm oneself. The
experiment by Fehr and Gächter (2000) shows that subjects are willing to punish non-
contributors at a cost to themselves in public good games. A real life example is social
sanctions inflicted (usually with great invective) on strike breakers. However, punishment, if
effective, is itself a public good, voluntary contributions to which may themselves exhibit
crowding-in. Disentangling the relative responsibility of conformism and reciprocity for
crowding-in is therefore a complex matter which we must pass over here as an issue for future
research.
Parallel questions arise for the interpretation of result 3.iv. That first movers are influenced by
the actions of the other group might just show rational belief formation. The information (in
treatment B) about another group will be relevant, if one has no prior information about the
behaviour of one’s own group, if subjects are concerned to anticipate their own group’s
contributions. For they can use this information to update their beliefs about them. We cannot
quantify the extent of such updating however, since the effect we observe is probably an
admixture of updating and conformism, given our first result.
4.ii Better a free-rider than a sucker
We found no evidence that being in the position of an example to the other group raises
contributions. Instead, it appears to lower them (result 3.iv). This was surprising to the
authors. A possible explanation, which we hope to investigate in future research, is that
subjects feel some embarrassment if they are seen to have made high contributions when
others in their group make low ones. In other words, it is better to be seen as a free-rider than
as a sucker! Embarrassment might be expected to be lower in the anonymous environment of
this experiment, though, than in many real world public good contexts, so this is a potentially
24 We owe this point to Robert Sugden (personal correspondence).

21
important finding. Here, a subject’s contribution was to be shown to the other group, but their
identities withheld from it. If a subject was to be “suckered”, making high contributions whilst
the others took a free-ride, subjects in the other group would only know that someone in the
other group was in this embarrassing position.
Our results here contrast with the well-known experiments by Hoffman et al. (1996) in which
reduced social distance (more knowledge about who did what) either amongst subjects or
between subjects and the experimenter reduced selfish behaviour, in dictator games. In the
dictator game though, there is no prospect of being suckered by others since only unilateral
action is involved. Future research could discriminate between situations in which reduced
social distance causes either pro-social or selfish behaviour, and what causes these effects. In
Hoffman et al. (1996), the effects of social distance are interpreted as rational economic
effects, because with diminished anonymity the prospect arises of post-experimental
interaction with either the experimenter, his collaborator(s), or other subjects. In our
experiment it would have to be the prospect of interaction with the experimenter, since only
the experimenter could work out which subject did what.25 However, it is in our opinion
relatively improbable that the experimenter would remember an individual subject’s
contribution and have future interaction with them outside the lab. Therefore a pure
embarrassment or shame effect, operating independently of anticipated future payoffs, might
be more plausible. We can relate as anecdotal evidence that suckered subjects seemed to
suffer embarrassment on collecting their payoff.26
4.iii Comparison with other experiments
Results 3.i, 3.ii, 3.iv and 3.v concern hypotheses about public good provision tested for the
first time in this experiment. The other results mirror findings from other experiments.
Regarding 3.iii, we have already discussed evidence of crowding-in within groups from other
experiments (see section 1).
Result vii is in the direction indicated by Shafir and Tversky (1992) or Bardsley (2000), who
report that subjects are more cooperative in simultaneous play than when they already know
that the other agents involved have cooperated. That is, although we cannot conduct a formal
test, our data do not suggest the hypothesis that subjects give less in first position than when
25 We did not implement a double-blind procedure, but we maintained anonymity across subjects.

22
they already know that others have made very high contributions. This is puzzling in the same
way as the aforementioned results; one would expect prudence to dictate lower contributions
when subjects are uninformed than when they know that others have been extremely
cooperative. For when they are uninformed and make a high contribution, they risk being
suckered by the others.
Regarding 3.viii, there are many experiments which report decreasing contributions as a
repeated game progresses. Isaac, Walker and Thomas (1984), Andreoni (1988) and Burlando
and Hey (1997) are some examples. However, in that setting there are rival explanations:
subjects may be learning to be selfishly rational, there may be interaction across tasks between
egoists and reciprocators, or there may be strategic decay. Since our subjects only interact
once, from these candidates only learning to be rational is possible in our experiment. Our
data are consistent with the result of Bardsley (2000), which found a decay effect in a one-
shot context (also using the CIL design), suggesting the hypothesis that subjects become more
egoistically rational as they gain experience.
We conclude that our data appear to be entirely consistent with the results of comparable
studies. This is encouraging for the CIL design.
4.iv Economic Implications
Knowledge about the existence of conformism is of considerable importance to economics.
First, conformism can give rise to the complementarity of decisions regardless of any strategic
considerations. We have already noted that this is of relevance to the question of why people
contribute to charity (Andreoni 1998, Lucking-Reily and List 2001). Economists have
wondered why voluntary contributions to charities do not exhibit strict crowding out, and the
associated phenomena of neutrality with respect to the number of contributors and negligible
provision. We have argued that reciprocity is out of place as an explanation here. Conformism
is a better candidate explanation.27
Amongst the practical implications of a conformism effect are various policy spillovers. We
adapt a hypothetical example from Manski (2000, p128): Consider an educational intervention
26 They were rather red in the face at this point.27 One should note, however, that conformism makes reference to non-conformist behaviour too; logically, noteveryone can be a follower.

23
providing to improve the behaviour of the worse behaved pupils in a school but not the others.
If individual disruptiveness increases with the average disruptiveness of the students in the
school, then an effective intervention program not only improves the most difficult children’s
conduct but, as they become better behaved, indirectly improves other pupils’ conduct, with a
feedback to further progress by the selected students. Contextual interactions and correlated
effects imply no such feedback.28 Such an effect, if it existed, would presumably have wider
scope than if it were driven by reciprocity only, in which case the secondary impact would be
restricted to those children whose welfare is affected by the conduct of the worst behaved –
those who are bullied by them or in the same classes, for example.
Real examples are readily available in the field of crime prevention. Consider, for example,
currently fashionable “CPTED” schemes to reduce crime (CPTED stands for Crime
Prevention Through Environmental Design). These programmes aim to shape public spaces to
make crime less likely.29 A key ingredient is the provision of better opportunities for
surveillance by passers by and residents. Economists would naturally think of this as
operating through a constraint modification, that is, by reducing opportunities for crime in the
redesigned area. If that is the only mechanism at work, the schemes risk the displacement of
crime into less well designed areas. Under conformism however, there may be knock-on
effects operating by changing people’s perceptions of normal behaviour. The schemes will be
less prone to the displacement problem, and so more likely to reduce total, not just local,
criminal activity.30 If local concentration of crime is attributable to reciprocity, on the other
hand, then the displacement problem for such schemes is presumably unabated, since all that
changes for reciprocators is a local constraint factor. Any motivation to retaliate is unaffected.
In a similar vein, Kahan (1997) argues that crime prevention can be achieved through belief
management. Police would be well advised to concentrate resources on hitting highly visible
crime such as vandalism and public disorder offences, to create the impression of a low-crime
environment. Kahan frames his analysis entirely in terms of conformism, as an effect on
agents’ conceptions of social norms, rather than reciprocity.
28 Contextual interactions occur when individual behaviour varies with exogenous characteristics of assembledgroup members, not their behaviour. Correlated effects are entirely attributable to individuals’ characteristics.See Manski (2000) p127.29 For an empirical evaluation of CPTED schemes to reduce robberies see Casteel and Peek-Asa (2000).30 See Braga (2001) for related evidence that increased policing of crime “hot spots” may not result in crimedisplacement.

24
Another practical implication is one for optimal public housing composition. Simply put,
under conformism people with “bad” socio-economic characteristics (including those
associated with crime) can be expected to behave worse if one puts them all together than they
would (severally) in isolation. For a culture of misbehaviour is likely to develop, with agents
learning undesirable behaviour from each other. Even if conformism turns out to be a “weak”
effect on the individual in single interactions such as that of our experiment, this might be all
that is needed to bring about a substantial ghetto effect with extended interaction over time.
The policy implication is that social housing ought to be dispersed, not concentrated. The
effectiveness of this depends on the functional form of conformism being something other
than a simple tendency to the mean of prior behaviours, but this is not difficult to imagine. If
it is representative, normal, behaviour that exerts an effect, one would expect a tendency
towards median behaviour to be more likely, for example. For, by definition, this is in general
more representative of the distribution. Relocation of ghetto inhabitants would be effective in
reducing total crime, in a comparative static sense, if they are dispersed enough not to affect
perception of typical behaviour in the alternative, non-ghetto locations. Some empirical
evidence that such relocation is actually effective in reducing crime is provided by a housing
mobility experiment reported by Ludwig et al. (2001). This study found a correlation between
relocation and juvenile arrest rates when households were given the opportunity to relocate.
It should be emphasised that conformism is a more general mechanism than reciprocity for
bringing about endogenous social interaction effects, since it is not restricted to contexts in
which the agents who observe each other affect each other’s welfare. In the social housing
dispersion example, for instance, people can learn nicer behaviours without having to infer
that these benefit them personally.
Conclusions
We find evidence that reciprocity cannot explain all the crowding-in shown in our data. The
influence of the other group’s contributions is in the direction suggested by conformism. We
cannot really quantify the extent of conformism versus reciprocity in our data though, since it
may be group-relative. The respective extent of these two factors as causes of crowding-in
therefore remains an open question, and one that deserves to receive more attention in the
future. Our experiment also uncovered another interesting effect, a suppression of
contributions on the part of subjects placed in the position of examples to another group. We

25
interpret this as an aversion to being seen to be suckered by other subjects, that is, a desire to
avoid embarrassment. Our data display no evidence of sensitivity to the minimum of others’
contributions apart from in so far as this is correlated to their mean or median. The results we
present cohere well with those from other comparable experiments, and are therefore
promising for the CIL design.
We hope to encourage more debate both amongst experimentalists and economists generally
about the interpretation of endogenous social interaction effects. There is much at stake here,
since experimental economics is becoming increasingly influential as a check on the way the
economics profession understands individual behaviour. It is of considerable importance for
our understanding of these interaction effects whether they stem from reciprocity or
conformism, since the former is a much less general mechanism. These effects in turn have
implications for public policy, effects which are likely to be more limited in scope if they
stem from reciprocity. This paper has taken on the reciprocity hypothesis on its home ground,
the public good experiment, and found that it cannot account for all the complementarity
between people’s decisions. For all we know at present, conformism may be the more
important effect even in laboratory games.

26
References
Ackerlof, G.A. (1980): A Theory of Social Custom, of Which Unemployment May Be One
Consequence. Quarterly Journal of Economics 94 (2): 749-75.
Alm, J. McClelland G.H., and Schulze W.D. (1999): Changing the Social Norm of Tax
Compliance by Voting. Kyklos 52 (2): 141-71.
Andreoni, J. (1988a): “Why Free-Ride? Strategies and Learning in Public Goods
Experiments.” Journal of Public Economics, 37, p291-304.
(1995): Cooperation in Public Goods Experiments: Kindness or Confusion? American
Economic Review 85: 891-904.
(1998): Toward a Theory of Charitable Giving. Journal of Political Economics
106(6): 1186-213.
and Petrie, R. (2002): Public Goods Experiments without Confidentiality: A Glimpse
into Fund-Raising. Mimeo. University of Wisconsin.
Aronson, E. (1995): The Social Animal, 8th ed., New York: WH Freeman.
Asch, S. E. (1952): Social Psychology. New York: Prentice Hall.
Bardsley N. (2000): Control Without Deception: Individual Behaviour in Free-Riding
Experiments Revisited. Experimental Economics 3: 215-40.
Becker, G. (1991): “A Note on Restaurant Pricing and Other Examples of Social Influences
on Price.” Journal of Political Economy, 99, p1109-16.
Bergstrom, T., Blume, L. and Varian, H. (1986): “On the Private Provision of Public Goods.”
Journal of Public Economics, 29, p25-49.
Bernheim, B.D. (1994): A Theory of Conformity. Journal of Political Economy 109(5):
841.77.
Bikhchandani, S., Hirshleifer, D. and Welch, I. (1998): “Learning From the Behavior of
Others: Conformity, Fads, and Informational Cascades.” Journal of Economic Perspectives,
12, p.151-170.
Bolton, G. and Ockenfels, A.(2000): A theory of equity, reciprocity, and competition.
American Economic Review 100(1): 166-93.
Bonetti, S. (1998): “Experimental Economics and Deception.” Journal of Economic
Psychology. 19, p377-395.
Brandts, J. and Fatás, E. (2001): Social Information and Social Influence in an Experimental
Dilemma Game. LINEES Working Paper 29/00. University of València.
Braga, A. (2001): The Effects of Hot Spots Policing on Crime. Annals of the American
Academy of Political and Social Science. 578, 104-25.

27
Bryan, J.H. and Test, M.A. (1967): “Models and Helping: Naturalistic Studies in Aiding
Behaviour.” Journal of Personality and Social Psychology, 6, p400-407.
Case, A., and Katz, L. (2001): The Company You Keep. The Effect of Family and
Neighborhood on Disadvantaged Youths. NBER Working Paper No. 3705.
Casteel, C. and Peek-Asa, C. 2000. Effectiveness of crime prevention through environmental
design (CPTED) in reducing robberies. American Journal of Preventative Medicine. 18
(supplement), 99-115.
Cialdini, R. (1993): Influence: Science and Practice, HarperCollins College.
Croson, R.T.A. (1998): Theories of Altruism and Reciprocity: Evidence from Linear Public
Goods Games. Working Paper. The Wharton School. University of Pennsylvania.
Elster, J. (1989): Social Norms and Economic Theory. Journal of Economic Perspectives
3(4): 99-117.
Falk, A. and Fehr, E. (2002): Psychological Foundations of Incentives, CEPR Discussion
Paper No. 3185, London.
and Fischbacher, U. 2002. Crime in the Lab - Detecting Social Interaction. European
Economic Review. 46, 859-69.
Fehr, E. and Schmidt, Klaus, M. (1999). A Theory of Fairness, Competition, and Cooperation.
Quarterly Journal of Economics 114 (3): 817-68.
Fehr, E. and Gächter, S. (2000). Cooperation and Punishment in Public Goods Experiments.
American Economic Review.
Fischbacher, U.; Gächter, S., and Fehr, E. (2001): Are People Conditionally Cooperative?
Evidence from a Public Goods Experiment, Economics Letters 71, 397-404.
Glaeser, E.L., Sacerdote, B., and Scheinkman, J.A. (1996): Crime and Social Interactions.
Quarterly Journal of Economics, 111, 507-48.
Hertwig, R. and Ortmann, A. (2002): The Costs of Deception: Evidence from Psychology.
Experimental Economics, 5, 111-131.
Hoffman, E., McCabe, K. and Smith, V. L. (1996): “Social Distance and Other-Regarding
Behaviour in Dictator Games.” American Economic Review, 86, 653-660.
Ichino, A., and Maggi, G. (2000): Work Environment and Individual Background: Explaining
Regional Shirking Differentials in a Large Italian Firm. Quarterly Journal of Economics
104(3): 1057-90.
Isaac, R. M. and Walker, J. M. and Thomas, S. (1984): “Divergent Evidence on Free-Riding:
An Experimental Investigation of Possible Explanations.” Public Choice, 43, p113-49.

28
Kahan, D.M. (1997): Social Influence, Social Meaning, and Deterrence. Virginia Law Review
83 (2): 349-95.
Keser, C. and van Winden, F. (2000): Conditional Cooperation and Voluntary Contributions
to Public Goods. Scandinavian Journal of Economics 102(1): 23-39.
Ledyard, J. (1995): Public Goods: a survey of experimental research. In: J. Kagel and A. Roth
(eds.): The Handbook of Experimental Economics. Princeton University Press: Princeton:
111-94.
Lucking-Reiley, D. and List, J. (2001): The Effects of Seed Money and Refunds on Charitable
Giving: Experimental Evidence from a University Capital Campaign. Forthcoming in:
Journal of Political Economy.
Ludwig, J., Duncan, G.J. and Hirchfield, P. 2001. Urban Poverty and Juvenile Crime:
Evidence from a Randomized Housing-Mobility Experiment. Quarterly Journal of
Economics. 116, 655-79.
Manski C.F. (2000): Economic Analysis of Social Interaction. Journal of Economic
Perspectives 14(3): 115-36.
Moscovici, S. (1985): “Social Influence and Conformity.” in Gardner, L. and Aronson, E.
(eds.) The Handbook of Social Psychology. New York: Random House, 2, p347-412.
Palfrey, T.R. and Prisbey, J.E. (1997): Anomalous Behaviour in Public Goods Experiments:
How Much and Why? American Economic Review 87(5): 829-46.
Rabin, M. (1998). Psychology and Economics. Journal of Economic Literature 36(1): 11-46.
Roth, A.E. (1995): Bargaining Experiments. In: J. Kagel and A.E. Roth (eds.). Handbook of
Experimental Economics. Princeton, N.J.: Princeton University Press: 258–348.
Schwartz, T. (1982): “What Welfare is Not.” In Miller, H. B., and Williams, W. H. (eds.): The
Limits of Utilitarianism, University of Minnesota Press.
Shafir, E. and Tversky, A. (1992): “Thinking Through Uncertainty: Nonconsequential
Reasoning and Choice.” Cognitive Psychology, 24, p449-474.
Sugden, R. (1982): “On the Economics of Philanthropy.” Economic Journal, 92, p341-50.
(1984): Reciprocity: The Supply of Public Goods Through Voluntary Contributions.
The Economic Journal 94 (376): 772-87.

29
Appendix
i. Task Set.
Situation A: Yes/No X-i Y1*(LowLow) No 2 0 2 1 0 _ 0 0 3 0 1 0
2*(LowHigh) No 1 2 0 0 1 _ 10 10 7 9 9 8
3*(HighLow) No 9 10 8 9 9 _ 0 0 2 1 0 0
4*(HighHigh) No 10 9 8 8 10 _ 9 10 8 7 10 9
5 No 5 10 9 5 9 _ 0 0 3 0 3 2
6 No 10 0 9 10 9 _ 0 0 3 0 4 2
7 No _ 0 0 0 0 0 0 0 10 9 8 6
8 Yes _ 0 10 1 5 1 1 0 4 0 0 7
9 No _ 0 9 10 10 5 0 10 0 0 2 0
10 Yes _ 1 0 3 5 5 0 9 0 0 7 0
11 No _ 6 6 3 0 0 4 5 10 7 10 0
12 Yes _ 0 10 0 7 5 3 5 0 0 5 5
13 Yes Real Task (no dummies; actual contributions shown)
* set up as test conditions for reciprocity versus conformism (see section 2.iii)
Notes: Numbers show fictional contributions. “_” indicates a contribution to be made by the subject –hence the position of “_” shows a subject’s position in the sequential game. The number of eachsituation is an arbitrary index and does not correspond to the order in which a subject faced the tasks(see main text). The “A: Yes/No column” indicates whether or not A subjects were told whether theircontributions would be shown to B subjects.

30
Appendix.
ii. Regression Analysis of the Results.
Since the data are doubly censored (a subject cannot contribute either less than zero or more
than their endowment), a two-limit tobit model is appropriate, with a lower limit of zero and
an upper limit of ten tokens. The censoring details for each model show that censoring is a
very significant feature of the data, which implies that models with unlimited dependent
variables would be seriously biased. There are 900 left-censored observations and 391 right
censored ones from a total of 2028 (=156 subjects x 13 tasks); more than half of the
observations are censored. The Hausman test (conducted on uncensored models) shows the
random effects model to be appropriate. We estimate one model for each position in the
sequence, across both treatments (hence four estimations). Details are shown below.
I II III IV
Median own group -- 0.619 -- 0.678 (0.086) (0.111)
Median other group -- -- 0.093 0.161(0.059) (0.099)
Information Dummy -0.612 -- -- --(0.268)
Round -0.160 -0.160 -0.082 -0.227(0.037) (0.085) (0.047) (0.103)
Observations (N*13 tasks) 533 481 533 481
Un-/left-/right- censored 321/118/94 179/232/70 248/164/121 152/223/106Notes: Standard errors in parentheses. Constant surpressed. Real task included. N = 78 per treatment (total 156).“Med” denotes median.I First Movers in AII Second Movers in A III First Movers in BIV Second Movers in B
Table 2: Estimation results: Two-Limit Tobit Regression, Random Effects Model.

31
Appendix.
iii. Instructions
Welcome. In this experiment, which investigates decision making, you will be placed in a number of
situations. Only one of these will be real, the others will be fictional. An example of this procedure
follows below.
Example: The experimenter, through this program, is about to make you an offer. The offer is one of
three possibilities. One but only one of these is REAL. You have to decide whether to accept or reject
each of the three possible offers, before you learn what the offer was. What happens then depends on
how you responded to the real offer.
1. You will be paid 5 euros if you do a maths test and score above 60% AND take part in this
experiment. make your choice. Make your choice: accept/reject.
2. You will be paid 4 euros if you fill out a questionnaire about your diet AND take part in this
experiment. Make your choice: accept/reject.
3. You have been offered 7 euros. You do NOT have to do anything in return [other than
participate in this experiment. Make your choice: accept/reject.
The offer was in fact number 3.
The 7 euros you have just accepted are your resources to be used in the experiment. They have been
given as 10 tokens worth 0.7 euros each. You can walk away with more or less than this depending on
how you and other subjects behave in the real situation, but you cannot leave with less than 3.5 euros.
Below you are given more detailed instructions. Scroll through these and press the button at the end to
indicate that you are ready.
The 13 situations you will confront are all set in the following context. There are two sets of six
people, A, B, C, D, E, F (persons A-F) and G, H, I, J, K, L (persons G-L). Persons A-F are linked to
each other but not to G-L. Similarly, G-L are linked to each other but not to A-F. You are in set G-L.
Each person has 10 tokens [worth 0.7 euros each]. In each situation, each person must decide how to
use their ten tokens. Each person will leave the experiment with a monetary reward. The size of this
depends on what everyone with whom they are linked, themselves included, does with their tokens in
the real situation.
There are two possible uses for each token: it can be taken by you personally or put into an account:
account #2. To begin with there are no tokens in this account. Only people G-L can put money into it;
persons A-F have an entirely separate account, account #1. The money in account #2 will be
multiplied by 3 and split equally between agents G-L. The money in account #1 will be multiplied by
3 and split equally between agents A-F.

32
This means that each token taken by you leads to a reward to yourself of 0.7 euros but does not benefit
anyone else, whilst each token put into account #2 results in a payment of approximately 0.35 euros to
everyone in G-L including you, there being 6 people in this set: (0.7 x 3)/6 = 0.35 euros.
You decide how much of the 7 euros goes into account #2 by entering a number of 0.7 euro tokens [0-
10] to go in. Any token you do not put into account #2 goes to you; not putting it into account #2 is the
same as taking it directly. A table showing the amount of cash you will be paid based on how many
tokens there are in account #2 has been placed by your computer for ease of reference.
Instructions for group A
In each situation, you will be given the following details:
(i) numbers representing others’ decisions
(ii) whether or not the decisions of A-F are shown to G-L before they make their decisions.
As in the example of the offer, only in one case does any of this correspond to anything real. In this
real situation, both (i) and (ii) are genuine information, so, for example, the numbers will show the
actual choices made by persons A-F. In the others, (i) and (ii) describe purely fictional situations, so
nothing really happens, nothing you decide will actually be shown to anyone else and the numbers are
made up by the experimenter. Note that because there is only one real situation it is not possible to
learn about other people's behaviour as the experiment progresses.
Regarding (i), each situation shows five of the six people deciding at the same time what to do with
their tokens. Then the sixth person makes their decision. So, if you are one of the five people in first
position, you will decide without seeing others’ choices, but you will be shown others’ decisions after
you have made yours. If you are placed in last position, you will decide after seeing the five other
decisions from persons A-F. The letters A-F do NOT correspond to the order; any person may be
placed in either position.
Regarding (ii), it is possible, in the real situation only, that the decisions made by A-F including yours,
will be shown to agents G-L before they make their decisions.
After each situation has been played out, you will be shown how much money you will be given if that
is the real one.
We would like you to treat each situation as if it is real and the only situation. Note that, for all you
know, each one could be the real one, in which case ALL information you are given about it is
accurate, and only the real one has any effect on the outcome. (Remember that for one of the offers in
the example, all the information turned out to be accurate but the other offers were purely fictional.
The experiment works in the same way.)

33
The section below shows you the display you will see during the experiment.
This shows that 23 tokens were put into account #1 by persons A-F. When it is not your turn to make a
decision you will be asked to enter a letter.
You will now face three practice situations to get used to the program. These are fictional situations
and therefore none of them are paid.

34
Instructions for group B:
In each situation, you will be given the following details:
(i) numbers representing decisions of persons A-F.
(ii) numbers representing decisions of other persons in G-L.
As in the example of the offer, only in one case does any of this correspond to anything real. In this
real situation, both (i) and (ii) are genuine information, so the numbers will show the actual choices
made by persons A-F and the actual choices made by persons G-L. In the others, i and ii describe
purely fictional situations, so nothing really happens, nothing you decide will actually be shown to
anyone else and the numbers are made up by the experimenter. Note that because there is only one real
situation it is not possible to learn about other people's behaviour as the experiment progresses.
Each situation shows five of the six people in A-F deciding at the same time what to do with their
tokens. Then the sixth person makes their decision. Then, decisions from A-F are shown to G-L. Then
the same process happens with persons G-L; 5 of the 6 decide first, followed by the last person. So, if
you are one of the five people in first position, you will decide after seeing decisions from A-F but
without seeing others’ choices from G-L. In this case you will be shown others’ decisions from G-L
after you have made yours. If you are placed in last position, you will decide after seeing the five other
decisions from persons G-L. Decisions by persons G-L are NOT shown to persons A-F. The letters G-
L do NOT correspond to the order; any person may be placed in either position.
After each situation has been played out, you will be shown how much money you will be given if that
is the real one.
We would like you to treat each situation as if it is real and the only situation. Note that, for all you
know, each one could be the real one, in which case ALL information you are given about it is
accurate, and only the real one has any effect on the outcome. (Remember that for one of the offers in
the example, all the information turned out to be accurate but the other offers were purely fictional.
The experiment works in the same way.)
The section below shows you the display you will see during the experiment.

35
This shows that 17 tokens were put into account #1 by persons A-F. 24 Tokens were put into account
#2 by persons G-L. When it is not your turn to make a decision you will be asked to enter a letter.
You will now face three practice situations to get used to the program. These are fictional situations
and therefore none of them are paid.