Rewarded Video Ads - Best Practices For Placements & Rewards

Social Intelligence Report Adobe Digital Index | Q2 2015
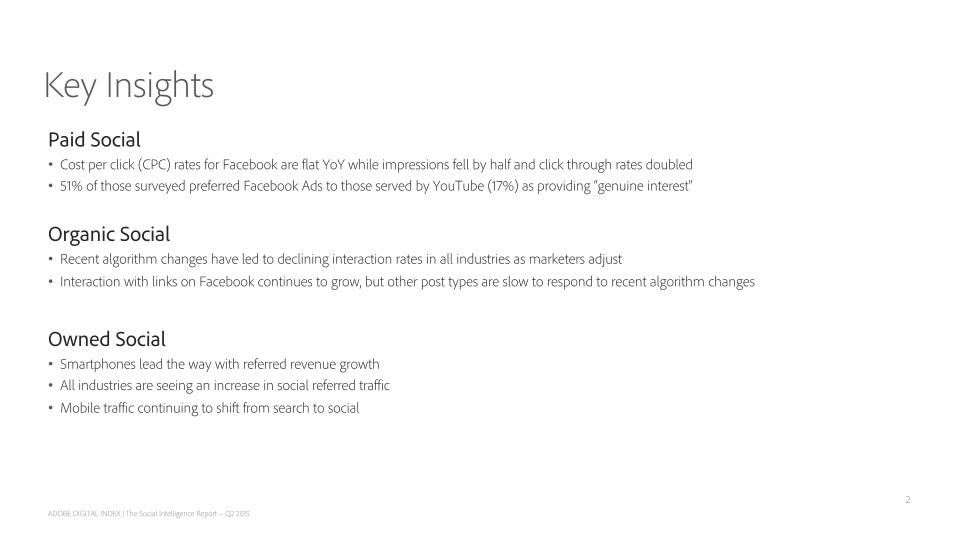
Paid Social • Cost per click (CPC) rates for Facebook are flat YoY while impressions fell by half and click through rates doubled • 51% of those surveyed preferred Facebook Ads to those served by YouTube (17%) as providing “genuine interest”
Organic Social • Recent algorithm changes have led to declining interaction rates in all industries as marketers adjust • Interaction with links on Facebook continues to grow, but other post types are slow to respond to recent algorithm changes
Owned Social • Smartphones lead the way with referred revenue growth • All industries are seeing an increase in social referred traffic • Mobile traffic continuing to shift from search to social
2
Key Insights
ADOBE DIGITAL INDEX | The Social Intelligence Report – Q2 2015

3
Social media gets more marketing savvy
Social buzz, ads, and content can all be used as a way to reach and connect with individual consumers. Facebook continues to dominate the social realm, but each social site has a unique audience and benefit that can lead to more loyal fans, brand awareness, and eventual revenue.
TABLE OF CONTENTS
Consumer Survey • Social Media Site Usage
Paid Social • Facebook Ad CPC & CTR Growth • Facebook Paid Ad Clicks and Impressions
Growth • Comparison of Facebook and Google CTR’s
Emerging Social • Social Streaming Apps
Organic Social • Social Interaction Rate by Industry
• Social Interaction Rate by Type
Owned Social • Social Referred Visit Growth by Industry
• Share of Visits Referred from Social • Social Referred Revenue Growth by Device Type • Share of Social Visits Referred by Platform • Revenue per Visit by Referred
ADOBE DIGITAL INDEX | The Social Intelligence Report – Q2 2015
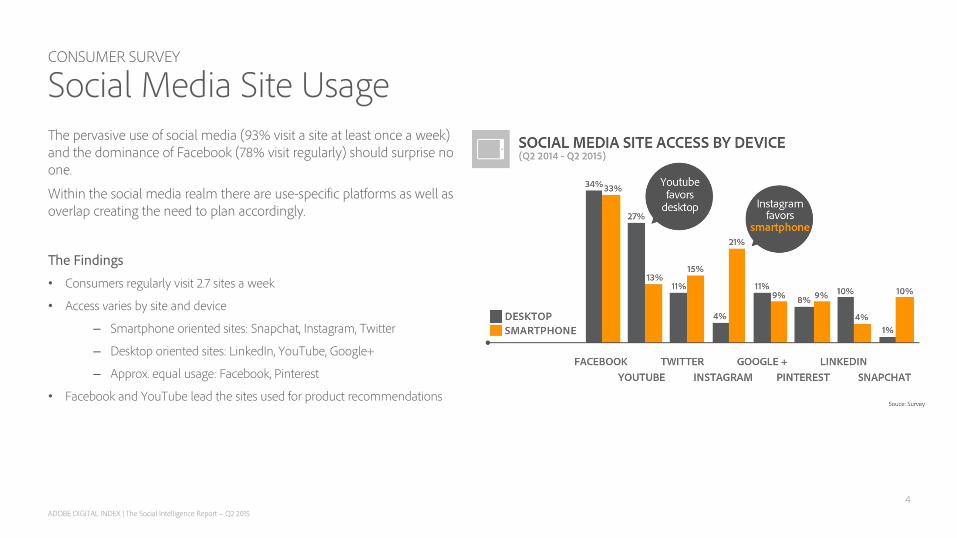
CONSUMER SURVEY
Social Media Site Usage
4
The pervasive use of social media (93% visit a site at least once a week) and the dominance of Facebook (78% visit regularly) should surprise no one.
Within the social media realm there are use-specific platforms as well as overlap creating the need to plan accordingly.
The Findings • Consumers regularly visit 2.7 sites a week
• Access varies by site and device
– Smartphone oriented sites: Snapchat, Instagram, Twitter
– Desktop oriented sites: LinkedIn, YouTube, Google+
– Approx. equal usage: Facebook, Pinterest
• Facebook and YouTube lead the sites used for product recommendations
ADOBE DIGITAL INDEX | The Social Intelligence Report – Q2 2015

PAID SOCIAL
Facebook Ad CPCs and CTRs
5
The focus Facebook put on matching consumer interests with advertising messages has led to better experiences for consumers and better numbers for marketers.
The Findings
• Global Cost per click (CPC) rates are flat year over year; US saw a 6% increase YoY
• Click through rate (CTR) is up 2x year over year with evidence of much higher rates for individual brands
ADOBE DIGITAL INDEX | The Social Intelligence Report – Q2 2015

PAID SOCIAL
Facebook Paid Ad Clicks & Impressions Growth
6
Improved targeting and better ad selection has resulted in less clutter while maintaining engagement.
Facebook appears to have been rewarded for being innovative and taking risks.
The Findings • Impressions, or ads served, has dropped by half since last year (-47%)
• Total clicks are up 12% YoY
ADOBE DIGITAL INDEX | The Social Intelligence Report – Q2 2015
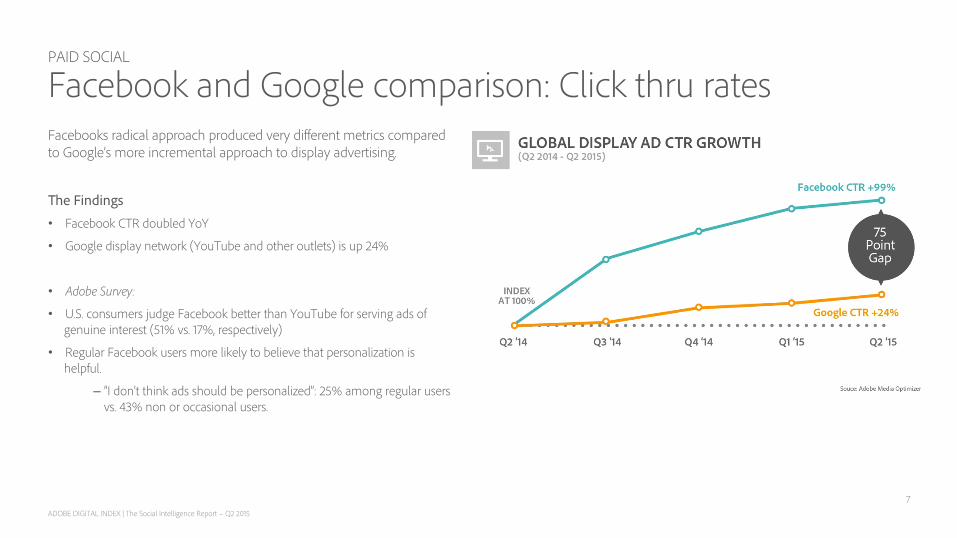
PAID SOCIAL
Facebook and Google comparison: Click thru rates
7
Facebooks radical approach produced very different metrics compared to Google’s more incremental approach to display advertising.
The Findings • Facebook CTR doubled YoY
• Google display network (YouTube and other outlets) is up 24%
• Adobe Survey:
• U.S. consumers judge Facebook better than YouTube for serving ads of genuine interest (51% vs. 17%, respectively)
• Regular Facebook users more likely to believe that personalization is helpful.
– “I don’t think ads should be personalized”: 25% among regular users vs. 43% non or occasional users.
ADOBE DIGITAL INDEX | The Social Intelligence Report – Q2 2015
EMERGING SOCIAL
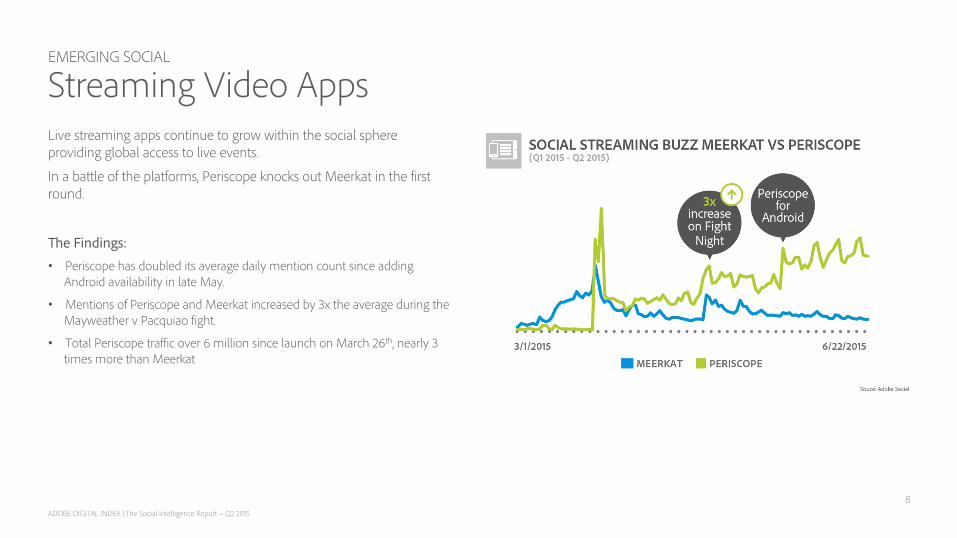
Streaming Video Apps Live streaming apps continue to grow within the social sphere providing global access to live events.
In a battle of the platforms, Periscope knocks out Meerkat in the first round.
The Findings: • Periscope has doubled its average daily mention count since adding
Android availability in late May.
• Mentions of Periscope and Meerkat increased by 3x the average during the Mayweather v Pacquiao fight.
• Total Periscope traffic over 6 million since launch on March 26th, nearly 3 times more than Meerkat
8 ADOBE DIGITAL INDEX | The Social Intelligence Report – Q2 2015

ORGANIC SOCIAL
Social Interaction Rate by Industry
9
Marketers are still adapting to algorithm changes made by Facebook in 2014 and early 2015.
The Findings: • Interaction rates decreased YoY in major industries.
• Retail remains the industry with the highest interaction rates followed by travel.
ADOBE DIGITAL INDEX | The Social Intelligence Report – Q2 2015

ORGANIC SOCIAL
Social Interaction Rate by Type
10
Link posts are still benefiting the most from algorithm changes Facebook made in August.
The Findings: • Links again increased in YoY interaction rates, up 20%.
• Image and video post interaction rates are down year over year
ADOBE DIGITAL INDEX | The Social Intelligence Report – Q2 2015

OWNED SOCIAL
Social Referred Visit Growth by Industry
11
Everyone appears to be seeing a rise is socially reffered vists, even the traditioanlly conservative finance sector.
Social referred visits are up by at least 30% YoY across all industries.
The Findings:
• Travel saw the largest increase YoY + 67%
• Retail sites see a 62% incrase in social referred traffic during the holidays
• Finance sites are up 32% YoY
ADOBE DIGITAL INDEX | The Social Intelligence Report – Q2 2015

OWNED SOCIAL
Share of Visits Referred from Social
12
As we become mobile first, website visits are shifting to either search or social as the source.
The Findings: • Social smarthphone traffic is up 118% YoY
• Search smartphone traffic is up 21% YoY
• Social smartphone visits are 3x social desktop visits in Q2 ‘15
ADOBE DIGITAL INDEX | The Social Intelligence Report – Q2 2015
OWNED SOCIAL
Social Referred Revenue Growth by Device Type
13
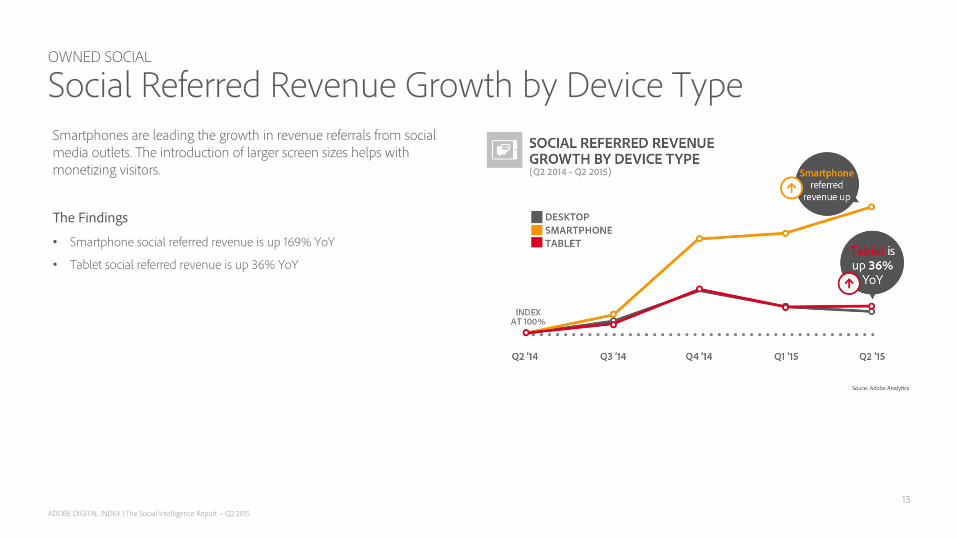
Smartphones are leading the growth in revenue referrals from social media outlets. The introduction of larger screen sizes helps with monetizing visitors.
The Findings
• Smartphone social referred revenue is up 169% YoY
• Tablet social referred revenue is up 36% YoY
ADOBE DIGITAL INDEX | The Social Intelligence Report – Q2 2015
OWNED SOCIAL
Revenue per Visit by Referrer
14
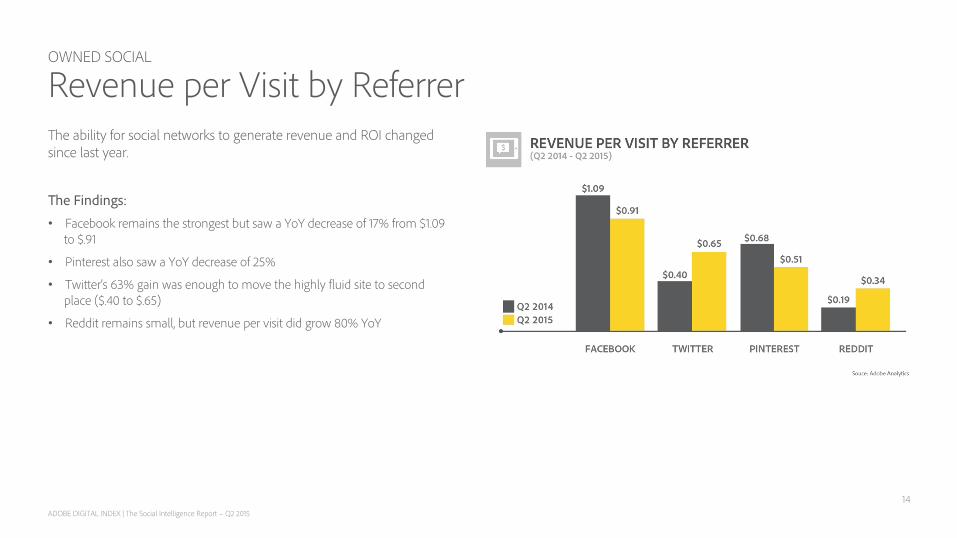
The ability for social networks to generate revenue and ROI changed since last year.
The Findings: • Facebook remains the strongest but saw a YoY decrease of 17% from $1.09
to $.91
• Pinterest also saw a YoY decrease of 25%
• Twitter’s 63% gain was enough to move the highly fluid site to second place ($.40 to $.65)
• Reddit remains small, but revenue per visit did grow 80% YoY
ADOBE DIGITAL INDEX | The Social Intelligence Report – Q2 2015
OWNED SOCIAL
Share of Social Visits Referred by Platform
15
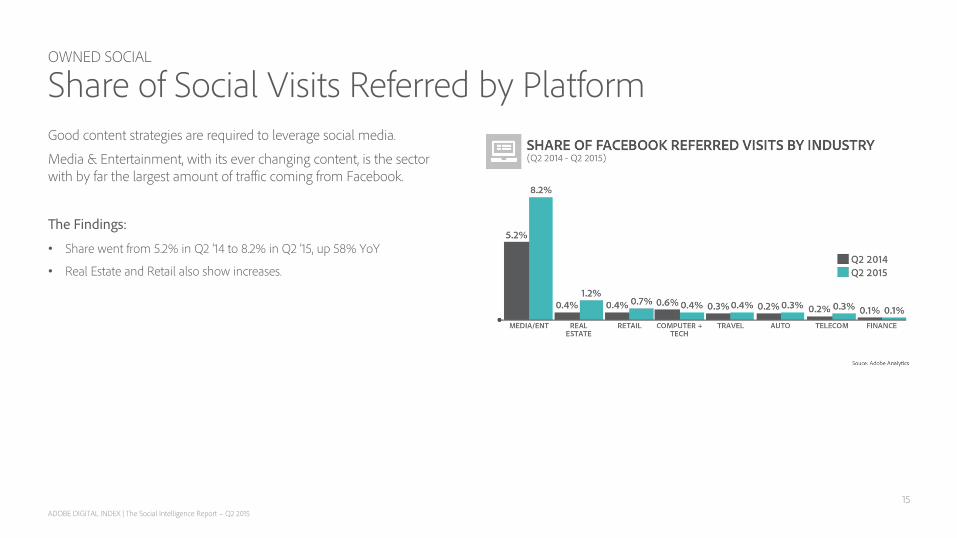
Good content strategies are required to leverage social media.
Media & Entertainment, with its ever changing content, is the sector with by far the largest amount of traffic coming from Facebook.
The Findings:
• Share went from 5.2% in Q2 ‘14 to 8.2% in Q2 ’15, up 58% YoY
• Real Estate and Retail also show increases.
ADOBE DIGITAL INDEX | The Social Intelligence Report – Q2 2015

SOCIAL IMPACT
Social Reaction to Corporate Event
16
In early July Reddit laid off a popular community manager and moderators temporarily closed some popular areas of the site in protest.
The community took up the issue. • Social mentions increased 3x its daily average immediately after the event
• 58% of the social buzz related to sadness with another 23% expressing surprise
The CEO resigned one week later.
ADOBE DIGITAL INDEX | The Social Intelligence Report – Q2 2015
Based on consumer data for 5,000+ brand sites during 2014 and 2015.
• +500 billion Facebook post impressions • +525 billion Google and Yahoo! Bing ad impressions • +8 million social streaming app mentions
Composed of aggregated and anonymous data from visits to websites in multiple industries and segments.
Data captured via Adobe Marketing Cloud—Adobe Media Optimizer, Adobe Analytics and Adobe Social.
Visit our website: adobe.ly/digitalindex
Read our blog: adobe.ly/digitalindex Follow us: @adobeindex and @adobeprimetime
Ask a question or make a suggestion: [email protected]
17
ADOBE DIGITAL INDEX
Methodology
ADOBE DIGITAL INDEX | The Social Intelligence Report – Q2 2015

Q2 2014 Q3 2014 Q4 2014 Q1 2015 Q2 2015
Facebook $1.09 $1.08 $1.20 $0.86 $0.91
Twitter $0.40 $0.44 $0.53 $0.53 $0.65
Pinterest $0.40 $0.61 $0.73 $0.44 $0.51
Reddit $0.19 $0.22 $0.37 $0.33 $0.34
Revenue Per Visit by Referrer
Q2 2014 Q3 2014 Q4 2014 Q1 2015 Q2 2015
CTR 100% 102% 113% 117% 124%
SEARCH SOCIAL
Q2 2014 Q3 2014 Q4 2014 Q1 2015
Smartphone 19.1% 23.1% 2.2% 4.7%
Desktop 25.5% 26.1% 1.6% 1.6%
Referral Traffic Source
Q2 2014 Q3 2014 Q4 2014 Q1 2015 Q2 2015
Media & Entertainment 5.2% 5.2% 6.7% 7.2% 8.2%
Real Estate 0.4% 0.5% 0.8% 1.1% 1.2%
Retail 0.4% 0.5% 0.6% 0.7% 0.7%
Share of Facebook Referred Visits
Facebook Q2 2014 Q3 2014 Q4 2014 Q1 2015 Q2 2015
CTR 100% 152% 173% 192% 199%
CPC 100% 96% 111% 92% 100%
Clicks 100% 100% 99% 112% 112%
Impressions 100% 59% 49% 50% 53%
Google Display
SOCIAL IMPACT
Data Tables for Key Charts
ADOBE DIGITAL INDEX | The Social Intelligence Report – Q2 2015
19

• Click-through rate (CTR): Clicks divided by impressions.
• Cost per click (CPC): Cost divided by clicks.
• Cost per thousand (CPM): Cost per thousand impressions of an ad.
• First-click attribution: Purchase attributed to the first click the consumer makes toward purchasing an item.
• Geo-targeting: Posts targeting a specific region.
• Last-click attribution: Purchase attributed to the last click the consumer makes toward purchasing an item.
• Return on investment (ROI): Ratio of revenue to cost across industries for Facebook ads — not including retargeted ads.
• Revenue per visit (RPV): Site revenue divided by visits.
• Social engagement: The volume of comments, likes, shares and other interactions with a brand post.
• Social sentiment: Ranking social mentions from 1 (negative) to 10 (positive) in order to track the effectiveness of social marketing efforts.
20
ADOBE DIGITAL INDEX
Glossary
ADOBE DIGITAL INDEX | The Social Intelligence Report – Q2 2015