Social inequality and infant health in the UK: systematic review and meta-analyses
13
Social inequality and infant health in the UK: systematic review and meta-analyses Alison L Weightman, 1 Helen E Morgan, 1 Michael A Shepherd, 2 Hilary Kitcher, 1 Chris Roberts, 3 Frank D Dunstan 4 ABSTRACT Objectives: To determine the association between area and individual measures of social disadvantage and infant health in the UK. Design: Systematic review and meta-analyses. Data sources: 26 databases and websites, reference lists, experts in the field and hand-searching. Study selection: 36 prospective and retrospective observational studies with socioeconomic data and health outcomes for infants in the UK, published from 1994 to May 2011. Data extraction and synthesis: 2 independent reviewers assessed the methodological quality of the studies and abstracted data. Where possible, study outcomes were reported as ORs for the highest versus the lowest deprivation quintile. Results: In relation to the highest versus lowest area deprivation quintiles, the odds of adverse birth outcomes were 1.81 (95% CI 1.71 to 1.92) for low birth weight, 1.67 (95% CI 1.42 to 1.96) for premature birth and 1.54 (95% CI 1.39 to 1.72) for stillbirth. For infant mortality rates, the ORs were 1.72 (95% CI 1.37 to 2.15) overall, 1.61 (95% CI 1.08 to 2.39) for neonatal and 2.31 (95% CI 2.03 to 2.64) for post- neonatal mortality. For lowest versus highest social class, the odds were 1.79 (95% CI 1.43 to 2.24) for low birth weight, 1.52 (95% CI 1.44 to 1.61) for overall infant mortality, 1.42 (95% CI 1.33 to1.51) for neonatal and 1.69 (95% CI 1.53 to 1.87) for post- neonatal mortality. There are similar patterns for other infant health outcomes with the possible exception of failure to thrive, where there is no clear association. Conclusions: This review quantifies the influence of social disadvantage on infant outcomes in the UK. The magnitude of effect is similar across a range of area and individual deprivation measures and birth and mortality outcomes. Further research should explore the factors that are more proximal to mothers and infants, to help throw light on the most appropriate times to provide support and the form(s) that this support should take. INTRODUCTION Socioeconomic status, as indicated by level of income, education, wealth, occupation and access to resources, is well established as associated with an individual’s health and well- being. Furthermore, the correlation is evident throughout the life course. Such social vari- ables are key elements of the aetiology of ill health and disease. 1e3 The same social factors also determine the health and life chances of the unborn and newborn child and impact on early child development. These interactions have been theorised in the socialeecological model of health, which acknowledges the To cite: Weightman AL, Morgan HE, Shepherd MA, et al. Social inequality and infant health in the UK: systematic review and meta-analyses. BMJ Open 2012;2:e000964. doi:10. 1136/bmjopen-2012-000964 < Prepublication history and additional appendices for this paper are available online. To view these files please visit the journal online (http://dx. doi.org/10.1136/ bmjopen-2012-000964). Received 2 February 2012 Accepted 10 April 2012 This final article is available for use under the terms of the Creative Commons Attribution Non-Commercial 2.0 Licence; see http://bmjopen.bmj.com 1 Support Unit for Research Evidence (SURE), Information Services, Cardiff University, Cardiff, UK 2 Freelance public health researcher, Somerset, UK 3 Health, Social Services and Children Analytical Team, Welsh Government, Cardiff, UK 4 Cochrane Institute of Primary Care and Public Health, School of Medicine, Cardiff University, Cardiff, UK Correspondence to Dr Alison Lesley Weightman; [email protected] ARTICLE SUMMARY Article focus - To determine the association between area and individual measures of social disadvantage and infant health in the UK. Key messages - It is possible to be reasonably confident of the magnitude of effect of social disadvantage on health outcomes for UK infants, in particular the effects of area or individual deprivation on birth outcomes and infant mortality. - The magnitude of effect, of a range of measures of social disadvantage on infant health outcomes, is broadly similar and has remained so over the past 30 years. - Future research should concentrate on the more proximal determinants of infant health outcomes (such as individual maternal and infant factors) and the impact of any interventions employed to mitigate these determinants. Strengths and limitations of this study - A rigorous systematic review and accompanying meta-analyses provide confidence in the findings. - Specific relevance to the UK. - A risk of publication bias (missing studies) cannot be ruled out though, given the large size of many included studies, the likely effect is minimal. - The review concentrates on health outcomes only. Weightman AL, Morgan HE, Shepherd MA, et al. BMJ Open 2012;2:e000964. doi:10.1136/bmjopen-2012-000964 1 Open Access Research on 2 January 2019 by guest. Protected by copyright. http://bmjopen.bmj.com/ BMJ Open: first published as 10.1136/bmjopen-2012-000964 on 14 June 2012. Downloaded from
Transcript of Social inequality and infant health in the UK: systematic review and meta-analyses
Social inequality and infant health inthe UK: systematic review andmeta-analyses
Alison L Weightman,1 Helen E Morgan,1 Michael A Shepherd,2 Hilary Kitcher,1
Chris Roberts,3 Frank D Dunstan4
ABSTRACTObjectives: To determine the association betweenarea and individual measures of social disadvantageand infant health in the UK.
Design: Systematic review and meta-analyses.
Data sources: 26 databases and websites, referencelists, experts in the field and hand-searching.
Study selection: 36 prospective and retrospectiveobservational studies with socioeconomic data andhealth outcomes for infants in the UK, published from1994 to May 2011.
Data extraction and synthesis: 2 independentreviewers assessed the methodological quality of thestudies and abstracted data. Where possible, studyoutcomes were reported as ORs for the highest versusthe lowest deprivation quintile.
Results: In relation to the highest versus lowest areadeprivation quintiles, the odds of adverse birthoutcomes were 1.81 (95% CI 1.71 to 1.92) for lowbirth weight, 1.67 (95% CI 1.42 to 1.96) for prematurebirth and 1.54 (95% CI 1.39 to 1.72) for stillbirth. Forinfant mortality rates, the ORs were 1.72 (95% CI 1.37to 2.15) overall, 1.61 (95% CI 1.08 to 2.39) forneonatal and 2.31 (95% CI 2.03 to 2.64) for post-neonatal mortality. For lowest versus highest socialclass, the odds were 1.79 (95% CI 1.43 to 2.24) forlow birth weight, 1.52 (95% CI 1.44 to 1.61) for overallinfant mortality, 1.42 (95% CI 1.33 to1.51) forneonatal and 1.69 (95% CI 1.53 to 1.87) for post-neonatal mortality. There are similar patterns for otherinfant health outcomes with the possible exception offailure to thrive, where there is no clear association.
Conclusions: This review quantifies the influence ofsocial disadvantage on infant outcomes in the UK. Themagnitude of effect is similar across a range of areaand individual deprivation measures and birth andmortality outcomes. Further research should explorethe factors that are more proximal to mothers andinfants, to help throw light on the most appropriatetimes to provide support and the form(s) that thissupport should take.
INTRODUCTIONSocioeconomic status, as indicated by level ofincome, education, wealth, occupation andaccess to resources, is well established asassociated with an individual’s health and well-being. Furthermore, the correlation is evidentthroughout the life course. Such social vari-ables are key elements of the aetiology of illhealth and disease.1e3 The same social factorsalso determine the health and life chances ofthe unborn and newborn child and impact onearly child development. These interactionshave been theorised in the socialeecologicalmodel of health, which acknowledges the
To cite: Weightman AL,Morgan HE, Shepherd MA,et al. Social inequality andinfant health in the UK:systematic review andmeta-analyses. BMJ Open2012;2:e000964. doi:10.1136/bmjopen-2012-000964
< Prepublication history andadditional appendices for thispaper are available online. Toview these files please visitthe journal online (http://dx.doi.org/10.1136/bmjopen-2012-000964).
Received 2 February 2012Accepted 10 April 2012
This final article is availablefor use under the terms ofthe Creative CommonsAttribution Non-Commercial2.0 Licence; seehttp://bmjopen.bmj.com
1Support Unit for ResearchEvidence (SURE),Information Services, CardiffUniversity, Cardiff, UK2Freelance public healthresearcher, Somerset, UK3Health, Social Services andChildren Analytical Team,Welsh Government, Cardiff,UK4Cochrane Institute ofPrimary Care and PublicHealth, School of Medicine,Cardiff University, Cardiff, UK
Correspondence toDr Alison Lesley Weightman;[email protected]
ARTICLE SUMMARY
Article focus- To determine the association between area and
individual measures of social disadvantage andinfant health in the UK.
Key messages- It is possible to be reasonably confident of the
magnitude of effect of social disadvantage onhealth outcomes for UK infants, in particular theeffects of area or individual deprivation on birthoutcomes and infant mortality.
- The magnitude of effect, of a range of measuresof social disadvantage on infant health outcomes,is broadly similar and has remained so over thepast 30 years.
- Future research should concentrate on the moreproximal determinants of infant health outcomes(such as individual maternal and infant factors)and the impact of any interventions employed tomitigate these determinants.
Strengths and limitations of this study- A rigorous systematic review and accompanying
meta-analyses provide confidence in the findings.- Specific relevance to the UK.- A risk of publication bias (missing studies) cannot
be ruled out though, given the large size of manyincluded studies, the likely effect is minimal.
- The review concentrates on health outcomesonly.
Weightman AL, Morgan HE, Shepherd MA, et al. BMJ Open 2012;2:e000964. doi:10.1136/bmjopen-2012-000964 1
Open Access Research
on 2 January 2019 by guest. Protected by copyright.
http://bmjopen.bm
j.com/
BM
J Open: first published as 10.1136/bm
jopen-2012-000964 on 14 June 2012. Dow
nloaded from
cumulative impact of individual, familial, community andsocietal forces on people’s health.4 5
The UK government and devolved administrations arecommitted to tackling the social, economic and envi-ronmental factors that influence health throughevidence-based approaches to the underlying socialdeterminants of ill health and to interventions to addressthese inequalities.6e9 This approach is in line with theconclusions of WHO sponsored Commission on theSocial Determinants of Health.3
Birth and early development play a vital role increating and maintaining socioeconomic healthinequalities through adulthood.6 10 From a pathwayapproach, early development from conception to 5 yearsof age is widely accepted as establishing the foundationfor learning, behaviour and health throughout the lifecycle.11 WHO Commission on the Social Determinantsof Health in particular stressed the critical role of childhealth in addressing inequities in health. Investments inchild health and development are seen as forces toequalise health status through the life course.3 Thesepoints were reiterated in the recent Marmot Review,which particularly stressed the importance of givingevery child the best possible start in life.6
There is an implicit recognition of the importance ofsocial determinants to the well-being of children innational policy. For example, a stated aim of ’HealthyLives, Brighter Futures’ is to get the right services, adviceand support to all parents with more intensive supportfor the most vulnerable.12
The UK performs very poorly in comparison withsimilar countries on mortality among the under 5s.13 Arecent index of child well-being in the European Union14
suggested that the UK ranked 24/29 for both child healthfrom birth and overall child well-being. Furthermore, theUK had a stillbirth rate of 3.5 per 1000 births in 2009.Within high-income nations, only France and Austria hadhigher levels.15 Such poor outcomes in comparison to ournearest neighbours suggest that significant action isrequired to improve health and well-being in childhood.The objectives of this review were to assess the current
evidence for the effects of social disadvantage on birthand infant outcomes for children born in the UK toprovide a firm basis for practitioners and policy makerson which to measure the effect of interventions toaddress these inequalities. This systematic review buildson a previous review of prospective studies carried outfor the Welsh government to examine the social deter-minants of child health in the UK and to develop socialindicators from these determinants.16
This analysis provides a current summary of relevant andwell-conducted epidemiological research into the linksbetween social determinants and infant health in the UK.
METHODSInclusion/exclusion criteriaResearch studies were sought that reported socioeco-nomic data and health outcomes for infants (0e12
months) and were carried out in the UK and publishedbetween January 1994 and May 2011. The most recentupdate search was completed on 19 May 2011. Therewere no language exclusions. A ‘best evidence’ approachwas adopted by using data from longitudinal and recordlinkage studies. Prospective cohort, caseecontrol andretrospective cohort studies with a sample size of 200 ormore were included, as well as record linkage analyses ofroutinely collected data. Case studies and cross-sectionalsurveys (with data from a single time point) wereexcluded.The outcome criteria for the studies were preterm
birth, birth weight, mortality, diagnosed illness, atten-dance at primary or secondary care in relation to illhealth, infection, injury or disability, growth and devel-opment. The social determinants explored were specificarea-based and individual measures of social disadvan-tage which included area deprivation scores17e20 andindividual measures of deprivation (occupational socialclass, household income/poverty, parental educationalstatus). Lone parenthood was also included as a socialdeterminant, albeit not a direct measure of socialdisadvantage.To ensure that the review focused on specific infant
health outcomes for the general current population,papers on the following topics were excluded: congenitalmalformations, in-care or adopted infants, infants withpre-existing medical conditions, specific subgroups ofmothers (eg, previous major pregnancy complication)and data from pre-1970. Access to treatment orscreening services, immunisation uptake, child abuse ordomestic violence studies were excluded unless reportedwith a social determinant and child health outcome.
Search sources and search strategyThe following databases, websites and other sources weresearched: ASSIA (Cambridge Scientific Abstracts);British Nursing Index (OVID); ChildData; CINAHL(Ebsco); Community Wise; Conference ProceedingsCitation IndexdScience and Social Science & Humani-ties (Web of Science); Embase (OVID); EPPI CentreDoPHER; HMIC (OVID); Joseph Rowntree Foundation;Local Government Data Unit Wales; Medline (OVID);Medline in Process (OVID); NHS Plans and NationalService Frameworks for Wales and England in relation tochildren; National Institute for Health and ClinicalExcellence (NICE); Office for National Statistics;PsycINFO (OVID); ReFER (archive up to September2007); Science Citation Index (Web of Science); OpenSIGLE (replaced by OpenGrey), Social Care Online;Social Science Citation Index (Web of Science); SocialServices Abstracts; Sociological Abstracts (CambridgeScientific Abstracts); WHO Health Evidence Network.The search terms were developed and tested by qual-
ified librarians (HK and ALW) in one database, Medline,to a high recall of relevant studies (sensitive) without toomany irrelevant studies (specific).The following search terms were used in Medline
(where * is the truncation symbol; ab¼abstract;
2 Weightman AL, Morgan HE, Shepherd MA, et al. BMJ Open 2012;2:e000964. doi:10.1136/bmjopen-2012-000964
Social inequality and infant health in the UK: systematic review
on 2 January 2019 by guest. Protected by copyright.
http://bmjopen.bm
j.com/
BM
J Open: first published as 10.1136/bm
jopen-2012-000964 on 14 June 2012. Dow
nloaded from
cp¼country of publication, pt¼publication type; ti¼title;/¼subject heading):
Infant healthExp infants/OR (Babies or baby or birth* or infant* orneonatal or newborn or perinatal or postnatal orneonatal or perinatal).ab,ti.
ANDSocial determinantsExp socioeconomic factors/OR exp social class/OR(benefit recipient* or deprivation or economic inactivityor educational achievement or educational attainmentor employment status or financial hardship or homeown* or house own* or housing tenure or inequalit* orinequit* or job opportunit* or lone parent or lowincome or low pay or marital separation) OR (neglect orovercrowd* or poor environment or poor housing orpoverty or property own* or prosperity or single parent*or social adversity or social capital or social class or socialdisadvantage or social disparit* or social exclusion orsocial inclusion or social gradient or social housing orsocial integration or social interaction) OR (socialisolation or social mobility or social network* or socialposition or social relationship* or social security orsocial status or social stigma or social trend* or socialwelfare or sociodemographic or socioeconomic or socio-demographic or socio-economic or sole parent orstandard of living or unemploy*).ab,ti.
ANDStudy designsexp Meta-Analysis/ OR review.pt OR (census* or cohort*or survey* or evaluat* or longitudinal* or questionnaire*or meta-analys* or metaanaly* or meta analys* orregistry or registries or systematic* review* or systematicoverview).ti,ab.
ANDExp Great Britain/ OR (UK OR United Kingdom OREngland OR Wales OR Scotland OR Britain OR BritishOR English OR Welsh OR Ireland OR Irish OR Scot-tish).ti,ab,cp.Searches were adapted to other databases to replicate,
as closely as possible, the Medline search. In addition,and to minimise the potential for publication bias,a range of supplementary (‘snowballing’) techniques wasused to increase the sensitivity of the search and toensure coverage of grey literature and unpublishedstudies. These included reference list follow-up, citationtracking of relevant studies (to find newer studies),contact with subject experts and organisations, and tableof contents scanning for the journals that appeared mostfrequently in the list of relevant studies: Journal ofEpidemiology and Community Health, Archives of Disease inChildhood (including the Fetal and Neonatal edition) andBritish Medical Journal. Finally, all systematic reviews onrelevant topics were unpicked for primary studies
meeting inclusion/exclusion criteria. This included thepublication on which this review builds16 and a morerecent systematic search carried out by members of thesame team for the Welsh government to support thedevelopment of a Child Health Monitor.21
Duplicate references were excluded. All titles and,where necessary, abstracts were then screened to elimi-nate duplicates and obviously irrelevant citations. Thefull text of all potentially relevant papers was retrievedand screened independently for eligibility by tworeviewers using a standardised eligibility form, withadjudication from a third reviewer in cases of disagree-ment (HK, HEM, MAS and ALW).Following screening of 5173 citations found in the
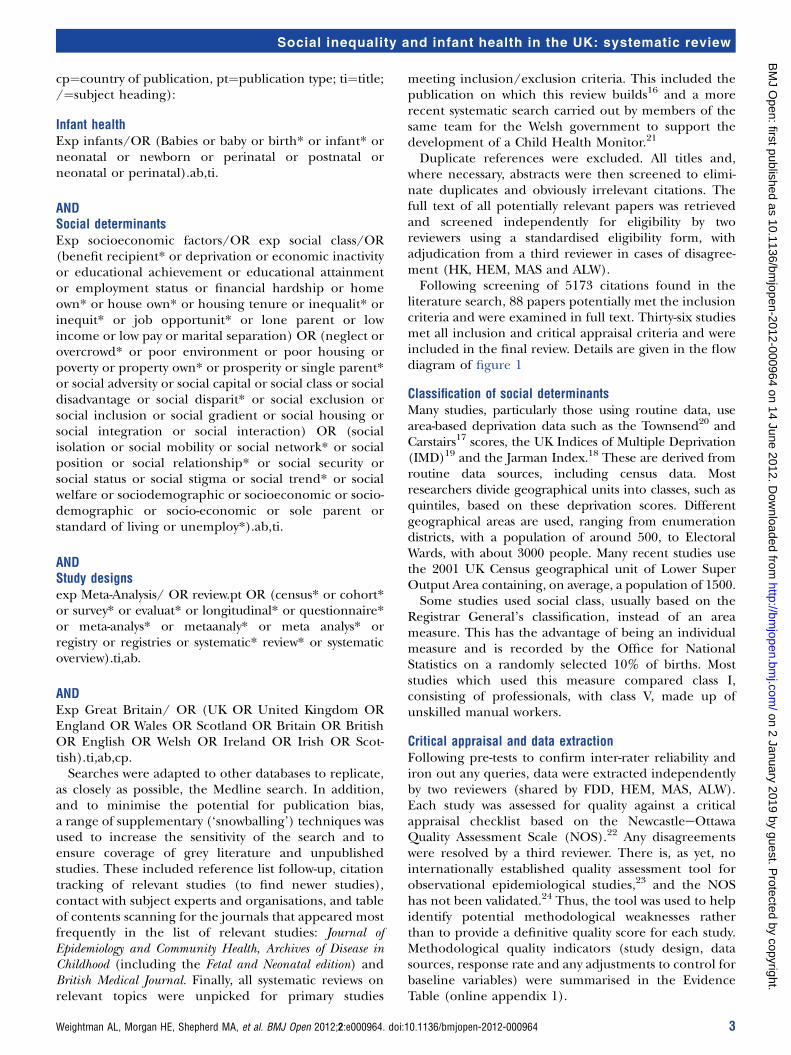
literature search, 88 papers potentially met the inclusioncriteria and were examined in full text. Thirty-six studiesmet all inclusion and critical appraisal criteria and wereincluded in the final review. Details are given in the flowdiagram of figure 1
Classification of social determinantsMany studies, particularly those using routine data, usearea-based deprivation data such as the Townsend20 andCarstairs17 scores, the UK Indices of Multiple Deprivation(IMD)19 and the Jarman Index.18 These are derived fromroutine data sources, including census data. Mostresearchers divide geographical units into classes, such asquintiles, based on these deprivation scores. Differentgeographical areas are used, ranging from enumerationdistricts, with a population of around 500, to ElectoralWards, with about 3000 people. Many recent studies usethe 2001 UK Census geographical unit of Lower SuperOutput Area containing, on average, a population of 1500.Some studies used social class, usually based on the
Registrar General’s classification, instead of an areameasure. This has the advantage of being an individualmeasure and is recorded by the Office for NationalStatistics on a randomly selected 10% of births. Moststudies which used this measure compared class I,consisting of professionals, with class V, made up ofunskilled manual workers.
Critical appraisal and data extractionFollowing pre-tests to confirm inter-rater reliability andiron out any queries, data were extracted independentlyby two reviewers (shared by FDD, HEM, MAS, ALW).Each study was assessed for quality against a criticalappraisal checklist based on the NewcastleeOttawaQuality Assessment Scale (NOS).22 Any disagreementswere resolved by a third reviewer. There is, as yet, nointernationally established quality assessment tool forobservational epidemiological studies,23 and the NOShas not been validated.24 Thus, the tool was used to helpidentify potential methodological weaknesses ratherthan to provide a definitive quality score for each study.Methodological quality indicators (study design, datasources, response rate and any adjustments to control forbaseline variables) were summarised in the EvidenceTable (online appendix 1).
Weightman AL, Morgan HE, Shepherd MA, et al. BMJ Open 2012;2:e000964. doi:10.1136/bmjopen-2012-000964 3
Social inequality and infant health in the UK: systematic review
on 2 January 2019 by guest. Protected by copyright.
http://bmjopen.bm
j.com/
BM
J Open: first published as 10.1136/bm
jopen-2012-000964 on 14 June 2012. Dow
nloaded from
A paper was excluded if it did not provide usable datato allow a quantitative comparison of the risk for a healthoutcome in relation to a measure of individual or areasocial inequality with an indication of statistical signifi-cance (CI or p value). If a research publication reporteda non-significant result without supporting data, but thestatistical rigour suggested that this was a reliable result,a non-significant result was recorded. In the latter case, itwas clearly not possible to include these papers in anymeta-analysis.The key components of the data extraction and critical
appraisal outcomes are presented in the Evidence Table(online appendix 1). Details of the eligibility, criticalappraisal and data extraction methods are available fromthe authors.Study outcomes were analysed by a statistician (FDD)
and reported as described by the authors of each paper.Where possible, outcomes were reported as an ‘effectsize’ observed with subjects from highest versus lowestdeprivation exposures in the Evidence Table (onlineappendix 1 and 2) to allow comparability betweenstudies. In some cases, the authors did not report thedata in the most suitable way, but it was possible tocalculate effect sizes and CIs from the data shown.Where possible, an OR comparing the highest andlowest deprivation levels was calculated, as this was themost commonly reported measure. As most outcomesmeasured were relatively rare, differences between rela-tive risks and ORs will be modest. Some studies adjustedthe ORs to allow for confounders, and where possible,the most adjusted data have been reported.Meta-analyses were carried out, where possible, when
a group of papers were sufficiently homogeneous inrespect of both outcome and deprivation measures.Because adjustments varied between studies, these anal-
yses were carried out on unadjusted results. Randomeffects models were used to allow for heterogeneity. Thenumber of studies on any one outcome was too smallfor funnel plots to be of any value so the risk of publi-cation bias cannot be excluded. However, given the hugesize of many of the studies included, CIs are quitenarrow and missing small studies would likely have littleeffect.
RESULTSThirty-six studies met the inclusion criteria, of which 13were prospective cohort (longitudinal) or caseecontrolstudies and 23 were based on data collected retrospec-tively from medical records or routinely collected data(eg, record linkage between a health outcomes registerand census data). Findings are summarised in table 1and detailed in the text. Summary data from eachincluded study are given in online appendix 1.
Birth weight, prematurity and cerebral palsyBirth weight, prematurity and cerebral palsy are veryclosely linked outcomes,41 which are consideredtogether.
Low birth weightNine studies (Paranjothy, 2010, unpublished)25e31 42
considered the outcome of low birth weight or very lowbirth weight, defined as <2500 g or <1500 g, respec-tively; none considered birth weight as a continuousoutcome.These are all based on large routinely collected data
sets but they differ in the measures of deprivation usedand in the adjustments made in analyses. In general, thestudies did not control for gestational age to distinguishpremature from small-for-dates babies.
Figure 1 Flow diagram. Potentially relevant papers identified and screened = 5173
Abstracts clearly not relevant to review topic = 5096
Papers clearly not meeting
inclusion/exclusion criteria when examined in
full text = 39
Papers appearing to meet inclusion/exclusion criteria and
examined in full text = 88
Additional papers appearing to meet inclusion/exclusion criteria found via
snowballing techniques = 11
Included studies = 36
Prospective cohort or case control = 13 Retrospective cohort or analyses of routinely collected data (record linkage) = 23
Study reports selected for detailed critical appraisal and data extraction = 49
Studies excluded at critical appraisal
stage = 13
4 Weightman AL, Morgan HE, Shepherd MA, et al. BMJ Open 2012;2:e000964. doi:10.1136/bmjopen-2012-000964
Social inequality and infant health in the UK: systematic review
on 2 January 2019 by guest. Protected by copyright.
http://bmjopen.bm
j.com/
BM
J Open: first published as 10.1136/bm
jopen-2012-000964 on 14 June 2012. Dow
nloaded from
Different studies used different time periods, and it ispossible that the effect of deprivation has changed overrecent decades. However, two studies which subdividedthe data into different decades28 31 suggest that theeffects have not changed markedly since 1980. Somestudies adjusted for confounders, typically maternal age,gender of child and whether the registration was joint orsingle parent (mother) only. ORs, adjusted for thesepotential confounders, were generally considerablycloser to the null value of 1 than unadjusted ones,reflecting the importance of these factors.In seven studies that compared area measures
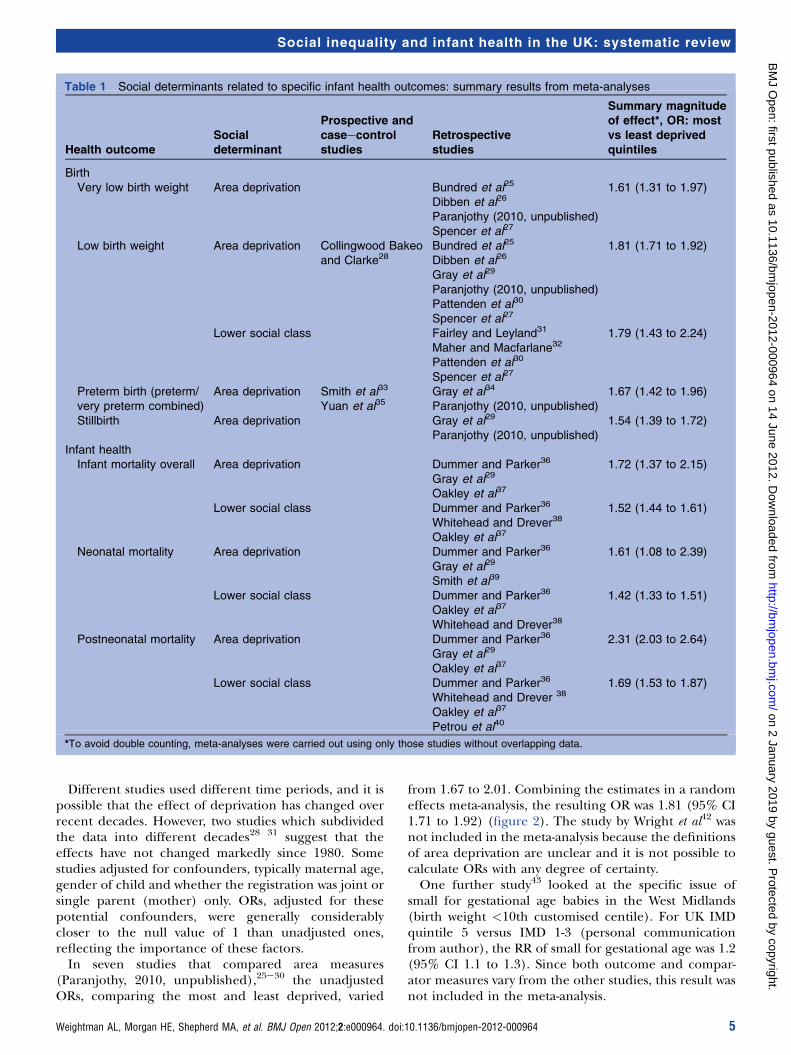
(Paranjothy, 2010, unpublished),25e30 the unadjustedORs, comparing the most and least deprived, varied
from 1.67 to 2.01. Combining the estimates in a randomeffects meta-analysis, the resulting OR was 1.81 (95% CI1.71 to 1.92) (figure 2). The study by Wright et al42 wasnot included in the meta-analysis because the definitionsof area deprivation are unclear and it is not possible tocalculate ORs with any degree of certainty.One further study43 looked at the specific issue of
small for gestational age babies in the West Midlands(birth weight <10th customised centile). For UK IMDquintile 5 versus IMD 1-3 (personal communicationfrom author), the RR of small for gestational age was 1.2(95% CI 1.1 to 1.3). Since both outcome and compar-ator measures vary from the other studies, this result wasnot included in the meta-analysis.
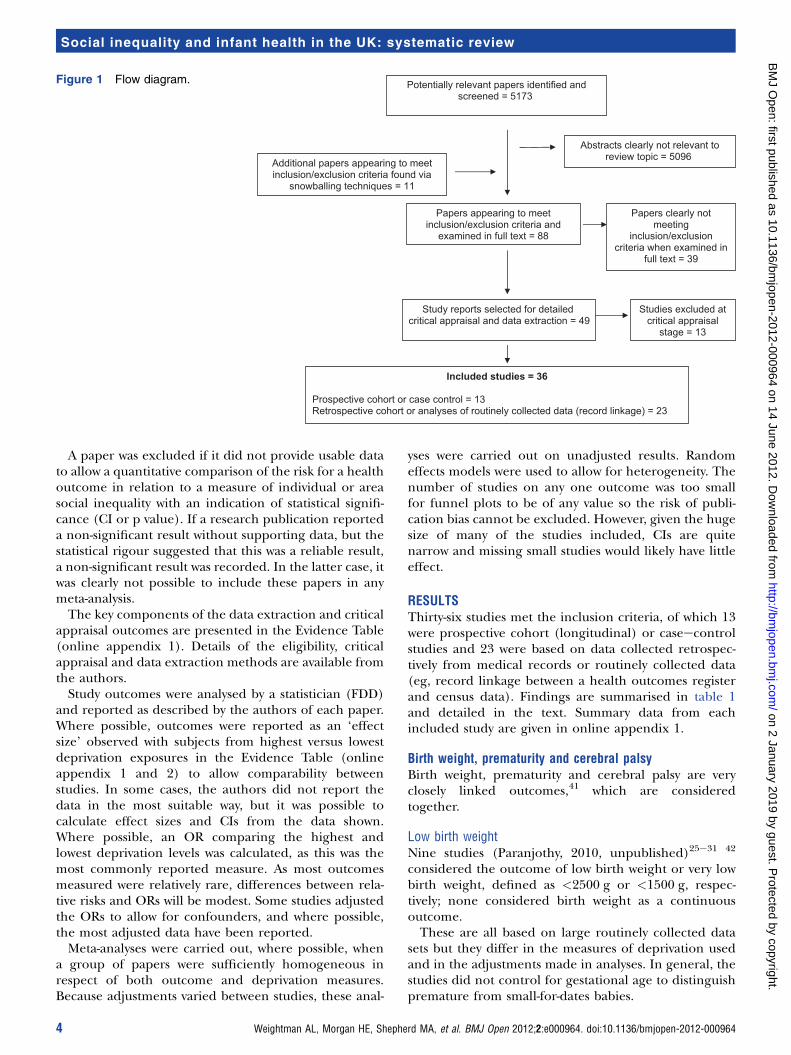
Table 1 Social determinants related to specific infant health outcomes: summary results from meta-analyses
Health outcomeSocialdeterminant
Prospective andcaseecontrolstudies
Retrospectivestudies
Summary magnitudeof effect*, OR: mostvs least deprivedquintiles
BirthVery low birth weight Area deprivation Bundred et al25 1.61 (1.31 to 1.97)
Dibben et al26
Paranjothy (2010, unpublished)Spencer et al27
Low birth weight Area deprivation Collingwood Bakeoand Clarke28
Bundred et al25 1.81 (1.71 to 1.92)Dibben et al26
Gray et al29
Paranjothy (2010, unpublished)Pattenden et al30
Spencer et al27
Lower social class Fairley and Leyland31 1.79 (1.43 to 2.24)Maher and Macfarlane32
Pattenden et al30
Spencer et al27
Preterm birth (preterm/very preterm combined)
Area deprivation Smith et al33 Gray et al34 1.67 (1.42 to 1.96)Paranjothy (2010, unpublished)Yuan et al35
Stillbirth Area deprivation Gray et al29 1.54 (1.39 to 1.72)Paranjothy (2010, unpublished)
Infant healthInfant mortality overall Area deprivation Dummer and Parker36 1.72 (1.37 to 2.15)
Gray et al29
Oakley et al37
Lower social class Dummer and Parker36 1.52 (1.44 to 1.61)Whitehead and Drever38
Oakley et al37
Neonatal mortality Area deprivation Dummer and Parker36 1.61 (1.08 to 2.39)Gray et al29
Smith et al39
Lower social class Dummer and Parker36 1.42 (1.33 to 1.51)Oakley et al37
Whitehead and Drever38
Postneonatal mortality Area deprivation Dummer and Parker36 2.31 (2.03 to 2.64)Gray et al29
Oakley et al37
Lower social class Dummer and Parker36 1.69 (1.53 to 1.87)Whitehead and Drever 38
Oakley et al37
Petrou et al40
*To avoid double counting, meta-analyses were carried out using only those studies without overlapping data.
Weightman AL, Morgan HE, Shepherd MA, et al. BMJ Open 2012;2:e000964. doi:10.1136/bmjopen-2012-000964 5
Social inequality and infant health in the UK: systematic review
on 2 January 2019 by guest. Protected by copyright.
http://bmjopen.bm
j.com/
BM
J Open: first published as 10.1136/bm
jopen-2012-000964 on 14 June 2012. Dow
nloaded from
Five studies26 27 30e32 measured deprivation at anindividual level using the Registrar General’s social classcategories. All but Maher and Macfarlane32 comparedsocial class V with social class I; Maher and Macfarlanecompared manual and non-manual workers, and this isprobably a less extreme comparison, leading to a smallerOR. For social class, as opposed to area deprivation,Dibben et al26 only reported a heavily adjusted OR of1.20 and thus was not included in the meta-analysis. Theunadjusted estimates of the OR varied from 1.45 to 2.17.Excluding Dibben et al,26 a random effects modelpooling these gave an overall estimate of 1.79 (95% CI1.43 to 2.24), very similar to the estimate for the area-based measures (figure 3).Several authors, including Fairley and Leyland31 and
Paranjothy (2010, unpublished), noted that the effectsof deprivation appeared to be greater in older mothers.This may merit further investigation.Four of the studies (Paranjothy, 2010,
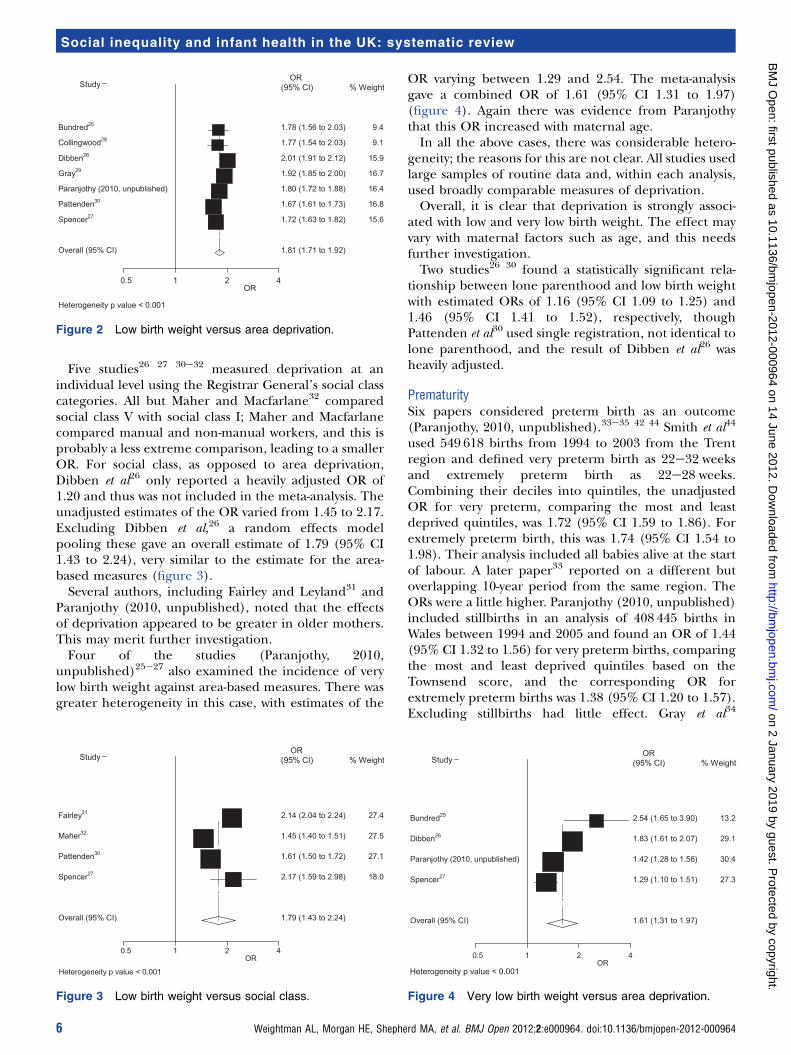
unpublished)25e27 also examined the incidence of verylow birth weight against area-based measures. There wasgreater heterogeneity in this case, with estimates of the
OR varying between 1.29 and 2.54. The meta-analysisgave a combined OR of 1.61 (95% CI 1.31 to 1.97)(figure 4). Again there was evidence from Paranjothythat this OR increased with maternal age.In all the above cases, there was considerable hetero-
geneity; the reasons for this are not clear. All studies usedlarge samples of routine data and, within each analysis,used broadly comparable measures of deprivation.Overall, it is clear that deprivation is strongly associ-
ated with low and very low birth weight. The effect mayvary with maternal factors such as age, and this needsfurther investigation.Two studies26 30 found a statistically significant rela-
tionship between lone parenthood and low birth weightwith estimated ORs of 1.16 (95% CI 1.09 to 1.25) and1.46 (95% CI 1.41 to 1.52), respectively, thoughPattenden et al30 used single registration, not identical tolone parenthood, and the result of Dibben et al26 washeavily adjusted.
PrematuritySix papers considered preterm birth as an outcome(Paranjothy, 2010, unpublished).33e35 42 44 Smith et al44
used 549 618 births from 1994 to 2003 from the Trentregion and defined very preterm birth as 22e32 weeksand extremely preterm birth as 22e28 weeks.Combining their deciles into quintiles, the unadjustedOR for very preterm, comparing the most and leastdeprived quintiles, was 1.72 (95% CI 1.59 to 1.86). Forextremely preterm birth, this was 1.74 (95% CI 1.54 to1.98). Their analysis included all babies alive at the startof labour. A later paper33 reported on a different butoverlapping 10-year period from the same region. TheORs were a little higher. Paranjothy (2010, unpublished)included stillbirths in an analysis of 408 445 births inWales between 1994 and 2005 and found an OR of 1.44(95% CI 1.32 to 1.56) for very preterm births, comparingthe most and least deprived quintiles based on theTownsend score, and the corresponding OR forextremely preterm births was 1.38 (95% CI 1.20 to 1.57).Excluding stillbirths had little effect. Gray et al34
Heterogeneity p value < 0.001
OR0.5 1 2 4
Study % WeightOR
(95% CI)
1.78 (1.56 to 2.03) Bundred25 9.4
1.77 (1.54 to 2.03) Collingwood28 9.1
2.01 (1.91 to 2.12) Dibben26 15.9
1.92 (1.85 to 2.00) Gray29 16.7
1.80 (1.72 to 1.88) Paranjothy (2010, unpublished) 16.4
1.67 (1.61 to 1.73) Pattenden30 16.8
1.72 (1.63 to 1.82) Spencer27 15.6
1.81 (1.71 to 1.92) Overall (95% CI)
Figure 2 Low birth weight versus area deprivation.
Heterogeneity p value < 0.001
OR0.5 1 2 4
Study % WeightOR
(95% CI)
2.14 (2.04 to 2.24) Fairley31 27.4
1.45 (1.40 to 1.51) Maher32 27.5
1.61 (1.50 to 1.72) Pattenden30 27.1
2.17 (1.59 to 2.98) Spencer27 18.0
1.79 (1.43 to 2.24) Overall (95% CI)
Figure 3 Low birth weight versus social class.
Heterogeneity p value < 0.001OR
0.5 1 2 4
Study % WeightOR
(95% CI)
2.54 (1.65 to 3.90) Bundred25 13.2
1.83 (1.61 to 2.07) Dibben26 29.1
1.42 (1.28 to 1.56) Paranjothy (2010, unpublished) 30.4
1.29 (1.10 to 1.51) Spencer27 27.3
1.61 (1.31 to 1.97) Overall (95% CI)
Figure 4 Very low birth weight versus area deprivation.
6 Weightman AL, Morgan HE, Shepherd MA, et al. BMJ Open 2012;2:e000964. doi:10.1136/bmjopen-2012-000964
Social inequality and infant health in the UK: systematic review
on 2 January 2019 by guest. Protected by copyright.
http://bmjopen.bm
j.com/
BM
J Open: first published as 10.1136/bm
jopen-2012-000964 on 14 June 2012. Dow
nloaded from
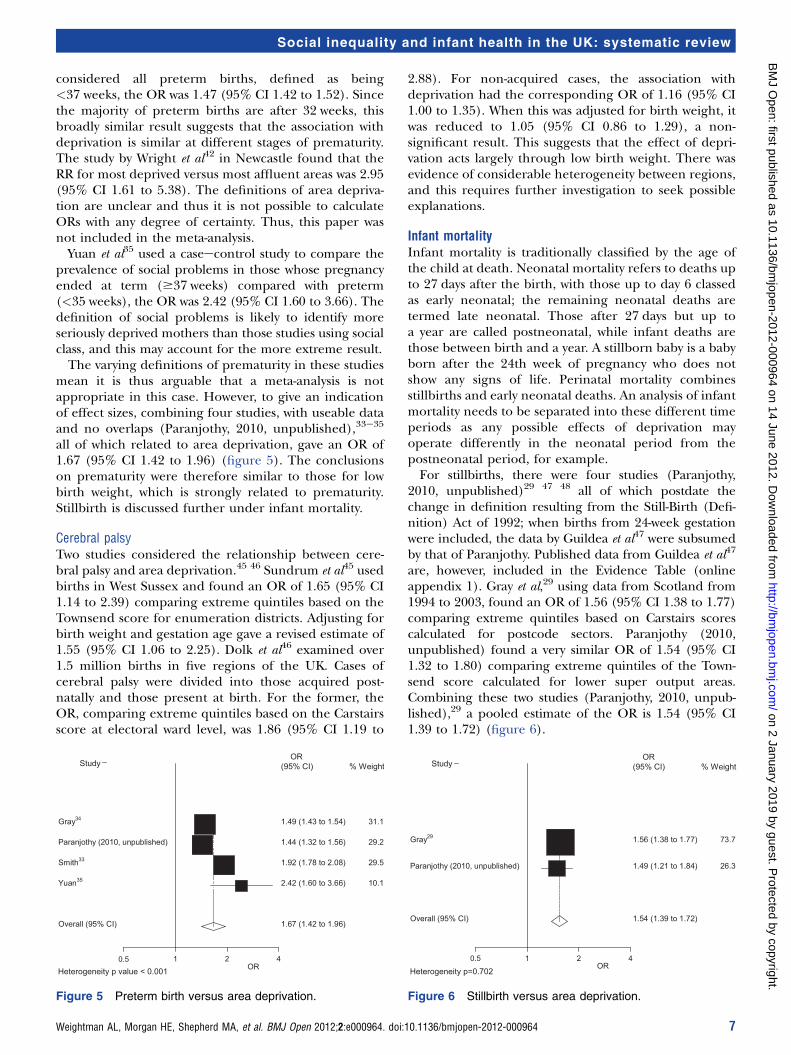
considered all preterm births, defined as being<37 weeks, the OR was 1.47 (95% CI 1.42 to 1.52). Sincethe majority of preterm births are after 32 weeks, thisbroadly similar result suggests that the association withdeprivation is similar at different stages of prematurity.The study by Wright et al42 in Newcastle found that theRR for most deprived versus most affluent areas was 2.95(95% CI 1.61 to 5.38). The definitions of area depriva-tion are unclear and thus it is not possible to calculateORs with any degree of certainty. Thus, this paper wasnot included in the meta-analysis.Yuan et al35 used a caseecontrol study to compare the
prevalence of social problems in those whose pregnancyended at term ($37 weeks) compared with preterm(<35 weeks), the OR was 2.42 (95% CI 1.60 to 3.66). Thedefinition of social problems is likely to identify moreseriously deprived mothers than those studies using socialclass, and this may account for the more extreme result.The varying definitions of prematurity in these studies
mean it is thus arguable that a meta-analysis is notappropriate in this case. However, to give an indicationof effect sizes, combining four studies, with useable dataand no overlaps (Paranjothy, 2010, unpublished),33e35
all of which related to area deprivation, gave an OR of1.67 (95% CI 1.42 to 1.96) (figure 5). The conclusionson prematurity were therefore similar to those for lowbirth weight, which is strongly related to prematurity.Stillbirth is discussed further under infant mortality.
Cerebral palsyTwo studies considered the relationship between cere-bral palsy and area deprivation.45 46 Sundrum et al45 usedbirths in West Sussex and found an OR of 1.65 (95% CI1.14 to 2.39) comparing extreme quintiles based on theTownsend score for enumeration districts. Adjusting forbirth weight and gestation age gave a revised estimate of1.55 (95% CI 1.06 to 2.25). Dolk et al46 examined over1.5 million births in five regions of the UK. Cases ofcerebral palsy were divided into those acquired post-natally and those present at birth. For the former, theOR, comparing extreme quintiles based on the Carstairsscore at electoral ward level, was 1.86 (95% CI 1.19 to
2.88). For non-acquired cases, the association withdeprivation had the corresponding OR of 1.16 (95% CI1.00 to 1.35). When this was adjusted for birth weight, itwas reduced to 1.05 (95% CI 0.86 to 1.29), a non-significant result. This suggests that the effect of depri-vation acts largely through low birth weight. There wasevidence of considerable heterogeneity between regions,and this requires further investigation to seek possibleexplanations.
Infant mortalityInfant mortality is traditionally classified by the age ofthe child at death. Neonatal mortality refers to deaths upto 27 days after the birth, with those up to day 6 classedas early neonatal; the remaining neonatal deaths aretermed late neonatal. Those after 27 days but up toa year are called postneonatal, while infant deaths arethose between birth and a year. A stillborn baby is a babyborn after the 24th week of pregnancy who does notshow any signs of life. Perinatal mortality combinesstillbirths and early neonatal deaths. An analysis of infantmortality needs to be separated into these different timeperiods as any possible effects of deprivation mayoperate differently in the neonatal period from thepostneonatal period, for example.For stillbirths, there were four studies (Paranjothy,
2010, unpublished)29 47 48 all of which postdate thechange in definition resulting from the Still-Birth (Defi-nition) Act of 1992; when births from 24-week gestationwere included, the data by Guildea et al47 were subsumedby that of Paranjothy. Published data from Guildea et al47
are, however, included in the Evidence Table (onlineappendix 1). Gray et al,29 using data from Scotland from1994 to 2003, found an OR of 1.56 (95% CI 1.38 to 1.77)comparing extreme quintiles based on Carstairs scorescalculated for postcode sectors. Paranjothy (2010,unpublished) found a very similar OR of 1.54 (95% CI1.32 to 1.80) comparing extreme quintiles of the Town-send score calculated for lower super output areas.Combining these two studies (Paranjothy, 2010, unpub-lished),29 a pooled estimate of the OR is 1.54 (95% CI1.39 to 1.72) (figure 6).
Heterogeneity p value < 0.001 OR0.5 1 2 4
Study % WeightOR
(95% CI)
1.49 (1.43 to 1.54) Gray34 31.1
1.44 (1.32 to 1.56) Paranjothy (2010, unpublished) 29.2
1.92 (1.78 to 2.08) Smith33 29.5
2.42 (1.60 to 3.66) Yuan35 10.1
1.67 (1.42 to 1.96) Overall (95% CI)
Figure 5 Preterm birth versus area deprivation.
Heterogeneity p=0.702OR
0.5 1 2 4
Study % WeightOR
(95% CI)
1.56 (1.38 to 1.77) Gray29 73.7
1.49 (1.21 to 1.84) Paranjothy (2010, unpublished) 26.3
1.54 (1.39 to 1.72) Overall (95% CI)
Figure 6 Stillbirth versus area deprivation.
Weightman AL, Morgan HE, Shepherd MA, et al. BMJ Open 2012;2:e000964. doi:10.1136/bmjopen-2012-000964 7
Social inequality and infant health in the UK: systematic review
on 2 January 2019 by guest. Protected by copyright.
http://bmjopen.bm
j.com/
BM
J Open: first published as 10.1136/bm
jopen-2012-000964 on 14 June 2012. Dow
nloaded from
Smeeton et al48 used a caseecontrol study in a HealthAuthority in London to study stillbirths, using theJarman score to measure deprivation. The presumptionis that the results were not statistically significant as nouseable data were shown.Bambang et al49 was most concerned with specific
causes of perinatal death in one English region; theassociation with deprivation varied relatively little withcause, and combining the causes gave an OR of 1.91(95% CI 1.66 to 2.20) comparing extreme quintilesbased on Townsend scores.Four studies36 40 47 48 examined early neonatal death
as a separate outcome; all but Smeeton also consideredlate neonatal mortality. Two of these studies40 47 foundthat the risk of late neonatal mortality was higher inmore deprived areas, with very different ORs. Generally,results varied considerably and details are shown inonline appendix 1. There was more evidence for anassociation of deprivation with late neonatal than earlyneonatal deaths.Whitehead and Drever38 gave results for perinatal
mortality, which includes stillbirths and early neonataldeaths within 7 days of birth. Using data on over 14million births from a 22-year period from England andWales, they found an OR of 1.35 (95% CI 1.30 to 1.40).Whitehead and Drever38 also compared overall
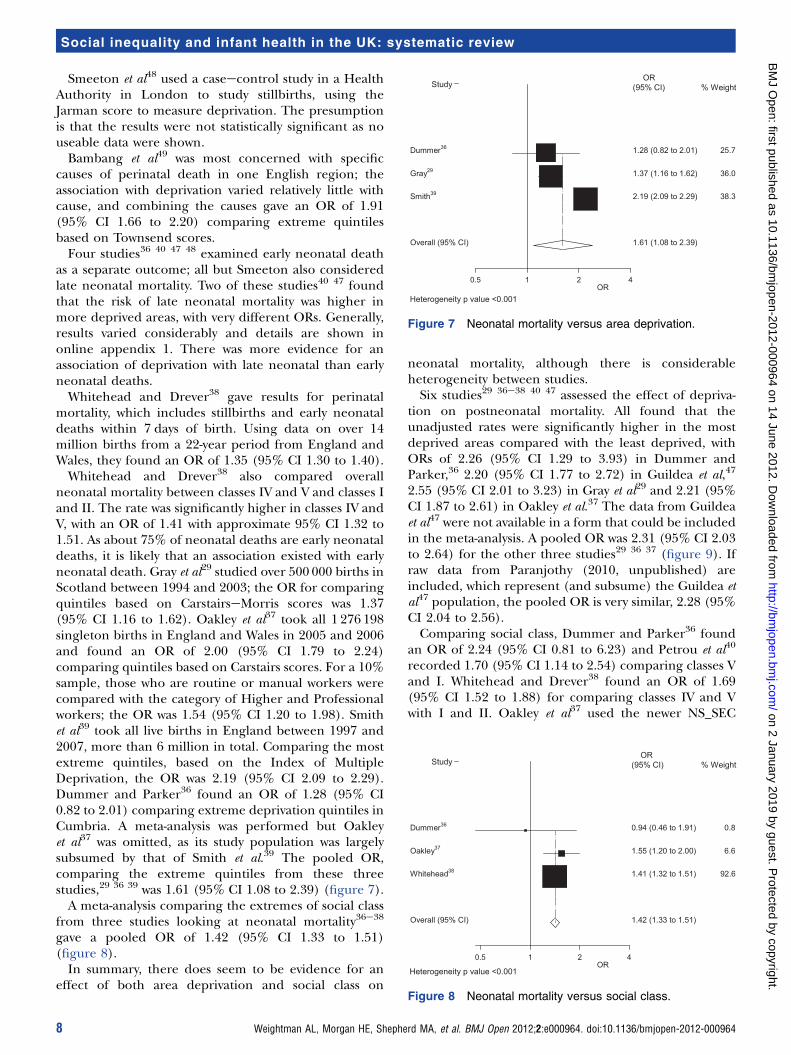
neonatal mortality between classes IV and V and classes Iand II. The rate was significantly higher in classes IV andV, with an OR of 1.41 with approximate 95% CI 1.32 to1.51. As about 75% of neonatal deaths are early neonataldeaths, it is likely that an association existed with earlyneonatal death. Gray et al29 studied over 500 000 births inScotland between 1994 and 2003; the OR for comparingquintiles based on CarstairseMorris scores was 1.37(95% CI 1.16 to 1.62). Oakley et al37 took all 1 276 198singleton births in England and Wales in 2005 and 2006and found an OR of 2.00 (95% CI 1.79 to 2.24)comparing quintiles based on Carstairs scores. For a 10%sample, those who are routine or manual workers werecompared with the category of Higher and Professionalworkers; the OR was 1.54 (95% CI 1.20 to 1.98). Smithet al39 took all live births in England between 1997 and2007, more than 6 million in total. Comparing the mostextreme quintiles, based on the Index of MultipleDeprivation, the OR was 2.19 (95% CI 2.09 to 2.29).Dummer and Parker36 found an OR of 1.28 (95% CI0.82 to 2.01) comparing extreme deprivation quintiles inCumbria. A meta-analysis was performed but Oakleyet al37 was omitted, as its study population was largelysubsumed by that of Smith et al.39 The pooled OR,comparing the extreme quintiles from these threestudies,29 36 39 was 1.61 (95% CI 1.08 to 2.39) (figure 7).A meta-analysis comparing the extremes of social class
from three studies looking at neonatal mortality36e38
gave a pooled OR of 1.42 (95% CI 1.33 to 1.51)(figure 8).In summary, there does seem to be evidence for an
effect of both area deprivation and social class on
neonatal mortality, although there is considerableheterogeneity between studies.Six studies29 36e38 40 47 assessed the effect of depriva-
tion on postneonatal mortality. All found that theunadjusted rates were significantly higher in the mostdeprived areas compared with the least deprived, withORs of 2.26 (95% CI 1.29 to 3.93) in Dummer andParker,36 2.20 (95% CI 1.77 to 2.72) in Guildea et al,47
2.55 (95% CI 2.01 to 3.23) in Gray et al29 and 2.21 (95%CI 1.87 to 2.61) in Oakley et al.37 The data from Guildeaet al47 were not available in a form that could be includedin the meta-analysis. A pooled OR was 2.31 (95% CI 2.03to 2.64) for the other three studies29 36 37 (figure 9). Ifraw data from Paranjothy (2010, unpublished) areincluded, which represent (and subsume) the Guildea etal47 population, the pooled OR is very similar, 2.28 (95%CI 2.04 to 2.56).Comparing social class, Dummer and Parker36 found
an OR of 2.24 (95% CI 0.81 to 6.23) and Petrou et al40
recorded 1.70 (95% CI 1.14 to 2.54) comparing classes Vand I. Whitehead and Drever38 found an OR of 1.69(95% CI 1.52 to 1.88) for comparing classes IV and Vwith I and II. Oakley et al37 used the newer NS_SEC
Heterogeneity p value <0.001OR
0.5 1 2 4
Study % WeightOR
(95% CI)
1.28 (0.82 to 2.01)Dummer36 25.7
1.37 (1.16 to 1.62)Gray29 36.0
2.19 (2.09 to 2.29)Smith39 38.3
1.61 (1.08 to 2.39)Overall (95% CI)
Figure 7 Neonatal mortality versus area deprivation.
Heterogeneity p value <0.001OR
0.5 1 2 4
Study % WeightOR
(95% CI)
0.94 (0.46 to 1.91) Dummer36 0.8
1.55 (1.20 to 2.00) Oakley37 6.6
1.41 (1.32 to 1.51) Whitehead38 92.6
1.42 (1.33 to 1.51) Overall (95% CI)
Figure 8 Neonatal mortality versus social class.
8 Weightman AL, Morgan HE, Shepherd MA, et al. BMJ Open 2012;2:e000964. doi:10.1136/bmjopen-2012-000964
Social inequality and infant health in the UK: systematic review
on 2 January 2019 by guest. Protected by copyright.
http://bmjopen.bm
j.com/
BM
J Open: first published as 10.1136/bm
jopen-2012-000964 on 14 June 2012. Dow
nloaded from
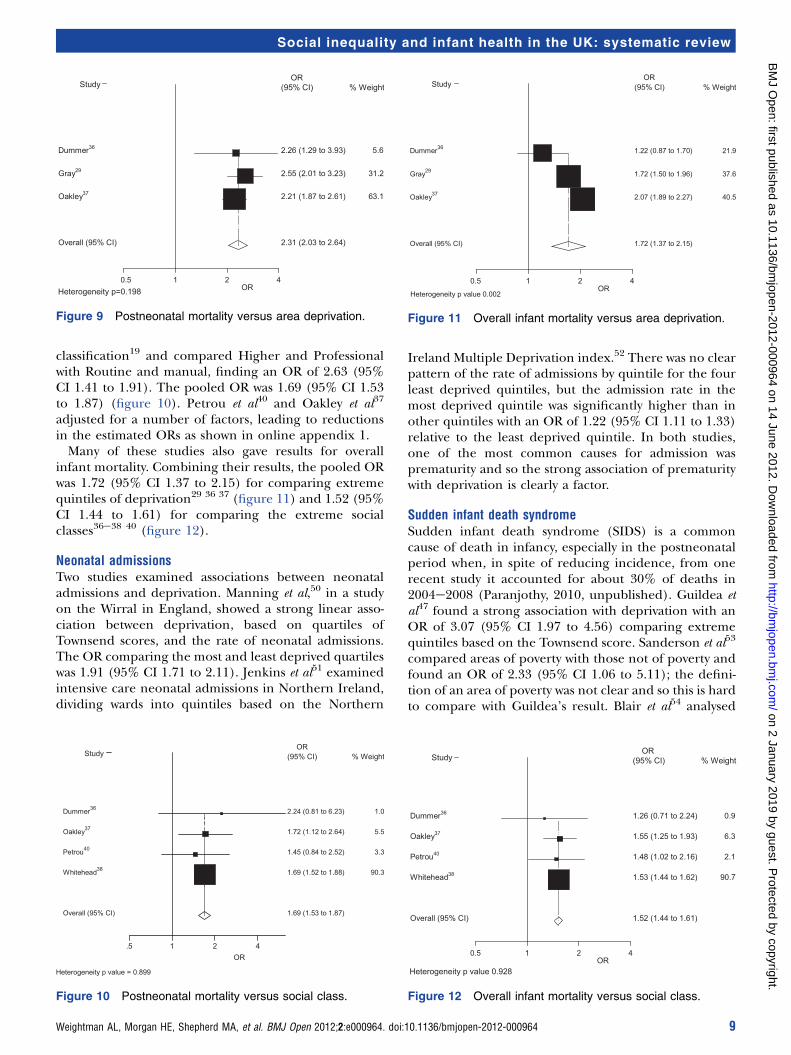
classification19 and compared Higher and Professionalwith Routine and manual, finding an OR of 2.63 (95%CI 1.41 to 1.91). The pooled OR was 1.69 (95% CI 1.53to 1.87) (figure 10). Petrou et al40 and Oakley et al37
adjusted for a number of factors, leading to reductionsin the estimated ORs as shown in online appendix 1.Many of these studies also gave results for overall
infant mortality. Combining their results, the pooled ORwas 1.72 (95% CI 1.37 to 2.15) for comparing extremequintiles of deprivation29 36 37 (figure 11) and 1.52 (95%CI 1.44 to 1.61) for comparing the extreme socialclasses36e38 40 (figure 12).
Neonatal admissionsTwo studies examined associations between neonataladmissions and deprivation. Manning et al,50 in a studyon the Wirral in England, showed a strong linear asso-ciation between deprivation, based on quartiles ofTownsend scores, and the rate of neonatal admissions.The OR comparing the most and least deprived quartileswas 1.91 (95% CI 1.71 to 2.11). Jenkins et al51 examinedintensive care neonatal admissions in Northern Ireland,dividing wards into quintiles based on the Northern
Ireland Multiple Deprivation index.52 There was no clearpattern of the rate of admissions by quintile for the fourleast deprived quintiles, but the admission rate in themost deprived quintile was significantly higher than inother quintiles with an OR of 1.22 (95% CI 1.11 to 1.33)relative to the least deprived quintile. In both studies,one of the most common causes for admission wasprematurity and so the strong association of prematuritywith deprivation is clearly a factor.
Sudden infant death syndromeSudden infant death syndrome (SIDS) is a commoncause of death in infancy, especially in the postneonatalperiod when, in spite of reducing incidence, from onerecent study it accounted for about 30% of deaths in2004e2008 (Paranjothy, 2010, unpublished). Guildea etal47 found a strong association with deprivation with anOR of 3.07 (95% CI 1.97 to 4.56) comparing extremequintiles based on the Townsend score. Sanderson et al53
compared areas of poverty with those not of poverty andfound an OR of 2.33 (95% CI 1.06 to 5.11); the defini-tion of an area of poverty was not clear and so this is hardto compare with Guildea’s result. Blair et al54 analysed
Heterogeneity p=0.198 OR0.5 1 2 4
Study % WeightOR
(95% CI)
2.26 (1.29 to 3.93)Dummer36 5.6
2.55 (2.01 to 3.23)Gray29 31.2
2.21 (1.87 to 2.61)Oakley37 63.1
2.31 (2.03 to 2.64)Overall (95% CI)
Figure 9 Postneonatal mortality versus area deprivation.
Heterogeneity p value = 0.899
OR.5 1 2 4
Study % WeightOR
(95% CI)
2.24 (0.81 to 6.23) Dummer36 1.0
1.72 (1.12 to 2.64) Oakley37 5.5
1.45 (0.84 to 2.52) Petrou40 3.3
1.69 (1.52 to 1.88) Whitehead38 90.3
1.69 (1.53 to 1.87) Overall (95% CI)
Figure 10 Postneonatal mortality versus social class.
Heterogeneity p value 0.002OR
0.5 1 2 4
Study % WeightOR
(95% CI)
1.22 (0.87 to 1.70) Dummer36 21.9
1.72 (1.50 to 1.96) Gray29 37.6
2.07 (1.89 to 2.27) Oakley37 40.5
1.72 (1.37 to 2.15) Overall (95% CI)
Figure 11 Overall infant mortality versus area deprivation.
Heterogeneity p value 0.928OR
0.5 1 2 4
Study % WeightOR
(95% CI)
1.26 (0.71 to 2.24) Dummer36 0.9
1.55 (1.25 to 1.93) Oakley37 6.3
1.48 (1.02 to 2.16) Petrou40 2.1
1.53 (1.44 to 1.62) Whitehead38 90.7
1.52 (1.44 to 1.61) Overall (95% CI)
Figure 12 Overall infant mortality versus social class.
Weightman AL, Morgan HE, Shepherd MA, et al. BMJ Open 2012;2:e000964. doi:10.1136/bmjopen-2012-000964 9
Social inequality and infant health in the UK: systematic review
on 2 January 2019 by guest. Protected by copyright.
http://bmjopen.bm
j.com/
BM
J Open: first published as 10.1136/bm
jopen-2012-000964 on 14 June 2012. Dow
nloaded from
a population-based caseecontrol study and found an ORof 18.49 (95% CI 3.62 to 94.48) for overcrowding, oneaspect of deprivation. The definition used here was quiteextreme, based on at least two people per room ina house, and a less extreme one may give a smaller OR.Brooke et al55 also used a caseecontrol study. Depriva-tion was assessed using CarstairseMorris scores,17 andthe most deprived group had a significantly higher riskof SIDS than the remainder, even after adjustment forother factors, though the definition of the group was notclear. For social class, there was a significantly higher riskin classes IV and V than I and II in a univariate analysis;the OR remained >1 but was no longer significant ina multivariate analysis. Smith et al39 looked at SIDS in theneonatal period, though the great majority occur later.Comparing the extreme quintiles, the OR was 2.20 (95%CI 1.66 to 2.91). Fleming et al56 used a caseecontrolstudy to examine risk factors. Comparing social classes Vand I, the OR was 13.74 (95% CI 4.80 to 39.34). Usingreceipt of income support as a measure of individualdeprivation, the OR was 4.80 (95% CI 3.68 to 6.25).Finally, Blair et al57 carried out a caseecontrol studywhich explored individual deprivation measures. TheOR for SIDS in infants from social classes IV, V or neveremployed versus social classes IeIII was 3.64 (95% CI1.84 to 7.21). This became non-significant in a multivar-iate analysis. There is clearly great heterogeneity here,perhaps arising from different measures of deprivation,and no meta-analysis has been performed.Overall, there appears to be some evidence for an
association in keeping with the findings of an earlierworldwide systematic review, which found a link betweendeprivation and SIDS in 51 of 52 caseecontrol andcohort studies.58
Failure to thriveTwo analyses of the same Avon Longitudinal Study ofParents and Children cohort of children werepublished.59 60 Their definition of failure to thrive wasbased on the rate of growth, conditional on birth weightto allow for regression to the mean effects. Theyconsidered birth to 8 weeks and 8 weeks to 9 monthsseparately and also jointly, leading to a large number ofcomparisons. No overall association with social class wasfound.Wright et al61 also used standardised rates of growth
conditional on birth weight, through their thrive index,on a small birth cohort of 923 children in Gateshead,analysed by Townsend quintile. They regressed the thriveindex on quintile of deprivation and reported a signifi-cant result, but the relationship appeared to beU-shaped and so interpretation is complex. An earlierstudy by the same group42 on a different population didfind a statistically significant result. The OR for failure tothrive at 12 months for most deprived versus interme-diate area deprivation levels was 2.15 (95% CI 1.46 to3.14). However, there was a wide variation in results atearlier ages, and those in more affluent areas had lowerweight gain than in intermediate areas.
WheezeA single study62 suggested a potential link between bothrented housing and lower maternal education (up toand beyond GCSE stage) and wheeze in infants with ORsof 1.45 (95% CI 1.28 to 1.66) and 1.12 (95% CI 1.00 to1.27), respectively.
DiarrhoeaA single study62 found a significant association betweendiarrhoea incidence and lower maternal education (OR1.32, 95% CI 1.19 to 1.45).
DISCUSSIONThis review quantifies the evidence of inequalities in thehealth of infants in the UK. The socioeconomiccircumstances in which an infant is conceived and bornhave a major effect on their early life chances and mayhave life course impacts.
Principal findingsThe analysis demonstrates that a large number of healthoutcomes for UK infants are closely linked to measuresof social disadvantage. There is a strong indication thatthe effect of social disadvantage can be measured viaa range of social determinants (individual and areabased) and health outcomes (eg, low birth weight, infantmortality) and found to be similar. These results are notsurprising, given that prematurity, low birth weight andinfant morbidity and mortality are extremely closelylinked.39 63 64 As many as two-thirds of neonatal deaths inEngland and Wales in 2006 were accounted for byprematurity.65 Furthermore, some studies show that themagnitude of effect of social disadvantage on low birthweight is durable and has not markedly changed sincethe early 1980s.28 31 The only infant health outcomewhich may not follow this pattern is failure to thrive,where there was no clear link based on evidence fromthe three cohorts identified.42 60 61
For most outcomes, the association with area depriva-tion was quite similar to that with social class. Social classis an individual characteristic and might be expected tohave a stronger association, but it is different from thefactors that are combined to give an area deprivationscore. Area scores are often criticised as they areecological measures, but the results here are quite reas-suring about its use in large studies. It might be expectedthat when a small area was used as the basis of a depri-vation score, the resulting measure would better reflectthe deprivation of individuals living there than if a largerarea was used. However, there was no obvious variationin its effect with the size of the areas, though these weremostly quite small. Since few studies reported an analysisin which both individual and area measures were incor-porated into a single analysis, it is difficult to add to thedebate about the relative importance of area and indi-vidual characteristics on health outcomes.66
Many of the meta-analyses showed heterogeneity sothat results varied more than might be expected by
10 Weightman AL, Morgan HE, Shepherd MA, et al. BMJ Open 2012;2:e000964. doi:10.1136/bmjopen-2012-000964
Social inequality and infant health in the UK: systematic review
on 2 January 2019 by guest. Protected by copyright.
http://bmjopen.bm
j.com/
BM
J Open: first published as 10.1136/bm
jopen-2012-000964 on 14 June 2012. Dow
nloaded from
chance. Random effects models allow for this to someextent but identifying, and if possible modelling, thecauses of heterogeneity is better practice. In most cases,there was insufficient detail available to do this. In thecase of preterm births, the different definitions of theoutcome could lead to heterogeneity. In other cases,there was variation in the comparisons of deprivationlevels, as noted in low birth weight and social class. Theeffects of deprivation could also vary between areas inwhich studies were carried out and that might beanother cause of heterogeneity.Based on the results of this review, it can be strongly
argued that no more epidemiological research needs tobe carried out in the UK to address this general effect ofarea and individual measures of social deprivation onbirth and infant mortality outcomes. Further researchshould seek to explore less researched areas such as anyspecific area effects and, most importantly, to explorethe effect of interventions on those factors that are moreproximal to maternal and infant health. This may helpto throw light on the most appropriate times to providesupport and the form(s) that such support should take.Such studies could usefully build on recent research
examining behavioural change interventions regardingthe known intermediate determinants of infant health,for example, maternal nutrition and overweight,67e69
and smoking.29 67 The impact of teenage pregnancy,which is high in the UK relative to other countries, is alsostrongly associated with social disadvantage.70 A recentreview exploring rates of stillbirth found that maternaloverweight and smoking appear to be linked to around8000 and 2800 stillbirths annually, respectively, in thefive high-income countries of Australia, Canada, theUSA, the UK and the Netherlands.67
Another potential determinant is maternal stress.There is now clear evidence of the association ofmaternally reported stress,71e73 domestic violence74 andunintended pregnancies73 with preterm birth or lowbirth weight. Although the evidence is yet to be defini-tive, there are a number of well-established hypotheticalbut evidence-based biological pathways for stressorsleading to preterm birth, essentially related tohormonal, immune and vascular disfunction.75
Antenatal interventions carried out to date withinhigh-income countries for socially disadvantaged womenare few in number and of varying quality. In a Cochranereview, of support during pregnancy for women at risk oflow birthweight babies, Hodnett et al76 suggested that thewomen involved in the trials exhibit such a degree ofdeprivation that the support programmes evaluated arejust not powerful enough to overcome the disadvantageexperienced.Nevertheless, there are promising approaches. Further
exploration of WHO Baby Friendly Hospital Initiative(BFI) in properly evaluated and controlled settingsappears to be warranted.77 In a recent systematic review of36 studies, the authors concluded that, while there isinsufficient evidence to recommend any particular
programme at the moment, some targeted antenatal careprogrammes are promising and warrant rigorous evalua-tion.78 Harden et al79 concluded that there is promise forappropriately designed early childhood interventions andyouth development programmes to reduce unintendedteenage pregnancy, especially if such interventions takeinto account the known views and emotions correlatedwith teenage pregnancy, such as dislike of school, lowexpectations of life and poor material circumstances.Given the pervasive impact of socioeconomic conditions
on almost all aspects of child health and development,unless justified to the contrary, all studies of populationhealth, including routinely collected population data,should include robust measures of socioeconomic statusand maternal and infant stress levels. Interventionoutcomes should also be analysed for differential effects aswell as taking into account other influences, such asa tendency to low birth weight across generations, whichmay be independent of economic conditions.80
Comparison with other studiesThe findings of the review in terms of social disadvan-tage and low birth weight are remarkably similar to thefindings of studies within the Republic of Ireland81 andto a recent global review of reviews carried out by theCanadian Institute of Health Economics82 which alsoconcluded that the causes of low birth weight aremultifactorial and closely inter-related. In addition,these results are very much in keeping with a recentreview of worldwide studies published to 200783 whichconcluded that socioeconomic differences in low birthweight and preterm birth remain pervasive at bothindividual and neighbourhood levels with 93/106studies reporting a significant association.
Conclusions and implicationsIt is anticipated that the results of this review will be ofinterest and value to policy makers and all involveddirectly with the care of infants and young children, aswell as funders of research in this area, with two keyimplications emerging. First, given the clear associationbetween child health outcomes and social disadvantageat individual and area level, governments must continueto focus on tackling social determinants, which in turnwill require a cross cutting approach that includes thoseworking in health, education, child poverty and otherrelated policy portfolios.Second, the absence of research on interventions
through which the effects of disadvantage might bemediated is a serious shortcoming of appropriatelydesigned interventional research.82 Further research isurgently required to evaluate approaches to intervention,including individual behavioural studies and studies ofmore upstream approaches that seek to alter the materialand environmental conditions before and immediatelyafter birth. It is imperative that policy is designed androlled-out in a manner which allows the best possiblechance of a robust assessment of outcomes and costs.84 85
Weightman AL, Morgan HE, Shepherd MA, et al. BMJ Open 2012;2:e000964. doi:10.1136/bmjopen-2012-000964 11
Social inequality and infant health in the UK: systematic review
on 2 January 2019 by guest. Protected by copyright.
http://bmjopen.bm
j.com/
BM
J Open: first published as 10.1136/bm
jopen-2012-000964 on 14 June 2012. Dow
nloaded from
Acknowledgements The authors acknowledge, with thanks, contributions bySamia Addis (Cardiff Institute of Society and Health, Cardiff University) andFiona Morgan (Support Unit for Research Evidence, Cardiff University) toearly drafts of the review. We also acknowledge valuable contributions fromresearchers active in the field who reviewed the initial list of included studiesand suggested other studies that should be screened: Sohinee Bhattacharya,Manning Donal, Ron Gray, Lucy Smith and Charlotte Wright. Lucy Smithread through and commented on the draft of the paper.
Contributors HK, HEM and ALW carried out the literature searching andselected relevant papers. FDD, HEM, MAS and ALW completed criticalappraisal, data extraction and summary of the included studies. FDD carriedout statistical analyses including meta-analyses of studies where feasible. Theauthor from the Welsh Government (CR) contributed to the conception of thestudy, drafted and revised sections on the policy context. He had no role inthe searching, analysis or interpretation of data. Each author’s contribution tothe paper meets the three ICMJE guidelines for authorship. All wereresponsible for drafting sections of the article, revising it critically forimportant intellectual content and approving the final version for publication.
Funding Funding from the Welsh Government was received in partial supportof preparation and publication costs. No grant number is available. All authorscompleted the unified competing interest form. FDD does consultancy forJacob, Medinger and Finnegan and MAS does consultancy for the WelshGovernment. There are no other relationships or activities that could appear tohave influenced the submitted work. The researchers operated independentlyfrom the funders and views expressed in the paper are those of the authors,based on the evidence reviewed, and are not necessarily those of the Welshgovernment.
Competing interests None.
Provenance and peer review Not commissioned; externally peer reviewed.
Data sharing statement All original data extraction and critical appraisal formsare available from the corresponding author. Dryad doi is10.5061/dryad.35db6.
REFERENCES1. Marmot M, Wilkinson RG. The Social Determinants of Health. Oxford:
Oxford University Press, 1999.2. Phelan JC, Link BG. Controlling disease and creating disparities:
a fundamental cause perspective. J Gerontol B Psychol Sci Soc Sci2005;60:S27e33.
3. World Health Organisation. Closing the Gap in a Generation. HealthEquity through Action on the Social Determinants of Health. Geneva:WHO, 2008. http://whqlibdoc.who.int/publications/2008/9789241563703_eng.pdf (accessed 16 Jan 2012).
4. McLeroy KR, Bibeau D, Steckler A, et al. An ecological perspective onhealth promotion programs. Health Educ Q 1988;15:351e77.
5. Dahlgren G, Whitehead M. Policies and Strategies to Promote SocialEquality in Health. Stockholm: Institute of Future Studies, 1991.
6. Department of Health. Fair Society, Healthy Lives. The Marmotreview. Strategic Review of Health Inequalities in EnglandPost-2010. London: Department of Health, 2010. http://www.instituteofhealthequity.org/projects/fair-society-healthy-lives-the-marmot-review (accessed 16 Jan 2012).
7. Lansley A. Healthy Lives, Healthy People: Update And Way Forward.Cm 8134. London: The Stationery Office Limited, 2011.
8. Scottish Government. Equally Well Review 2010. Report by theMinisterial Task Force on Implementing Equally Well, the Early YearsFramework and Achieving Our Potential. Edinburgh: ScottishGovernment, 2010. http://www.scotland.gov.uk/Resource/Doc/315880/0100454.pdf (accessed 16 Jan 2012).
9. Welsh Assembly Government. Cardiff: Welsh Assembly government,2011. Fairer Health Outcomes For All Reducing Inequities HealthStrategic Action Plan Moving Agenda Forward Cardiff WelshAssembly Government. 2011. http://wales.gov.uk/docs/phhs/publications/110329working2en.pdf (accessed 16 Jan 2012).
10. Keating DP, Hertzman C, eds. Development Health and the Wealth ofNations. Social, Biological and Educational Dynamics. New York:Guilford Press, 1999.
11. Li J, Mattes E, Stanley F, et al. Social determinants of child health andwellbeing (editorial). Health Sociol Rev 2009;18:3e11.
12. Department of Health. Healthy Lives, Brighter Futures. The Strategyfor Children and Young People’s Health. London: Department ofHealth, 2009. http://www.dh.gov.uk/prod_consum_dh/groups/
dh_digitalassets/documents/digitalasset/dh_094397.pdf (accessed16 Jan 2012).
13. Rajaratnam JK, Marcus JR, Flaxman AD, et al. Neonatal,postneonatal, childhood, and under-5 mortality for 187 countries,1970e2010: a systematic analysis of progress towards millenniumdevelopment goal 4. Lancet 2010;375:1988e2008.
14. Bradshaw J, Richardson D. An index of child well-being in Europe.Child Indicators Res 2009;2:319e51.
15. Cousens S, Blencowe H, Stanton C, et al. National, regional, andworldwide estimates of stillbirth rates in 2009 with trends since 1995:a systematic analysis. Lancet 2011;377:1319e30.
16. Weightman AL, Addis SG, Morgan HE, et al. Social Determinants ForChild Health: A Systematic Review. Cardiff: Welsh AssemblyGovernment, 2008. http://new.wales.gov.uk/dphhp/publication/research/health-gain-targets/child/childhealth-exec-e.pdf?lang¼en(accessed 16 Jan 2012).
17. Carstairs V, Morris R. Deprivation and Health in Scotland. Aberdeen:Aberdeen University Press, 1991.
18. Jarman B. Underprivileged areas: validation and distribution ofscores. BMJ 1984;289:1587e92.
19. Office for National Statistics. The National Statistics Socio-economicClassification (NS-SEC rebased on the SOC2010). http://www.ons.gov.uk/ons/guide-method/classifications/current-standard-classifications/soc2010/soc2010-volume-3-ns-secerebased-on-soc2010euser-manual/index.html (accessed 16 Jan 2012).
20. Townsend P, Phillimore P, Beattie A. Health and Deprivation.Inequality and the North. Beckenham, Kent: Croom Helm, 1988.
21. Welsh Assembly Government. 2011 Children And Young People’sWellbeing Monitor For Wales. Cardiff: Welsh Assembly Government,2011. http://wales.gov.uk/docs/caecd/research/110328cypmonitoren.pdf (accessed 16 Jan 2012).
22. Wells GA, Shea B, O’Connell D, et al. The Newcastle-Ottawa Scale(NOS) for Assessing the Quality of Nonrandomized Studies in Meta-analyses. Canada: Department of Epidemiology and CommunityMedicine, University of Ottawa. http://www.ohri.ca/programs/clinical_epidemiology/oxford.htm (accessed 16 Jan 2012).
23. Sanderson S, Tatt ID, Higgins JP. Tools for assessing quality andsusceptibility to bias in observational studies in epidemiology:a systematic review and annotated bibliography. Int J Epidemiol2007;36:666e76.
24. Stang A. Critical evaluation of the Newcastle-Ottawa scale for theassessment of the quality of nonrandomised studies in meta-analysis.Eur J Epidemiol 2010;25:603e5.
25. Bundred P, Manning D, Brewster B, et al. Social trends in singletonbirths and birth weight in Wirral residents, 1990-2001. Arch Dis Child2003;88:F421e4.
26. Dibben C, Sigala M, Macfarlane A. Area deprivation, individual factorsand low birth weight in England: is there evidence of an “area effect”?J Epidemiol Community Health 2006;60:1053e9.
27. Spencer N, Bambang S, Logan S, et al. Socioeconomic status andbirth weight: comparison of an area-based measure with the registrargeneral’s social class. J Epidemiol Community Health1999;53:495e8.
28. Collingwood Bakeo A, Clarke L. Risk factors for low birthweight basedon birth registration and census information, England and Wales,1981-2000. Health Stat Q 2006;30:15e21.
29. Gray R, Bonellie SR, Chalmers J, et al. Contribution of smokingduring pregnancy to inequalities in stillbirth and infant death inScotland 1994-2003: retrospective population based study usinghospital maternity records. BMJ 2009;339:b3754.
30. Pattenden S, Dolk H, Vrijheid M. Inequalities in low birth weight:parental social class, area deprivation, and “lone mother” status. JEpidemiol Community Health 1999;53:355e8.
31. Fairley L, Leyland AH. Social class inequalities in perinataloutcomes: Scotland 1980-2000. J Epidemiol Community Health2006;60:31e6.
32. Maher J, Macfarlane A. Trends in live births and birthweight by socialclass, marital status and mother’s age, 1976e2000. Health Stat Q2004;23:34e42.
33. Smith LK, Draper ES, Manktelow BN, et al. Socioeconomicinequalities in survival and provision of neonatal care: populationbased study of very preterm infants. BMJ 2009;339:b4702.
34. Gray R, Bonellie SR, Chalmers J, et al. Social inequalities in pretermbirth in Scotland 1980-2003: findings from an area-based measure ofdeprivation. Br J Obstet Gynaecol 2008;115:82e90.
35. Yuan W, Duffner AM, Chen L, et al. Analysis of preterm deliveriesbelow 35 weeks’ gestation in a tertiary referral hospital in the UK. Acase-control survey. BMC Res Notes 2010;3:119.
36. Dummer TJB, Parker L. Changing socioeconomic inequality in infantmortality in Cumbria. Arch Dis Child 2005;90:157e62.
37. Oakley L, Maconochie N, Doyle P, et al. Multivariate analysis ofinfant death in England and Wales in 2005-06, with focus on
12 Weightman AL, Morgan HE, Shepherd MA, et al. BMJ Open 2012;2:e000964. doi:10.1136/bmjopen-2012-000964
Social inequality and infant health in the UK: systematic review
on 2 January 2019 by guest. Protected by copyright.
http://bmjopen.bm
j.com/
BM
J Open: first published as 10.1136/bm
jopen-2012-000964 on 14 June 2012. Dow
nloaded from

socio-economic status and deprivation. Health Stat Q2009;42:22e39.
38. Whitehead M, Drever F. Narrowing social inequalities in health?Analysis of trends in mortality among babies of lone mothers. BMJ1999;318:908e12.
39. Smith LK, Manktelow BN, Draper ES, et al. Nature of socioeconomicinequalities in neonatal mortality: population based study. BMJ2010;341:c6654.
40. Petrou S, Kupek E, Hockley C, et al. Social class inequalities inchildhood mortality and morbidity in an English population. PaediatrPerinat Epidemiol 2006;20;14e23.
41. Platt MJ, Cans C, Johnson A, et al. Trends in cerebral palsy amonginfants of very low birthweight (<1500g) or born prematurely (<32weeks) in 16 European centres: a database study. Lancet2007;369:43e50.
42. Wright CM, Waterston A, Aynsley-Green A. Effect of deprivation onweight gain in infancy. Acta Paediatr 1994;83:357e9.
43. Gardosi J, Francis A. Social deprivation, smoking and maternalcharacteristics as risk factors for small-for-gestational agebirthweight. Arch Dis Child Fetal Neonatal Ed 2010;95(SupplX):90e111.
44. Smith LK, Draper ES, Manktelow BN, et al. Socioeconomicinequalities in very preterm birth rates. Arch Dis Child Fetal NeonatalEd 2007;92:F11e14.
45. Sundrum R, Logan S, Wallace A, et al. Cerebral palsy andsocioeconomic status: a retrospective cohort study. Arch Dis Child2005;90:15e18.
46. Dolk H, Pattenden S, Bonellie S, et al. Socio-economic inequalities incerebral palsy prevalence in the United Kingdom: a register-basedstudy. Paediatr Perinat Epidemiol 2010;24:149e55.
47. Guildea ZES, Fone DL, Dunstan FD, et al. Social deprivation and thecauses of stillbirth and infant mortality. Arch Dis Child2001;84:307e10.
48. Smeeton NC, Rona RJ, Dobson P, et al. Assessing the determinantsof stillbirths and early neonatal deaths using routinely collected datain an inner city area. BMC Med 2004;2:27.
49. Bambang S, Spencer NJ, Logan S, et al. Cause-specific perinataldeath rates, birth weight and deprivation in the West Midlands,1991-93. Child Care Health Dev 2000;26:73e82.
50. Manning D, Brewster B, Bundred P. Social deprivation and admissionfor neonatal care. Arch Dis Child Fetal Neonatal Ed 2005;90:F337e8.
51. Jenkins J, McCall E, Gardner E, et al. Socioeconomic inequalities inneonatal intensive care admission rates. Arch Dis Child FetalNeonatal Ed 2009;94:F423e8.
52. Office for National Statistics. Indices of Deprivation Across the UK.2011. http://www.neighbourhood.statistics.gov.uk/dissemination/Info.do?page¼analysisandguidance/analysisarticles/indices-of-deprivation.htm (accessed 16 Jan 2012).
53. Sanderson CA, Cowden B, Hall DMB, et al. Is postnatal depressiona risk factor for sudden infant death? Br J Gen Pract2002;52:636e40.
54. Blair PS, Fleming PJ, Smith IJ, et al. Babies sleeping with parents:case control study of factors influencing the risk of the sudden infantdeath syndrome. BMJ 1999;319:1457e62.
55. Brooke AG, Gibson A, Tappin D, et al. Case-control study of suddeninfant death syndrome in Scotland. 1992-5. BMJ 1997;314:1516e20.
56. Fleming PJ, Blair PS, Ward PM, et al; CESDI SUDI Research Group.Sudden infant death syndrome and social deprivation: assessingepidemiological factors after post-matching for deprivation. PaediatrPerinat Epidemiol 2003;17:272e80.
57. Blair PS, Sidebotham P, Evason-Coombe C, et al. Hazardouscosleeping environments and risk factors amenable to change: case-control study of SIDS in south west England. BMJ 2009;339:b3666.
58. Spencer N, Logan S. Sudden unexpected death in infancy andsocioeconomic status: a systematic review. J Epidemiol CommunityHealth 2004;58:366e73.
59. Blair PS, Drewett RF, Emmett PM, et al. Family, socioeconomic andprenatal factors associated with failure to thrive in the avonlongitudinal study of parents and children (ALSPAC). Int J Epidemiol2004;33:839e47.
60. Emond A, Drewett R, Blair P, et al. Postnatal factors associated withfailure to thrive in term infants in the avon longitudinal study of parentsand children. Arch Dis Child 2007;92:115e19.
61. Wright CM, Parkinson KN, Drewett RF. The influence of maternalsocioeconomic and emotional factors on infant weight gain andweight faltering (failure to thrive): data from a prospective birth cohort.Arch Dis Child 2006;91:312e17.
62. Baker D, Taylor H, Henderson J. Inequality in infant morbidity: causesand consequences in England in the 1990s. ALSPAC study team.Avon longitudinal study of pregnancy and childhood. J EpidemiolCommunity Health 1998;52:451e8.
63. The Poverty Site. Low Birthweight Babies. 2008. United Kingdom.2010. http://www.poverty.org.uk/20/index.shtml (accessed 16 Jan2012).
64. Stevens-Simon C, Orleans M. Low birthweight prevention programs:the enigma of failure. Birth 1999;26:184e91.
65. Office for National Statistics. Gestation-Specific Infant Mortality BySocial And Biological Factors, 2006. Statistical Bulletin. Newport: Officefor National Statistics, 2009. http://www.ons.gov.uk/ons/rel/child-health/gestation-specific-infant-mortality-in-england-and-wales/2006/stb-gestation-specific-infant-mortalitye2006.html (accessed 16 Jan 2012).
66. Macintyre S, Ellaway A, Cummins S. Place effects on health: how canwe conceptualise, operationalise and measure them? Soc Sci Med2002;55:125e39.
67. Flenady V, Koopmans L, Middleton P, et al. Major risk factors forstillbirth in high-income countries: a systematic review and meta-analysis. Lancet 2011;377:1331e40.
68. Haggarty P, Campbell DM, Duthie S, et al. Diet and deprivation inpregnancy. Br J Nut 2009;102:1487e97.
69. McDonald SD, Han Z, Mulla S. Overweight and obesity in mothersand risk of preterm birth and low birth weight infants: systematicreview and metaanalysis. BMJ 2010;341:c3428. http://www.bmj.com/content/341/bmj.c3428.full (accessed 16 Jan 2012).
70. Department for Education and Skills. Teenage Pregnancy:Accelerating The Strategy to 2010. London: Department forEducation and Skills, 2006. http://media.education.gov.uk/assets/files/pdf/t/teenage%20pregnancy%20%20%20accelerating%20the%20strategy%20to%202010.pdf (accessed 16 Jan 2012).
71. Savitz DA, Pastore LM. Causes of prematurity. In: McCormick MC,Siegel JE, eds. Prenatal Care: Effectiveness and Implementation.Cambridge: Cambridge University Press, 1999.
72. Hobel CJ, Goldstein A, Barrett ES. Psychosocial stress andpregnancy outcomes. Clin Obstet Gynecol 2008;51:333e48.
73. Messer LC, Dole N, Kaufman JS, et al. Pregnancy intendedness,maternal psychosocial factors and preterm birth. Matern Child HealthJ 2005;9:403e12.
74. Shah PS, Shah J. Maternal exposure to domestic violence andpregnancy and birth outcomes: a systematic review and meta-analysis. J Womens Health 2010;19:2017e31.
75. Kramer MR, Hogue CR. What causes racial disparities in verypreterm birth? A biosocial perspective. Epidemiol Rev2009;31:84e98.
76. Hodnett ED, Fredericks S, Weston J. Support during pregnancy forwomen at increased risk of low birthweight babies. CochraneDatabase Syst Rev 2010;(6):CD000198. http://mrw.interscience.wiley.com/cochrane/clsysrev/articles/CD000198/pdf_fs.html(accessed 16 Jan 2012).
77. Spiby H, McCormick F, Wallace L, et al. A systematic review ofeducation and evidence-based practice interventions with healthprofessionals and breast feeding counsellors on duration of breastfeeding. Midwifery 2009;25:50e61.
78. Hollowell J, Oakley L, Kurinczuk JJ, et al. The effectiveness ofantenatal care programmes to reduce infant mortality and pretermbirth in socially disadvantaged and vulnerable women in high-incomecountries: a systematic review. BMC Pregnancy Childbirth2011;11:13.
79. Harden A, Brunton G, Fletcher A, et al. Teenage pregnancy andsocial disadvantage: systematic review integrating controlled trialsand qualitative studies. BMJ 2009;339:b4254.
80. Collins J, Rankin K, David R. Low birth weight across generations: theeffect of economic environment. Matern Child Health J2011;15:438e45.
81. McAvoy H, Sturley J, Burke S, et al. Unequal at BirthdInequalities inthe Occurrence Of Low Birthweight Babies in Ireland. Ireland:Institute of Public Health in Ireland, 2006. http://www.publichealth.ie/files/file/Unequal_at_Birth.pdf (accessed 16 Jan 2012).
82. Ohlsson A, Shah P. Determinants And Prevention Of LowBirth Weight: A Synopsis Of The Evidence. Alberta, Canada:Institute of Health Economics, 2008. http://www.ihe.ca/documents/IHE%20Report%20LowBirthWeight%20final.pdf (accessed 16 Jan2012).
83. Blumenshine P, Egerter S, Barclay CJ, et al. Socioeconomicdisparities in adverse birth outcomes: a systematic review. Am J PrevMed 2010;39:263e72.
84. Macintyre S. Good intentions and received wisdom are not goodenough: the need for controlled trials in public health. J EpidemiolCommunity Health 2011;65:564e7.
85. House of Commons Health Committee. Health Inequalities. ThirdReport of Session 2008-09. Volume 1. Report, Together with FormalMinutes HC 286-I. London: The Stationary Office Limited, 2009.http://www.publications.parliament.uk/pa/cm200809/cmselect/cmhealth/286/286.pdf (accessed 16 Jan 2012).
PAGE fraction trail=13Weightman AL, Morgan HE, Shepherd MA, et al. BMJ Open 2012;2:e000964. doi:10.1136/bmjopen-2012-000964 13
Social inequality and infant health in the UK: systematic review
on 2 January 2019 by guest. Protected by copyright.
http://bmjopen.bm
j.com/
BM
J Open: first published as 10.1136/bm
jopen-2012-000964 on 14 June 2012. Dow
nloaded from