Poverty, Inequality, Environment and Urbanization · Poverty, Inequality, Environment and...
44
Poverty, Inequality, Environment and Urbanization Guanghua Wan Principal Economist ADB 1
-
Upload
trinhkhanh -
Category
Documents
-
view
223 -
download
3
Transcript of Poverty, Inequality, Environment and Urbanization · Poverty, Inequality, Environment and...
Poverty, Inequality, Environment and Urbanization
Guanghua Wan Principal Economist
ADB
1

Asia has seen fast growth (1990-2008) …
8.6
3.6 3.1 2.8
0
2
4
6
8
10
Developing Asia Sub-Saharan Africa
Latin America and Caribbean
OECD
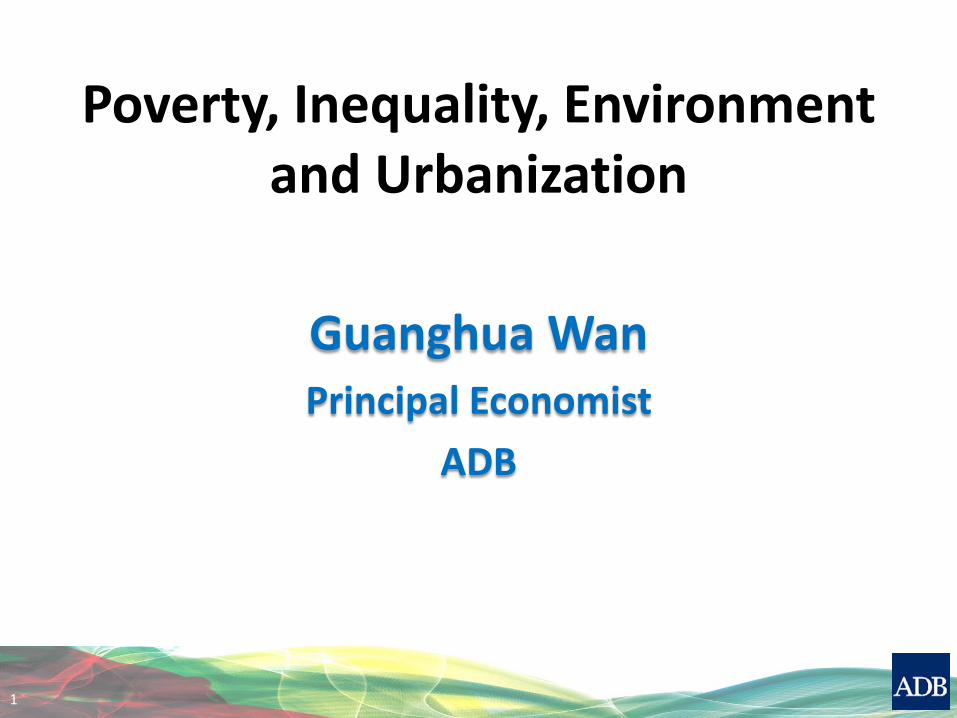
The growth continues despite crises…
10.1
6.7 6.0
9.1
7.2 6.9 7.3
0 1 2 3 4 5 6 7 8 9
10 11
2007 2008 2009 2010 2011 2012f 2013f
GDP growth
5-year moving average
3
f: forecast
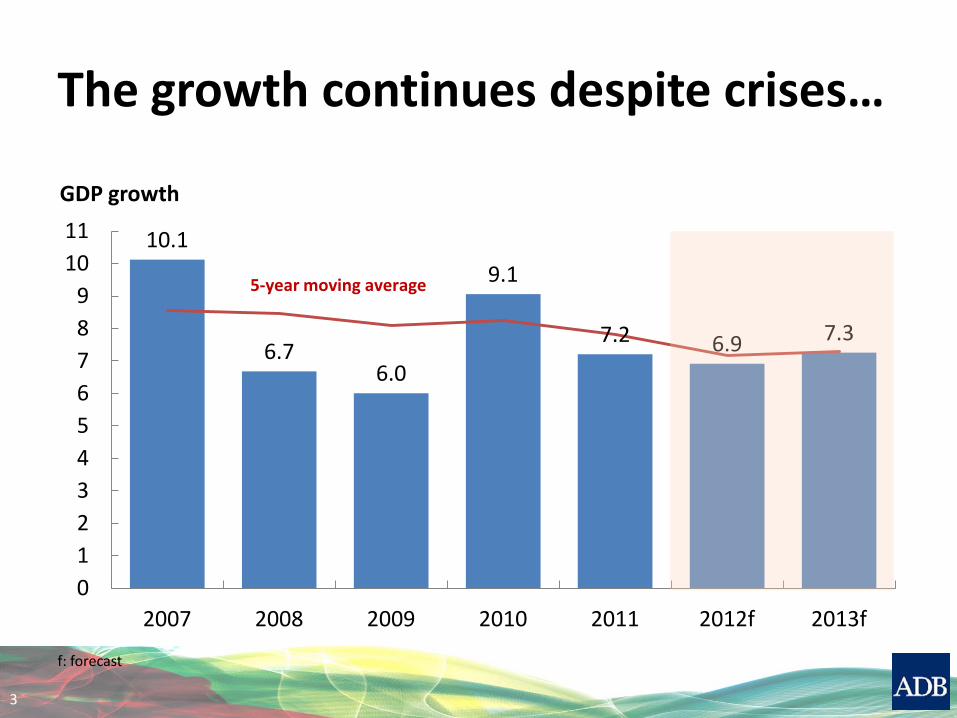
Growth helps reduce poverty…
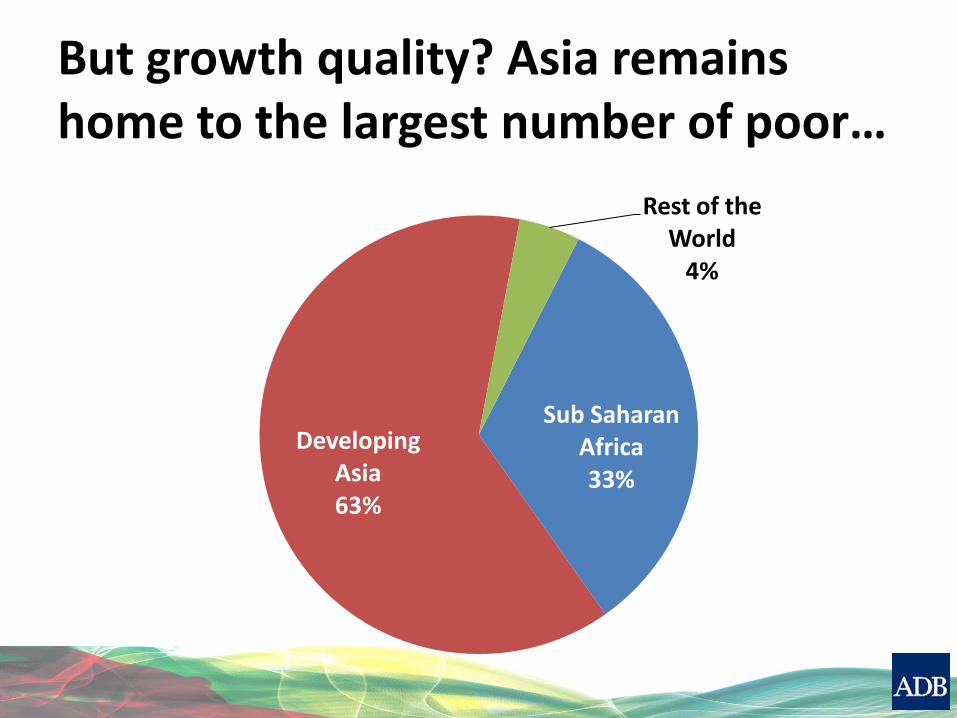
But growth quality? Asia remains home to the largest number of poor…
Sub Saharan Africa 33%
Developing Asia 63%
Rest of the World
4%
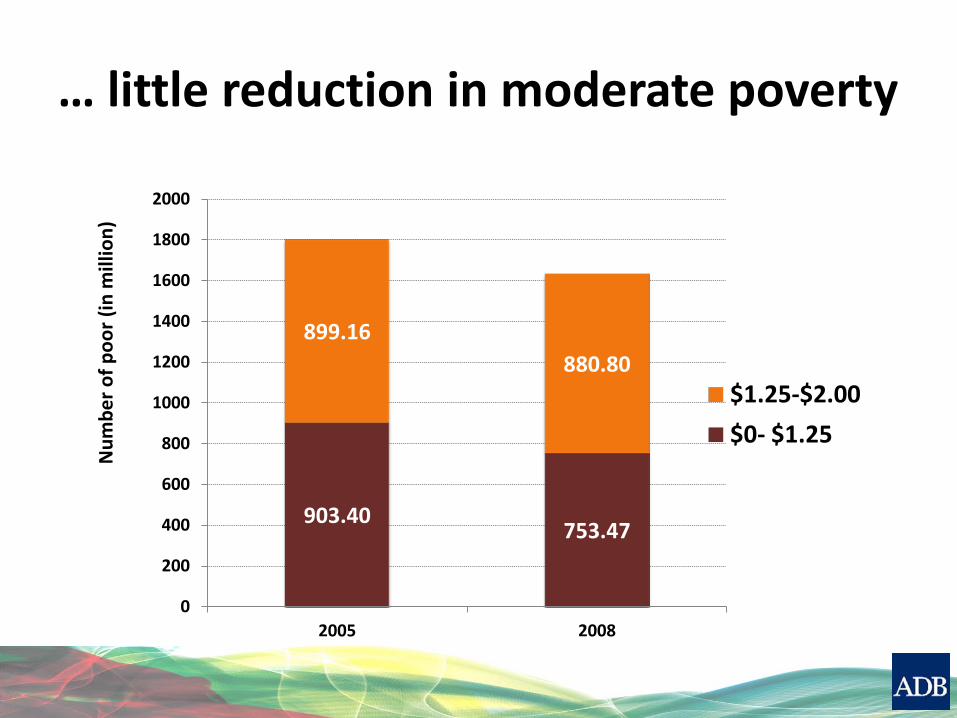
… little reduction in moderate poverty
903.40 753.47
899.16 880.80
0
200
400
600
800
1000
1200
1400
1600
1800
2000
2005 2008
$1.25-$2.00 $0- $1.25
Num
ber o
f poo
r (in
mill
ion)

Poverty reduction mainly from PRC and India ($1.25)
PRC 57%
India 20%
Viet Nam 5%
Bangladesh 4%
Pakistan 3%
Others 11%
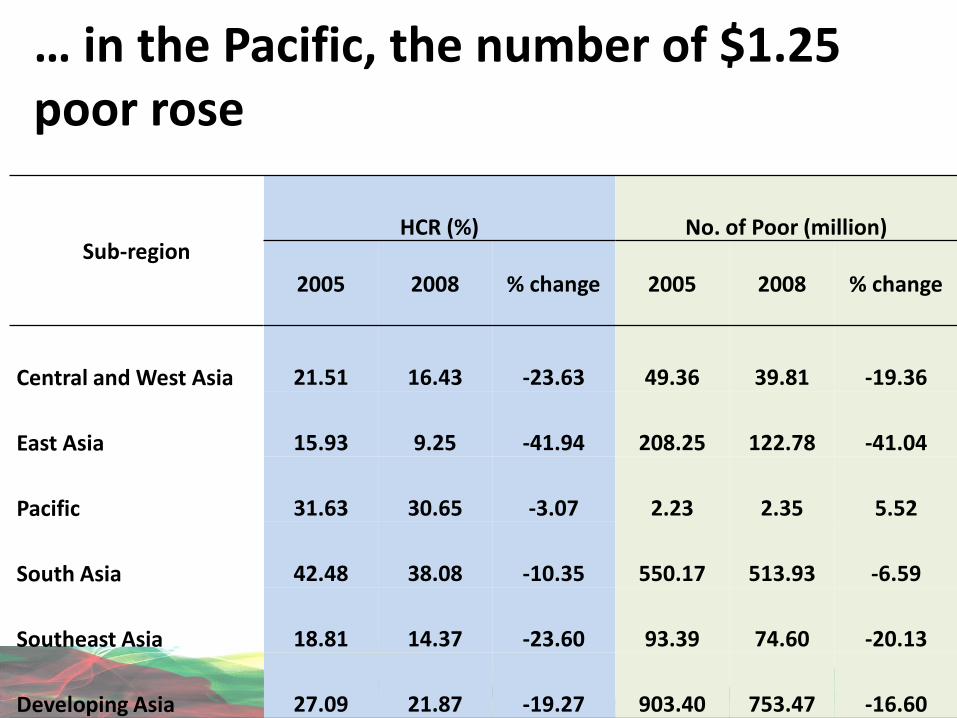
… in the Pacific, the number of $1.25 poor rose
Sub-region HCR (%) No. of Poor (million)
2005 2008 % change 2005 2008 % change
Central and West Asia 21.51 16.43 -23.63 49.36 39.81 -19.36
East Asia 15.93 9.25 -41.94 208.25 122.78 -41.04
Pacific 31.63 30.65 -3.07 2.23 2.35 5.52
South Asia 42.48 38.08 -10.35 550.17 513.93 -6.59
Southeast Asia 18.81 14.37 -23.60 93.39 74.60 -20.13
Developing Asia 27.09 21.87 -19.27 903.40 753.47 -16.60

0
5
10
15
20
25
30
35
40
2002 2005 2008 2009 2010
Average annual change (percentage point) under $1.25
-2.5
-1.7
-1.6 -1.5
Hea
d co
unt r
atio
The growth impacts on poverty decline over time…
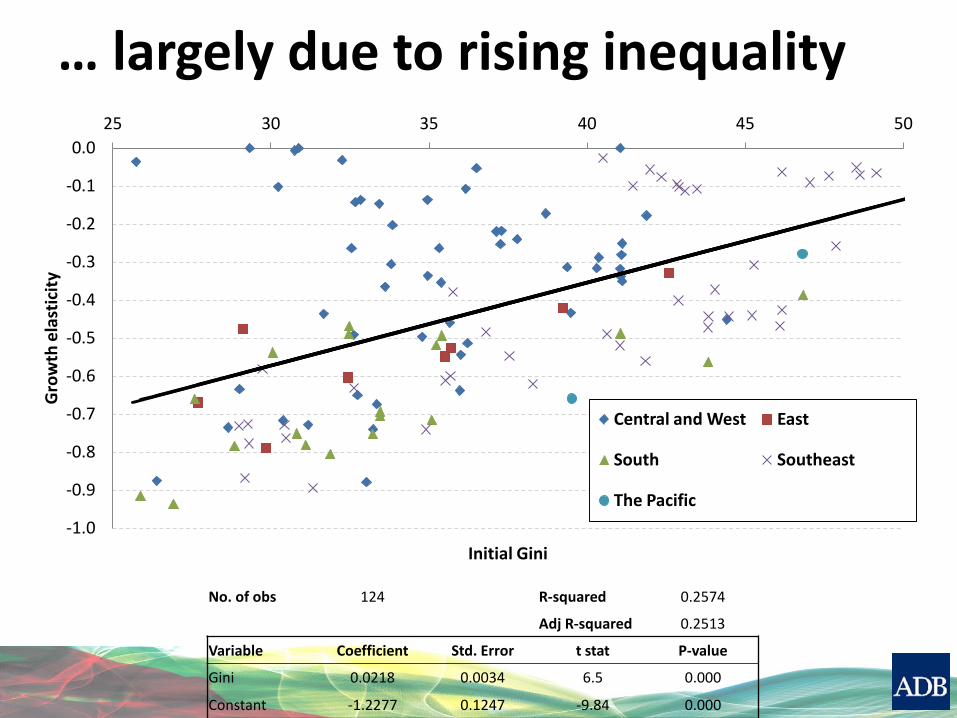
… largely due to rising inequality
-1.0
-0.9
-0.8
-0.7
-0.6
-0.5
-0.4
-0.3
-0.2
-0.1
0.0 25 30 35 40 45 50
Gro
wth
ela
stic
ity
Initial Gini
Central and West East
South Southeast
The Pacific
No. of obs 124 R-squared 0.2574
Adj R-squared 0.2513
Variable Coefficient Std. Error t stat P-value
Gini 0.0218 0.0034 6.5 0.000
Constant -1.2277 0.1247 -9.84 0.000
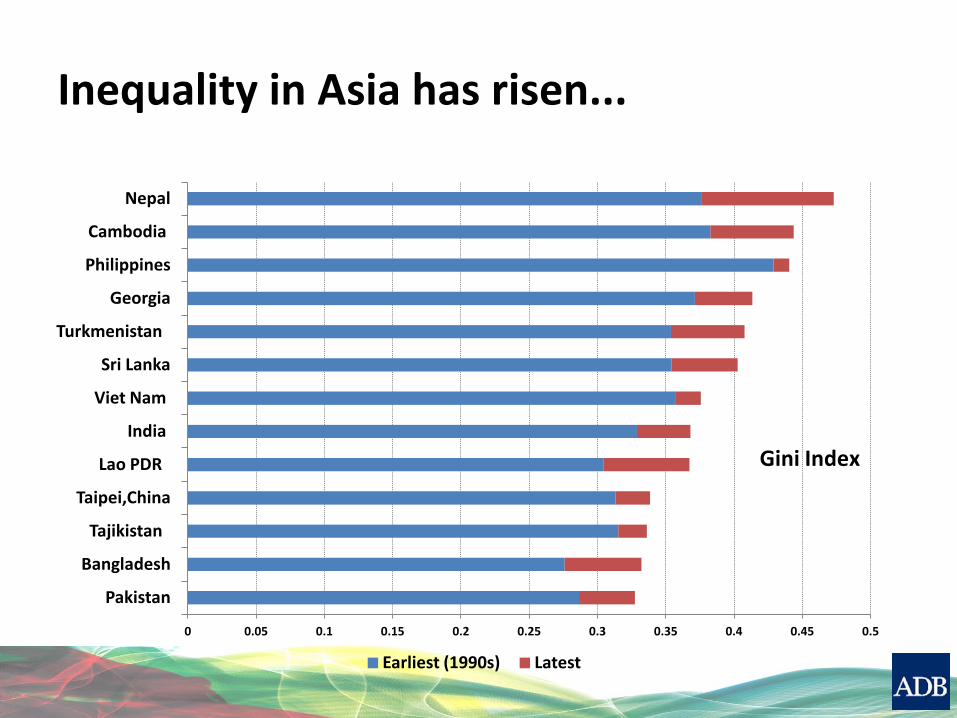
Inequality in Asia has risen...
0 0.05 0.1 0.15 0.2 0.25 0.3 0.35 0.4 0.45 0.5
Pakistan
Bangladesh
Tajikistan
Taipei,China
Lao PDR
India
Viet Nam
Sri Lanka
Turkmenistan
Georgia
Philippines
Cambodia
Nepal
Earliest (1990s) Latest
Gini Index
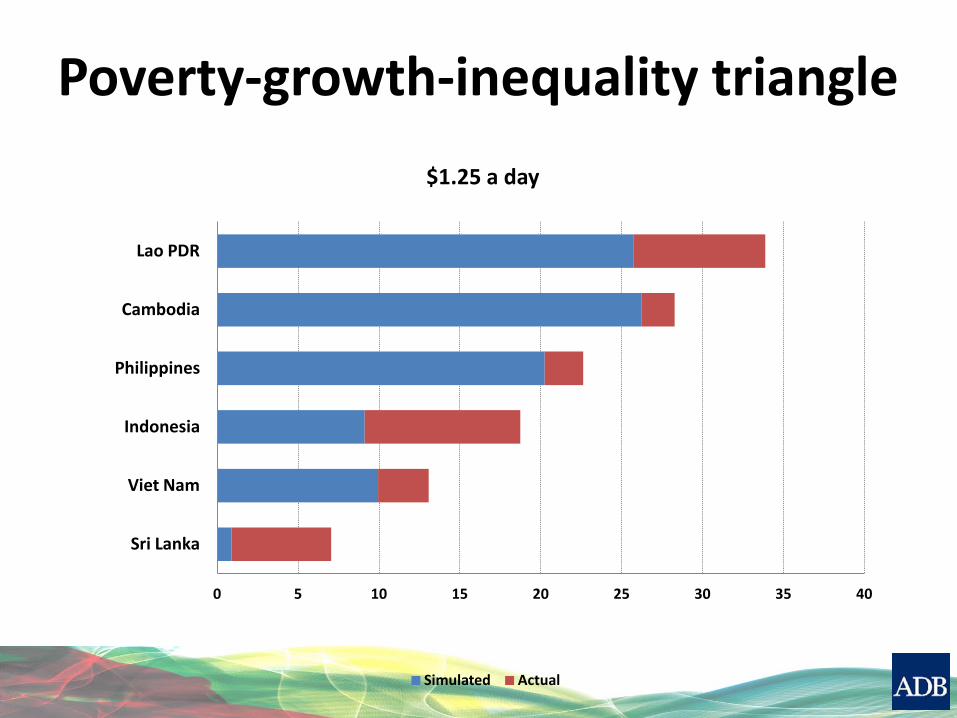
Poverty-growth-inequality triangle
0 5 10 15 20 25 30 35 40
Sri Lanka
Viet Nam
Indonesia
Philippines
Cambodia
Lao PDR
$1.25 a day
Simulated Actual

13
The inequality–growth relationship in PRC (dashed = yearly; solid = cumulative)
-12
-10
-8
-6
-4
-2
0
2
4
6
8
0 3 6 9 12 15 18 21 24 27 30

Spatial (urban-rural) gaps as main contributor to high inequality
14
13
21 22 26
32 35
38
54
0
10
20
30
40
50
60
Sri Lanka (2009)
Philippines (2009)
Pakistan (2008)
Indonesia (2009)
India (2008)
Viet Nam (2008)
Bhutan (2007)
PRC (2007)
Share of spatial inequality to total inequality (%)
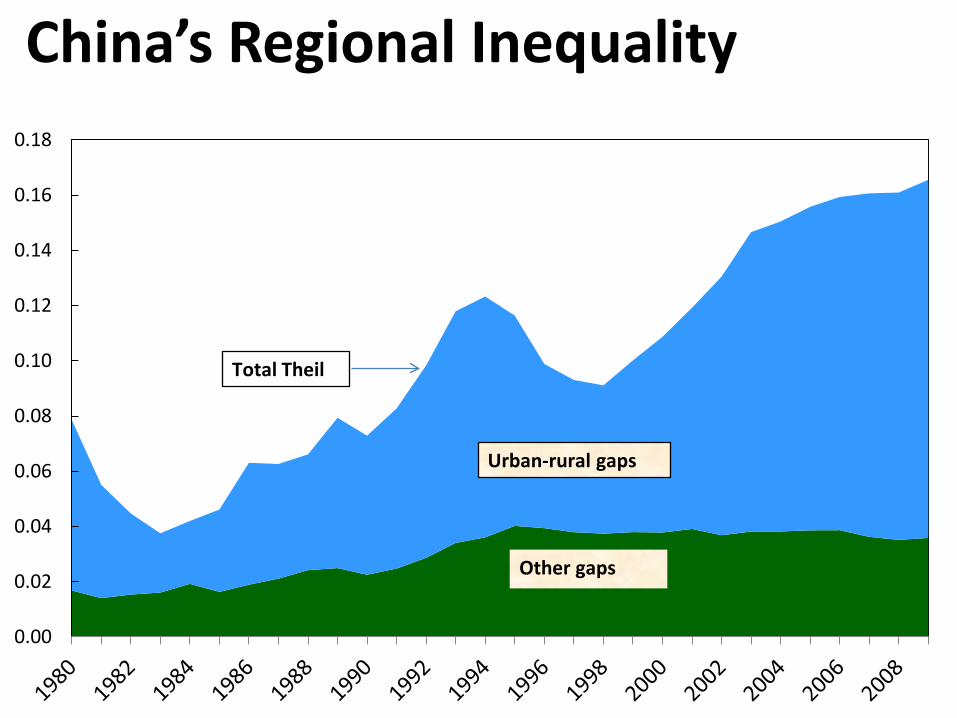
0.00
0.02
0.04
0.06
0.08
0.10
0.12
0.14
0.16
0.18
Total Theil
Urban-rural gaps
Other gaps
China’s Regional Inequality
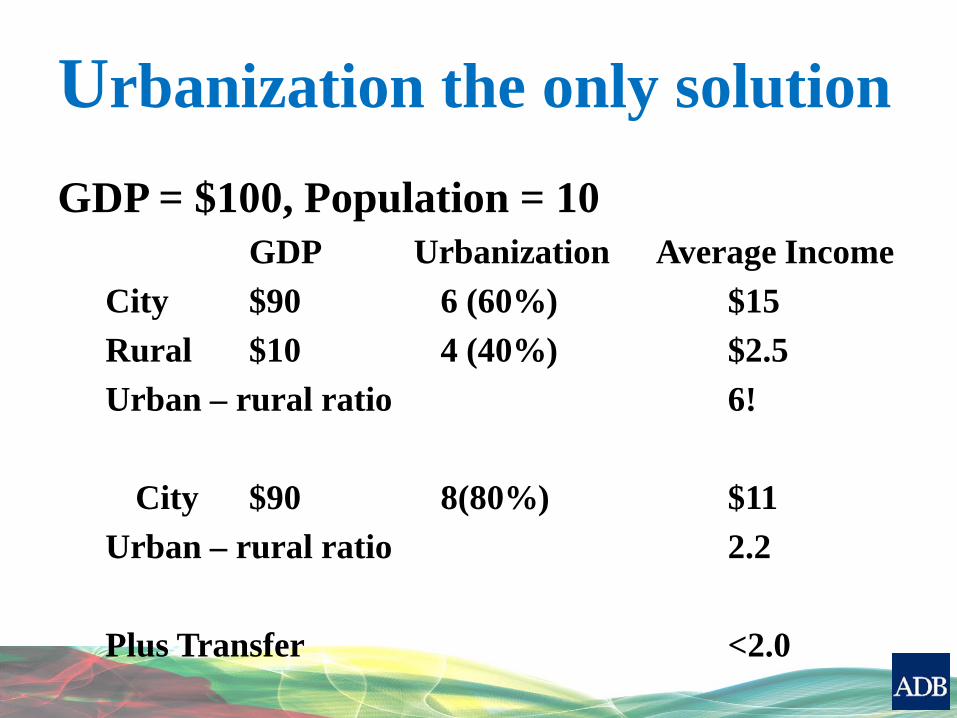
Urbanization the only solution GDP = $100, Population = 10
GDP Urbanization Average Income City $90 6 (60%) $15 Rural $10 4 (40%) $2.5 Urban – rural ratio 6! City $90 8(80%) $11 Urban – rural ratio 2.2 Plus Transfer <2.0

0
200
400
600
800
1000
1200
1980-2010 2010-2040
Incr
ease
in U
rban
Pop
ulat
ion
(mill
ion)
Increase in Urban Population in Asia and the Pacific (millions)
Bangladesh Pakistan Indonesia
India China, People's Rep. of Rest of Asia & Pacific
1.06 billion 1 billion
Asia’s urbanization is unprecedented
Source: ADB estimates using UN(2012).
1750 1775 1800 1825 1850 1875 1900 1925 1950 1975 2000 2025 2050
China, People's Rep. of
Bhutan
Lao PDR
Indonesia
Viet Nam
Asia and the Pacific
Europe
North America
Latin America and Caribbean
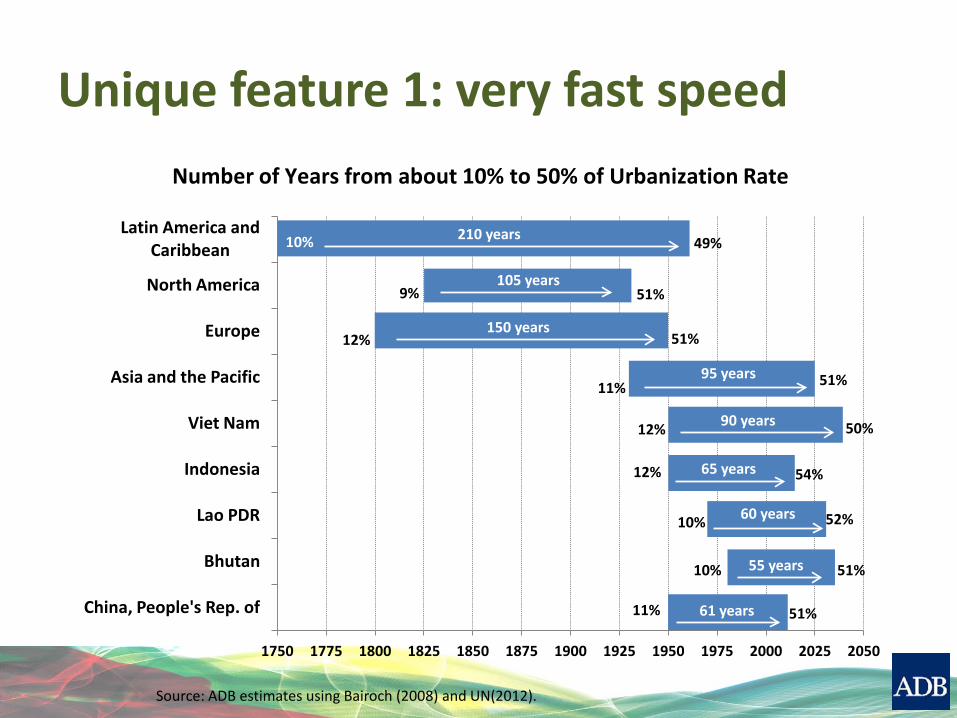
Number of Years from about 10% to 50% of Urbanization Rate
10% 49% 210 years
9% 51% 105 years
12% 51% 150 years
11% 51% 95 years
12% 50% 90 years
12% 54% 65 years
10% 52% 60 years
10% 51% 55 years
11% 51% 61 years
Unique feature 1: very fast speed
Source: ADB estimates using Bairoch (2008) and UN(2012).

Unique feature 2: highest densities in the world…
0
5000
10000
15000
20000
25000
30000
35000
Mum
bai
Kolk
ata
Kara
chi
Lago
s
Shen
zhen
Seou
l/In
cheo
n
Taip
ei,C
hina
Chen
nai
Bogo
ta
Shan
ghai
Lim
a
Beiji
ng
Delh
i
Kins
hasa
Man
ila
Tehr
an
Jaka
rta
Tian
jin
Bang
alor
e
Ho C
hi M
inh
City
Cairo
Bagh
dad
Shen
yang
Hyde
raba
d
São
Paul
o
Dens
ity (p
erso
n/m
2 )
Top 25 World's Cities Ranked by Density, 2007
Asia & the Pacific (17/25) Africa Europe Latin America & Caribbean Middle East & North Africa
Source: www.citymayors.com
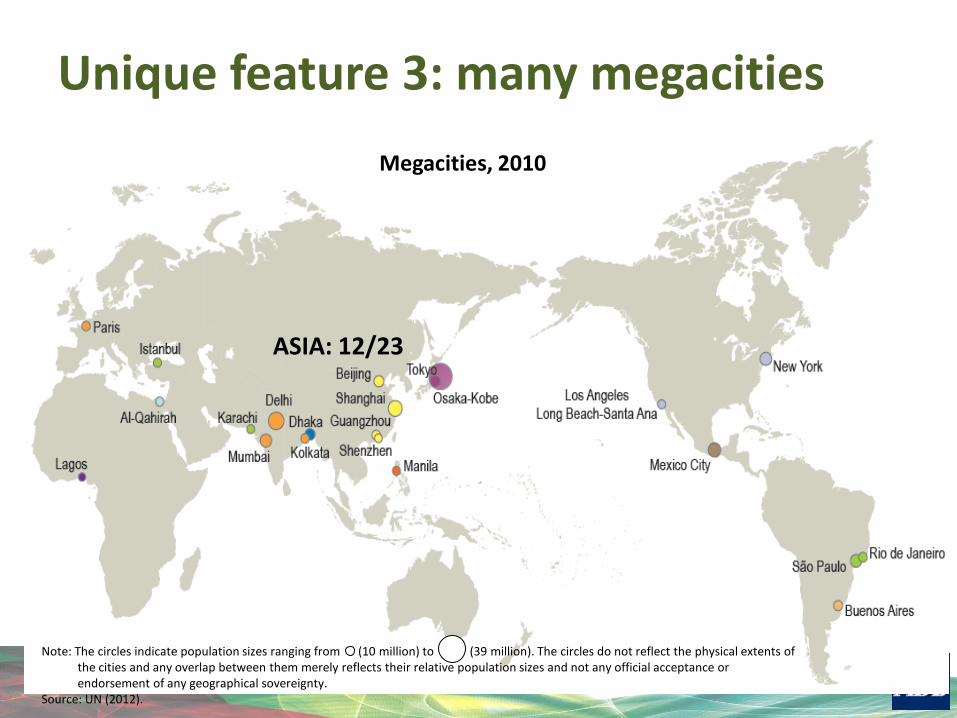
Unique feature 3: many megacities Megacities, 2010
ASIA: 12/23
Note: The circles indicate population sizes ranging from (10 million) to (39 million). The circles do not reflect the physical extents of
the cities and any overlap between them merely reflects their relative population sizes and not any official acceptance or endorsement of any geographical sovereignty.
Source: UN (2012).
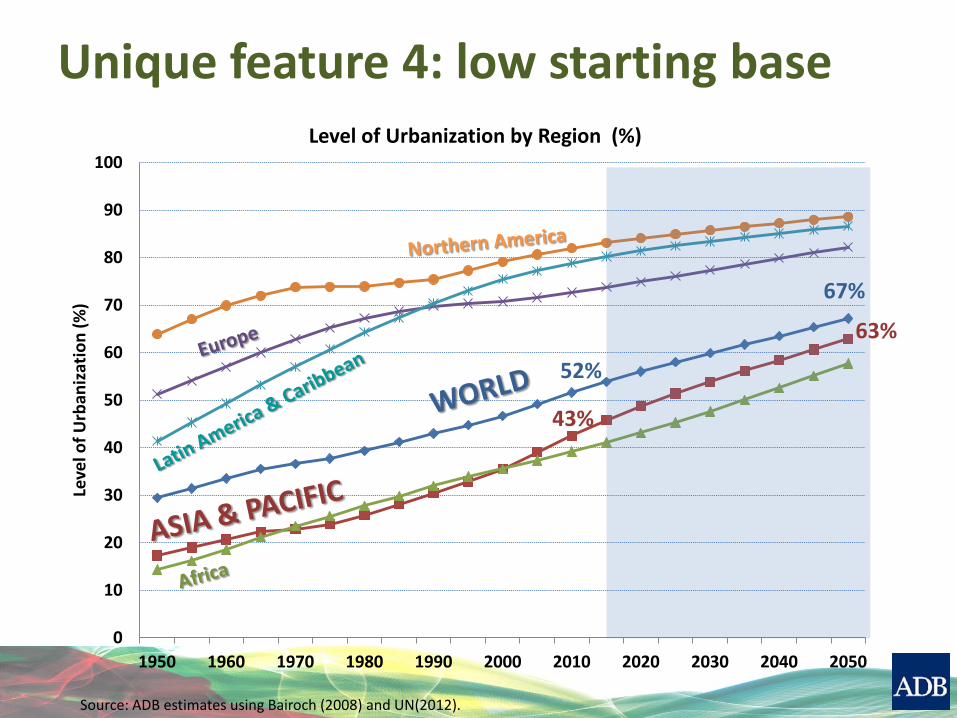
Unique feature 4: low starting base
0
10
20
30
40
50
60
70
80
90
100
1950 1960 1970 1980 1990 2000 2010 2020 2030 2040 2050
Leve
l of U
rban
izat
ion
(%)
Level of Urbanization by Region (%)
52%
43%
67%
63%
Source: ADB estimates using Bairoch (2008) and UN(2012).
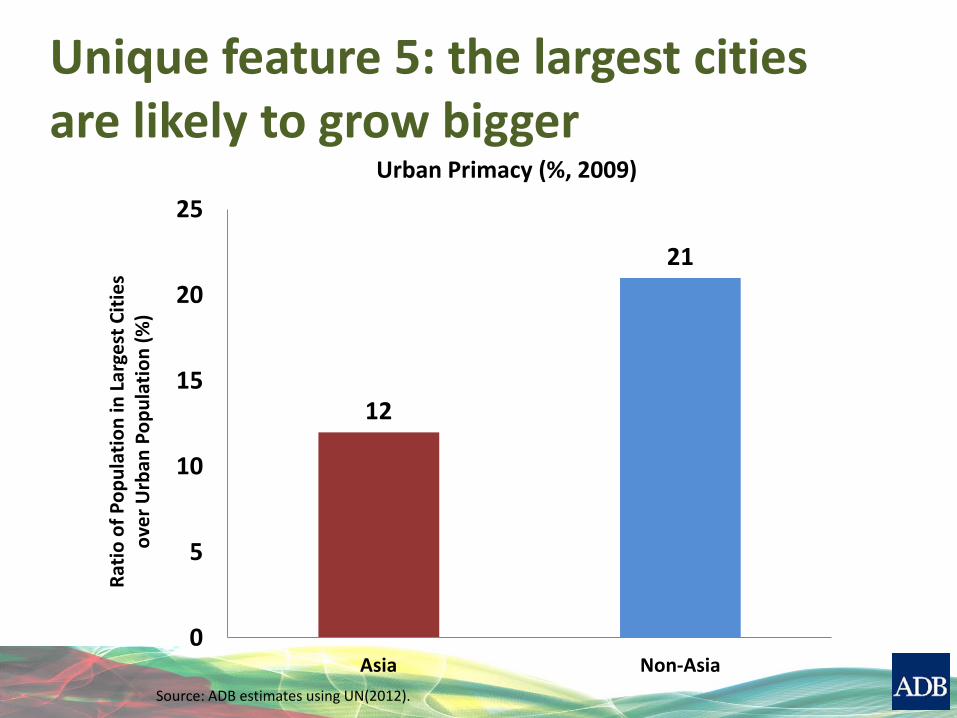
12
21
0
5
10
15
20
25
Asia Non-Asia
Urban Primacy (%, 2009)
Ratio
of P
opul
atio
n in
Lar
gest
Citi
es
over
Urb
an P
opul
atio
n (%
)
Unique feature 5: the largest cities are likely to grow bigger
Source: ADB estimates using UN(2012).

… thus more and bigger megacities are emerging
Megacities, 2025
ASIA: 21/37
Note: The circles indicate population sizes ranging from (10 million) to (39 million). The circles do not reflect the physical extents of the cities and any overlap between them merely reflects their relative population sizes and not any official acceptance or endorsement of any geographical sovereignty.
Source: UN (2012).
Unprecedented urbanization poses enormous challenges already serious
• Rising urban crimes
• Expansion of slums
• Above all, environmental degradation
Pollution
Vulnerability to flooding

Theft rates rise with urbanization
0
500
1000
1500
2000
2500
3000
3500
4000
4500
0 10 20 30 40 50 60 70 80 90 100
Thef
t (Ra
te p
er 1
00,0
00 p
opul
atio
n)
Urbanization Level (%)
Theft Rate versus Level of Urbanization: Global Data

Over 60% of global slum dwellers in Asia
Asia, 61%
Non-Asia, 39%
Shares of Global Slum Dwellers , 2010
Source: UN-HABITAT.

… and slum dwellers rise over time Asian Slum Dwellers , 1990-2010
428.7
465.2
492.2
505.4 505.6
380
400
420
440
460
480
500
520
1990 1995 2000 2005 2010
Slum
Dw
elle
rs (i
n m
illio
n)
Source: UN-HABITAT.

67% of Asian (vs. 11% Non-Asian) cities fail to meet EU air quality standard
0
50
100
150
200
250
300
350
400
Ahw
az
Ula
anba
atar
Sa
nand
aj
Ludh
iana
Ke
rman
shah
Ya
souj
Ka
npur
De
lhi
Luck
now
U
rom
iyeh
Q
om
Indo
re
Khor
amab
ad
Agra
Al
Ain
La
nzho
u Ko
lkat
a Va
n Xi
ning
U
rum
qi
Farid
abad
G
reat
er C
airo
M
exic
ali
Jaba
lpur
M
umba
i Dh
anba
d Ila
m
Alla
haba
d Bu
sheh
r Ke
rman
Jin
an
Beiji
ng
Patn
a Sa
raje
vo
Abu
Dhab
i M
eeru
t Xi
'an
Jaip
ur
Qaz
vin
Med
an
Chen
gdu
Hefe
i Sh
enya
ng
Taiy
uan
Vara
nasi
Ch
ongq
ing
Wuh
an
Esfa
han
Shiji
azhu
ang
Kony
a Ka
rs
Ham
edan
Ar
ak
Harb
in
Tian
jin
Nan
jing
Deni
zli
PM10
Leve
l (m
icro
gram
s/cu
bic m
eter
)
Cities with PM10 above 100 ug/m3 (2008-2009)
Asia and the Pacific (34/57) Non-Asia and the Pacific
EU standard
Source: WHO (2012).
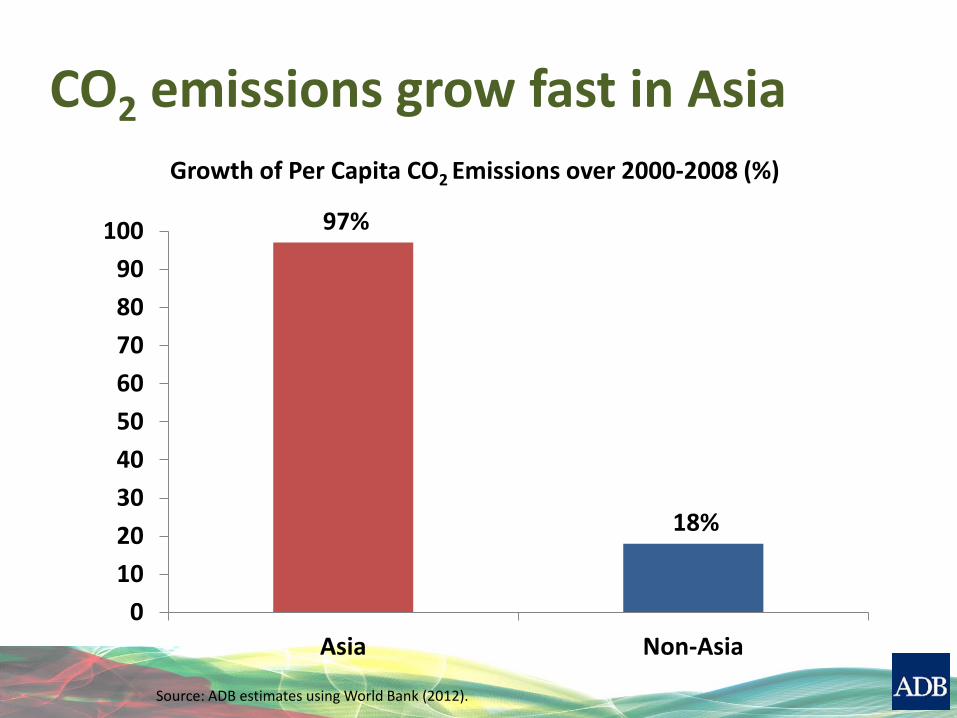
97%
18%
0 10 20 30 40 50 60 70 80 90
100
Asia Non-Asia
Growth of Per Capita CO2 Emissions over 2000-2008 (%)
CO2 emissions grow fast in Asia
Source: ADB estimates using World Bank (2012).

… and three of the top five CO2 emitting economies are in Asia.
0
1000000
2000000
3000000
4000000
5000000
6000000
7000000
8000000
China, People's Rep. of
United States India Russian Federation
Japan
CO2
emis
sion
s (kt
)
Top 5 Countries in terms of CO2 Emissions

Environment may degrade further with growth
Asia’s Environmental Kuznets Curve
05
1015
CO2 e
miss
ions (
tons/c
apita
)
0 5000 10000 15000 20000 25000 30000 35000 40000 45000 50000GDP per capita (in 2005 PPP)
2010=$6,107 Peak=$40,9712010=$6,107 Peak=$40,971
Source: ADB estimates using World Bank (2012).

CO2 emissions may triple under the business-as-usual scenario
3.4 3.5
5.6
7.6
9.3 10.2
0
2
4
6
8
10
12
2008 2010 2020 2030 2040 2050
CO2
emis
sion
s (to
ns/c
apita
)
Projected CO2 emissions based on latest EKC
Source: ADB estimates using World Bank (2012).

Asia is more vulnerable to coastal flooding
Urban population
at Risk (million)
Share of Population at
Risk (%)
Urban Area at
Risk ('000 km2)
Share of Area at Risk (%)
Africa 32 11 18 6
Asia and Pacific 251 18 129 11
Latin America 24 8 42 6
Europe 40 7 56 7
Risk of Coastal Flooding by Region, 2000
Source: ADB estimates based on McGranahan et al. 2007.
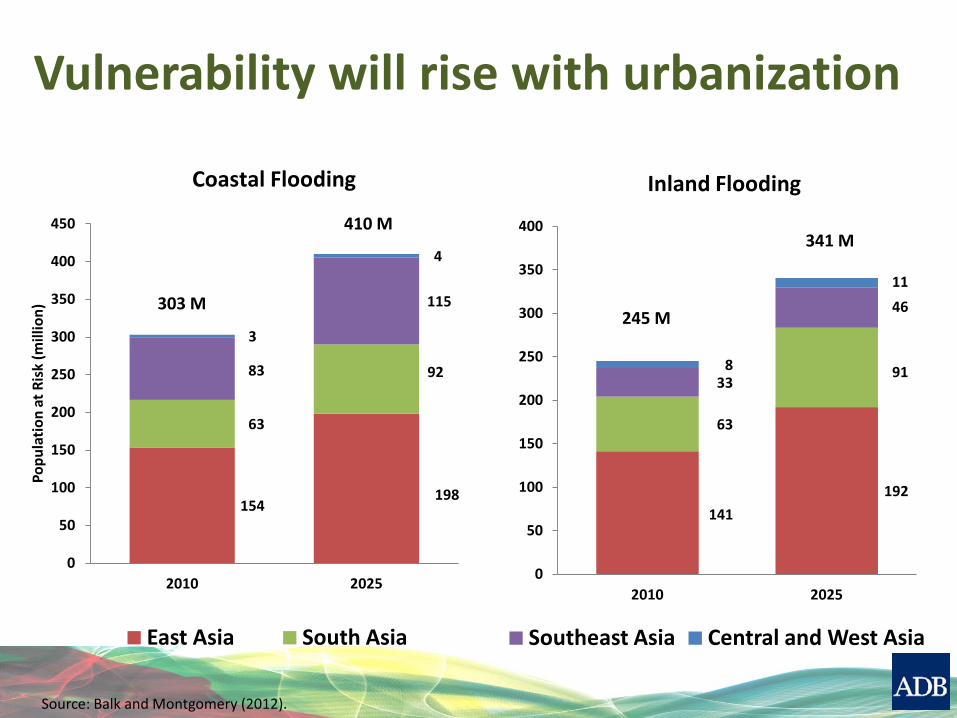
Vulnerability will rise with urbanization
154 198
63
92 83
115
3
4
0
50
100
150
200
250
300
350
400
450
2010 2025
Popu
latio
n at
Ris
k (m
illio
n)
East Asia South Asia
Coastal Flooding
410 M
303 M
141 192
63
91 33
46
8
11
0
50
100
150
200
250
300
350
400
2010 2025
Southeast Asia Central and West Asia
Inland Flooding
341 M
245 M
Source: Balk and Montgomery (2012).
Unique features of Asian urbanization make challenges more serious...
• Low level = a long way to go
• Fast speed = little time to adjust or learn
• More & bigger megacities = hard to manage
• More slums = higher vulnerability

But, urban agglomeration can help • Service sector pollutes less
• Manufacturers relocate (e.g., decline manu.)
• Efficient provision of infrastructure and services
• Innovation and higher labor productivity
• Nurture middle class and property owners
• And ...

Urbanization leads to lower fertility
48.4 42.6
39.0 39.3
0
10
20
30
40
50
60
2010-2020 2020-2030 2030-2040 2040-2050
Redu
ctio
n in
Pop
ulat
ion
(mill
ion)
Reduction in Projected Population due to Urbanization
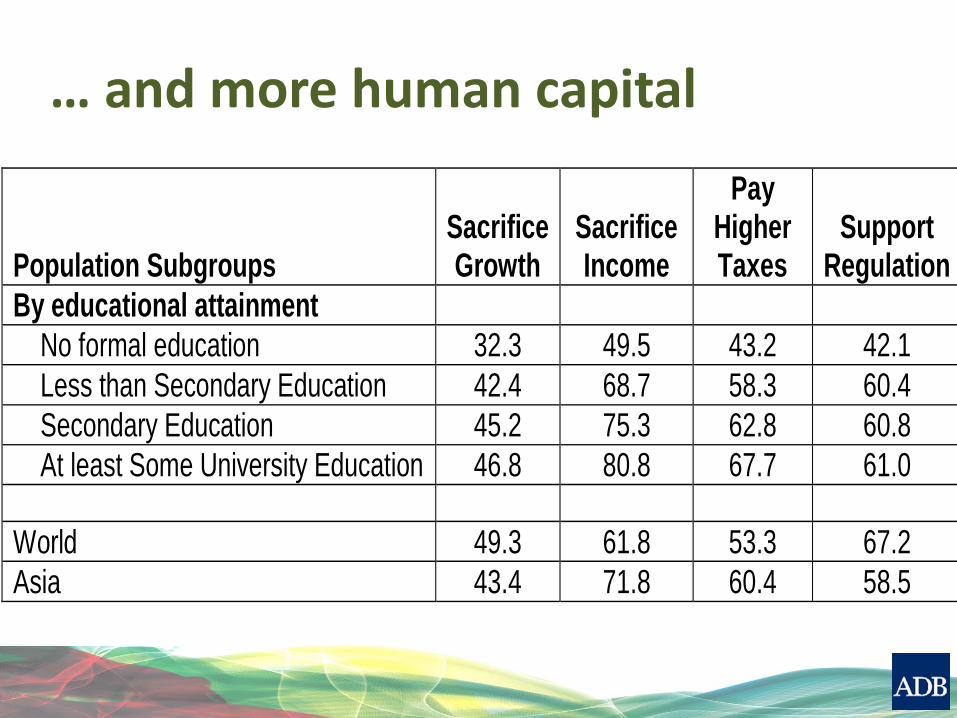
… and more human capital
Population Subgroups Sacrifice Growth
Sacrifice Income
Pay Higher Taxes
Support Regulation
By educational attainment No formal education 32.3 49.5 43.2 42.1
Less than Secondary Education 42.4 68.7 58.3 60.4 Secondary Education 45.2 75.3 62.8 60.8 At least Some University Education 46.8 80.8 67.7 61.0
World 49.3 61.8 53.3 67.2 Asia 43.4 71.8 60.4 58.5
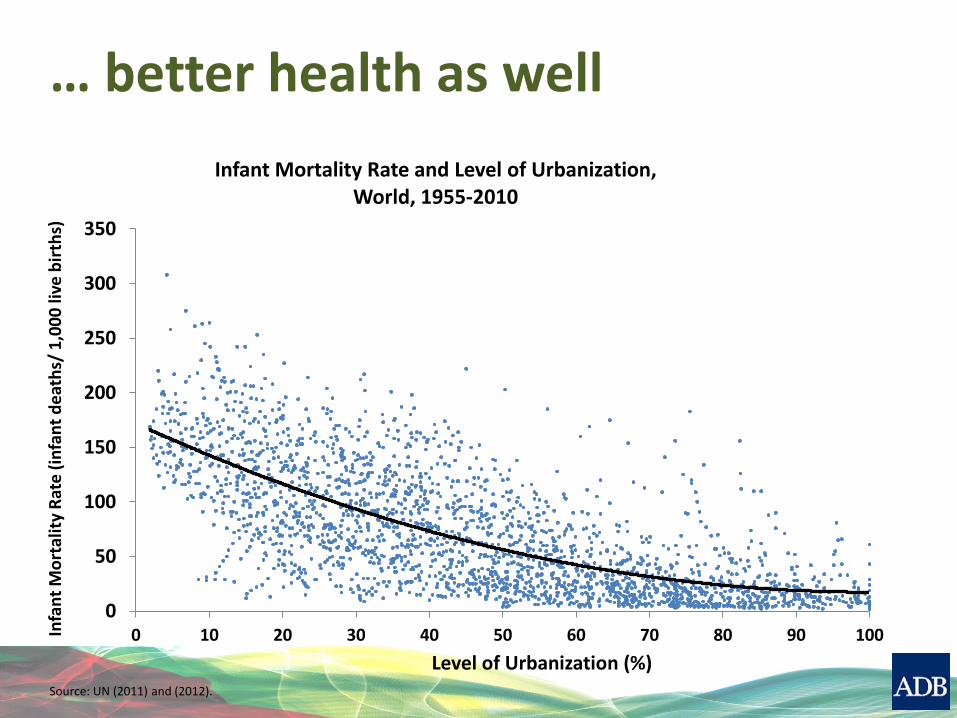
… better health as well
0
50
100
150
200
250
300
350
0 10 20 30 40 50 60 70 80 90 100 Infa
nt M
orta
lity
Rate
(inf
ant d
eath
s/ 1
,000
live
birt
hs)
Level of Urbanization (%)
Infant Mortality Rate and Level of Urbanization, World, 1955-2010
Source: UN (2011) and (2012).

The environmental impacts of urbanization
The growth impact may be negative
The composition effect is positive
Technical effect is also positive

Environment-Urbanization relation has improved over time
10
20
30
40
50
60
PM
10 L
evel (u
g/m
3)
0 20 40 60 80 100Level of Urbanization (%)
01
23
CO
2 e
mis
sio
ns (
mt/ca
pita
)
0 20 40 60 80 100Level of Urbanization (%)
1990s
2000s
1990s
2000s
CO2 PM10
Environment-Urbanization Curves
Source: ADB estimates.
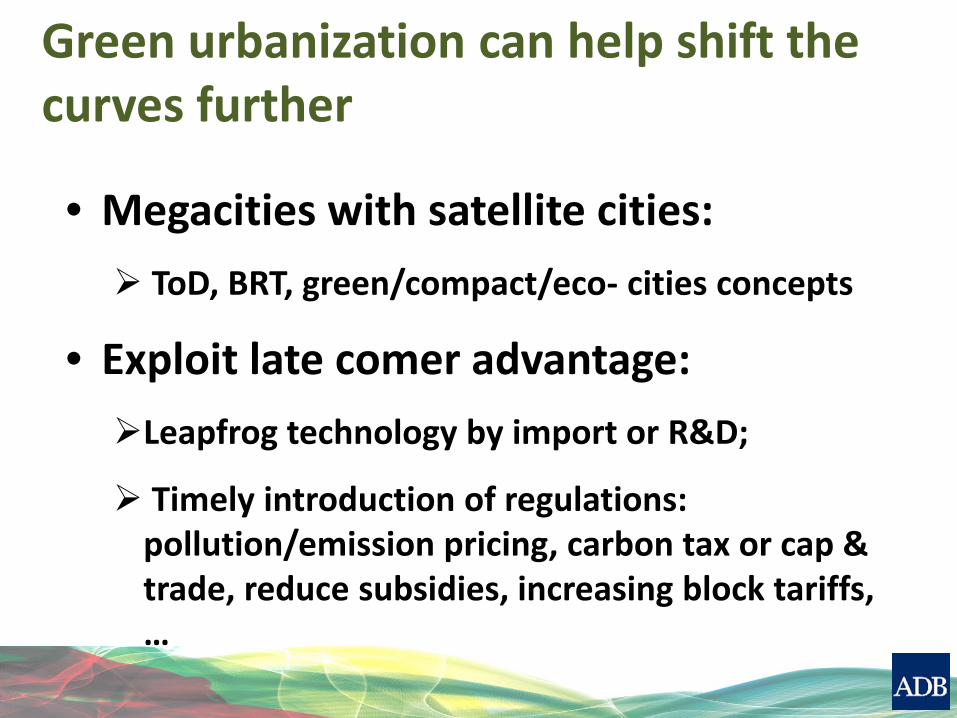
Green urbanization can help shift the curves further • Megacities with satellite cities: ToD, BRT, green/compact/eco- cities concepts
• Exploit late comer advantage: Leapfrog technology by import or R&D;
Timely introduction of regulations: pollution/emission pricing, carbon tax or cap & trade, reduce subsidies, increasing block tariffs, …
Conclusions
• It is counter-productive to contain urbanization, even for environmental concerns
• But, urbanization must exploit Asia’s own unique features
• Asia can achieve quality growth (lower inequality, less poverty and better environment) through well-managed urbanization!

Thank You