Social Determinants of Health: Impact on Children …pens.org/PENS Documents/PENS...
24
1 Social Determinants of Health: Impact on Children with Endocrine Disorders Terri Lipman, PhD, CRNP, FAAN University of Pennsylvania, School of Nursing Children’s Hospital of Philadelphia I have nothing to disclose Social Determinants of Health Conditions in the environments in which people are born, live, learn, work, play, worship, and age that affect a wide range of health, functioning, and quality-of-life outcomes and risks.
Transcript of Social Determinants of Health: Impact on Children …pens.org/PENS Documents/PENS...

1
�
Social Determinants of Health: Impact on Children with
Endocrine Disorders
Terri Lipman, PhD, CRNP, FAAN
University of Pennsylvania, School of Nursing
Children’s Hospital of Philadelphia
�
I have nothing to disclose
Social Determinants of Health
Conditions in the environments in which
people are born, live, learn, work, play,
worship, and age that affect a wide range
of health, functioning, and quality-of-life
outcomes and risks.

2
What are determinants of
health and how are they related
to social determinants of healthDeterminants of health are factors that contribute to a person's current state of health. These factors may be biological, socioeconomic, psychosocial, behavioral, or social in nature. Scientists generally recognize five determinants of health of a population:
� Genes / biology:- For example- family history of disease
� Health behaviors: for example, alcohol use, injection drug use (needles), unprotected sex, and smoking
� Social environment or social characteristics: for example, discrimination, income, and gender
� Physical environment or total ecology: for example, where a person lives and crowding conditions
� Health services or medical care: for example, access to quality health care and having or not having insurance
� In general, genes, biology, and health behaviors together account for about 25% of population health.
� Social determinants of health represent the remaining three categories of social environment, physical environment/total ecology, and health services/medical care.
� Social determinants of health also interact with and influence individual behaviors as well.
� Social determinants of health refer to the set of factors that contribute to the social patterning of health, disease, and illness. CDC, 2014

3
How do social determinants
impact health
� Income and social status - higher income and social status are linked to better health.
� Education – low education levels are linked with poor health, more stress and lower self-confidence. If all adult Americans experienced the level of illness and mortality of college graduates, the annual economic benefit would amount to at least 1 trillion dollars
� Physical environment – safe water and clean air, healthy workplaces, safe houses, communities and roads all contribute to good health.
� Employment and working conditions – people in employment are healthier, particularly those who have more control over their working conditions
� Social support networks – greater support from families, friends and communities is linked to better health.
� Culture - customs and traditions, and the beliefs of the family and community all affect health.
� Health services - access and use of services that prevent and treat disease influences health WHO, 2016
Why is addressing the role of social
determinants of health important?
� Addressing social determinants of health is a primary approach to achieving health equity.
� Health equity is "when everyone has the opportunity to 'attain their full health potential' and no one is 'disadvantaged from achieving this potential because of their social position or other socially determined circumstance'”
� Health equity has also been defined as "the absence of systematic disparities in health between and within social groups that have different levels of underlying social advantages or disadvantages—that is, different positions in a social hierarchy”
� Social determinants of health such as poverty, unequal access to health care, lack of education, stigma, and racism are underlying, contributing factors of health inequities.
Brennan Ramirez LK, B.E., Metzler M., Promoting Health Equity: 2008, Department of Health and Human Services,: Atlanta, GA.Braveman, P. and S. Gruskin, Defining equity in health., 2003.

4
�
“Your longevity and health are
more determined by your ZIP code
than they are by your genetic code”
Tom Frieden, the director of the
Centers for Disease Control and Prevention
2014
Moviehttps://www.youtube.com/watch?v=g7IiSM9La5M
https://www.youtube.com/watch?v=g7IiSM9La5M

5
The Diabetes Belt
� An estimated 12 percent of diabetes risk in a given ZIP code was associated with its neighborhood
characteristics, such as healthy food access, nearby exercise facilities, and safety level
� Living in an area with less of these perks translated to a more than 50 percent higher risk of diabetes than residing in a neighborhood with more privileges.

6
How is this relevant to us?
� The School of Nursing is intrinsically linked to external
communities.
� It is our responsibility to use our knowledge and expertise
through education, research and practice to address the
social determinants of health, partner with communities
and the University to improve the health and well being of
our neighbors.
Health? in Philadelphia
� Highest rates of poverty 19133, 19121, 19122, 19140, 19139
� According to U.S. Census data released in September, more than 29 percent of residents in Philadelphia’s 1st Congressional District live in poverty.
� Overall census data found Philadelphia to be the poorest among the country’s 10 largest cities, and the 1st District- that includes West Philadelphia- one of the hungriest, second only to the Bronx, N.Y.
� Children are the hardest hit by this economic deprivation. In 2009 child poverty in the 1st District stood at 40 percent, the eighth worst congressional district in the country

7
�
State of Health in
PhiladelphiaPhiladelphia Department of Health, 2013
Poverty
� 25.6% of Philadelphians lives below 100% of the poverty level.
� Philadelphia is the second poorest of the 11 largest U.S. counties.
� It is highest among Hispanics and in the Lower North planning district.
�
On-time high school graduation
� In Philadelphia, 61% of students graduate from high school
within four years after starting 9th grade.
� Philadelphia has the lowest on-time graduation rate of the
11 largest U.S. counties
� It is lowest among Hispanics. Planning district data are not
available.

8
Post-secondary education
� According to national data on the 11 largest U.S. counties,
Philadelphia has the second lowest percentage of adults
with post- secondary education.
� Like on-time high school graduation, post-secondary
education is lowest among Hispanics. It is lowest in the
North planning district.
Unemployment
� 10.8% of Philadelphians age 16 years or older are unemployed but seeking work.
� Philadelphia has the third highest unemployment rate among the 11 largest counties in the U.S.
� Unemployment almost doubled between 2000 and 2012, rising by 93% during this time period.
� It is highest among non-Hispanic blacks and Hispanics and in the North planning district.
West Philadelphia
� West Philadelphia has the poorest health indicators for
� Adult smoking
� Teen gonorrhea and chlamydia rates
� Preventable hospitalizations
� Food safety

9
Indicators that are worsening in
Philadelphia over time include:
� Unemployment, children and adults living in poverty
� Teen excessive drinking
� Hypertension, diabetes
� Teen condom and birth control use
� Late or no prenatal care
� Child asthma hospitalization
� Adult uninsured and access to care
� Adult mental health
West Philadelphia Health Assessment (Phila Dept Public Health, 2014)
Health Issue Prevalence PopulationLow birth weight 13.9%* Infants
Food Access 52.3%* w/ limited access General PopulationHypertension 48.3%* Adult
Obesity 43% (#2 in Philadelphia) Adult
Smoking 33%* Adult
Diabetes 22.7 (#2 in Philadelphia) Adult
Teen Chlamydia 11.8%* TeenTeen Gonorrhea 4.08%* Teen
Preventable Hospitalization 2.04%* <75 Years Old
*Highest in city
�
What can nurse
practitioners do to
address social
determinants of health
in practice?

10
Screen, Screen, Screen
� Food Insecurity
� Housing Insecurity
� Stress- Social Readjustment/ Life events
� Social Connection and Isolation
� Upstream Risk Screening Tool
� Include in EHR!!!
http://healthbegins.ning.com/page/social-screening-tools
Co-locate Community Based
resources
� Housing programs
� Job training centers
� GED programs
� Food pantries
� Medical legal partnerships
Home visiting programs
� Nurse- Family Partnership Program-has shown improvements in prenatal health-related behaviors, pregnancy outcomes, reduced rates of child abuse and neglect, reduced rates of subsequent pregnancies, and increased maternal employment
� Transitional Care Program-Dr. Mary Naylor- addresses the negative effects associated with common breakdowns in care when older adults with complex needs transition from an acute care setting to their home or other care setting, and prepares patients and family caregivers to more effectively manage changes in health associated with multiple chronic illness
� IMPaCT- HUP- Individualized Management for Patient-Centered Targets – Results in fewer ED visits,, fewer readmissions, increased attendance at follow up visits

11
Integrator: The Role of Community
Health Liaisons
� Identify environmental issues within the community
� Identify issues affecting individuals that may have a systems-wide solution (e.g., food insecurity, transportation barriers, etc.)
� Work with communities to develop action plans
� Educate and Engage clinical team about the community
Example: Provide community tours to health care providers from primary care practices to help them better understand the communities in which their patients live and how social and environmental factors may influence health
Engage in health policy addressing
Social Determinants of Health
� First, nurses must build strong alliances within their professional
communities, so they can speak with a unified voice about the
issues that matter to them the most.
� Second, nurses must build relationships with existing policy
makers, including legislators from both major political parties, at
the local and state level.
� Third, nurses must find allies and supporters outside the nursing
profession, particularly in business and other influential
communities.
IOM, 2010
How will this knowledge change
your approach to patient care?
� Exemplar- Child with Asthma Exacerbation
� How do you counsel your families?
� Therapeutic lifestyle changes
� Remove allergens
� Parent Smoking cessation
� Medication adherence

12
Side Effects of the Biomedical and Lifestyle Heart
Health Approach
� Removes the issue of the social determinants of
health right off the public policy agenda
� Those with low income made to feel that they are
responsible for their own poor health (victim
blaming).
� Health care providers and the media become
complicit in the process of ‘poor bashing’:
Ignoring facts and repeating stereotypes about
people who are poor.
� A parent without stable housing may-
� Have multiple competing demands
� No steady source of food for the family
� Be depressed
� Deal with more pressing concerns than removing allergens
� Face daily discrimination
Community Engagement is
Essential
� View- first hand- the Social Determinants of Health
� Understand the patients’ lived environment
� Form collaborative relationships in developing
interventions- a skill that is critical in your nursing career –
regardless of setting
� Tailor treatment/ interventions to patients’ resources –
rather than barriers

13
Exemplar- my practice
�Providing diabetes care within
Children’s Hospital
�It’s all about health equity!
� Racial disparities in the epidemiology and outcomes of diabetes mellitus have been well documented
� Diabetic neuropathy, kidney and liver failure, is three to seven times higher in African Americans.
� African American children with type 1 diabetes have been shown to have poorer metabolic control
� 9-fold increased risk of death for young African Americans with type 1 diabetes in Chicago compared with non-Hispanic white patients
Background
Background
� Current information about genetic and biological differences is not adequate to explain the racial disparities that exist in the United States
� IOM report identified several provider related factors that may contribute to disparate treatment and outcomes of minorities:
� 1) prejudice against minorities,
� 2) stereotypes held by providers about the behavior of minorities
� 3) patients/ families reacting to provider behavior and prejudice

14
Eye exams by race- CHOP
Children with type 1 diabetes
Eye exams by race- n= 1,041
Children treated with insulin
pumps- CHOP 2010- n=1922

15
�
Racial Disparities in Insulin Pump Therapy
and HbA1c among Children with Type 1
Diabetes (T1D) Enrolled in the T1D Exchange
Clinic Registry
Terri H. Lipman1,3, Steven Willi2,3, Kellee M. Miller4 and Roy W. Beck4 for the
T1D Exchange Clinic Network
University of Pennsylvania 1School of Nursing & 2 School of Medicine3Children’s Hospital of Philadelphia, Philadelphia, PA
4Jaeb Center for Health Research, Tampa, FL
Purpose
� To investigate racial disparities in diabetes care and outcomes of children with type 1 diabetes with regard to insulin pump use
� To examine the impact of insulin regimen on diabetes outcomes
T1D Exchange Clinic Registry
• 67 clinical sites (38 Pediatric) throughout the US• Longitudinal data collected through clinic
medical records and participant questionnaires
� Specific Objectives� Address pertinent clinical issues
� Conduct exploratory/hypothesis-generating analyses
� Identify participants interested in future research studies
• Currently over 16,500 participants (over 7,800Pediatric), ages 1 to 91, have been enrolled

16
Methods
� Analysis Cohort
� 7,862 Children, < 18 years of age with T1D duration for at least 1 year, participating in the T1D Exchange clinic registry
� All models were adjusted for SES, including highest parent education level and household income
Participant and Clinical Characteristics
Total N=7761White
N=6645BlackN=408
HispanicN=708
Age – years (mean ± SD) 11.8±3.6 11.8±3.7 11.7±3.6
Duration of T1D- years 5.2±3.5 4.9±3.4 4.9±3.4
Gender- Female 47% 52% 50%
Parent Education* %>HS 70% 43% 42%
Income* - %>$75,000 46% 17% 25%
HbA1c*- % (mean ± SD) 8.3±1.4 9.4±1.9 8.6±1.6
* p <0.001 for comparison between race/ethnicity groupswhen treated as a continuous outcome
Racial Disparities in Pump Use Stratified by Age Group
** *
#

17
Racial Disparities in Pump Use Stratified by Highest Parent Education
* p<0.001 vs White
^ p <0.01 vs White
^
**
*
Racial Disparities in Pump Use Stratified by Household Income
* p<0.001vs White
^ p <0.01 vs White
# p <0.05 vs White
#
^^
*
Results for Multivariate Model
Increased prevalence rate of using a pump
PRR p value
Whites compared with Black 2.55 0.005
Whites compared with Hispanic 1.66 0.004
*Multivariate Modified Poisson Regression Model adjusting for gender,
interaction between age and duration, and the interaction between SES
(income and education) and race/ethnicity. Income level and education were
treated as ordinal variables and an indicator for missing values was
included.
18
HbA1c according to Insulin Method Stratified by Race/Ethnicity
*Means and p value adjusted for confounders
* p<0.001
*
*
*
White
Black
Hispanic
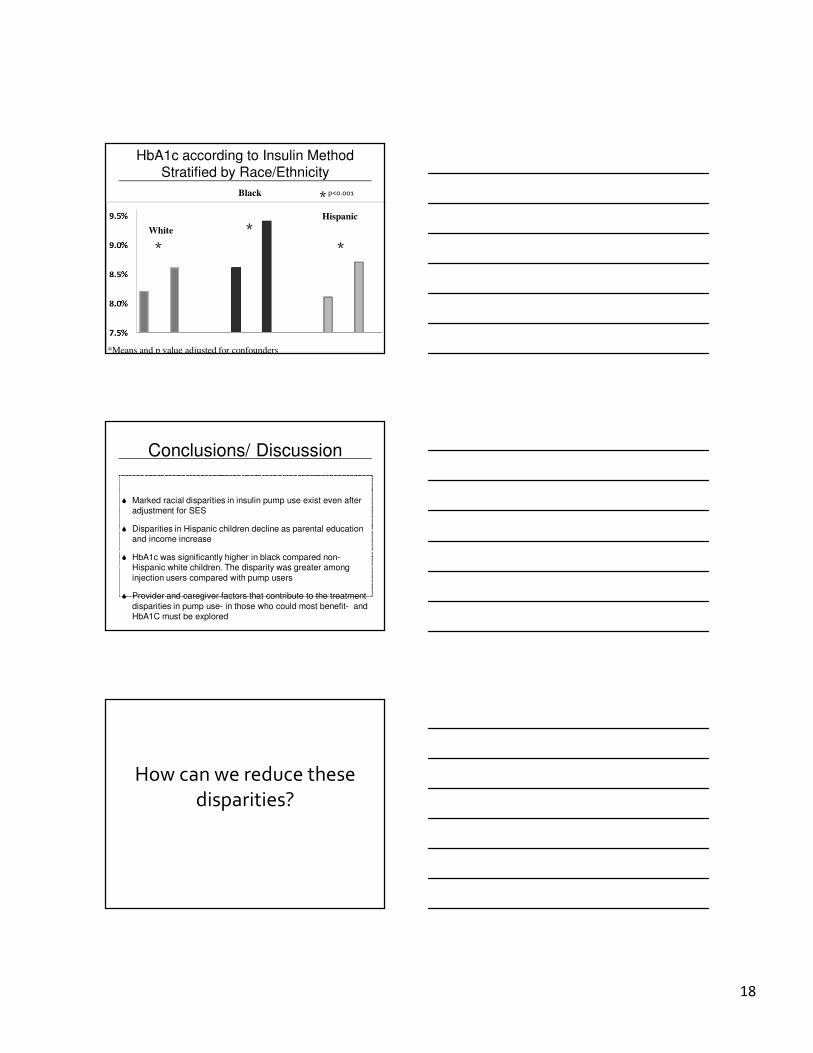
Conclusions/ Discussion
� Marked racial disparities in insulin pump use exist even after adjustment for SES
� Disparities in Hispanic children decline as parental education and income increase
� HbA1c was significantly higher in black compared non-Hispanic white children. The disparity was greater among
injection users compared with pump users
� Provider and caregiver factors that contribute to the treatment
disparities in pump use- in those who could most benefit- and HbA1C must be explored
How can we reduce these
disparities?

19
Reducing Health Disparities in Children with Diabetes: Developing Effective
Strategies Guided by our Patients’ and
Families’Wisdom
Terri H. Lipman, PhD, CRNP, FAAN
Kenneth Ginsburg, MD
Kathryn Murphy, PhD, RN
Rachel Corbin, BA
Funded by the Hampton-Penn
Center to Reduce Health
Disparities
Purpose- Specific aims
� 1. To examine the extent to which racial disparities exist in diabetes control, outcomes, and treatment in the Diabetes Center for Children (DCC) at CHOP
� 2. To determine how the current system of diabetes care could be delivered in a culturally competent manner
� 3.produce the best outcomes for all patients and reduce disparities between African American and White patients.

20
Stage I
� 6 - 10 parent focus groups
� 4 Black/ 2 White
� Racially concordant, trained facilitators-not a member of the research or health care team- limiting imposition of their own biases
� Series of questions derived by research team from previous data
Focus group questions
• What is your experience in the DCC?
• Do you ever feel judged?
• Where do you receive most of your diabetes information?Who gives you the most trusted information?
• Do you have input into diabetes care?
• Are you given options?
• Have you been told to obtain a yearly eye exam?
• Are people treated equally in the DCC?
Focus group data
� “Everything is rushed”
� “My nurse would put big red circles around high blood sugars”
� “I talk to a lady at work about diabetes. I believe her over the doctors and nurses”
� “They say ‘let’s try this and let’s try that’- like they’re experimenting with my child”

21
OUTCOMES ““““Where Do You Obtain Information You Trust Concerning
Your Child’’’’s Diabetes?””””
OUTCOMES ““““Where Do You Obtain Information You Trust Concerning
Your Child’’’’s Diabetes?””””
Long Term Goals / Future Research
� To implement a family-centered, culturally competent approach to care designed to reduce health disparities while assuring superb, effective care for all of our patients
� To measure the changes in satisfaction and health outcomes following the program’s implementation

22
Assessment of Diabetes Risk Factors in the
Community: A Partnership between Nurse
Practitioner and High School Students (2005-2009)
Funded by the Netter Center
for Community Partnerships
Results of Diabetes Risk Factor
Screening (2005-2009)
� 240 children (AA)
� Mean age- 9.5 yr (5 - 14.6 yr)
81/ 240 (30% required referral letters)
� 3% with linear growth failure
� 25% with obesity
� 24% with WC > 95th percentile
� 14% with acanthosis nigricans
Parental Report of Barriers
to Exercise in Children

23
Dance for Health:
Implementation of an
Intergenerational Program to
Increase Activity in the
Community- 2012-2016
Funded by the Netter Center for
Community Partnership
Center for Public Health Initiatives
Funded by the Center for Public Health Initiatives and the Netter
Ten Tips For Better Health -
Donaldson, 1999
1. Don't smoke. If you can, stop. If you can't, cut down.
2. Follow a balanced diet with plenty of fruit and vegetables.
3. Keep physically active.
4. Manage stress by, for example, talking things through and
making time to relax.
5. If you drink alcohol, do so in moderation.
6. Cover up in the sun, and protect children from sunburn.
7. Practice safe sex.
8. Take up cancer screening opportunities.
9. Be safe on the roads: follow the Highway Code.
10.Learn the First Aid ABC : airways, breathing, circulation.

24
Ten Tips for Staying Healthy –
Focused on Social Determinants of Health
Dave Gordon, 1999
1. Don't be poor. If you can, stop. If you can't, try not to be poor for long.
2. Don't have poor parents.
3. Own a car.
4. Don't work in a stressful, low paid manual job.
5. Don't live in damp, low quality housing.
6. Be able to afford to go on a foreign holiday and sunbathe.
7. Practice not losing your job and don't become unemployed.
8. Take up all benefits you are entitled to, if you are unemployed, retired or
sick or disabled.
9. Don't live next to a busy major road or near a polluting factory.
10. Learn how to fill in the complex housing benefit/ asylum application
forms before you become homeless and destitute.