Social and Environmental Factors Contributing to ...
50
Southern Illinois University Carbondale OpenSIUC Honors eses University Honors Program 5-1999 Social and Environmental Factors Contributing to Stereotypic Behavior in the Spectacled Bear Dana Marie Varble Southern Illinois University Carbondale Follow this and additional works at: hp://opensiuc.lib.siu.edu/uhp_theses is Dissertation/esis is brought to you for free and open access by the University Honors Program at OpenSIUC. It has been accepted for inclusion in Honors eses by an authorized administrator of OpenSIUC. For more information, please contact [email protected]. Recommended Citation Varble, Dana Marie, "Social and Environmental Factors Contributing to Stereotypic Behavior in the Spectacled Bear" (1999). Honors eses. Paper 72.
Transcript of Social and Environmental Factors Contributing to ...

Southern Illinois University CarbondaleOpenSIUC
Honors Theses University Honors Program
5-1999
Social and Environmental Factors Contributing toStereotypic Behavior in the Spectacled BearDana Marie VarbleSouthern Illinois University Carbondale
Follow this and additional works at: http://opensiuc.lib.siu.edu/uhp_theses
This Dissertation/Thesis is brought to you for free and open access by the University Honors Program at OpenSIUC. It has been accepted for inclusionin Honors Theses by an authorized administrator of OpenSIUC. For more information, please contact [email protected].
Recommended CitationVarble, Dana Marie, "Social and Environmental Factors Contributing to Stereotypic Behavior in the Spectacled Bear" (1999). HonorsTheses. Paper 72.

Social and Environmental Factors Contributing to Stereotypic Behavior in the Spectacled Bear
by
Dana M. Varble
A Thesis- Submitted in Partial Fulfillment of the Requirements ofZoology 493
Department ofZoology Southern Illinois University
April 1999

ABSTRACT
Stereotypies have many causes and contributing factors. Often overlooked is the
importance of social and environmental factors such as weather, pen design, social
interaction, feeds and feeding schedule, and early childhood experiences. These factors are
overlooked in favor ofmore concrete and testable factors such as size of the animal, pen
size, age, sex, and health. This research revealed the importance of social and
environmental factors in interpreting the causes of stereotypy in one captive spectacled
bear (Tremarctos ornatus) at the S1. Louis Zoo. Observational data collection was
employed to attempt to gather data supporting the influence of these factors. An ethogram
was constructed to aid in data collection. Observation occurred on 10 days between June
and November 1998. Data were then interpreted with the aid of statistical software.
Arithmetic means were calculated and employed as a means of comparing one abnormal
individual to two normal bears. The stereotypies, pacing and grooming genitals, varied
with time of day and other conditions. Evidence seemed to support cage design and early
childhood experiences, with slight contributions from feeding methods, animal size, and
sex, as the main causes of stereotypy in this bear.

ACKNOWLEDGMENTS
I would like to take this opportunity to thank my advisor Dr. George Waring, for
his assistance, guidance, and direction in the research and writing of the project. The use
of his equipment and wisdom was essential in the completion of this thesis. I also wish to
thank the staff of the St. Louis Zoo for welcoming me and providing an excellent
environment for captive animal study. I would like to extend further gratitude to the zoo
keepers in the bear pits at St. Louis Zoo. They were patient and enthusiastic in helping me
acquire the information I needed on my subjects. I also owe a debt ofgratitude to my
fiance, Bryan Hall, whose assistance with data analyzation, graphics, and with the
manuscript was instrumental in completing this study. The encouragement from him and
my family was the only reason I woke up some mornings to make the long drive to St.
Louis. Special thanks to Darla Arians for the use of her camera and Saramanda Goodwin
for editing assistance.
11

TABLE OF CONTENTS
Page
ABSTRACT. .i
ACKNOWLEDGEMENTS .ii
LIST OF TABLES v
LIST OF FIGURES vi
INTRODUCTION 1
Defining Stereotypy 1
Background on the Spectacled Bear 2
Objectives of this Research 4
MATERIALS AND METHODS 6
Subjects 6
Ethograrn Construction and Use 8
Data Collection 9
Data Analysis 11
RESULTS 15
Interviews with Zoo Keepers 15
Characteristics of the Observed Stereotypy 15
Feeds and Feeding Schedule 22
Assess the Effect ofWeather Conditions 25
111

Effect of Other Physical Factors 29
Analysis of Social Interactions 29
Individual Sensitivity and Childhood Trauma 31
DiSCUSSION .35
Most Important Physical Factors 35
Influence of Environmental Factors .36
Importance ofFeeds and Feeding Schedule .37
Significance of Social Interactions 38
Evidence for Psychological Disorder. 39
Possible Treatments 39
LITERATURE CITIED 41
IV

LIST OF TABLES
Table Page
I Scan Data Collection Form: Sample Portion 10
5 Average Daily Time-Budget of All Behavior for Subject 2 (Including average
percent of time spent in each period sleeping, pacing, grooming, and grooming
7 Percent of Active Time in Each Period Spent Pacing, Grooming, and Grooming
2 Continuous Data Collection Form: Sample Portion 10
3 Data Collection Time Period Variation 13
4 Average Daily Time-Budget of All Behavior for Subject 1... 18
genitals) 19
6 Average Daily Time-Budget of All Behavior for Subject 3 20
Genitalia (accounts for different rates sleeping) 21
8 Comparing Social Interactions Between Subjects I, 2, and 3 30
v

LIST OF FIGURES
Figure Page
I Diagram ofPen with Pacing Paths 16
2 Average Percent of Time in Each Period Spent Pacing, Grooming, and Grooming
Genitals by Subject 2 23
3 Percent ofDay Spent Pacing vs. Temperature 26
4 Percent ofDay Spent Grooming Genitalia vs. Temperature 27
5 Percent ofDay Spent Pacing and Grooming Genitals vs. Amount ofPrecipitation..28
6 Chronological Progression of Percent ofDay Spent in Social Interactions, Pacing,
Grooming, and Grooming Genitals 32
VI

INTRODUCTION
The time when humans first begmputting animals in cages for display is unknown.
Yet from that time on we have struggled to understand why captive animals behave
differently than their wild counterparts. We have tried to recreate natural settings to the
best of our abilities, and still the animals fail to respond to these artificial homes as they
would in nature. Zoos and animal parks are more suitable for animals now than they were
fifty or even ten years ago. Most animals in these parks lead happy, healthy, and stress free
lives. The prevailing program of"behavioral enrichment" attempts to fill captive animals'
time with other activities to prevent stress and boredom. Carlstead et aI. (1991) performed
a study specifically attempting to enrich the environment of several bears. They created
objects, like honey-filled logs, to encourage complex feeding behaviors similar to those of
wild bears. However, not all the problems have been solved. Among the most visible of
these problems is the performance of stereotypic movements, which are often said to be
indicative of poor welfare or stress. Perhaps it is time that we consider other causes for
this abnormality, or change further how animals are kept in captivity.
Defining Stereotypy
Stereotypies are characterized by three things; they are repetitive, invariant
movement patterns without goal or function (Carlstead 1996). This may seem clear, but
authors debate over the degree to which these things must be displayed to characterize
stereotypy (Mason 1991). For our purposes a movement must appear to be excessively

repetitious, meaning it is performed more often than necessary or normal. A pine marten
was once described as having a stereotypic scent marking disorder. Normally a scent mark
lasts for about two weeks in the elements, but one researcher was able to record an
individual in a small cage who placed 46 scent marks in only 10 minutes (Hediger 1950).
This is an excellent example of the repetitious nature of stereotypy.
Movement should be considered invariant only if the normal pattern of that
movement shows more randomness. For example, if rocking is normal in adolescent
primates, then it should only be considered invariant if the rocking is always performed in
the same plane of motion, body position, and spatial location. Although Mason (1991) and
other authors (Carlstead 1996, in particular) cite many examples of possible functions of
stereotypies, especially as an environment or stress regulator. Stereotypies show no
apparently observable goal; the performance ofthis movement does not result in an
immediate reward for the animal. Note that stereotypy is not universally defined as
abnormal (Mason 1991), although it is usually considered abnormal as stereotypic
behavior is almost exclusively displayed in captive animals and absent from wild
individuals (Lynch 1993). There is some speculation that possession of stereotypies may
be a normal condition for captive animals (Mason 1991), but due to lack of evidence this
is not the prevailing attitude.
Background on the Spectacled Bear
A group of spectacled bears residing at St. Louis Zoo was chosen to assess causal
factors of stereotypy. Spectacled bears (Tremarctos ornatus) are the last living
representatives of an older lineage of bears that diverged from other bear lineages between
10 and 15 million years ago. This separation occurred right after the lineage leading to
2

pandas diverged (Ward and Kynaston 1995). They have a shorter muzzle than other bears
and are the only bears whose range straddles the equator (Lynch 1993). They exist in the
remaining moist tropical forest, sometimes called "cloud forest" on the slopes of the
Andes mountains from eastern Panama to northern Argentina (Ward and Kynaston 1995).
They are almost entirely herbivorous; fifty percent of their diet consisting of bromeliads
(like pineapples). The five percent of their diet consisting of meat is from mice, rabbits,
deer, and calves. Captive bears fare best on a diet of plant material (peyton 1980). They
are excellent climbers and have been seen foraging as high as 49 feet off the ground
(Lynch 1993), where they have been known to stay in a single tree for up to four days to
take advantage of ripe fruit (Ward and Kynaston 1995). In captivity they live between 20
and 25 years or at most up to 36 years. They are easy to identifY as they posses light
brown circular markings around their eyes, thus the common name, which vary in color
and extensiveness in the individual. Males weigh about 250 Ibs. and females are about
30% smaller (Ward and Kynaston 1995).
Unfortunately, spectacled bears are not the best subjects on which to perform a
behavioral study. When assessing behavior, and assuming it is abnormal, it is often useful
to compare it to the species' normal wild behavior. This species' natural habitat is the
cloud forests which makes behavioral studies difficult because radio telemetry is not
possible due to the mountains and heavy cloud cover. Also, their geographical location
deters field research due to the political and environmental dangers inherent in the region
(Lynch 1993). Exotic diseases and the prevalence of drug traffickers deter North
American and European researchers. Because of this, almost all behavioral research on
spectacled bears has been done in zoos (Ward and Kynaston 1995). The little information
3

obtained on these animals in the wild will be used to assess the abnormality of any
stereotypic behavior.
The most significant research on spectacled bears was published in 1980 by
Peyton. The research focused on habitat use, distribution, and food habits of the species.
Although very little behavioral data were collected, some important behavioral
characteristics were discovered in his field observations. He confirmed the low percentage
ofanimal material in the bear's diet (about 4.1 % ofscat volume). Although he never
observed hunting bears, he gathered interesting stories on the hunting of spectacled bears.
While in South America he was called to examine 14 cattle deaths blamed on spectacled
bears. He found that 9 were the result of puma, rather than bear, attacks. Native people
tell stories of the bears chasing cattle and other prey down steep hills or off cliffs to make
the prey fall to the ground before they kill them. Other stories described the bear as
twisting a cow's head to make it fall. Due to the exaggerated nature of the stories, scat
analysis, and evidence on the carcasses, Peyton concluded that the bears are probably
mostly carrion eaters, with a few large males being principally responsible for predation on
cattle. He was also able to record some data on daily activity. He found no evidence of
nighttime feeding. Individuals living in the forest were active throughout the day, while
those living in the desert slept through the midday heat in caves.
Objectives of this Research
With the definition of stereotypy in mind, it is then important to conjecture why
captive animals still perform stereotypic behavior despite vast improvements in pen
conditions. There are as many causes for stereotypies in literature as there are articles
written on stereotypic behavior. As far back as 1950, Hediger cited cage size and pen
4

conditions ("poor welfare") exclusively as the cause of stereotypic behavior. He
performed several experiments in which he was able to eliminate stereotypies by increasing
the pen size of zoo animals. However, other factors have been proven to contribute to
stereotypy performance. My purpose, then, is to examine how much social and
environmental factors contribute to the stereotypic movement performed by one captive
spectacled bear subject. The influence offactors such as social interaction, weather
conditions, feeds and feeding schedule, cage design, and childhood experience on
stereotypic behavior will be assessed. These factors may contribute more to this behavior
than do factors such as age, sex, animal size, pen size, and health.
5

MATERIALS AND METHODS
Subjects
The St. Louis Zoo group of spectacled bears was chosen for several reasons. It
represented an accessible social group of at least three, but no more than five individuals.
Detailed observation would not have been possible with a larger group. The individuals
were easily discernible after some initial observations. The "spectacle" markings of the
eyes, as well as the markings on the nose and chest, and size made the three individuals
visibly distinguishable. One of the individuals showed abnormal stereotypic behavior, but
the others did not, implying at least in some part that cage conditions were not the main
cause of this stereotypy.
Subject I ("Marie") was a female, weighing about 130 Ibs. She was born at St.
Louis Zoo in 1990. She was loaned to another zoo where she successfully gave birth to a
litter of cubs, but she has since been returned. During the study, she was implanted with a
birth control measure. Zoo keepers did not know the chemical composition or name ofthe
device, and hospital personnel were unavailable to yield this information. In addition to her
smaller size, her "spectacles" are nearly complete large circles around her eyes. Subject 2
("Sombra") was a five-year-old male who performed stereotypic pacing behavior and
excessively groomed his genitalia, which can also be classified as stereotypic. He was born
in 1993 at the San Diego Zoo, where his pacing was initially observed by zoo officials. He
was moved to SI. Louis in 1995, where at the time of study weighed approximately 200
6

lbs. and was in good physical health. One of his litter mates from San Diego, Subject 3
("Quixote") was moved and housed with him. Subject 3 was five-years-old, in good
health, and comparable in size to his brother. The only observable difference between the
brothers was the pattern oflight brown markings on their muzzles.
All three bears were kept in the same unique enclosure at the St. Louis Zoo. The
bear grottos at this zoo were constructed from casts oflimestone cliffs. The result was a
rocky pen with numerous cliffs on the back wall and in the pen. Unfortunately, the
builders failed to account for the spectacled bears' climbing abilities and the bears climbed
these cliffs to escape once. Electrical wiring was then installed around the top periphery of
the pen to prevent this in the future. The pen in this study was approximately 60 feet wide
and 40 feet deep (not including the ditch at the front). It contained a wooden log
cemented upright and several stone ledges for the bears to climb and rest upon. There
were also two hollow logs cut in half on the floor of the pen and chained to the upright
log. A small waterfall against the back wall provided running water to a small pool in the
center of the pen. At the front of the pen is a ten foot wide ditch which the bears can
access by wide stone steps on either side of the cage. Because of the ditch and the fence
restricting zoo visitors, the bears were at least 15 feet from visitors at all times. Trees and
other plants were situated around the top of their enclosure providing some shade and
protection from the elements. The bears were not able to reach these plants. The bears
were observed watching the zoo visitors and seemed accustom to their presence. At no
time during this study did any zoo visitors throw anything into the pen.
7

Ethogram Construction and Use
Initial observations enabled me to learn how to identifY each bear and to create an
ethogram, which was used in all data collection. Thirteen behavior categories were
identified and defined based on their usefulness in this research. The ethogram categories
were as follows:
• sleeping-- lying down with no noticeable activity, also included resting states
with the bear in a horizontal position;
• eating-- placing items in the mouth, chewing and swallowing at least some of the
item;
• pacing-- the stereotypic circular, figure eight or linear walking around the pen
associated with a repeated tossing of the head;
• drinking-- the ingestion of a liquid;
• grooming-- the biting, licking, or sucking of the integument, but in not the
genital region;
• grooming genitals-- the biting, licking, or sucking of the' genitals;
• interactions- social behavior of any sort, in the following three categories:
~ friendly (with no use of teeth; sometimes included mutual grooming or just
touching),
~ aggressive (use of the teeth and/or claws on pen mate with intent to harm or
force them out of an area), or
~ moderate (any other social interaction with moderate use of the teeth and
claws, such as playing);
• swimming-- the body mostly submerged in water;
8

• wa1king-- locomotion of any type except while submerged in water or any
stereotypic movements;
• laying-- remained still while in a horizontal body position;
• sitting-- remained still with forelegs straight and hind legs bent with the rump
on the ground or hind legs straight out in front of body and body vertical with
rump on the ground;
• standing-- remained still and upright either quadrapedally or bipedally.
• not visible in enclosure-- animal could not be seen in upper portion of pen due to
raised features in the pen or the tunnels leading to the inner pen, also included
when the animal was inside (there was no public observation area inside the bears'
inner pen);
• not visible in ditch-- animal could not be seen due to being in the large ditch at
the front of pen;
Data Collection
Data collection occurred from June to November 1998. Much of the data
collection methods and charts were elicited from Crockett (1996). Scan sampling data was
taken every 20 seconds when a behavior was recorded for each individual, even if they
were not visible. Table I is a sample scan data collection table. The pen was scanned from
left to right and the first behavioral state observed for each individual was recorded.
Continuous data were taken by recording an initial behavior state for each individual, and
when the behavior state changed for any individual, the time of change and the new
behavioral state were recorded. Table 2 is a sample ofa continuous data collection table.
9

Table I. Scan Data Collection Form: Sample Ponion
Scan data Spectacled Bears
Date: Weather.
Start Time:
I 00:00:20
00:00:40
00:01:00
I 00:01 :20
00:01:40
i 00:02:00
00:02:20
00:02:40 I
00:03:00
00:03:20
00:03:40
00:04:00
su~ectiSu~ectlsu~ect 1 ! 2 I 3
I I I , Ii
! I !I
I !, i i I I
I I I,
! i I I .I I
I I I I
I
.
Pacing Duration # of viewers
IIComments
I I I I
I !
I I I ! I
I
I ! i I I I ! I I I I i I I I I I I
Table 2. Continuous Data Collection Form: Sample Portion
Continuous data Spectacled Bears
Dale: Weather:
Time: I SUbject I so Isu~ect I so Isu~ect I soI 1
I I! I I I I ,I I I I I I I
I ,I ! i I ! I I
Ii I I I ! ! I ,
I I I I I I I I I I I I
Comments
I I I I
I ,
I
I
I
10

A schedule for bear observation at the zoo was set up as foUows: observation
began at 1000 hrs, when I - 1.5 hrs of scan sampling occurred. The bears usually were not
released from their inner enclosure until 1000 hrs; prior to this they are fed the fruit and
vegetable part of their diet in their inside pen. The amount of time spent observing the
bears was determined by weather conditions and the amount of bear activity. Observation
ceased for the next I - 1.5 hrs and resumed at 1230 hrs. Two hours ofcontinuous data
were recorded. At 1430 hrs, observation ceased for a half hour. At 1500 hrs, 20 minutes
of continuous data were taken and, at 1520 hrs scan data were collected until 1700 hrs
when observation ceased due to the zoo closing. During this period around 1600 hrs, there
was a public feeding in which the bears receive one or two fish. At approximately 1630 hrs
the bears inner pen is opened for the evening and they were fed an "omnivore" diet, which
they had access to for the rest of the evening.
The bears were observed on 10 separate occasions. It was very important
that those days/ocassions represented different weather conditions and temperature
ranges. Therefore, observation began in June and continued into November so that an
appropriate range of temperatures could be represented. In addition to observational
sampling records, journal entries were made recording the days events in a qualitative
way, including any unusual behaviors observed, patterns noticed, and events not recorded
by the quantitative methods above. Following pen improvements, I returned to the zoo in
April 1999 for an observation day to note any changes.
Data Analysis
The daily observation schedule was split into eight time periods to aid in data
interpretation. Details on the beginning and ending times plus lengths ofthese time periods
II

are shown in Table 3. Time period I consisted of any significant observation prior to 1000
hrs. It may be important to note that this is immediately after their morning feeding. Time
period 2 was the main morning observation consisting ofobservation between 1000 hrs
and 1100 hrs. Any observation after 1100 hrs was put into time period 3. The continuous
data taken from 1230 hrs to 1430 hrs are in time period 4. This period was usually the
bears' least active period of the day. The continuous data taken from 1500 to 1520 hrs
was place in time period 5. Observation from 1520 to 1600 hrs was time period 6. From
1600 to 1620 was time period 7; this included the public feeding offish. From 1620 to
1700 hrs was time period 8; this included when their inner pen became accessible to the
bears as well as when they were fed their "omnivore" diet. Despite the time periods being
of unequal length, the data from each will be comparable. The data generated were
percentages indicating the rate of stereotypic behavior over a certain time period, not a
length of time spent performing such behavior.
Scan data were analyzed with the aid of computer software (SPSS), so
percentages of each time period spent in each behavioral state could be easily calculated.
Continuous sampling had to be analyzed by hand to generate the same percentages. For
each day it was also necessary to calculate the percentage of each day spent in each
behavioral state. To accomplish this the approximate number of minutes of each time
period in a certain state was calculated (In the case of scan sampling these are only
estimates of the trends observed every twenty seconds; the actual percentage of each time
period performing a certain behavior was not directly measurable). The number of minutes
each day was summed in each behavior category. This was then used to calculate the
percent of each day spent in each behavior category. When all ten days were finished, it
12

Table 3. Data Collection Time Period Variation
Time Pe~od
1
2 3
4
5 6 7 8
Beainni", Times in minutes)Endina Times Lenath
No. of Earliest Latest Averaae Averaae LonaInstances Earliest Latest Shorl Averaa.
5 09:30:00 09:43:00 09:36:48 09:57:20 10:01 :00 09:59:40 14:20 30:00 22:52 9 09:50:00 10:20:00 10:00:00 10:41:00 11:00:00 10:54:27 60:0040:00 54:27 4 10:54:00 11:00:00 10:58:30 11:14:00 11:40:00 11:23:30 40:0020:00 25:00
10 12:25:00 12:45:00 12:31 :00 02:30:00 02:45:00 02:31:30 125:00120:00 120:30 10 03:00:00 03:03:00 03:00:18 03:20:00 03:20:00 03:20:00 17:00 20:00 19:42 10 03:20:00 03:20:00 03:20:00 04:00:00 04:00:00 04:00:00 40:00 40:00 10
40:00 04:00:00 04:00:00 04:00:00 04:20:00 04:20:00 04:20:00 20:00 20:00
10 20:00
04:20:00 04:20:00 04:20:00 04:40:00 05:00:00 04:58:00 40:00 38:0020:00
13

was then possible to detennine the average (arithmetic mean) for each behavior category
for each bear. For Subject 2 the averages (arithmetic means) were determined in each
time period for certain behaviors (pacing, grooming, grooming genitals, and sleeping). All
weather data were determined from charts and data available to the public through the
National Climatic Data Center web site (www.ncdc.noaa.gov).
14

RESULTS
Interviews with Zoo Keepers
One of the most important aspects of my research was the information I gained in
interviews with the bears' keepers. Their intimate knowledge of the bears' health,
behavior, and background was of vital importance. During the interview I discovered
several important facts. Subject 2 had been performing both stereotypic behaviors (pacing
and grooming genitalia) at San Diego prior to arriving at St. Louis in 1995. Subject 3 had
also been known to perform some pacing, although it was a rare occurrence and was not
observed at any time during my research. Basically, Subject 3 was considered "normal."
All three bears were mother-raised. One keeper described the bears as unadjusted to
humans and especially pointed out that Subject 2 was "more nervous" than the others.
Characteristics of the Observed Stereotypy
Initially it was important to determine several characteristics about Subject 2's
stereotypies. Figure I shows all of the paths that the bear used in his stereotypic pacing.
They were somewhat varied, but on all paths there are areas where the bear raised his
short nose skyward and then rapidly lowered his head. These occurrences were called
head tossing. The pacing was done in a trance-like state, but he seemed capable of
breaking this trance. This characteristic is similar to the observations on polar bears (Ursus
maritimus); research on this species concluded that bears were often interrupted during
stereotypic bouts, indicating no reduced state of arousal (Wechsler 1991).
15

------Ii<" "
L ,
\
\ * ........'....-------
..,.,-----. ~.
;l\r- ---- - ~"'----- ~ HalrLog R.. ~\[. A'k(
.V til POOL i'"/
.j /' \ '0..., a-
\ ,
tt -17~ "0I V g ~,~/- \~71
./
-::r /' ~
L. ~----";> - - - -- - .:, -
;y ::r
I>ITCH '"
- 4 - Pacing Paths (directional arrows)
* Locations where head tossing occurred
ff" Locations where Groomong Genitals occurred
- Doors to inner pen
L Ledges
/'A
{--- ~ -~- -~--,/

Due to the variance in paths, Subject 2's motions were difficult to quantifY.
Variance has been noticed in polar bears, where 5% of their stereotypic pacing bouts
deviated from a normal path due to shifting a turning point, avoiding a cage mate, or more
often for no apparent reason (Wechsler 1991). Subject 2's paths deviated more frequently,
but the reasons for deviation were the same. In fact I did not recognize as "pacing" any
other paths besides the ones back and forth across the front of the pen until August 5.
Therefore, percentage of time spent pacing on the days before this may appear low only
do to a failure of the observer. Figure I also shows some of the common places where
Subject 2 groomed his genitals, although this occurred throughout the pen.
Tables 4 through 6 show how Subject 2's activities compare to the other bears.
These charts revealed that it may be important to consider grooming to be an abnormal
behavior as well. Subject 2 spent about 2% more of his daily time grooming than the
others. Tables 4 through 6 reveal that Subject 2 slept more than Subject I or 3 (32.8%
versus 27.5% and 31.0% respectively). This is different than what Wechsler (1991)
noticed. He showed that the most active bears, those that slept the least in a day,
performed the most stereotypic behavior (1991). It is worth noting, there were definite
differences in the amount of sleeping by Subject 2 from one period to the other, as shown
in Table 5. Table 7 accounts for these differences by removing the average amount of time
spent sleeping from the average length of each period. The remaining time can be
considered "active" time. Table 7 indicates the percentage of this remaining time that the
bear spent pacing, grooming and grooming genitals in each period.
It is important to realize that there were differences between all three subjects
concerning most of the behavior categories. These differences were expected. Each
17

Table 4. Average Daily Time-Budget ofAll Behavior for Subject I
tBehavioral State Sleeping
Percentaae of Dailv Budae 27.5%
1Not Visible in Enclosure 11.2% 1 1Not Visible in Ditch 8.6%1 I Eating 11.0% I IStereotypic Pacing 0.0%1 1Drinking 0.2%1 1GroominQ 1.0%1 1Grooming Genitalia 0.0%1 1Interaction - Friendly 0.2%1 1Interaction - Aggressive 0.1%1 'Interaction - Moderate 0.1%1 ISwimming 0.4%1 IWalking 17.5%' 'Laying 7.7%' 1Sitting 7.8%1
:Standing 6.6%
18
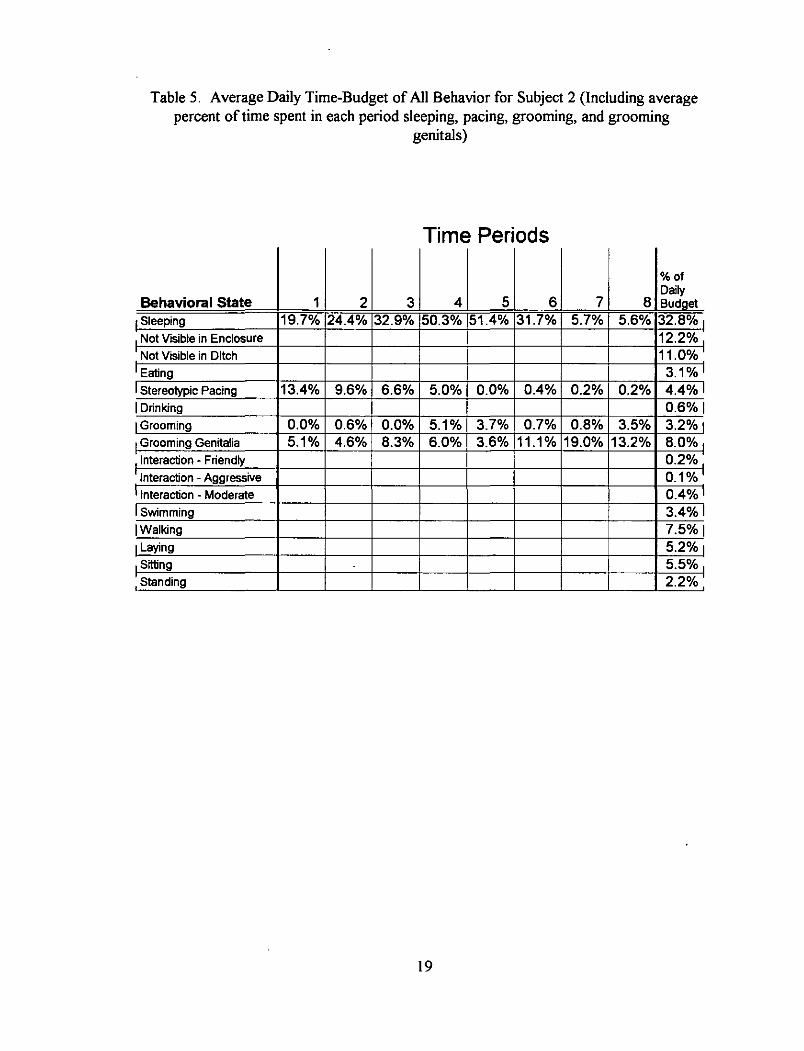
Table 5. Average Daily Time-Budget of All Behavior for Subject 2 (Including average percent of time spent in each period sleeping, pacing, grooming, and grooming
genitals)
Time Periods
DailyI ,I ,I ,I .1 ,I .1 ,IBehavioral State 8 BudaetI··I Sleeping 19.7% 24.4% 32.9% 50.3% 51.4% 31.7% 5.7% 5.6% 32.8%, , Not Visible in Enclosure 12.2% Not Visible in Ditch 11.0%
, Eating 3.1%' IStereolypic Pacing 13.4% 9.6% 6.6% 5.0% 0.0% 0.4% 0.2% 0.2% 4.4%1 1Drinking 0.6%1 1Grooming 0.0% 0.6% 0.0% 5.1% 3.7% 0.7% 0.8% 3.5% 3.2%1 ,Grooming Genitalia 5.1% 4.6% 8.3% 6.0% 3.6% 11.1% 19.0% 13.2% 8.0%, •Interaction· Friendly 0.2% , Interaction· Aggressive 0.1%' 1Interaction • Moderate 0.4%1 ISwimming 3.4%1 1Walking 7.5%1 ,Laying 5.2%1 ,Sitting 5.5%, Standing 2.2%
19

Table 6. Average Daily Time-Budget of All Behavior for Subject 3
tBehavioral State ,Sleeping
Percentaae of Dailv Budae 31.0%,
,Not Visible in Enclosure 12.5%, ,Not Visible in Ditch 27.2%, ,Eating 2.1%, I Stereotypic Pacing 0.0%1 IDrinking 0.2%1 IGroomina 1.3%1 1Grooming Genitalia 0.2%1 1Interaction - Friendly 0.3%1 1Interaction - Aggressive 0.1%1 1Interaction - Moderate 0.4%1 'Swimming 3.1%' 'Walking 8.3%' 'Laying 5.4%' ,Sitting 5.6%' :Standing 2.2%
20

Table 7. Percent ofActive· Time in Each Period Spent Pacing, Grooming, and Grooming Genitalia (accounts for different rates sleeping)
Time Periods Behavioral State 1 2 3 4 5 6 7 8
I Stereotypic Pacing 16.7% 12.7% 9.8% 10.1% 0.0% 0.6% 0.2% 0.2% ,Grooming 0.0% 0.8% 0.0% 10.3% 7.6% 1.0% 0.8% 3.7% Grooming Genitalia 6.4% 6.1% 12.4% 12.1% 7.4% 16.3% 20.1% 14.0%
•Active time does not include the average amount oftime spent sleeping in each period.
2\

individual animal had certain activities they were more occupied with than others. These
differences were simply due to individual uniqueness. Subtle differences should not be
confused with the high occurrences of abnormal behaviors in the case of Subject 2. For
example, all three bears spent time grooming and Subject 3 was even recorded grooming
his genitalia, but the rates of these activities are normal in Subjects I and 3 (1.0%
grooming and 0% grooming genitalia in Subject I and 1.3% and 0.2% in Subject 3) and
clearly abnormally high in subject 2 (3.2% grooming and 8.0% grooming genitals).
Feeds and Feeding Schedule
One factor often cited as a cause of stereotypic movement is the urge to hunt or
forage. Captive environments where food is provided on a scheduled basis do not permit
the animal to spend as much time in these activities as they would in the wild. These urges
can result in stereotypic behavior which increases prior to feeding periods, especially
pacing behavior (Carlstead 1996). It was therefore important to determine if Subject 2
showed increased stereotypic behavior around feeding times. Figure 2 shows the average
(arithmetic mean) that Subject 2 spent pacing, grooming, and grooming genitals during
each of the 8 time periods. Pacing does not increase in relation to the afternoon feeding
sessions, although grooming genitals does. Grooming does not appear to be time related
at all. Pacing seems most prevalent in the morning immediately after the bears are fed their
fruits and vegetables and released into the outdoor pen. However, Table 3 shows that the
morning sessions were not observed as often as the afternoon sessions, so it is possible
that the morning time periods (1-3) are bias. Also important in interpreting the importance
offeeding schedule is Table 7 which corrects for the differences in amount of time spent
22

20.0%
18.0%
16.0%
14.0%
1;' 12.0% Q III Grooming Genitalia ...
tv 0 13.2%19.0% v.> o Grooming"l: 10.0% .. • Pacing ..~
D. 8.0%
6.0%
4.0%
2.0% 3.7%
0.0% '---t_.0%' I .. ~7111 I 'O.2~ I ~.2""'-----i
1 2 3 4 5 6 7 8
Time Periods
Figure 2. Average Percent of Time in Each Period Spent Pacing. Grooming, and Grooming Genitals by Subject 2

sleeping between the periods. This table fails to show any increases in either stereotypy
associated with feeding.
Grooming genitals is a suckling stereotypy, which is not usually associated with
feeding schedules. Suckling is often considered a coping response to abnormally high
levels of stimuli that creates a rhythmic pattern of movement and is often associated with
the comfort usually provided by the animal's mother (Mason 1991). In this case feeding
methods such as schedule, types offeed, and presentation method, may be creating high
levels of stimulus. However, the actual stereotypy was caused not by the feeding, but by
some childhood occurrence, as is often observed in primates (Mitchell et al. 1979).
Hediger (1950) was one of the first animal behaviorist to study and treat
stereotypies. He claimed that stereotypies were a sure sign of poor welfare including such
things as inadequate space, poor flooring, and improper feeds. The St. Louis Zoo fed its
spectacled bears with an omnivore diet very low in animal protein content. They fed the
bears 3 times a day, which Carlstead et al. (1991) recommends to reduce the rate of
stereotypy in captive bears. Additionally, the bears were occasionally fed unusual things.
Did these unusual feeds cause an increase or decrease in any stereotypic movement or did
the novel stimulus in fact decrease stereotypy? Other experiments in behavioral
enrichment have shown that feeding methods that encourage foraging reduce stereotypy in
bears that show increased stereotypic movement around feeding times (Carlstead et al.
1991). On June 24, 1998, a keeper threw three blocks of ice with fruit frozen in them into
the bears pool during time period 4. Subject 2 did not pace during this time period and
spent 0.7% and 3.1% of this period grooming and grooming genitalia, respectively. These
were much lower than the averages of5.0% pacing, 5.1% grooming, and 6.0% grooming
24

genitalia for time period 4 (see Table 5). He also spent a below average amount of time
grooming, grooming genitalia, and pacing on this day. On July 26, 1998, the bears were
given large bones with some meat on them which they had access to all day. Pacing and
grooming genitals were above average on this day, while grooming was below average.
The same types of bones were present on October 25, 1998, and pacing and grooming
were below average and grooming genitals was very high. These data seems to indicate
that, at least in some part, complicating feeding methods involving fruit, but not meat,
reduce the occurrence of stereotypy in subject 2.
Assess the Effect ofWeather Conditions
In order to assess if weather conditions affected the bears Figures 3, 4, and 5 were
constructed. Figures 3, 4, and 5 are graphs of percent of the day spent pacing and
grooming genitalia versus temperature or inches of precipitation. Figures 3 and 4 clearly
show that there is no relation between temperature and the performance of stereotypies.
The idea being explored was that the physiological stress of being forced to live in
abnormal or unnatural temperatures would translate into psychological stress and cause
higher rate of stereotypy performance. The precipitation graph (Figure 5) shows a more
direct relation. Days of higher precipitation definitely show a higher degree of stereotypic
pacing performance. However, I do not think that enough observation occurred during
precipitation to conclude that one directly affects the other.
More important are other implications ofFigure 5. On rainy days there are
typically far fewer viewers at the zoo than on days lacking precipitation. This figure may
indicate that the number of viewers, if we can assume that there are less on rainy days, is
25

Figure 3. Percent of Day Spent Pacing vs. Temperature
10.4
9.6 Ol c:: 5.6·u III a. 5.2,., III Cl 4.4 '0 Q) 2.8 Ol Sc:: 2.2
~ Q) 2.1 a.
1.4
.0
I-~
H 1
1---1 H
I 1--1
I I HIGHS
LOWS
20 30 40 50 60 70 80 90 100
Daily Temperature Highs and Lows (degrees Fahrenheit)
26

Figure 4. Percent ofDay Spent Grooming Genitals vs. Temperature
CIl 15.4 'iij
'c- 13.7 Gl 0 11.5Cl c'E 7.4 0 I
0 e I7.1 >. Httl 6.9 Cl-0 6.0
-Gl
ICl ttl 4.5 C Gl
Iu 4.5 ~
Gl a. H2.9 I HIGHS
LOWS
20 30 40 50 60 70 60 90 100
Daily Temperature Highs and Lows (degrees Fahrenheit)
27

Figure 5. Percent ofDay Spent Pacing and Grooming Genitals vs. Amount of Precipitation
16.,.-------------
14
12
>al 10
-008-c
~ CD 6a.
4
Grooming Genitals 2
Pacingo+::-~~,___~~____c:=__::::_~_:;:__;! .00 .00 .00 .00 .00 .00 .00 .29 .43 .94
Precipitation (in inches)
28

inversely proportional to an increased stereotypic rate. This is a rather unexpected
outcome; perhaps the viewers provide an interesting stimulus to the bear.
Effect of Other Physical Factors
There are several additional physical factors that must be considered. In certain
animals stereotypic behavior may increase with age (Heid and Deesing 1998). If this were
the case with these animals, Subject I, who is three years older than Subjects 2 and 3, had
a greater chance of perfonning stereotypic behavior. However, there is no evidence that
this is the case. Size of the animal, especially in relation to cage size, is another factor. In
this case Subjects 2 and 3 were approximately the same size. If animal size was the main
factor then Subject 3 would show amounts of stereotypy similar to that of Subject 2. Pen
or cage size has been the most often blamed factor in stereotypies. All three bears are
housed in the same size pen and only one showed significant stereotypic movement.
Perhaps the real problem was not the amount of space, but the quality of the space
provided (Carlstead 1996). Another important factor to consider is the sex of the animal.
There is no evidence to suggest that one sex shows more stereotypy than another
(Marriner and Drickarner 1998). One part of this though may be due to sexual frustration.
Both of the males were five years old and neither has ever mated. (Subject I's birth
control implant made her unresponsive to the males.) Urge to reach a potential mate has
been documented as a cause for stereotypic behavior (Hediger 1950). Could this also be
the case if the mate is physically accessible, but unresponsive to advances?
Analysis of Social Interactions
One factor I wished to consider was Subject 2's social skills. Table 8 shows
information regarding social interactions between all three subjects. Subject 2 does not
29

Table 8. Comparing Social Interactions Between Subjects 1,2, and 3
Subject 1 SUbject 2 Subject 3 No. No. No. No. No. INo. Involved Initiated Involved Initiated Involved Initiated
Aggressive Interaction 3 to 5 0 10 to 12 3 to 4 9 3 Moderate Interaction 6 1 27 to 28 2 26 to 27 4 Friendly Interaction 14 192 1 24 9
Between 1 & 2 Between 2 & 3 Between 3 & 1 Aggressive Interaction 2 to 4 8 1 Moderate Interaction 4 23 to 24 5 Friendly Interaction 5 14 10
30

seem particularly abnormal according to these data. He seemed to initiate a larger
percentage of aggressive interactions, but I did not always record which individual
initiated the interactions. Subject 2 seemed to have more interactions than Subject I and
less than Subject 3. Subject 2 had more aggressive interactions with the female, Subject I,
and less fiiendly interactions with her than his brother, Subject 3. In general the brothers
interacted more together than with the female. There may, in fact, be many implications
for these differences. Figure 6 also shows that there was no evidence to suggest that
interactions are higher or lower on days when increased stereotypic rate was noted.
Individual Sensitivity and Childhood Trauma
Finally the last factor to explore was individual susceptibility to stereotypic
behavior. Several factors can contribute to this, including several which were beyond the
scope of this study. These would include genetics, early childhood traumas, relationship
with mother, and psychological disorders. The keeper described Subject 2 as more
nervous, but that could be due to any of the above factors. There is evidence that a
parent's different treatment of first born infants results in their performing more
stereotypies than later born siblings (Mitchell et a1. 1979). Could this also be the case in a
litter of bear cubs where the mother shows preferential treatment to the strongest infant to
increase her fitness? No record of the childhood events for the bears of this study was
accessible.
Some authors believe that the stereotypies shown by animals may in fact be
equivalent to human obsessive-compulsive disorder, autism, schizophrenia, mental
retardation, and brain damage (Mason 1991). Mental retardation and brain damage could
be tested medically, but those resources were beyond the scope of this study. The other
31

16.0%
14.0%
I" I
II I
, ,
' "\ \
12.0% , I I
\ \
w tv
,.. 01 C... 0.. c.. l:!.. l1.
4.0%
10.0%
8.0%
6.0%
•
, ,
# #
, ,
, I' , I ,
,I ' I
'I \ 'I
\ (
\ i I,
# #
. ;
• •
• •
• • ,
I \ I I \ I I \ I I \ I
" \ I , I \ I
" \ I " \ II I,J ,
, ,
; ;
; I
I
I
• •
\ \ \
••
2.0%
0.0%
1 • V •
• 5 r=:ae - ez -
c :::l.., d> ~
c :::l..,, ....
N
:;..,, ~
:;.., ,}, ~
:;..,, CO N
:;
d: N
Cl :::l <l: ,},
Cl :::l
~ ~
13 0 ,}, N
>0 Z• ~
N
~
Q.
<l:,....
Date
Grooming
Pacing
- - - Grooming Genitalia
--Aggressive Interactions
- Friendly Interactions
Moderate Interactions
Figure 6. Chronological Progression of Percent of Day Spent in Social Interactions, Pacing, Grooming, and Grooming Genitals

disorders mentioned fall in to two categories: neuroses and psychoses. Autism and
schizophrenia are psychoses, the category of more severe psychological disorders. They
are typically characterized by interference with the sufferer's normal perception and
orientation. The sufferer is incapacitated socially, and their behavior often causes injury to
themselves or others (Lindzey et al. 1978). Subject 2 did not display these symptoms.
While he may seem unusual socially, he is not incapacitated. He does not have problems
with orientation or self injury. His symptoms seem much more closely related to a
neuroses type disorder, such as obsessive compulsive. Individuals with neuroses may be
socially impaired, but their main problem is anxiety (Lindzey et al. 1978). Anxiety is often
associated with stereotypies (Mason 1991). The chief characteristics of obsessive
compulsive disorder are that certain obsessions produce anxiety causing the sufferer to
feel obligated to perform certain actions which they believe separate them from the source
of their anxiety (Lindzey et al. 1978). Like stereotypies, obsessive compulsive arises from
phobias and in some, but not all cases reduce the anxiety felt by the performer (Lindzey et
aI. 1978). While Subject 2 showed many symptoms of obsessive compulsive there was not
enough evidence to diagnose him with this disorder, although it remained a possibility.
Also important to consider is that attributing psychological disorders to these animals may
be just anthropromorphizing too much.
A final day of observation occurred on April 4th, 1999. In March 1999 several
aerial features were added to the cage. A hammock made of old fire hoses was suspended
between a high cliff at the back of the cage and the tree in the center. Below the hammock
half a hollow log was suspended between a lower portion of the same cliff and a lower
part of the same tree. Also the female was taken off birth control. On April 4th, Subject 2
33

spent 7.5% of his day pacing, 1.6% grooming, and 10.5% grooming his genitals. These
values are approximately the same as those in Table S. This seems to indicate that the new
aerial structures have not significantly added stimulation to the bear's environment. Mason
(1991) suggested that there may be a period of adjustment after a new stimulus is added to
an animal's cage during which stereotypy will increase dramatically to taper off to an
lower rate than the initial rate prior to the addition of the stimulus. If this is the case, the
bear's stereotypy may taper off in the future when he is fully adjusted to the new
structures.
34

DISCUSSION
We are left now with deciding which of the above mentioned factors are the most
important in causing this bear's stereotypy. While grooming genitals and pacing should
definitely be considered stereotypical and highly excessive, grooming may not be. Subject
2 may groom more than the others, but it fails to occur in any noticeable pattern and could
be due to any number of other factors (dry skin, external parasites, rashes, etc.). There is
not enough data to conclude that this behavior is stereotypic in nature.
Most Important Physical Factors
We must now determine which physical factors play the most important role in the
pacing and grooming genitals stereotypies. Subject 2 is the same size, sex, and age as his
brother. Ifany of these were main factors, his brother, Subject 3, would also display high
levels of stereotypic behavior. Although sex and size may contribute slightly to Subject 2' s
stereotypy, since Subject 3 also shows occasional stereotypic pacing, they are not the main
cause. All three animals are also in excellent health, thus physical health is not a factor
contributing to stereotypy in subject 2.
Another physical factor explored was pen size. Although increased pen size has
been shown to eliminate stereotypy in some cases (Hediger 1950), it does not seem as
important in this case. All three bears live in the same size cage, yet only one shows
stereotypic movement. Cage size tends to be more important in animals who patrol large
territories in the wild (Carlstead 1996), such as polar bears, whom patrol huge territories
35

to support their carnivorous diet. Spectacled bears, on the other hand, may define their
territories by tree clusters, which are not particularly large areas (Lynch 1993). One
problem in early cage designs was that the animal was not able to withdraw from threats
(i.e., viewers, keepers, etc.) at least two flight distances and therefore underwent increased
stress due to their proximity (Hediger 1950). Because the other two bears do not seem
distressed, it is safe to conclude that the pen is of adequate size to allow the animals to
adequately withdraw from threats.
Influence ofEnvironmental Factors
I am inclined to agree with Carlstead (1996) who claimed that space is more
important in quality than in quantity. Complicating an animals surroundings by adding
objects has been shown to decrease stereotypy. The spectacled bear is a highly arboreal
species and it may be important that their pen reflect this lifestyle. Perhaps a spectacled
bear pen should be constructed in the same way a pen for a large, clumsy ape would be.
Although they are not quite as agile as primates, I learned from one zoo official that the
bears in this study were able to escape from their pen. They were returned with minimal
difficulty and electrical wiring was installed around the top of the pen to prevent future
incidence. This revealed how truly agile these bears can be. Although the other bears living
in this pen may be normal, they too could benefit from a pen more suited to their arboreal
tendencies. The current improvements are one step toward this ideal. Other structures
encouraging climbing should be added to create a more challenging and complex aerial
cage structure.
Another environmental factor I explored was the influence of weather. Although
no correlation was found between temperature and stereotypy, there was one between
36

precipitation and stereotypy. I strongly suspect that this is again due to other
environmental conditions. There is not much evidence, nor do I feel, that the amount of
precipitation directly causes increased rates of stereotypy. Perhaps the greater number of
viewers on days without precipitation provide a stimulus strong enough to divert the bears
attention from stereotypic behavior. In this sense the rain is not the problem, but the lack
of stimulus from the viewers is the cause.
Imoortance ofFeeds and Feeding Schedule
There is some relationship between the bears feeding schedule and Subject 2's
stereotypic behavior (see Figure 2). Pacing was most prevalent in the morning immediately
after they receive the fruit and vegetable part of their diet. Grooming genitals was most
prominent during time period 7 which is when the bears were fed fish at a public feeding.
Grooming genitals also increased prior to and after this time period. In interpreting this
information, also consider the average amount of time the bear sleeps during each time
period (Table 5). If this is considered, then time periods I through 6 show much more
sleeping than time periods 7 and 8 (19.7% to 51.4% compared to 5.7% and 5.6%). The
adjusted figures in Table 7 show that the total percent of time spent grooming genitals and
pacing in stereotypic patterns is only decreased in time period 5, but more importantly it
shows that these behaviors do not significantly increase during time periods when feeding
occurs. For this reason, I do not believe that the stereotypy is related to the bears feeding
schedule. There is, however, enough evidence to show that fruit presented in unusual
ways to the bears causes a reduced rate of stereotypy. As long as these food presentation
ideas remain novel there is a chance that stereotypy can be reduced (Carlstead et a1. 1991).
37

Significance of Social Interactions
There are also social factors that may contribute to the performance of Subject 2' s
stereotypy. Social interactions seemed unusual in Subject 2, but the question is whether
this was causing the stereotypy or whether it was caused by the stereotypy. Because the
stereotypies were present before the bear was introduced into in the pen at St. Louis Zoo,
the stereotypy probably caused the bear to lack some social skills leading to his unusual
social interactions. The problem of poor social interaction was not serious, although his
tendency to be more aggressive with the female may prevent him from mating with the
female if this situation were to arise. His brother, Subject 3, may have an increased
breeding opportunity as he has more friendly interactions with the female.
More important socially may be Subject 2's early childhood experiences, ofwhich
we have no knowledge. There is a good deal of evidence that childhood experiences can
greatly affect stereotypic performance later in life (Mason 1991). As discussed earlier, any
abnormal relationship with his mother may have resulted in his stereotypy. When
interpreting these ideas it is important to remember that the display of stereotypic
movements is greatly dependent on the individual (Mason 1991). Two bears whose lives
were virtually the same (such as Subject 2 and Subject 3) may show different rates of
stereotypy due to genetics or simple individual predisposition to stress and stereotypy.
This increased susceptibility may have caused Subject 2 to react in a more extreme way
than Subject 3. Two parts to consider here are that current problems are not always the
result of current conditions (Mason 1991), and a sensitive animal may be reacting to
factors which are simply not affecting the other animals. A sensitive animal raised in plain,
unstimulating surroundings is more prone to stereotypy than those raised in complex pens
38

(Broom 1981). These plain childhood surroundings combined with any childhood trauma,
especially separation from mother, could have created enough mental damage so as to
cause stereotypy performance to persist into adulthood.
Evidence for Psychological Disorder
There also appears to be some evidence to suggest that Subject 2 may have
obsessive compulsive disorder. More evidence is needed to safely conclude that this is an
important factor. Also, brain damage and mental retardation have to be excluded before
anything can be assumed. More information needs to be gathered before the bear is treated
for obsessive compulsive. Due to the cost and time commitment to obtaining further
information, other courses of action should first be pursued.
Possible Treatments
What can be done then to decrease the incidence of stereotypy in Subject 2? It is
important for the animal's pen to provide stimulus similar to those they would encounter
in the wild. All three bears climb the ledges and tree in their pen and spend significant
amounts oftime off the ground. The additional structures recently added are utilized often
by all three bears. It is important that they are provided with even more objects to climb
and navigate off the ground in their pen, keeping in mind their excellent climbing abilities
and affinity for arboreal life. Special effort should be made to add novel items to the bears'
cage during rainy days to replace the stimulus usually provided by the viewers. Insuring
the bears are receiving a diet consisting ofless than five percent meat, like the diet of wild
spectacled bears would also be beneficial. Novel feeding methods, like the frozen fruit,
should be explored and utilized as often as possible with special effort being made to keep
the bears form becoming adjusted to anyone method. Keepers described the bears as
39

being unadjusted to humans. Because of this, every effort should be made to have as little
contact as possible with all the bears, but especially with Subject 2.
It is surely evident that whatever initially caused this stereotypy happened prior to
the bear being transported to St. Louis from San Diego. It may be that Subject 2 is simply
more sensitive than his brother, Subject 3, whose stereotypic behavior has been minimized
at St. Louis. It may not be possible to completely eliminate his stereotypy with pen
improvements, novel feeding methods, and minimal contact with humans. However, if
those actions reduce the stereotypy to levels which will not interfere with the bear's
health, socialization with his pen mates, and normal bear activity, then no further treatment
would be necessary. In fact, these changes would be beneficial to all three bears. Yet, if
these treatments fail to correct the problem, the next step would be to insure that Subject
2 has normal brain function-- to rule out brain damage or mental retardation. Then it may
prove helpful to seek a professional who can confirm or deny the presence of obsessive
compulsive disorder and prescribe a suitable schedule of treatment. However, these costly
procedures should be considered a last resort.
40

LITERATURE CITED
Broom, D.M. 1981. Biology ofBehavior. Cambridge University Press, New York, pp.
98-100.
Carlstead, K. 1996. Effects of captivity on the behavior ofwild mammals. Pages 317-333
in D. G. Kleiman, M. E. Allen, K. V. Thompson, S. Lumpkin, and H. Harris,
editors. Wild mammals in captivity. University of Chicago Press, Chicago, Illinois.
__.,1. Seidenslicker, and R. Baldwin. 1991. Environmental enrichment for zoo bears.
Zoo Biology 10(1): 3-16.
Crockett, C. M. 1996. Data collection in the zoo setting, emphasizing behavior. Pages
545-565 in D. G. Kleiman, M. E. Allen, K. V. Thompson, S. Lumpkin, and H.
Harris, editors. Wild mammals in captivity. University of Chicago Press, Chicago,
Illinois.
Hediger, H1950. Wild animals in captivity. Dover publications, New York, pp. 75-77.
Heid, J.C. and MJ. Deesing. 1998. Genetic effects on horse behavior. Pages 203-235 in
T.Grandin, editors. Genetics and the behavior of domestic animals. Academic
Press, San Diego California.
Lindzey, G., C.S. Hall and R.F. Thompson. 1978. Psychology. Second edition. Worth
Publishers, New York, New York, pp. 523, 533, 529-530.
Lynch, W. 1993. Bears: monarchs of the northern wilderness. The Mountaineers, Seattle,
Washington, pp. 218-221.
41

Marriner, L.M. and L.e. Drickamer. 1994. Factors influencing stereotyped behavior of
primates in a zoo. Zoo Biology 13: 267-275.
Mason, GJ. 1991. Stereotypies: a critical review. Animal Behaviour 41: 1015-1037.
Mitchell, G., T.L. Maple, and 1. Erwin. 1979. Development of social attachment potential
in captive rhesus monkeys. Pages 59-Ill in GJ. Mason, T.L. Maple, and J. Erwin,
ed. Captivity and Behavior. Van Nostrand Reinhold, New York.
Peyton, B. 1980 Ecology, distribution, and food habits of the spectacled bear, Tremarctos
ornatus. in Peru. Journal ofMarnmology 61(4): 639-652.
Ward, P. and S. Kynaston. 1995. Wild bears of the world. Facts on File, New York, pp.
40,43,49,87,99,119,160,168.
Wechsler, B. 1991. Stereotypies in polar bears. Zoo Biology 10(2): 177-188.
42