Identifying the Contributing Factors of Motorcycle ...
1
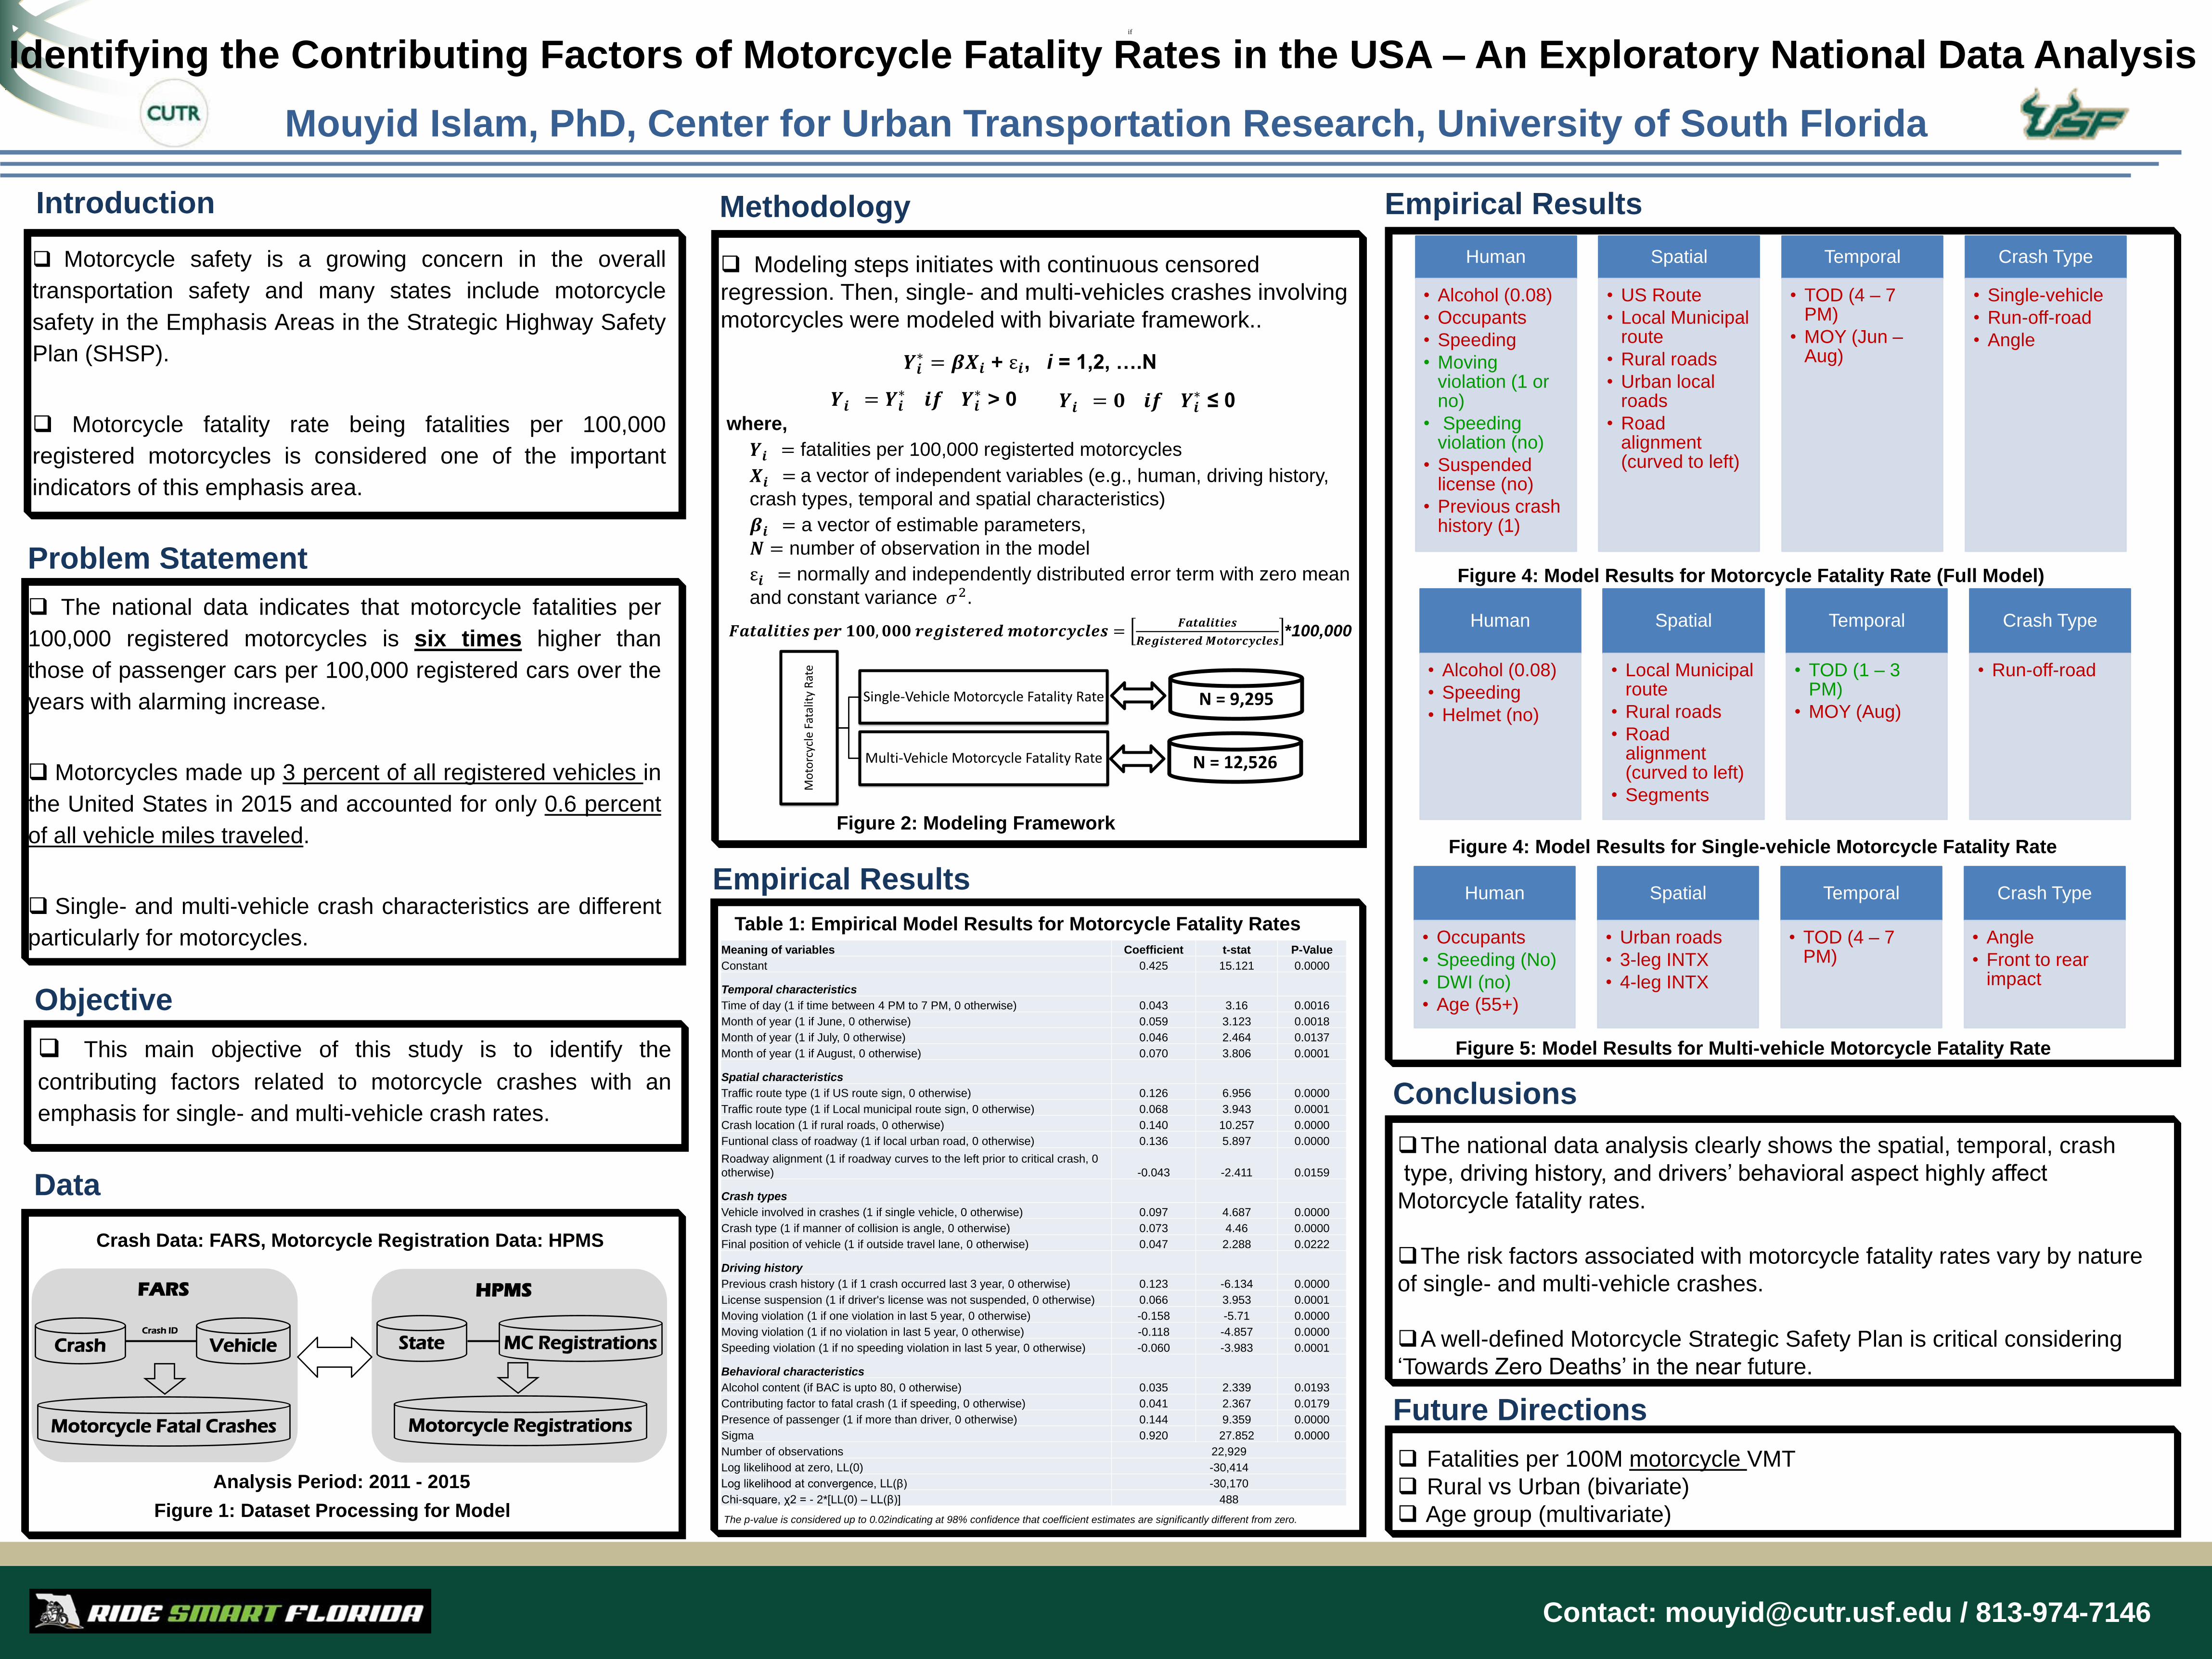
Identifying the Contributing Factors of Motorcycle Fatality Rates in the USA – An Exploratory National Data Analysis Mouyid Islam, PhD, Center for Urban Transportation Research, University of South Florida Introduction Problem Statement Motorcycle safety is a growing concern in the overall transportation safety and many states include motorcycle safety in the Emphasis Areas in the Strategic Highway Safety Plan (SHSP). Motorcycle fatality rate being fatalities per 100,000 registered motorcycles is considered one of the important indicators of this emphasis area. Objective Empirical Results The national data indicates that motorcycle fatalities per 100,000 registered motorcycles is six times higher than those of passenger cars per 100,000 registered cars over the years with alarming increase. Motorcycles made up 3 percent of all registered vehicles in the United States in 2015 and accounted for only 0 .6 percent of all vehicle miles traveled. Single- and multi-vehicle crash characteristics are different particularly for motorcycles. Methodology Future Directions Fatalities per 100M motorcycle VMT Rural vs Urban (bivariate) Age group (multivariate) This main objective of this study is to identify the contributing factors related to motorcycle crashes with an emphasis for single- and multi-vehicle crash rates. Modeling steps initiates with continuous censored regression. Then, single- and multi-vehicles crashes involving motorcycles were modeled with bivariate framework.. . Data Motorcycle Fatality Rate Single-Vehicle Motorcycle Fatality Rate Multi-Vehicle Motorcycle Fatality Rate if ∗ = + ε , i = 1,2, ….N Crash Vehicle Crash ID Motorcycle Fatal Crashes FARS HPMS State MC Registrations Motorcycle Registrations Analysis Period: 2011 - 2015 where, = fatalities per 100,000 registerted motorcycles = a vector of independent variables (e.g., human, driving history, crash types, temporal and spatial characteristics) = a vector of estimable parameters, = number of observation in the model ε = normally and independently distributed error term with zero mean and constant variance 2 . = ∗ ∗ > 0 = ∗ ≤ 0 , = *100,000 Empirical Results Human • Alcohol (0.08) • Occupants • Speeding • Moving violation (1 or no) • Speeding violation (no) • Suspended license (no) • Previous crash history (1) Spatial • US Route • Local Municipal route • Rural roads • Urban local roads • Road alignment (curved to left) Temporal • TOD (4 – 7 PM) • MOY (Jun – Aug) Crash Type • Single-vehicle • Run-off-road • Angle Meaning of variables Coefficient t-stat P-Value Constant 0.425 15.121 0.0000 Temporal characteristics Time of day (1 if time between 4 PM to 7 PM, 0 otherwise) 0.043 3.16 0.0016 Month of year (1 if June, 0 otherwise) 0.059 3.123 0.0018 Month of year (1 if July, 0 otherwise) 0.046 2.464 0.0137 Month of year (1 if August, 0 otherwise) 0.070 3.806 0.0001 Spatial characteristics Traffic route type (1 if US route sign, 0 otherwise) 0.126 6.956 0.0000 Traffic route type (1 if Local municipal route sign, 0 otherwise) 0.068 3.943 0.0001 Crash location (1 if rural roads, 0 otherwise) 0.140 10.257 0.0000 Funtional class of roadway (1 if local urban road, 0 otherwise) 0.136 5.897 0.0000 Roadway alignment (1 if roadway curves to the left prior to critical crash, 0 otherwise) -0.043 -2.411 0.0159 Crash types Vehicle involved in crashes (1 if single vehicle, 0 otherwise) 0.097 4.687 0.0000 Crash type (1 if manner of collision is angle, 0 otherwise) 0.073 4.46 0.0000 Final position of vehicle (1 if outside travel lane, 0 otherwise) 0.047 2.288 0.0222 Driving history Previous crash history (1 if 1 crash occurred last 3 year, 0 otherwise) 0.123 -6.134 0.0000 License suspension (1 if driver's license was not suspended, 0 otherwise) 0.066 3.953 0.0001 Moving violation (1 if one violation in last 5 year, 0 otherwise) -0.158 -5.71 0.0000 Moving violation (1 if no violation in last 5 year, 0 otherwise) -0.118 -4.857 0.0000 Speeding violation (1 if no speeding violation in last 5 year, 0 otherwise) -0.060 -3.983 0.0001 Behavioral characteristics Alcohol content (if BAC is upto 80, 0 otherwise) 0.035 2.339 0.0193 Contributing factor to fatal crash (1 if speeding, 0 otherwise) 0.041 2.367 0.0179 Presence of passenger (1 if more than driver, 0 otherwise) 0.144 9.359 0.0000 Sigma 0.920 27.852 0.0000 Number of observations 22,929 Log likelihood at zero, LL(0) -30,414 Log likelihood at convergence, LL(β) -30,170 Chi-square, χ2 = - 2*[LL(0) – LL(β)] 488 The p-value is considered up to 0.02indicating at 98% confidence that coefficient estimates are significantly different from zero. N = 12,526 N = 9,295 Human • Alcohol (0.08) • Speeding • Helmet (no) Spatial • Local Municipal route • Rural roads • Road alignment (curved to left) • Segments Temporal • TOD (1 – 3 PM) • MOY (Aug) Crash Type • Run-off-road Human • Occupants • Speeding (No) • DWI (no) • Age (55+) Spatial • Urban roads • 3-leg INTX • 4-leg INTX Temporal • TOD (4 – 7 PM) Crash Type • Angle • Front to rear impact Table 1: Empirical Model Results for Motorcycle Fatality Rates Figure 1: Dataset Processing for Model Figure 2: Modeling Framework Figure 5: Model Results for Multi-vehicle Motorcycle Fatality Rate Figure 4: Model Results for Single-vehicle Motorcycle Fatality Rate Figure 4: Model Results for Motorcycle Fatality Rate (Full Model) The national data analysis clearly shows the spatial, temporal, crash type, driving history, and drivers’ behavioral aspect highly affect Motorcycle fatality rates. The risk factors associated with motorcycle fatality rates vary by nature of single- and multi-vehicle crashes. A well-defined Motorcycle Strategic Safety Plan is critical considering ‘Towards Zero Deaths’ in the near future. Contact: [email protected] / 813-974-7146 Conclusions Crash Data: FARS, Motorcycle Registration Data: HPMS
Transcript of Identifying the Contributing Factors of Motorcycle ...
Identifying the Contributing Factors of Motorcycle Fatality Rates in the USA – An Exploratory National Data Analysis
Mouyid Islam, PhD, Center for Urban Transportation Research, University of South Florida
Introduction
Problem Statement
Motorcycle safety is a growing concern in the overall
transportation safety and many states include motorcycle
safety in the Emphasis Areas in the Strategic Highway Safety
Plan (SHSP).
Motorcycle fatality rate being fatalities per 100,000
registered motorcycles is considered one of the important
indicators of this emphasis area.
Objective
Empirical Results
The national data indicates that motorcycle fatalities per
100,000 registered motorcycles is six times higher than
those of passenger cars per 100,000 registered cars over the
years with alarming increase.
Motorcycles made up 3 percent of all registered vehicles in
the United States in 2015 and accounted for only 0.6 percent
of all vehicle miles traveled.
Single- and multi-vehicle crash characteristics are different
particularly for motorcycles.
Methodology
Future Directions
Fatalities per 100M motorcycle VMT
Rural vs Urban (bivariate)
Age group (multivariate)
This main objective of this study is to identify the
contributing factors related to motorcycle crashes with an
emphasis for single- and multi-vehicle crash rates.
Modeling steps initiates with continuous censored
regression. Then, single- and multi-vehicles crashes involving
motorcycles were modeled with bivariate framework..
.
Data
Mo
torc
ycle
Fat
alit
y R
ate
Single-Vehicle Motorcycle Fatality Rate
Multi-Vehicle Motorcycle Fatality Rate
if
𝒀𝒊∗ = 𝜷𝑿𝒊 + ε𝒊, i = 1,2, ….N
Crash VehicleCrash ID
Motorcycle Fatal Crashes
FARS HPMS
State MC Registrations
Motorcycle Registrations
Analysis Period: 2011 - 2015
where,
𝒀𝒊 = fatalities per 100,000 registerted motorcycles
𝑿𝒊 = a vector of independent variables (e.g., human, driving history,
crash types, temporal and spatial characteristics)
𝜷𝒊 = a vector of estimable parameters,
𝑵 = number of observation in the model
ε𝒊 = normally and independently distributed error term with zero mean
and constant variance 𝜎2.
𝒀𝒊 = 𝒀𝒊∗ 𝒊𝒇 𝒀𝒊
∗ > 0 𝒀𝒊 = 𝟎 𝒊𝒇 𝒀𝒊∗ ≤ 0
𝑭𝒂𝒕𝒂𝒍𝒊𝒕𝒊𝒆𝒔 𝒑𝒆𝒓 𝟏𝟎𝟎, 𝟎𝟎𝟎 𝒓𝒆𝒈𝒊𝒔𝒕𝒆𝒓𝒆𝒅𝒎𝒐𝒕𝒐𝒓𝒄𝒚𝒄𝒍𝒆𝒔 =𝑭𝒂𝒕𝒂𝒍𝒊𝒕𝒊𝒆𝒔
𝑹𝒆𝒈𝒊𝒔𝒕𝒆𝒓𝒆𝒅𝑴𝒐𝒕𝒐𝒓𝒄𝒚𝒄𝒍𝒆𝒔*100,000
Empirical Results
Human
• Alcohol (0.08)
• Occupants
• Speeding
• Moving violation (1 or no)
• Speeding violation (no)
• Suspended license (no)
• Previous crash history (1)
Spatial
• US Route
• Local Municipal route
• Rural roads
• Urban local roads
• Road alignment (curved to left)
Temporal
• TOD (4 – 7 PM)
• MOY (Jun –Aug)
Crash Type
• Single-vehicle
• Run-off-road
• Angle
Meaning of variables Coefficient t-stat P-Value
Constant 0.425 15.121 0.0000
Temporal characteristics
Time of day (1 if time between 4 PM to 7 PM, 0 otherwise) 0.043 3.16 0.0016
Month of year (1 if June, 0 otherwise) 0.059 3.123 0.0018
Month of year (1 if July, 0 otherwise) 0.046 2.464 0.0137
Month of year (1 if August, 0 otherwise) 0.070 3.806 0.0001
Spatial characteristics
Traffic route type (1 if US route sign, 0 otherwise) 0.126 6.956 0.0000
Traffic route type (1 if Local municipal route sign, 0 otherwise) 0.068 3.943 0.0001
Crash location (1 if rural roads, 0 otherwise) 0.140 10.257 0.0000
Funtional class of roadway (1 if local urban road, 0 otherwise) 0.136 5.897 0.0000
Roadway alignment (1 if roadway curves to the left prior to critical crash, 0
otherwise) -0.043 -2.411 0.0159
Crash types
Vehicle involved in crashes (1 if single vehicle, 0 otherwise) 0.097 4.687 0.0000
Crash type (1 if manner of collision is angle, 0 otherwise) 0.073 4.46 0.0000
Final position of vehicle (1 if outside travel lane, 0 otherwise) 0.047 2.288 0.0222
Driving history
Previous crash history (1 if 1 crash occurred last 3 year, 0 otherwise) 0.123 -6.134 0.0000
License suspension (1 if driver's license was not suspended, 0 otherwise) 0.066 3.953 0.0001
Moving violation (1 if one violation in last 5 year, 0 otherwise) -0.158 -5.71 0.0000
Moving violation (1 if no violation in last 5 year, 0 otherwise) -0.118 -4.857 0.0000
Speeding violation (1 if no speeding violation in last 5 year, 0 otherwise) -0.060 -3.983 0.0001
Behavioral characteristics
Alcohol content (if BAC is upto 80, 0 otherwise) 0.035 2.339 0.0193
Contributing factor to fatal crash (1 if speeding, 0 otherwise) 0.041 2.367 0.0179
Presence of passenger (1 if more than driver, 0 otherwise) 0.144 9.359 0.0000
Sigma 0.920 27.852 0.0000
Number of observations 22,929
Log likelihood at zero, LL(0) -30,414
Log likelihood at convergence, LL(β) -30,170
Chi-square, χ2 = - 2*[LL(0) – LL(β)] 488
The p-value is considered up to 0.02indicating at 98% confidence that coefficient estimates are significantly different from zero.
N = 12,526
N = 9,295
Human
• Alcohol (0.08)
• Speeding
• Helmet (no)
Spatial
• Local Municipal route
• Rural roads
• Road alignment (curved to left)
• Segments
Temporal
• TOD (1 – 3 PM)
• MOY (Aug)
Crash Type
• Run-off-road
Human
• Occupants
• Speeding (No)
• DWI (no)
• Age (55+)
Spatial
• Urban roads
• 3-leg INTX
• 4-leg INTX
Temporal
• TOD (4 – 7 PM)
Crash Type
• Angle
• Front to rear impact
Table 1: Empirical Model Results for Motorcycle Fatality Rates
Figure 1: Dataset Processing for Model
Figure 2: Modeling Framework
Figure 5: Model Results for Multi-vehicle Motorcycle Fatality Rate
Figure 4: Model Results for Single-vehicle Motorcycle Fatality Rate
Figure 4: Model Results for Motorcycle Fatality Rate (Full Model)
The national data analysis clearly shows the spatial, temporal, crash
type, driving history, and drivers’ behavioral aspect highly affect
Motorcycle fatality rates.
The risk factors associated with motorcycle fatality rates vary by nature
of single- and multi-vehicle crashes.
A well-defined Motorcycle Strategic Safety Plan is critical considering
‘Towards Zero Deaths’ in the near future.
Contact: [email protected] / 813-974-7146
Conclusions
Crash Data: FARS, Motorcycle Registration Data: HPMS