Sobha Ltd (SOBDEV) | 448static-news.moneycontrol.com/static-mcnews/2018/11/Sobha_221118.pdfSobha’s...
13
November 15, 2018 ICICI Securities Ltd | Retail Equity Research Result Update Sales volume momentum remains strong… Sobha's topline grew 1.9% YoY to | 658.7 crore (our estimate: | 681.4 crore) led by 78.0% YoY growth in revenues from contractual division to | 273.2 crore (our estimate: | 181.7 crore) The EBITDA margin expanded 198 bps YoY to 21.3%, in line with our estimate of 21.5% despite higher revenue share from the low-margin construction business PAT grew robustly by 22.1% YoY to | 61.4 crore (our estimate: | 63.1 crore) led by strong EBITDA margin expansion) Sales volumes grow robustly at 19.7% YoY to 1.03 msf in Q2FY19… Sobha’s sales volumes grew robustly by 19.7% YoY (up 7.4% QoQ) to 1.03 million square feet (msf). The Bangalore market continued to perform strongly with 14.5% QoQ rise in sales volumes to 702072 sq ft in Q2FY19 due to higher demand in the <| 50 lakh and | 1-2 crore category of flats. Also, the NCR market performed strongly with sales volumes of 132875 sq ft in Q2FY19 (vs. 102190 sq ft in Q1FY19). Kerala region was impacted due to floods in Q2FY19 leading to a dip in sales in the “| 2-3 crore” category flats. The management expects its impact on sales to continue in Q3FY19E. The company launched Sobha Lake Garden in Bangalore with total saleable area of 0.89 msf in Q2FY19. Overall, Sobha achieved sales worth | 616.6 crore (4.0% YoY growth) at an average realisation of | 5977/ sq ft in Q2FY19. Planning to launch projects on 8.6 msf area by H1FY20E end… The company launched Sobha Isle in Kochi in Q3FY19E. Sobha further plans to launch one affordable housing project in Bangalore and 1.8 msf project in GIFT City Gujarat. Overall, the company plans to launch 8.6 msf projects over the next three to four quarters across key markets including Bengaluru, Thrissur and Pune. With the demand scenario expected to improve with well-planned launches, we maintain our sales volumes estimates of 4.0 & 4.1 msf in FY19E & FY20E, respectively. On the commercial front, the company recently invested ~| 100 crore in the Kochi market to develop it into the commercial space and is also looking to develop ~0.5 msf in Delhi. Contractual division grows strongly in Q2FY19… Sobha’s contractual revenues grew at a stellar 64.5% YoY to | 299.5 crore in Q2FY19. The company’s contractual orderbook is at ~| 2267 crore, showing strong revenue visibility over the next few years. It is currently executing orders for 8.6 msf area across eight cities in India for various clients. The management indicated that the Infosys order will keep execution strong in H2FY19E. Also, with a ramp up in execution expected on other contractual orders, it has guided for | 1200 crore (gross revenues) revenue in FY19E. Overall, we build in net contractual revenue growth at 14.6% CAGR to | 1032.2 crore in FY18-20E. No substantial debt reduction expected in near term; maintain HOLD… Sobha’s sales volumes improved as it posted volume growth of 20.8% YoY to 3.6 msf in FY18. Furthermore, with the demand scenario improving and a strong line-up of new launches ahead, the company expects sales momentum to improve further. However, we do not foresee any meaningful debt reduction in near future. Also, Sobha’s plans to enter new geographies like Ahmedabad, Trivandrum and Hyderabad needs to be watched closely. Hence, we maintain our HOLD recommendation on the stock with a revised SOTP based target price of | 490/share. Rating matrix Rating : Hold Target : | 490 Target Period : 12 months Potential Upside : 9% What’s Changed? Target Changed from | 570 to | 490 EPS FY19E Changed from | 26.1 to | 24.5 EPS FY20E Changed from | 30.5 to | 33.0 Rating Unchanged Quarterly Performance Q2FY19 Q2FY18 YoY (%) Q1FY19 QoQ (%) Revenue 658.7 646.6 1.9 597.7 10.2 EBITDA 140.2 124.8 12.3 130.6 7.4 EBITDA (%) 21.3 19.3 198 bps 21.9 -57 bps PAT 61.4 50.3 22.1 52.6 16.7 Key Financials (| Crore) FY17 FY18 FY19E FY20E Net Sales 2,229.0 2,783.0 2,645.0 3,309.0 EBITDA 419.8 519.7 554.6 717.9 Net Profit 160.8 216.8 232.4 313.2 EPS (|) 16.7 22.9 24.5 33.0 Valuation summary (x) FY17 FY18 FY19E FY20E P/E 26.8 19.9 18.6 13.8 Target P/E 29.4 21.8 20.3 15.1 EV / EBITDA 15.4 12.7 12.3 9.4 P/BV 1.6 1.5 1.5 1.4 RoNW (%) 6.1 7.8 8.0 10.1 RoCE (%) 7.7 9.7 9.7 12.1 Stock data Particular Amount (| crore) Market Capitalization 4,393.3 Total Debt 2,308.7 Cash and Investments 119.4 EV 6,582.6 52 week H/L (|) 687 / 345 Equity capital 94.8 Face value (|) 10.0 Price performance (%) Return % 1M 3M 6M 12M Sunteck Realty (5.7) (26.5) (22.7) (9.8) Oberoi Realty 6.2 (15.4) (22.4) (13.9) Sobha Ltd 7.3 (15.4) (14.5) (11.4) Mahindra Lifespace (1.5) (17.1) (20.8) (5.1) BSE Realty 7.1 (17.4) (25.5) (24.4) Research Analyst Deepak Purswani, CFA deepak,[email protected] Harsh Pathak [email protected] Sobha Ltd (SOBDEV) | 448
Transcript of Sobha Ltd (SOBDEV) | 448static-news.moneycontrol.com/static-mcnews/2018/11/Sobha_221118.pdfSobha’s...

November 15, 2018
ICICI Securities Ltd | Retail Equity Research
Result Update
Sales volume momentum remains strong…
Sobha's topline grew 1.9% YoY to | 658.7 crore (our estimate:
| 681.4 crore) led by 78.0% YoY growth in revenues from contractual
division to | 273.2 crore (our estimate: | 181.7 crore)
The EBITDA margin expanded 198 bps YoY to 21.3%, in line with our
estimate of 21.5% despite higher revenue share from the low-margin
construction business
PAT grew robustly by 22.1% YoY to | 61.4 crore (our estimate:
| 63.1 crore) led by strong EBITDA margin expansion)
Sales volumes grow robustly at 19.7% YoY to 1.03 msf in Q2FY19…
Sobha’s sales volumes grew robustly by 19.7% YoY (up 7.4% QoQ) to
1.03 million square feet (msf). The Bangalore market continued to
perform strongly with 14.5% QoQ rise in sales volumes to 702072 sq ft in
Q2FY19 due to higher demand in the <| 50 lakh and | 1-2 crore category
of flats. Also, the NCR market performed strongly with sales volumes of
132875 sq ft in Q2FY19 (vs. 102190 sq ft in Q1FY19). Kerala region was
impacted due to floods in Q2FY19 leading to a dip in sales in the “| 2-3
crore” category flats. The management expects its impact on sales to
continue in Q3FY19E. The company launched Sobha Lake Garden in
Bangalore with total saleable area of 0.89 msf in Q2FY19. Overall, Sobha
achieved sales worth | 616.6 crore (4.0% YoY growth) at an average
realisation of | 5977/ sq ft in Q2FY19.
Planning to launch projects on 8.6 msf area by H1FY20E end…
The company launched Sobha Isle in Kochi in Q3FY19E. Sobha further
plans to launch one affordable housing project in Bangalore and 1.8 msf
project in GIFT City Gujarat. Overall, the company plans to launch 8.6 msf
projects over the next three to four quarters across key markets including
Bengaluru, Thrissur and Pune. With the demand scenario expected to
improve with well-planned launches, we maintain our sales volumes
estimates of 4.0 & 4.1 msf in FY19E & FY20E, respectively. On the
commercial front, the company recently invested ~| 100 crore in the
Kochi market to develop it into the commercial space and is also looking
to develop ~0.5 msf in Delhi.
Contractual division grows strongly in Q2FY19…
Sobha’s contractual revenues grew at a stellar 64.5% YoY to | 299.5 crore
in Q2FY19. The company’s contractual orderbook is at ~| 2267 crore,
showing strong revenue visibility over the next few years. It is currently
executing orders for 8.6 msf area across eight cities in India for various
clients. The management indicated that the Infosys order will keep
execution strong in H2FY19E. Also, with a ramp up in execution expected
on other contractual orders, it has guided for | 1200 crore (gross
revenues) revenue in FY19E. Overall, we build in net contractual revenue
growth at 14.6% CAGR to | 1032.2 crore in FY18-20E.
No substantial debt reduction expected in near term; maintain HOLD…
Sobha’s sales volumes improved as it posted volume growth of 20.8%
YoY to 3.6 msf in FY18. Furthermore, with the demand scenario
improving and a strong line-up of new launches ahead, the company
expects sales momentum to improve further. However, we do not foresee
any meaningful debt reduction in near future. Also, Sobha’s plans to enter
new geographies like Ahmedabad, Trivandrum and Hyderabad needs to
be watched closely. Hence, we maintain our HOLD recommendation on
the stock with a revised SOTP based target price of | 490/share.
Rating matrix
Rating : Hold
Target : | 490
Target Period : 12 months
Potential Upside : 9%
What’s Changed?
Target Changed from | 570 to | 490
EPS FY19E Changed from | 26.1 to | 24.5
EPS FY20E Changed from | 30.5 to | 33.0
Rating Unchanged
Quarterly Performance
Q2FY19 Q2FY18 YoY (%) Q1FY19 QoQ (%)
Revenue 658.7 646.6 1.9 597.7 10.2
EBITDA 140.2 124.8 12.3 130.6 7.4
EBITDA (%) 21.3 19.3 198 bps 21.9 -57 bps
PAT 61.4 50.3 22.1 52.6 16.7
Key Financials
(| Crore) FY17 FY18 FY19E FY20E
Net Sales 2,229.0 2,783.0 2,645.0 3,309.0
EBITDA 419.8 519.7 554.6 717.9
Net Profit 160.8 216.8 232.4 313.2
EPS (|) 16.7 22.9 24.5 33.0
Valuation summary
(x) FY17 FY18 FY19E FY20E
P/E 26.8 19.9 18.6 13.8
Target P/E 29.4 21.8 20.3 15.1
EV / EBITDA 15.4 12.7 12.3 9.4
P/BV 1.6 1.5 1.5 1.4
RoNW (%) 6.1 7.8 8.0 10.1
RoCE (%) 7.7 9.7 9.7 12.1
Stock data
Particular Amount (| crore)
Market Capitalization 4,393.3
Total Debt 2,308.7
Cash and Investments 119.4
EV 6,582.6
52 week H/L (|) 687 / 345
Equity capital 94.8
Face value (|) 10.0
Price performance (%)
Return % 1M 3M 6M 12M
Sunteck Realty (5.7) (26.5) (22.7) (9.8)
Oberoi Realty 6.2 (15.4) (22.4) (13.9)
Sobha Ltd 7.3 (15.4) (14.5) (11.4)
Mahindra Lifespace (1.5) (17.1) (20.8) (5.1)
BSE Realty 7.1 (17.4) (25.5) (24.4)
Research Analyst
Deepak Purswani, CFA
deepak,[email protected]
Harsh Pathak
Sobha Ltd (SOBDEV) | 448

ICICI Securities Ltd | Retail Equity Research Page 2
Variance analysis
| crore Q2FY19 Q2FY19E Q2FY18 YoY (Chg %) Q1FY19 QoQ (Chg %) Comments
Income from Operation 658.7 681.4 646.6 1.9 597.7 10.2 Topline growth on account of strong growth in contractual division
Other Income 17.5 12.4 11.2 56.3 12.4 41.1
Material & construction cost 477.9 497.0 362.0 32.0 436.0 9.6
Employee cost 59.8 61.3 49.5 20.8 51.7 15.7
Other expenditure 131.7 113.8 85.4 54.2 99.8 32.0
EBITDA 140.2 146.7 124.8 12.3 130.6 7.4
EBITDA Margin (%) 21.3 21.5 19.3 198 bps 21.9 -57 bps
Depreciation 15.4 14.9 13.7 12.4 14.9 3.4
Interest 53.2 54.1 51.3 3.7 54.1 -1.7
PBT 89.1 90.1 71.0 25.5 74.0 20.4
Taxes 27.7 27.0 20.7 33.8 21.4 29.4
PAT 61.4 63.1 50.3 22.1 52.6 16.7 PAT growth was led by strong margin expansion
Key Metrics
Sales Volume (msf) 1.03 0.97 0.82 26.5 0.96 7.4 Sobha reported strong sequential volume growth of 7.4% indicating a
gradual revival in demand environment
Realisation (|) 5,977 6,300 6,902 -13.4 6,372 -6.2
Source: Company, ICICI Direct Research
Change in estimates
FY19E FY20E Comments
(| Crore) Old Old New % Change Old New % Change
Revenue 2,229.0 2,783.0 3,136.4 2,645.0 -15.7 3,465.2 3,309.0 -4.5 We tweak our estimates
EBITDA 419.8 519.7 592.1 554.6 -6.3 679.8 717.9 5.6
EBITDA Margin (%) 18.8 18.7 18.9 21.0 209 bps 19.6 21.7 208 bps We revise our EBITDA margin estimates for real estate division
factoring in management commentary
PAT 160.8 216.8 247.9 232.4 -6.2 289.5 313.2 8.2
EPS (|) 16.7 22.9 26.1 24.5 -6.2 30.5 33.0 8.2
FY17 FY18
[[
Source: Company, ICICI Direct Research
Assumptions [
Earlier Current Earlier
Volume sold in msf FY15 FY16 FY17 FY18 FY19E FY19E FY20E FY20E
Total 3.3 3.4 3.0 4.1 4.0 4.0 4.1 4.1 We maintain our estimates
Current
Source: Company, ICICI Direct Research

ICICI Securities Ltd | Retail Equity Research Page 3
Conference Call Highlights:
NBFC funding for Sobha: The management said that Sobha deals
with NBFCs like Aditya Birla Finance, Punjab National Housing
Finance, etc. However, the company’s debt exposure to these NBFCs
is only 14% of its total loan outstanding. These NBFCs, along with
many other, are in discussions to extend fresh credit lines to Sobha, if
required. Hence, we do not foresee any issues related to funding for
the company
New launches: In Q2FY19, Sobha launched Sobha Lake Garden in
Bangalore, with a total saleable area of 0.89 msf and also released
0.21 msf for sales from its existing project Sobha city in Gurgaon.
Furthermore, in H2FY19E, Sobha has already launched Sobha Isle in
Kochi. The company further plans to launch an affordable housing
project in north Bangalore for which all approvals have been received.
It has applied for RERA registration. It will also be launching 1.8 msf
area soon in the GIFT City (Gujarat). With this, Sobha plans to launch
8.6 msf residential space in the next few quarters
Debt update: The net debt has increased by | 102 crore to | 2365
crore with net debt to equity (D/E) of 0.80x in Q1FY19 (as per AS-11 &
18). The management expects 0.8x as an ideal D/E rate. As per the
newly adopted Ind-As 115, D/E is at 1.16x. The current cost of debt
has further come down to 9.30% in Q2FY19 vs. 9.31% in Q1FY19
amid an increase in repo rate by the RBI
Contract & manufacturing division: The orderbook is strong at | 2440
crore. This order book includes Lulu, Aziz Premji University, Biocon,
Manipal Group, ITC, etc. The company is currently working on ~8.6
msf area across eight different cities for various clients. Furthermore,
it is extremely bullish on the Infosys project and also expects to ramp-
up execution in H2FY19E. Thus, it has guided to clock | 1200 crore
revenues from contractual division in FY19E
Commercial segment update: Sobha would look for commercial
development mainly in Kochi and Delhi. On this front, it recently
invested ~| 100 crore in Kochi market, which it plans develop into the
commercial space. The management is also working to develop ~0.5
msf commercial space in Delhi

ICICI Securities Ltd | Retail Equity Research Page 4
Company Analysis
Exhibit 1: Quarterly sales trend
Particulars Q3FY17 Q4FY17 Q1FY18 Q2FY18 Q3FY18 Q4FY18 Q1FY19 Q2FY19 YoY QoQ
Bengaluru
Sales Volume (Sq ft) 503,037 508,572 592,936 612,818 644,123 750,375 612,944 702,072 14.6% 14.5%
Average Realisation (|/sq ft) 5,985 7,320 7,100 7,174 6,183 6,958 6,819 6,887 -4.0% 1.0%
Sale Value (| crore) 301.1 372.3 421.0 439.6 398.2 522.1 418.0 483.5 10.0% 15.7%
Thrissur
Sales Volume (Sq ft) 13,289 3,312 13,191 19,919 20,036 6,425 27,400 17,247 -13.4% -37.1%
Average Realisation (|/sq ft) 8,749 9,519 9,233 9,329 7,997 9,049 8,868 8,956 -4.0% 1.0%
Sale Value (| crore) 11.6 3.2 12.2 18.6 16.0 5.8 24.3 15.4 -16.9% -36.4%
Coimbatore
Sales Volume (Sq ft) 5,059 8,355 15,913 13,234 14,997 25,127 31,004 46,807 253.7% 51.0%
Average Realisation (|/sq ft) 4,235 4,122 3,998 4,040 4,392 3,918 3,840 3,878 -4.0% 1.0%
Sale Value (| crore) 2.1 3.4 6.4 5.3 6.6 9.8 11.9 18.2 239.6% 52.5%
Pune
Sales Volume (Sq ft) 12,603 7,883 (8,941) 6,239 - 5,727 1,104 4,825 -22.7% 337.0%
Average Realisation (|/sq ft) 7,396 10,474 10,160 10,265 7,313 9,957 9,757 9,855 -4.0% 1.0%
Sale Value (| crore) 9.3 8.3 -9.1 6.4 0.0 5.7 1.1 4.8 -25.7% 341.4%
Mysore
Sales Volume (Sq ft) 13,524 15,389 14,592 18,812 22,882 10,944 49,371 61,881 228.9% 25.3%
Average Realisation (|/sq ft) 1,986 1,965 1,906 1,926 2,066 1,868 1,831 1,849 -4.0% 1.0%
Sale Value (| crore) 2.7 3.0 2.8 3.6 4.7 2.0 9.0 11.4 215.8% 26.6%
NCR
Sales Volume (Sq ft) 23,104 97,867 123,874 78,721 82,529 75,733 102,190 132,875 68.8% 30.0%
Average Realisation (|/sq ft) 6,562 7,180 6,965 7,036 6,455 6,825 6,689 6,756 -4.0% 1.0%
Sale Value (| crore) 15.2 70.3 86.3 55.4 53.3 51.7 68.4 89.8 62.1% 31.3%
Chennai
Sales Volume (Sq ft) 33,470 55,651 27,485 27,837 26,804 20,100 48,253 43,731 57.1% -9.4%
Average Realisation (|/sq ft) 7,855 5,169 5,014 5,066 5,714 4,914 4,815 4,864 -4.0% 1.0%
Sale Value (| crore) 26.3 28.8 13.8 14.1 15.3 9.9 23.2 21.3 50.8% -8.5%
Calicut
Sales Volume (Sq ft) 2,224 18,036 7,750 20,429 12,290 4,871 12,192 9,438 -53.8% -22.6%
Average Realisation (|/sq ft) 6,273 6,122 5,938 6,000 6,044 5,820 5,703 5,760 -4.0% 1.0%
Sale Value (| crore) 1.4 11.0 4.6 12.3 7.4 2.8 7.0 5.4 -55.6% -21.8%
Cochin
Sales Volume (Sq ft) 7,342 8,200 28,430 63,075 109,704 116,409 75,627 12,726 -79.8% -83.2%
Average Realisation (|/sq ft) 1,986 5,623 5,454 5,511 5,054 5,345 5,238 5,291 -4.0% 1.0%
Sale Value (| crore) 1.5 4.6 15.5 34.8 55.4 62.2 39.6 6.7 -80.6% -83.0%
Total
Sales Volume (Sq ft) 613,652 723,265 815,230 861,084 933,365 1,015,711 960,085 1,031,602 19.8% 7.4%
Average Realisation (|/sq ft) 6,082 6,979 6,770 6,840 6,092 6,635 6,502 6,567 -4.0% 1.0%
Sale Value (| crore) 371.1 504.8 562.7 592.7 610.5 655.8 611.8 616.6 4.0% 0.8%
Source: Company, ICICI Direct Research

ICICI Securities Ltd | Retail Equity Research Page 5
Exhibit 2: Quarterly net debt equity trend
2283.2
2327.6
2199.2
2263
2365
0.840.86
0.79 0.80
0.83
0.7
0.8
0.9
1.0
1.1
1.2
1.3
1000.0
1500.0
2000.0
2500.0
Q2FY18
Q3FY18
Q4FY18
Q1FY19
Q2FY19
(x)
(| crore)
Source: Company, ICICI Direct Research
Exhibit 3: Yearly net debt to equity trend
2,0
61.7
2,0
75.1
2,1
89.3
2,4
54.1
2,3
25.1
0.84
0.75
0.80
0.78
0.79
500.0
1,000.0
1,500.0
2,000.0
2,500.0
FY16 FY17 FY18 FY19E FY20E
(| c
rore)
0.50
0.60
0.70
0.80
0.90
(x)
Net debt Net debt to equity
Source: Company, ICICI Direct Research
Exhibit 4: We build in moderate sales volumes, going ahead
3.4
3.0
3.6
4.04.1
2.5
3.0
3.5
4.0
4.5
FY16 FY17 FY18 FY19E FY20E
(m
n s
q f
eet)
Source: Company, ICICI Direct Research

ICICI Securities Ltd | Retail Equity Research Page 6
Exhibit 5: Revenues trend…
1,876.0
2,243.7
2,787.1
2,645.0
3,309.0
1,500.0
2,000.0
2,500.0
3,000.0
3,500.0
FY16 FY17 FY18 FY19E FY20E
(| c
rore)
Source: Company, ICICI Direct Research
Exhibit 6: Real estate revenue trend…
1,255.5
1,485.9
2,000.7
1,706.6
2,276.7
1,000.0
1,500.0
2,000.0
2,500.0
3,000.0
FY16 FY17 FY18 FY19E FY20E
(|
crore)
Source: Company, ICICI Direct Research
Exhibit 7: Construction revenues trend…
620.5
757.8786.4
938.4
1,032.2
300.0
450.0
600.0
750.0
900.0
1,050.0
1,200.0
FY16 FY17 FY18 FY19E FY20E
(|
crore)
Source: Company, ICICI Direct Research
Exhibit 8: EBITDA margin trend
443.0 419.8 519.7 554.6 717.9
22.8
18.8 18.7
21.0
21.7
200.0
400.0
600.0
800.0
FY16 FY17 FY18 FY19E FY20E
(|
crore)
15.0
20.0
25.0
(%
)
EBITDA EBITDA Margin
Source: Company, ICICI Direct Research

ICICI Securities Ltd | Retail Equity Research Page 7
Exhibit 9: PAT trend
138.1
160.8
216.8
232.4
313.2
50.0
100.0
150.0
200.0
250.0
300.0
350.0
FY16 FY17 FY18 FY19E FY20E
(|
crore)
3.0
6.0
9.0
12.0
(%
)
PAT PAT Margin
Source: Company, ICICI Direct Research
Exhibit 10: Return ratio to bounce back
5.46.1
8.0
10.18.47.7
9.7 9.7
12.1
7.8
-
5.0
10.0
15.0
FY16 FY17 FY18 FY19E FY20E
(%
)
RoE RoCE
Source: Company, ICICI Direct Research
ICICI Securities Ltd | Retail Equity Research Page 8
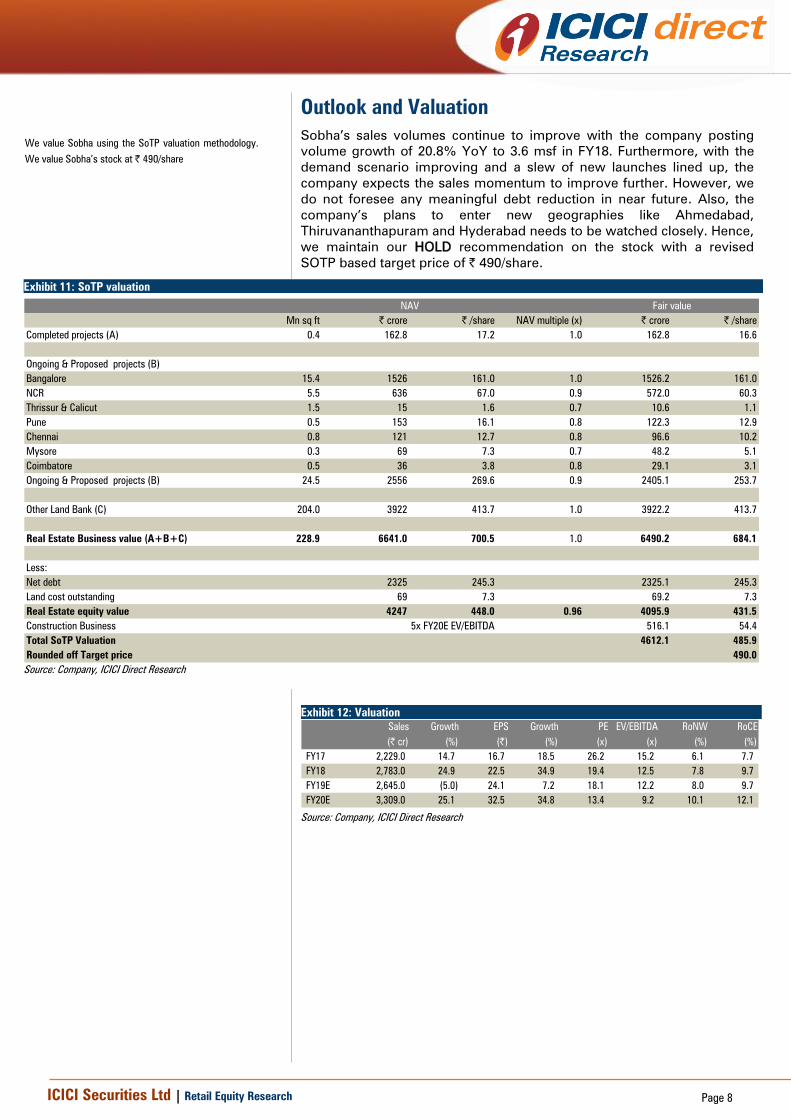
Outlook and Valuation
Sobha’s sales volumes continue to improve with the company posting
volume growth of 20.8% YoY to 3.6 msf in FY18. Furthermore, with the
demand scenario improving and a slew of new launches lined up, the
company expects the sales momentum to improve further. However, we
do not foresee any meaningful debt reduction in near future. Also, the
company’s plans to enter new geographies like Ahmedabad,
Thiruvananthapuram and Hyderabad needs to be watched closely. Hence,
we maintain our HOLD recommendation on the stock with a revised
SOTP based target price of | 490/share.
Exhibit 11: SoTP valuation
Mn sq ft | crore | /share NAV multiple (x) | crore | /share
Completed projects (A) 0.4 162.8 17.2 1.0 162.8 16.6
Ongoing & Proposed projects (B)
Bangalore 15.4 1526 161.0 1.0 1526.2 161.0
NCR 5.5 636 67.0 0.9 572.0 60.3
Thrissur & Calicut 1.5 15 1.6 0.7 10.6 1.1
Pune 0.5 153 16.1 0.8 122.3 12.9
Chennai 0.8 121 12.7 0.8 96.6 10.2
Mysore 0.3 69 7.3 0.7 48.2 5.1
Coimbatore 0.5 36 3.8 0.8 29.1 3.1
Ongoing & Proposed projects (B) 24.5 2556 269.6 0.9 2405.1 253.7
Other Land Bank (C) 204.0 3922 413.7 1.0 3922.2 413.7
Real Estate Business value (A+B+C) 228.9 6641.0 700.5 1.0 6490.2 684.1
Less:
Net debt 2325 245.3 2325.1 245.3
Land cost outstanding 69 7.3 69.2 7.3
Real Estate equity value 4247 448.0 0.96 4095.9 431.5
Construction Business 5x FY20E EV/EBITDA 516.1 54.4
Total SoTP Valuation 4612.1 485.9
Rounded off Target price 490.0
NAV Fair value
Source: Company, ICICI Direct Research
Exhibit 12: Valuation
Sales Growth EPS Growth PE EV/EBITDA RoNW RoCE
(| cr) (%) (|) (%) (x) (x) (%) (%)
FY17 2,229.0 14.7 16.7 18.5 26.2 15.2 6.1 7.7
FY18 2,783.0 24.9 22.5 34.9 19.4 12.5 7.8 9.7
FY19E 2,645.0 (5.0) 24.1 7.2 18.1 12.2 8.0 9.7
FY20E 3,309.0 25.1 32.5 34.8 13.4 9.2 10.1 12.1
Source: Company, ICICI Direct Research
We value Sobha using the SoTP valuation methodology.
We value Sobha’s stock at | 490/share

ICICI Securities Ltd | Retail Equity Research Page 9
Recommendation History vs. Consensus
0
150
300
450
600
750
Nov-18Aug-18May-18Feb-18Nov-17Aug-17Jun-17Mar-17Dec-16Sep-16Jun-16Mar-16Dec-15Sep-15
(|
)
0.0
20.0
40.0
60.0
80.0
100.0
(%
)
Price Idirect target Consensus Target Mean % Consensus with BUY
Source: Bloomberg, Company, ICICI Direct Research
Key events
Date Event
Q3FY14 Posts dismal sales volume clearly signifying lower offtake in high ticket size projects in Bengaluru and NCR
Jul-14 Launches $4 billion Sobha Hartland, a new mixed-use development near Burj Khalifa, Dubai. Construction has already started and the company plans to deliver a
large part of the initial phase by the end of 2016Aug-14 Sobha plans to invest | 250 crore in premium projects in the western suburb of Pune and developing over one million square feet of area, primarily in the residential
space
Apr-15 Launches first phase of new project Sobha Dream Series with total developable area of 10.7 msf with the realisation expected at | 5,500 per square feet, lower than
the usual | 6,000 square feet
Aug-15 Sobha launches ultra-luxurious residential tower in South Bangalore comprising of 137 - 3 BHK apartments and 4 BHK duplex apartments
Aug-15 Sobha adds another quill to its top by offering top of the line extravagance condo called Sobha Meritta situated at Keleambakkam in Chennai consisting of 556
homes having a super developed range of 1336 - 2179 sq ft and price ranging from | 23.57 lakh to | 1.03 crore
Jan-16 Sobha's sales volume de-grow 5.2% sequentially to 8.1 lakh sq. ft valued at | 478.3 crore, attributed to no new launches in the current quarter. The average price
realisation was at | 6371/ sq ft of which Sobha's share was | 5932/ sq ft
Mar-16 The company allots secured redeemable non convertible debentures aggregating to | 25 crore on private placement basis reaching total outstanding debentures
including the present allotment at | 225 crore
Apr-16 In Q4FY16, Sobha's sales volume grow 9.8% sequentially to 8.86 lakh sq ft valued at | 534.7 crore with average price realisation of | 6037/sq ft. For FY16, the
company achieved sales volume of 33.8 lakh sq ft (3.2% YoY growth) with average realisation of | 5946/sq ft
May-17 In Q4FY17, Sobha's sales volume grow 17.9% sequentially to 7.23 lakh sq ft valued at | 504.8 crore with average price realisation of | 6980/sq ft. For FY17, the
company achieved sales volume of 30 lakh sq ft (11.3% YoY de-growth)
Source: Company, ICICI Direct Research
Top 10 Shareholders Shareholding Pattern
Rank Name Latest Filing Date O/S Position (m) Change (m)
1 Menon (Sobha) 30-Jun-18 37.6% 35.6 0.0
2 Menon (P N C) 30-Jun-18 18.3% 17.4 0.0
3 Franklin Templeton Asset Management (India) Pvt. Ltd. 30-Sep-17 6.7% 6.4 3.0
4 Schroder Investment Management (Hong Kong) Ltd. 30-Jun-18 5.8% 5.5 4.0
5 Nordea Funds Oy 30-Jun-18 4.9% 4.7 0.0
6 L&T Investment Management Limited 30-Jun-18 3.5% 3.3 -0.2
7 Dimensional Fund Advisors, L.P. 31-Aug-18 2.0% 1.9 0.0
8 Norges Bank Investment Management (NBIM) 30-Jun-18 1.6% 1.6 0.4
9 The Vanguard Group, Inc. 31-Aug-18 1.5% 1.5 0.0
10 Fidelity International 30-Jun-18 1.4% 1.3 0.0[
(in %) Mar-18 Jun-18 Sep-18
Promoter 55.9 55.9 55.9
Public 44.1 44.1 44.1
Others 0.0 0.0 0.0
Total 100.0 100.0 100.0
Source: Reuters, ICICI Direct Research
Recent Activity
Investor name Value (m) Shares (m) Investor name Value (m) Shares (m)
Schroder Investment Management (Hong Kong) Ltd. 26.0 4.0 L&T Investment Management Limited -1.4 -0.2
Japan Trustee Services Bank Ltd. 6.3 1.0 Neuberger Berman, LLC -0.6 -0.1
Norges Bank Investment Management (NBIM) 2.7 0.4 Taurus Asset Management Co. Ltd. -0.3 0.0
SBI Funds Management Pvt. Ltd. 1.4 0.3 Aletti Gestielle SGR S.p.A. -0.2 0.0
Pzena Investment Management, LLC 1.5 0.2 J O Hambro Capital Management Limited -0.1 0.0
Buys Sells
Source: Reuters, ICICI Direct Research

ICICI Securities Ltd | Retail Equity Research Page 10
Financial summary
Profit and loss statement | Crore
(| Crore) FY17 FY18 FY19E FY20E
Net Sales 2,229.0 2,783.0 2,645.0 3,309.0
Growth (%) 14.7 24.9 (5.0) 25.1
Other income 38.6 49.5 54.5 57.2
Total revenue 2,267.6 2,832.5 2,699.4 3,366.1
Raw Material Expense 1,302.0 1,680.0 1,477.9 1,947.9
Land cost 713.0 46.6 793.5 976.1
Employee benefit expenses 177.9 198.5 208.4 218.8
Other Expenses 329.4 384.8 404.0 424.2
EBITDA 419.8 519.7 554.6 717.9
Growth (%) (5.2) 23.8 6.7 29.4
Interest 149.7 197.8 216.4 237.5
Depreciation 63.8 54.4 60.7 63.1
Other income 38.6 49.5 54.5 57.2
PBT 244.9 317.0 332.0 474.6
Taxes 97.0 100.2 99.6 161.3
Minoriy Interest (12.9) - - -
PAT after MI 160.8 216.8 232.4 313.2
PAT Growth rate 16.4 34.9 7.2 34.8
Adjusted EPS (Diluted) 16.7 22.5 24.1 32.5
Source: Company, ICICI Direct Research
Cash flow statement | Crore
(| Crore) FY17 FY18 FY19E FY20E
Profit after Tax 160.8 216.8 232.4 313.2
Depreciation 63.8 54.4 60.7 63.1
Interest 149.7 197.8 216.4 237.5
Others (50.4) (246.1) (154.0) (218.5)
Cash Flow before wc changes 420.9 323.1 455.0 556.6
Net Increase in Current Assets (740.5) (212.2) (197.8) (461.5)
Net Increase in Current Liabilities 673.5 242.6 (198.9) 514.8
Net CF from operating activities 353.9 353.4 58.2 609.8
(Purchase)/Sale of Fixed Assets (31.6) (59.7) (75.0) (185.0)
Net CF from Investing activities 1.9 (128.7) (20.6) (127.8)
Inc / (Dec) in Equity Capital (58.1) (62.0) - -
Dividend (23.2) (29.0) (85.7) (115.5)
Interest paid (260.2) (260.6) (216.4) (237.5)
Inc / (Dec) in Loans (4.1) 108.8 191.3 -
Net CF from Financing activities (345.6) (242.8) (110.8) (353.0)
Net Cash flow 10.2 (18.1) (73.1) 129.0
Opening Cash 113.5 124.1 119.0 45.9
Closing Cash/ Cash Equivalent 123.7 119.0 45.9 174.9
Source: Company, ICICI Direct Research
Balance sheet | Crore
(| Crore) FY17 FY18 FY19E FY20E
Liabilities
Equity Capital 96.3 94.8 94.8 94.8
Reserve and Surplus 2,548.2 2,675.1 2,821.8 3,019.5
Total Shareholders funds 2,644.5 2,769.9 2,916.6 3,114.4
Minority Interest - - - -
Total Debt 2,221.9 2,308.7 2,500.0 2,500.0
Deferred Tax Liability 228.3 252.1 252.1 252.1
Total Liabilities 5,095 5,331 5,669 5,866
Assets
Gross Block 610.1 613.8 638.8 663.8
Less Acc. Dep 94.9 138.0 198.7 261.7
Net Block 515.4 475.8 440.1 402.0
Goodwill on Consolidation - - - -
Capital WIP 79.9 134.5 184.5 344.5
Investments 0.0 112.5 112.5 112.5
Inventory 5,096.0 4,834.9 4,826.0 4,840.7
Sundry Debtors 226.7 327.2 326.1 408.0
Loans & Advances 2,828.4 3,020.5 3,228.4 3,593.4
Cash & Bank Balances 146.8 119.4 45.9 174.9
Total Current Assets 8,297.9 8,414.5 8,538.8 9,129.4
Creditors 3,784.1 3,663.5 3,478.3 3,988.9
Provisions 14.2 30.6 16.8 21.1
Net Current Assets 4,499.6 4,607.9 4,931.2 5,007.0
Total Assets 5,095 5,331 5,668 5,866
Source: Company, ICICI Direct Research
Key ratios
FY17 FY18 FY19E FY20E
Per Share Data (|)
EPS - Diluted 16.7 22.5 24.1 32.5
Cash EPS 23.3 28.6 30.9 39.7
Book Value 274.6 287.6 302.9 323.4
Dividend per share 5.3 8.4 9.0 12.2
Operating Ratios (%)
EBITDA / Net Sales 18.8 18.7 21.0 21.7
PAT / Net Sales 7.2 7.8 8.8 9.5
Inventory Days 834.5 634.1 666.0 534.0
Debtor Days 37.1 42.9 45.0 45.0
Return Ratios (%)
RoNW 6.1 7.8 8.0 10.1
RoCE 7.7 9.7 9.7 12.1
RoIC 7.3 9.2 9.1 12.2
Valuation Ratios (x)
EV / EBITDA 15.4 12.7 12.3 9.4
P/E (Diluted) 26.8 19.9 18.6 13.8
EV / Net Sales 2.9 2.4 2.6 2.0
Market Cap / Sales 2.0 1.6 1.7 1.3
Price to Book Value 1.6 1.5 1.5 1.4
Dividend yield 1.2 1.9 2.0 2.7
Solvency Ratios (x)
Net Debt / Equity 0.8 0.8 0.8 0.7
Debt / EBITDA 5.3 4.4 4.5 3.5
Current Ratio 2.1 2.2 2.4 2.2
Quick Ratio 0.8 0.9 1.0 1.0
Source: Company, ICICI Direct Research

ICICI Securities Ltd | Retail Equity Research Page 11
ICICI Direct Research coverage universe (Real Estate)
CMP M Cap
(|) TP(|) Rating (| Cr) FY18 FY19E FY20E FY18 FY19E FY20E FY18 FY19E FY20E FY18 FY19E FY20E FY18 FY19E FY20E
Oberoi Realty (OBEREA) 420 500 Buy 15,271 10.4 12.6 25.9 40.3 33.3 16.2 24.5 20.3 9.4 2.7 2.5 1.9 6.6 7.5 10.7
Mahindra Lifespace (GESCOR) 410 450 Hold 2,105 19.7 21.8 33.7 20.8 18.8 12.2 34.7 45.5 18.3 1.0 1.0 0.9 4.9 5.2 7.6
Sobha (SOBDEV) 448 490 Hold 4,393 22.5 24.1 32.5 19.9 18.6 13.8 12.7 12.3 9.4 1.5 1.5 1.4 7.8 8.0 10.1
Sunteck Realty (SUNRE) 319 525 Buy 3,828 14.8 15.2 18.1 31.9 31.1 26.1 21.3 18.8 16.3 3.7 2.5 2.3 11.6 8.1 8.9
Source: Company, ICICI Direct Research
P/B (x) RoE (%)
Sector / Company
EPS (|) P/E (x) EV/EBITDA (x)

ICICI Securities Ltd | Retail Equity Research Page 12
RATING RATIONALE
ICICI Direct Research endeavours to provide objective opinions and recommendations. ICICI Direct Research
assigns ratings to its stocks according to their notional target price vs. current market price and then
categorises them as Strong Buy, Buy, Hold and Sell. The performance horizon is two years unless specified and
the notional target price is defined as the analysts' valuation for a stock.
Strong Buy: >15%/20% for large caps/midcaps, respectively, with high conviction;
Buy: >10%/15% for large caps/midcaps, respectively;
Hold: Up to +/-10%;
Sell: -10% or more;
Pankaj Pandey Head – Research [email protected]
ICICI Direct Research,
ICICI Securities Limited,
1st Floor, Akruti Trade Centre,
Road No 7, MIDC,
Andheri (East)
Mumbai – 400 093

ICICI Securities Ltd | Retail Equity Research Page 13
ANALYST CERTIFICATION
We /I, Deepak Purswani, CFA MBA (Finance), Harsh Pathak, MBA (Finance); Research Analysts, authors and the names subscribed to this report, hereby certify that all of the views expressed in this
research report accurately reflect our views about the subject issuer(s) or securities. We also certify that no part of our compensation was, is, or will be directly or indirectly related to the specific
recommendation(s) or view(s) in this report.
Terms & conditions and other disclosures:
ICICI Securities Limited (ICICI Securities) is a full-service, integrated investment banking and is, inter alia, engaged in the business of stock brokering and distribution of financial products. ICICI Securities
Limited is a Sebi registered Research Analyst with Sebi Registration Number – INH000000990. ICICI Securities Limited Sebi Registration is INZ000183631 for stock broker. ICICI Securities is a wholly-owned
subsidiary of ICICI Bank which is India’s largest private sector bank and has its various subsidiaries engaged in businesses of housing finance, asset management, life insurance, general insurance, venture
capital fund management, etc. (“associates”), the details in respect of which are available on www.icicibank.com.
ICICI Securities is one of the leading merchant bankers/ underwriters of securities and participate in virtually all securities trading markets in India. We and our associates might have investment banking
and other business relationship with a significant percentage of companies covered by our Investment Research Department. ICICI Securities generally prohibits its analysts, persons reporting to analysts
and their relatives from maintaining a financial interest in the securities or derivatives of any companies that the analysts cover.
The information and opinions in this report have been prepared by ICICI Securities and are subject to change without any notice. The report and information contained herein is strictly confidential and
meant solely for the selected recipient and may not be altered in any way, transmitted to, copied or distributed, in part or in whole, to any other person or to the media or reproduced in any form, without
prior written consent of ICICI Securities. While we would endeavour to update the information herein on a reasonable basis, ICICI Securities is under no obligation to update or keep the information current.
Also, there may be regulatory, compliance or other reasons that may prevent ICICI Securities from doing so. Non-rated securities indicate that rating on a particular security has been suspended
temporarily and such suspension is in compliance with applicable regulations and/or ICICI Securities policies, in circumstances where ICICI Securities might be acting in an advisory capacity to this
company, or in certain other circumstances.
This report is based on information obtained from public sources and sources believed to be reliable, but no independent verification has been made nor is its accuracy or completeness guaranteed. This
report and information herein is solely for informational purpose and shall not be used or considered as an offer document or solicitation of offer to buy or sell or subscribe for securities or other financial
instruments. Though disseminated to all the customers simultaneously, not all customers may receive this report at the same time. ICICI Securities will not treat recipients as customers by virtue of their
receiving this report. Nothing in this report constitutes investment, legal, accounting and tax advice or a representation that any investment or strategy is suitable or appropriate to your specific
circumstances. The securities discussed and opinions expressed in this report may not be suitable for all investors, who must make their own investment decisions, based on their own investment
objectives, financial positions and needs of specific recipient. This may not be taken in substitution for the exercise of independent judgment by any recipient. The recipient should independently evaluate
the investment risks. The value and return on investment may vary because of changes in interest rates, foreign exchange rates or any other reason. ICICI Securities accepts no liabilities whatsoever for any
loss or damage of any kind arising out of the use of this report. Past performance is not necessarily a guide to future performance. Investors are advised to see Risk Disclosure Document to understand the
risks associated before investing in the securities markets. Actual results may differ materially from those set forth in projections. Forward-looking statements are not predictions and may be subject to
change without notice.
ICICI Securities or its associates might have managed or co-managed public offering of securities for the subject company or might have been mandated by the subject company for any other assignment
in the past twelve months.
ICICI Securities or its associates might have received any compensation from the companies mentioned in the report during the period preceding twelve months from the date of this report for services in
respect of managing or co-managing public offerings, corporate finance, investment banking or merchant banking, brokerage services or other advisory service in a merger or specific transaction.
ICICI Securities or its associates might have received any compensation for products or services other than investment banking or merchant banking or brokerage services from the companies mentioned
in the report in the past twelve months.
ICICI Securities encourages independence in research report preparation and strives to minimize conflict in preparation of research report. ICICI Securities or its associates or its analysts did not receive any
compensation or other benefits from the companies mentioned in the report or third party in connection with preparation of the research report. Accordingly, neither ICICI Securities nor Research Analysts
and their relatives have any material conflict of interest at the time of publication of this report.
It is confirmed that Deepak Purswani, CFA MBA (Finance), Harsh Pathak, MBA (Finance); Research Analysts of this report have not received any compensation from the companies mentioned in the report
in the preceding twelve months.
Compensation of our Research Analysts is not based on any specific merchant banking, investment banking or brokerage service transactions.
ICICI Securities or its subsidiaries collectively or Research Analysts or their relatives do not own 1% or more of the equity securities of the Company mentioned in the report as of the last day of the month
preceding the publication of the research report.
Since associates of ICICI Securities are engaged in various financial service businesses, they might have financial interests or beneficial ownership in various companies including the subject
company/companies mentioned in this report.
It is confirmed that Deepak Purswani, CFA MBA (Finance), Harsh Pathak, MBA (Finance); Research Analysts do not serve as an officer, director or employee of the companies mentioned in the report.
ICICI Securities may have issued other reports that are inconsistent with and reach different conclusion from the information presented in this report.
Neither the Research Analysts nor ICICI Securities have been engaged in market making activity for the companies mentioned in the report.
We submit that no material disciplinary action has been taken on ICICI Securities by any Regulatory Authority impacting Equity Research Analysis activities.
This report is not directed or intended for distribution to, or use by, any person or entity who is a citizen or resident of or located in any locality, state, country or other jurisdiction, where such distribution,
publication, availability or use would be contrary to law, regulation or which would subject ICICI Securities and affiliates to any registration or licensing requirement within such jurisdiction. The securities
described herein may or may not be eligible for sale in all jurisdictions or to certain category of investors. Persons in whose possession this document may come are required to inform themselves of and
to observe such restriction.