Initiating Coverage - Moneycontrol.comstatic-news.moneycontrol.com/static-mcnews/2019/04/...LSAW...
22
MARCH 28, 2019 Initiating Coverage Kotak Securities Limited has two independent equity research groups: Institutional Equities and Private Client Group. This report has been prepared by the Private Client Group. WELSPUN CORP LTD. PRICE RS.132 TARGET RS.161 BUY Welspun Corp (WCL) is a leading global manufacturer of large diameter pipes with an installed capacity of 2.4 Mn tonnes. Given its presence in USA, Saudi Arabia and India, we believe that, the company is better placed compared to its peers in terms of tapping the global market opportunity of over US$400 bn. At the end of Feb’19, WCL’s order book stood at Rs145 bn, to be executed over the next 15-18 months, thereby providing strong revenue visibility. We expect Welspun Corp to register growth of ~11% CAGR in revenue during the FY18- FY21E period, while PAT is expected to grow at 31% CAGR during the same period, on back of improvement in operating performance and decline in interest outgo. At current valuations, WCL is currently trading at 5.5x/4.2x/3.2x FY19E/FY20E/FY21E EV/EBITDA, which in our view is attractive. We initiate coverage with BUY rating and a target price of Rs.161. Investment argument Revenue visibility - overseas operations to drive growth: Welspun Corp order book stands at Rs145 bn (1.66 mn tonnes), to be executed over the next 15- 18 months, of which 75% are repeated from its existing customers. The current order book is tilted towards overseas market, which accounts for 73% of the total order book, as at end of Feb’19. Of this, ~23% is from its America manufacturing plant. Higher contribution from US and Stable India business to support operating performance: The overseas order book not only provides good revenue visibility, but also comes with the stronger margin compared to the domestic market, as number of qualified bidders are less. In addition, increasing demand of spiral pipes in US due to increase in shale gas production and the country’s focus on reducing imports of pipes augurs well of local manufacturers. We expect US operations to drive operating performance, while domestic operations likely to remain stable, EBITDA/tonne is expected to remain in the range of Rs7,500-Rs8,000 in FY20E and FY21E vs Rs6,300 in FY18 and Rs6,500 in 9MFY19. EBITDA is expected to increase to Rs8.5 bn and Rs8.8 bn in FY20E and FY21E, respectively from Rs6.8 bn in FY18. Leaner balance sheet to support growth: WCL undertook restructuring activity in 2013, and demerged its non-pipe business (asset heavy model) to Welspun Enterprises and started focusing on its core (pipe) business. Post the de-merger, WCL has become a pure play on the pipe sector and also has an exposure to the plate segment. With the leaner balance sheet and completion of capex cycle, Free Cash Flow is expected to improve backed by strong operational performance. In addition, the company is also looking to sell its plate mill (37% of capital employed with a negative contribution to EBITDA) which is currently dragging the return ratios. Successful closure of the deal would further reduced the net debt and improved the return ratios. Global opportunity of over US$400bn: Increasing oil and natural gas consumption has made a significant contribution to the need for increased pipeline construction investment worldwide. The global pipeline demand is likely to generate over US$400 bn opportunity during CY18-22E. North America, Latin America, Africa, Australia and the domestic market would be key volume drivers for global pipe manufacturers. Stock Details Market cap (Rs mn) : 34930 52-wk Hi/Lo (Rs) : 187 / 87 Face Value (Rs) : 5 3M Avg. daily vol : 698,763 Shares o/s (m) : 265 Source: Bloomberg Financial Summary Y/E Mar (Rs mn) FY19E FY20E FY21E Revenue 99,068 101,566 103,803 Growth (%) 30.6 2.5 2.2 EBITDA 6,787 8,468 8,754 EBITDA margin (%) 6.9 8.3 8.4 PAT 1,835 3,257 3,664 EPS 6.9 12.3 13.8 EPS Growth (%) 20.0 77.5 12.5 BV (Rs/share) 114 126 139 Dividend/share (Rs) 0.5 0.5 0.5 ROE (%) 6.0 9.7 9.8 ROCE (%) 7.1 10.0 9.9 P/E (x) 19.1 10.7 9.6 EV/EBITDA (x) 5.5 4.2 3.6 P/BV (x) 1.2 1.0 0.9 Source: Company, Kotak Securities - PCG Shareholding Pattern (%) (%) Dec-18 Sep-18 Jun-18 Promoters 48.7 48.7 48.3 FII 6.2 5.5 5.9 DII 8.7 8.6 8.3 Others 36.4 37.3 37.6 Source: Bloomberg, BSE Price Performance (%) (%) 1M 3M 6M Welspun Corp 21.7 (5.3) 6.0 Nifty 7.2 6.5 5.9 Source: Bloomberg Price chart (Rs) Source: Bloomberg Jatin Damania [email protected] +91 22 6218 6440 80 110 140 170 200 Mar-18 Jul-18 Nov-18 Mar-19
Transcript of Initiating Coverage - Moneycontrol.comstatic-news.moneycontrol.com/static-mcnews/2019/04/...LSAW...

MARCH 28, 2019
Initiating Coverage
Kotak Securities Limited has two independent equity research groups: Institutional Equities and Private Client Group. This report has been prepared by the Private Client Group.
WELSPUN CORP LTD. PRICE RS.132 TARGET RS.161 BUY Welspun Corp (WCL) is a leading global manufacturer of large diameter pipes with an installed capacity of 2.4 Mn tonnes. Given its presence in USA, Saudi Arabia and India, we believe that, the company is better placed compared to its peers in terms of tapping the global market opportunity of over US$400 bn. At the end of Feb’19, WCL’s order book stood at Rs145 bn, to be executed over the next 15-18 months, thereby providing strong revenue visibility. We expect Welspun Corp to register growth of ~11% CAGR in revenue during the FY18-FY21E period, while PAT is expected to grow at 31% CAGR during the same period, on back of improvement in operating performance and decline in interest outgo. At current valuations, WCL is currently trading at 5.5x/4.2x/3.2x FY19E/FY20E/FY21E EV/EBITDA, which in our view is attractive. We initiate coverage with BUY rating and a target price of Rs.161.
Investment argument
Revenue visibility - overseas operations to drive growth: Welspun Corp order book stands at Rs145 bn (1.66 mn tonnes), to be executed over the next 15-18 months, of which 75% are repeated from its existing customers. The current order book is tilted towards overseas market, which accounts for 73% of the total order book, as at end of Feb’19. Of this, ~23% is from its America manufacturing plant.
Higher contribution from US and Stable India business to support operating performance: The overseas order book not only provides good revenue visibility, but also comes with the stronger margin compared to the domestic market, as number of qualified bidders are less. In addition, increasing demand of spiral pipes in US due to increase in shale gas production and the country’s focus on reducing imports of pipes augurs well of local manufacturers. We expect US operations to drive operating performance, while domestic operations likely to remain stable, EBITDA/tonne is expected to remain in the range of Rs7,500-Rs8,000 in FY20E and FY21E vs Rs6,300 in FY18 and Rs6,500 in 9MFY19. EBITDA is expected to increase to Rs8.5 bn and Rs8.8 bn in FY20E and FY21E, respectively from Rs6.8 bn in FY18.
Leaner balance sheet to support growth: WCL undertook restructuring activity in 2013, and demerged its non-pipe business (asset heavy model) to Welspun Enterprises and started focusing on its core (pipe) business. Post the de-merger, WCL has become a pure play on the pipe sector and also has an exposure to the plate segment. With the leaner balance sheet and completion of capex cycle, Free Cash Flow is expected to improve backed by strong operational performance. In addition, the company is also looking to sell its plate mill (37% of capital employed with a negative contribution to EBITDA) which is currently dragging the return ratios. Successful closure of the deal would further reduced the net debt and improved the return ratios.
Global opportunity of over US$400bn: Increasing oil and natural gas consumption has made a significant contribution to the need for increased pipeline construction investment worldwide. The global pipeline demand is likely to generate over US$400 bn opportunity during CY18-22E. North America, Latin America, Africa, Australia and the domestic market would be key volume drivers for global pipe manufacturers.
Stock Details Market cap (Rs mn) : 34930 52-wk Hi/Lo (Rs) : 187 / 87 Face Value (Rs) : 5 3M Avg. daily vol : 698,763 Shares o/s (m) : 265
Source: Bloomberg
Financial Summary
Y/E Mar (Rs mn) FY19E FY20E FY21E
Revenue 99,068 101,566 103,803 Growth (%) 30.6 2.5 2.2 EBITDA 6,787 8,468 8,754 EBITDA margin (%) 6.9 8.3 8.4
PAT 1,835 3,257 3,664 EPS 6.9 12.3 13.8 EPS Growth (%) 20.0 77.5 12.5
BV (Rs/share) 114 126 139 Dividend/share (Rs) 0.5 0.5 0.5 ROE (%) 6.0 9.7 9.8 ROCE (%) 7.1 10.0 9.9
P/E (x) 19.1 10.7 9.6 EV/EBITDA (x) 5.5 4.2 3.6 P/BV (x) 1.2 1.0 0.9
Source: Company, Kotak Securities - PCG
Shareholding Pattern (%)
(%) Dec-18 Sep-18 Jun-18
Promoters 48.7 48.7 48.3 FII 6.2 5.5 5.9 DII 8.7 8.6 8.3 Others 36.4 37.3 37.6
Source: Bloomberg, BSE
Price Performance (%)
(%) 1M 3M 6M
Welspun Corp 21.7 (5.3) 6.0 Nifty 7.2 6.5 5.9
Source: Bloomberg
Price chart (Rs)
Source: Bloomberg
Jatin Damania [email protected] +91 22 6218 6440
80
110
140
170
200
Mar-18 Jul-18 Nov-18 Mar-19

Kotak Securities – Private Client Research Please see the Disclosure/Disclaimer on the last page For Private Circulation 2
MARCH 28, 2019
Outlook Given its strong manufacturing and execution capabilities, strong order backlog coupled with robust bids in the pipeline, we believe, WCL is better placed compared to its peers, to take advantage of renewed pipe demand globally and in the domestic market. Besides this, its leaner balance sheet has helped the company to sail through the tough times and should be able to withstand the pressure in the domestic market (low margin) as compared to its peers, who had to trim or shut down their operations. Going ahead, since a large part of revenues is expected to come from the US should support margins. Backed by improvement in operating performance and decline in interest outgo (focus is on reducing debt), PAT is expected to grow at 31% CAGR during FY18-21E period. At CMP, the stock is trading at 4.2x/3.6x FY20E/FY21E EV/EBITDA, and is attractive in our view. We initiate coverage on WCL, with a BUY rating and a target price of Rs.161, valuing stock at 4.5x FY21E EV/EBITDA.
Key Risks: i) Steel price volatility can impact performance; and
ii) Low crude price can defer investments in oil and gas industry
Kotak Securities – Private Client Research Please see the Disclosure/Disclaimer on the last page For Private Circulation 3
MARCH 28, 2019
COMPANY BACKGROUND Welspun Corp (WCL) is a leading global manufacturer of the large diameter pipes with an installed capacity of 2.4MT, offering a one stop solution for all line pipe related requirements with its wide product range of high grade line pipes and meeting stringent specifications. Its manufacturing facilities are located across USA, Saudi Arabia and India and it is a preferred vendor for major oil and gas companies, both overseas and locally. Over the last two decades, the company has demonstrated its strength and capability to execute key projects overseas, including the world’s deepest pipeline project in the Gulf of Mexico, LNG pipeline project in Peru and longest pipeline project from Canada to the US.
Key management
Name Designation
Mr. Balkrishan Goenka Chairman, Welspun Group Mr. R.R Mandawewala Group Managing Director Mr. Vipul Mathur M.D and CEO, WCL Mr. S. Krishnan Executive Director and CEO, PCMD Mr. Percy Birdy CFO
Source: Company
Leader in pipe industry WCL has emerged as one of the largest players in the pipe industry with 2.4 Mn tonees installed capacity across the locations, followed by German manufacturer Euro Pipes, having an installed capacity of 2MT and JFE. The installed capacity, is aimed at meeting the increasing demand from both domestic and international market for both oil & gas and water related segments. WCL has consistently crossed 1MT of sales volume for three consecutive years, and we expect it to cross 1MT of sales volume in FY20E and FY21E also. It has been seen in last three years, that company’s sales volume is higher than its opening order book.
Multi location line pipe manufacturing
Product ('000 T) US Saudi Arabia India Total
LSAW 700 700 HSAW 350 300 700 1,350 ERW 175 200 375 Total 525 300 1,600 2,425
Source: Company, Kotak Securities – Private Client Research
Product Details
Product Description Used for Diameter Thickness
LSAW Longitudinal Submerged Arc Welded Onshore / off-shore oil and gas transmission 16 – 60 inch 6 – 65 mm HSAW Helically Submerged Arc Welded Onshore oil, gas and water transmission 18 – 140 inch 5 – 27 mm ERW Electric Welded Downstream distribution 1 ¼ - 16 inch 2 – 12.7 mm
Source: Company, Kotak Securities – Private Client Research
Leader in pipeline industry with an installed capacity of
2.4 Mn tonnes
Kotak Securities – Private Client Research Please see the Disclosure/Disclaimer on the last page For Private Circulation 4
MARCH 28, 2019
INVESTMENT ARGUMENT Global Pipeline Network – opportunities exist both in overseas as well as domestic markets North America remains a key market for pipeline construction and line pipe demand, despite the vast network of existing oil and gas pipeline capacity. The total North American pipeline length (large diameter + small diameter) is about 5M km with majority of it comprising natural gas lines. In the US, of the 4.2M km of pipelines, nearly 3.9M km serves natural gas production, while the rest is used to transport crude oil and liquids. Canada’s pipeline system comprises of 825k km of transmission, feeder, gathering and distribution lines. Meanwhile, Mexico’s is serviced by more than 10k km of pipeline as the country undergoes a major natural gas infrastructure addition. In total, almost 2.2 million kilometers of transmission linepipe are present worldwide, half of which is in two countries – USA and Russia. Another eight countries (Canada, China, Ukraine, Argentina, UK, Iran, Mexico, and India) take the cumulative total to 70% of the world network by length. Given the growth in energy demand, the global pipeline demand over the next 4 years is estimated to come from 1,103 projects (as per SIMDEX) resulting in an opportunity for supplies of more than US$ 468 bn across geographies. In addition, with the discovery of shale gas, US is now an exporter of gas, and is developing seven LNG terminals to scale Shale export. There will be a significant surge in pipeline demand, which will connect the producing fields to LNG export terminals. The ticket size can be estimated by the fact that the average distance for connectivity with these terminals could c. 1,000 km/line. We believe that, given the presence of WCL in this key market and its execution capabilities, WCL is well placed to capture the potential demand in the pipeline industry.
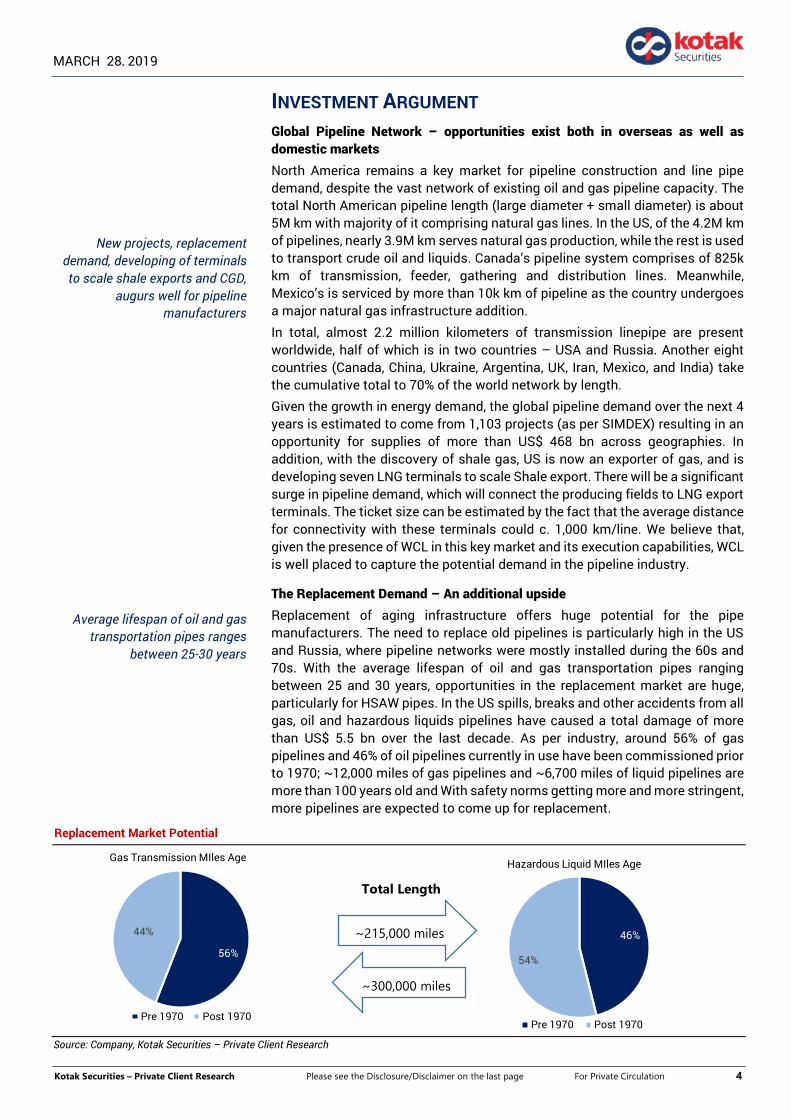
The Replacement Demand – An additional upside Replacement of aging infrastructure offers huge potential for the pipe manufacturers. The need to replace old pipelines is particularly high in the US and Russia, where pipeline networks were mostly installed during the 60s and 70s. With the average lifespan of oil and gas transportation pipes ranging between 25 and 30 years, opportunities in the replacement market are huge, particularly for HSAW pipes. In the US spills, breaks and other accidents from all gas, oil and hazardous liquids pipelines have caused a total damage of more than US$ 5.5 bn over the last decade. As per industry, around 56% of gas pipelines and 46% of oil pipelines currently in use have been commissioned prior to 1970; ~12,000 miles of gas pipelines and ~6,700 miles of liquid pipelines are more than 100 years old and With safety norms getting more and more stringent, more pipelines are expected to come up for replacement.
Replacement Market Potential
Source: Company, Kotak Securities – Private Client Research
56%
44%
Gas Transmission MIles Age
Pre 1970 Post 1970
46%
54%
Hazardous Liquid MIles Age
Pre 1970 Post 1970
Total Length
~215,000 miles
~300,000 miles
New projects, replacement demand, developing of terminals to scale shale exports and CGD,
augurs well for pipeline manufacturers
Average lifespan of oil and gas transportation pipes ranges
between 25-30 years
Kotak Securities – Private Client Research Please see the Disclosure/Disclaimer on the last page For Private Circulation 5
MARCH 28, 2019
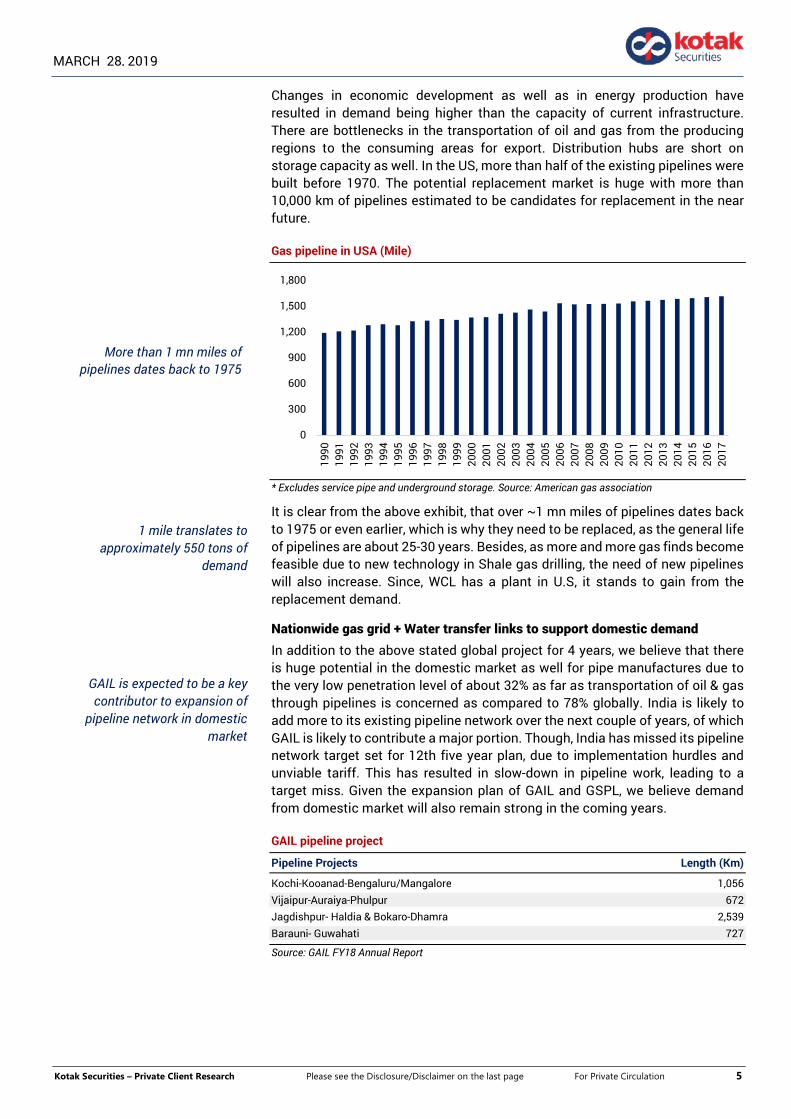
Changes in economic development as well as in energy production have resulted in demand being higher than the capacity of current infrastructure. There are bottlenecks in the transportation of oil and gas from the producing regions to the consuming areas for export. Distribution hubs are short on storage capacity as well. In the US, more than half of the existing pipelines were built before 1970. The potential replacement market is huge with more than 10,000 km of pipelines estimated to be candidates for replacement in the near future.
Gas pipeline in USA (Mile)
* Excludes service pipe and underground storage. Source: American gas association
It is clear from the above exhibit, that over ~1 mn miles of pipelines dates back to 1975 or even earlier, which is why they need to be replaced, as the general life of pipelines are about 25-30 years. Besides, as more and more gas finds become feasible due to new technology in Shale gas drilling, the need of new pipelines will also increase. Since, WCL has a plant in U.S, it stands to gain from the replacement demand.
Nationwide gas grid + Water transfer links to support domestic demand In addition to the above stated global project for 4 years, we believe that there is huge potential in the domestic market as well for pipe manufactures due to the very low penetration level of about 32% as far as transportation of oil & gas through pipelines is concerned as compared to 78% globally. India is likely to add more to its existing pipeline network over the next couple of years, of which GAIL is likely to contribute a major portion. Though, India has missed its pipeline network target set for 12th five year plan, due to implementation hurdles and unviable tariff. This has resulted in slow-down in pipeline work, leading to a target miss. Given the expansion plan of GAIL and GSPL, we believe demand from domestic market will also remain strong in the coming years.
GAIL pipeline project
Pipeline Projects Length (Km)
Kochi-Kooanad-Bengaluru/Mangalore 1,056 Vijaipur-Auraiya-Phulpur 672 Jagdishpur- Haldia & Bokaro-Dhamra 2,539 Barauni- Guwahati 727
Source: GAIL FY18 Annual Report
0
300
600
900
1,200
1,500
1,800
1990
1991
1992
1993
1994
1995
1996
1997
1998
1999
2000
2001
2002
2003
2004
2005
2006
2007
2008
2009
2010
2011
2012
2013
2014
2015
2016
2017
More than 1 mn miles of pipelines dates back to 1975
1 mile translates to approximately 550 tons of
demand
GAIL is expected to be a key contributor to expansion of
pipeline network in domestic market
Kotak Securities – Private Client Research Please see the Disclosure/Disclaimer on the last page For Private Circulation 6
MARCH 28, 2019
Currently, GAIL owns and operates more than 11500 km of natural gas pipeline and about 2300 Km LPG pipeline across the country. At the same time, working concurrently on multiple pipeline projects, aggregating over 5400 kms. In addition, the company has been additionally entrusted to lay a 750 kms trunk pipeline network from Barauni to Guwahati as an integral link of Jagadishpur-Haldia-Bokaro-Dhamra pipeline project. GAIL has earmarked an aggressive capex plan of Rs239 bn for the pipeline network. Besides this, City Gas Distribution network expansion, augmentation of Jamnagar Loni LPG Pipeline Project and Pipe Line Replacement Projects (KG Basin, Gujarat and Cauvery Basin), also augurs well for the domestic pipe manufacturers. In addition to GAIL, even GSPL has also announced aggressive capex for setting up the pipeline network.
GSPL proposed pipeline
Company Pipeline Project Length (Km)
GSPL India Gasnet Limited (GIGL) Mehsana – Bhatinda 2,052 Bhatinda - Jammu – Srinagar 725 GSPL India Transco Limited (GITL) Mallavaram - Bhopal – Bhilwara - Vijaipur 1,881
Source: GSPL FY18 Annual Report
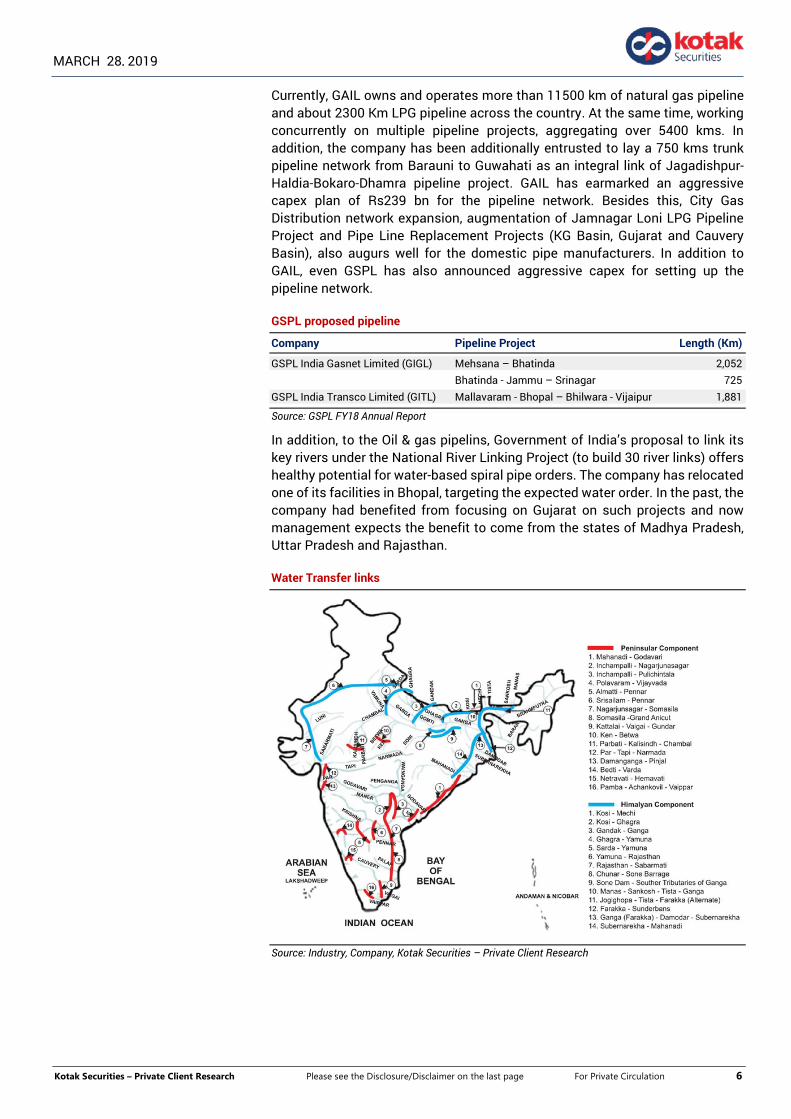
In addition, to the Oil & gas pipelins, Government of India’s proposal to link its key rivers under the National River Linking Project (to build 30 river links) offers healthy potential for water-based spiral pipe orders. The company has relocated one of its facilities in Bhopal, targeting the expected water order. In the past, the company had benefited from focusing on Gujarat on such projects and now management expects the benefit to come from the states of Madhya Pradesh, Uttar Pradesh and Rajasthan.
Water Transfer links
Source: Industry, Company, Kotak Securities – Private Client Research

Kotak Securities – Private Client Research Please see the Disclosure/Disclaimer on the last page For Private Circulation 7
MARCH 28, 2019
Global footprint lowers risk The current order book is tilted towards overseas market, which accounts for ~73% of the total order book, as at the end of Feb’19. Of this, ~23% is from America. The overseas order book not only provides good revenue visibility, but also comes with the stronger margin compared to the domestic market, as number of qualifying bidders are less. We understand WCL faces competition from few players globally.
Welspun has a 350,000 mtpa helical submerged arc welded (HSAW) facility in the US. The facility can manufacture large (with 24–60” diameter) HSAW pipes along with integrated coating and bending facilities. In addition to the US facility, the company’s facility in the Middle-East has enhanced its presence globally. Its global presence and exposure to these markets will be an advantage as, more than 41,000 km of pipeline projects are expected from America and Middle East. In addition, WCL also expects orders from newer regions like Australia and Europe, where it does not have a presence.
We believe overseas operations are likely to remain strong, as oil prices remain stable and orders start flowing in from the US, Middle East, etc.
Global Footprint
Source: Company
Though, we believe, transportation of crude through steel pipe is cheaper than the road transport and is the best option at the time when crude prices are declining. But, at the same time, there is a possibility of delay in issuing tender or execution of order due to weaker financial condition of an order issuer company, as pipeline capex comes at the end of their capex cycle.
Overseas manufacturing facilities enables the company to
win new orders

Kotak Securities – Private Client Research Please see the Disclosure/Disclaimer on the last page For Private Circulation 8
MARCH 28, 2019
Revenue visibility – backed by global presence The company’s order book stands at Rs145bn (1.66 Mn tonnes), to be executable over the next 15-18 months. FY18 and 9MFY19 revenue was Rs75.9bn and Rs70.36bn, respectively. Given the strong order book, we expect the revenue to increase to Rs101 bn and Rs103bn by end of FY20E and FY21E, respectively.
Order book by Region (‘000 T) Order book by Type (‘000 T)
Source: Company, Kotak Securities – Private Client Research Source: Company, Kotak Securities – Private Client Research
YTD, the company has been a key beneficiary in the U.S. from increased demand of spiral pipes, backed by an increase in shale gas production and curb in imports. This has supported higher volumes and better EBITDA (Welspun Corp has one of the largest manufacturing facility).
Current - U.S order book (‘000 T) Saudi order book (‘000 T) India order book (‘000 T)
Source: Company, Kotak Securities – Private Client Research
In addition, the company has actively participated in various bids, which are in the pipeline and if converted into order book, it could further enhance the revenue visibility in the coming months. The bid books currently stand ~2.3 Mn tonnes (majority from US). As per management, bid to win ratios stands at ~25%. Besides these, global opportunities of 12,000 KT pipeline are likely to come from the USA, Mexico and Saudi Arabia, where the company has a strong presence and is one of the strongest contenders. High shale oil/gas production is driving demand for pipeline infrastructure (for transporting oil to refining facilities on the Gulf of Mexico and international markets). Demand for gas pipelines are also aided by oil producers to evacuate gas generated. In line with this, majority of leading midstream companies had already planned for additional pipelines
0
300
600
900
1200
1500
1800
FY14 FY15 FY16 FY17 FY18 3QFY19
RoW America Saudi Arabia
HSAW, 344
ERW/HFIW, 44
0
300
600
900
1200
1500
1800
FY14 FY15 FY16 FY17 FY18 3QFY19
LSAW HSAW ERW
HSAW, 143
LSAW, 277
ERW, 27
HSAW, 823
Kotak Securities – Private Client Research Please see the Disclosure/Disclaimer on the last page For Private Circulation 9
MARCH 28, 2019
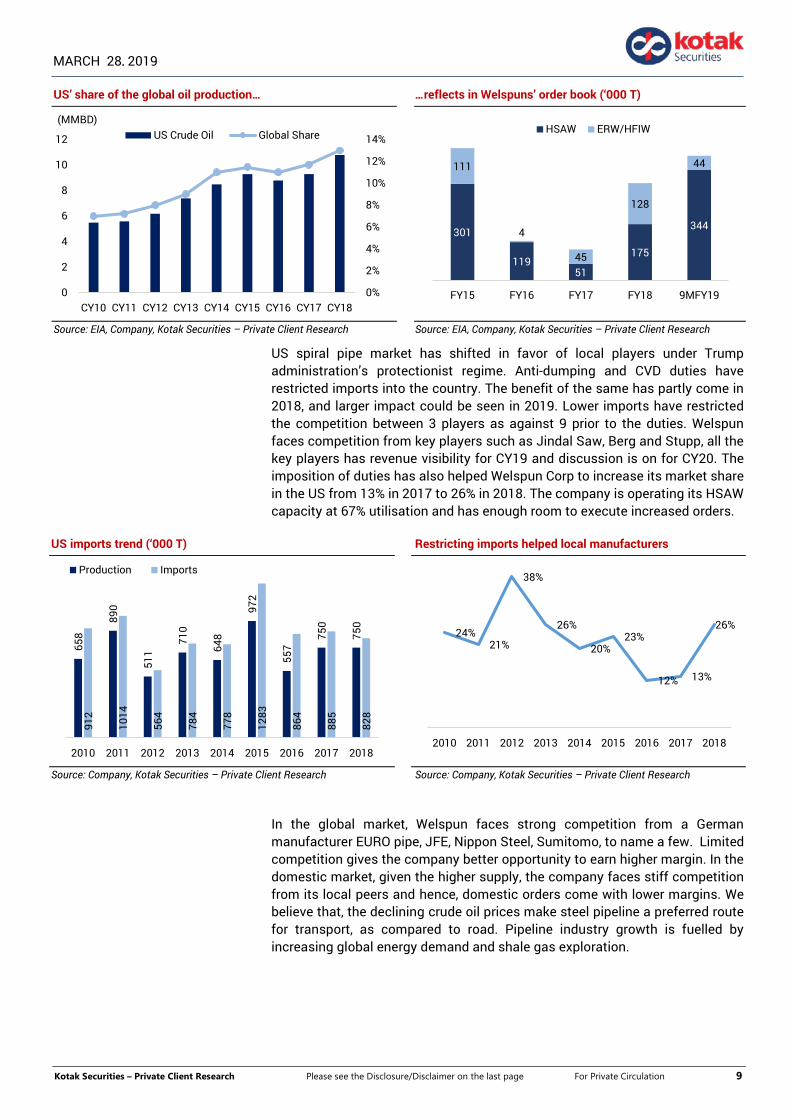
US’ share of the global oil production… …reflects in Welspuns’ order book (‘000 T)
Source: EIA, Company, Kotak Securities – Private Client Research Source: EIA, Company, Kotak Securities – Private Client Research
US spiral pipe market has shifted in favor of local players under Trump administration’s protectionist regime. Anti-dumping and CVD duties have restricted imports into the country. The benefit of the same has partly come in 2018, and larger impact could be seen in 2019. Lower imports have restricted the competition between 3 players as against 9 prior to the duties. Welspun faces competition from key players such as Jindal Saw, Berg and Stupp, all the key players has revenue visibility for CY19 and discussion is on for CY20. The imposition of duties has also helped Welspun Corp to increase its market share in the US from 13% in 2017 to 26% in 2018. The company is operating its HSAW capacity at 67% utilisation and has enough room to execute increased orders.
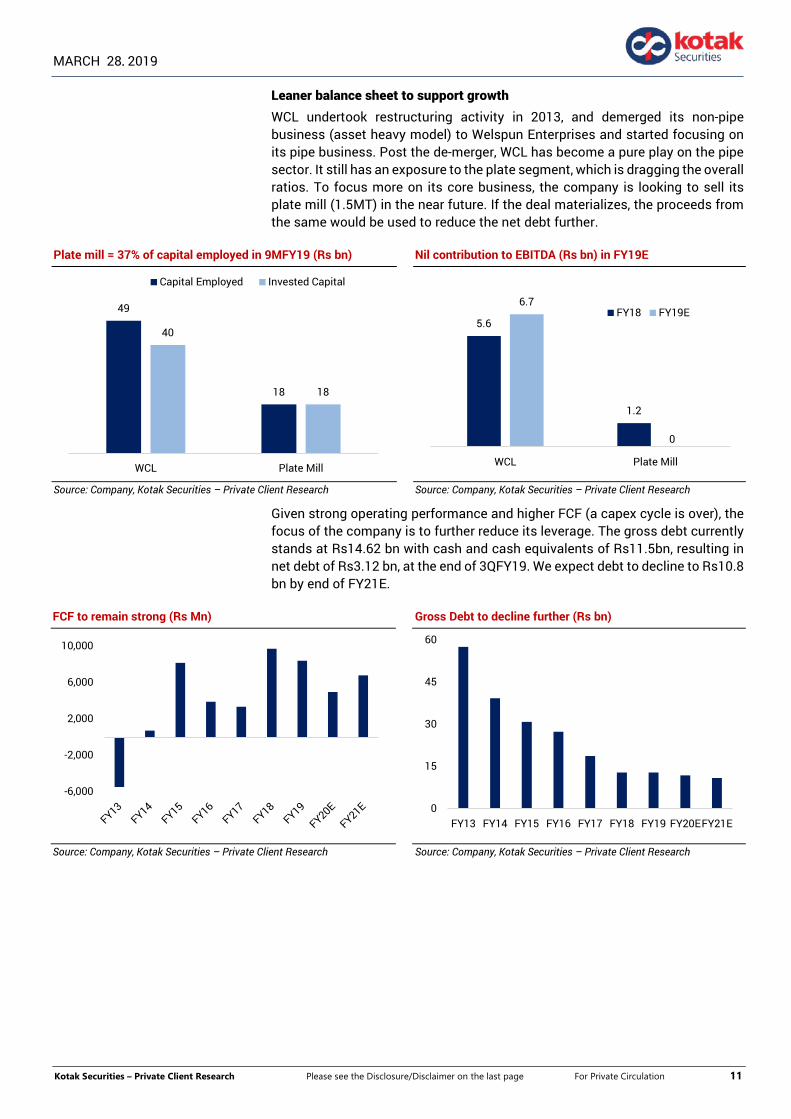
US imports trend (‘000 T) Restricting imports helped local manufacturers
Source: Company, Kotak Securities – Private Client Research Source: Company, Kotak Securities – Private Client Research
In the global market, Welspun faces strong competition from a German manufacturer EURO pipe, JFE, Nippon Steel, Sumitomo, to name a few. Limited competition gives the company better opportunity to earn higher margin. In the domestic market, given the higher supply, the company faces stiff competition from its local peers and hence, domestic orders come with lower margins. We believe that, the declining crude oil prices make steel pipeline a preferred route for transport, as compared to road. Pipeline industry growth is fuelled by increasing global energy demand and shale gas exploration.
0%
2%
4%
6%
8%
10%
12%
14%
0
2
4
6
8
10
12
CY10 CY11 CY12 CY13 CY14 CY15 CY16 CY17 CY18
(MMBD)US Crude Oil Global Share
658
890
511
710
648
972
557
750
750
912
1014
564
784
778
1283
864
885
828
2010 2011 2012 2013 2014 2015 2016 2017 2018
Production Imports
301
11951
175
344
111
4
45
128
44
FY15 FY16 FY17 FY18 9MFY19
HSAW ERW/HFIW
24%21%
38%
26%
20%23%
12% 13%
26%
2010 2011 2012 2013 2014 2015 2016 2017 2018

Kotak Securities – Private Client Research Please see the Disclosure/Disclaimer on the last page For Private Circulation 10
MARCH 28, 2019
Saudi JV – order book = 3x capacity Management indicated that huge business potential exists in Saudi region, as most of the desalination plants are far from demand area. Management sees strong demand in both, Oil & Gas and Water sectors, driven by Saudi Aramco and SWCC respectively. The current order book in Saudi stands at 823KT, which is 3x installed capacity, which provides revenue visibility. Management also indicated that local players get ~10% price preference in addition to the protection.
Saudi JV order book (‘000 T) EBITDA performance to improve in FY20E
Source: Company, Kotak Securities – Private Client Research Source: Company, Kotak Securities – Private Client Research
Despite having a strong order book, local preference and protection measures, the JV reported losses at the EBITDA level. The performance was impacted by adverse movement of raw materials, as one of its largest order (392KT from SWCC) was at a fixed price. Management expects, the performance to improve from here on, as a contribution from the new order (higher steel prices) will flow in and lower contribution from the fixed price contract.
EBITDA/T improvement backed by higher contribution from overseas market Given the higher contribution from US orders and stable domestic operation, we expect EBITDA/tonne to improve from Rs6,306 in FY18 and Rs6,500 in 9MFY19 to Rs7,700 in FY20E & FY21E. This would be better compared to its domestic peers in the welded line pipe industry. As per management, the US operations is likely to report EBITDA/tonne in the range of $180-$200, thanks to its presence in key markets and low competition, as against our expectation of $150-160. India operations likely to remain stable, due to excess capacity in the domestic market. Saudi operation is expected to report $100 as EBITDA/tonne in the coming years. Backed by higher margin order, we expect EBITDA to grow at a CAGR of 8.6% during FY18-FY21E.
US and India EBITDA/tonne Rs)
Source: Company, Kotak Securities – Private Client Research
300 300 300 300 300
208 109 43
952823
FY15 FY16 FY17 FY18 9MFY19
Capacity Order book
0
3,000
6,000
9,000
12,000
15,000
FY15 FY16 FY17 FY18 FY19E FY20E FY21E
US India
-15,000
-10,000
-5,000
0
5,000
10,000
15,000
20,000
-2
-1
0
1
2
3
4
5
FY15 FY16 FY17 FY18 9MFY19
EBITDA EBITDA/T
Kotak Securities – Private Client Research Please see the Disclosure/Disclaimer on the last page For Private Circulation 11
MARCH 28, 2019
Leaner balance sheet to support growth WCL undertook restructuring activity in 2013, and demerged its non-pipe business (asset heavy model) to Welspun Enterprises and started focusing on its pipe business. Post the de-merger, WCL has become a pure play on the pipe sector. It still has an exposure to the plate segment, which is dragging the overall ratios. To focus more on its core business, the company is looking to sell its plate mill (1.5MT) in the near future. If the deal materializes, the proceeds from the same would be used to reduce the net debt further.
Plate mill = 37% of capital employed in 9MFY19 (Rs bn) Nil contribution to EBITDA (Rs bn) in FY19E
Source: Company, Kotak Securities – Private Client Research Source: Company, Kotak Securities – Private Client Research
Given strong operating performance and higher FCF (a capex cycle is over), the focus of the company is to further reduce its leverage. The gross debt currently stands at Rs14.62 bn with cash and cash equivalents of Rs11.5bn, resulting in net debt of Rs3.12 bn, at the end of 3QFY19. We expect debt to decline to Rs10.8 bn by end of FY21E.
FCF to remain strong (Rs Mn) Gross Debt to decline further (Rs bn)
Source: Company, Kotak Securities – Private Client Research Source: Company, Kotak Securities – Private Client Research
49
18
40
18
WCL Plate Mill
Capital Employed Invested Capital
-6,000
-2,000
2,000
6,000
10,000
0
15
30
45
60
FY13 FY14 FY15 FY16 FY17 FY18 FY19 FY20EFY21E
5.6
1.2
6.7
0
WCL Plate Mill
FY18 FY19E

Kotak Securities – Private Client Research Please see the Disclosure/Disclaimer on the last page For Private Circulation 12
MARCH 28, 2019
Strong relations across the globe As a result of growing global presence and business associations of WCL, the following is a list of its prominent business partners across the globe.
Key clients
Source: Company, Kotak Securities – Private Client Research
Besides these, there are many other approved customers that keep WCL’s order book full (as 75% of its orders are repeat order from its existing customers). This also acts as an entry barrier for new players in the industry as it requires a minimum of 3–5 years to be accredited by these large oil & gas companies. The company is able to hold its relationship with the above mentioned clientele and gets repeated orders (75%) due to its product quality and execution capabilities.
Execution – a key for WCL Focus on R&D and pipeline technology, gives WCL an edge over its peers to bag the complex projects. The company has shown its expertise in delivering pipes for critical projects with stringent specifications. The key projects, where the company has shown its execution capabilities include Peru LNG, Stampede Oil Export SCR pipeline, Mexico, Keystone Pipeline to name a few. WCL is one of the preferred vendors to over 50 major oil and gas companies. Given the complexities and stringent norms, very few players qualify for the global tenders. This helps the company to garner better margins in the overseas region.

Kotak Securities – Private Client Research Please see the Disclosure/Disclaimer on the last page For Private Circulation 13
MARCH 28, 2019
Expertise in complex projects
Independence Trail
Deepest
Heaviest
IGAT- IV
233kms, 24"deep sea gas transmission pipeline in Gulf of Mexico
100 kms, 56" high pressure gas transmission
pipeline in Persian Gulf
Complexity: High collapse resistance
Complexity: Large diameter high wall thicknes,
X70 grade of steel
Peru LNG
Highest
Longest
Keystone Pipeline
118 Kms, 34" gas transmission pipeline
Sole Supplier, Canada to USA Crude oil pipeline (1,700 km, 36")
Complexity: Pipeline in service at very high altitude
Complexity: Very Long distance hydrocarbon pipeline supplied by
a single manufacturer
Arabiyah-Hasbah (Wasit Gas Program)
Offshore
Stringent
tolerance level
Stampede Oil Export SCR* Pipeline
100kms, 36" gas pipeline in Saudi Arabia
~32km, 18" oil pipeline in Gulf of Mexico
Complexity: Highly sour gas Complexity: Only WCL could match
specification
*SCR: Steel Catenary Riser; Source: Company
Global opportunity over US$400 bn Increasing oil and natural gas consumption have made a significant contribution to the need for increased pipeline construction investment worldwide. The pipeline industry is currently grappling with overcapacity. However, in the coming years, it is expected to witness steady growth backed by pipeline investment. The global pipeline demand is expected to grow at 17% CAGR (excl. China and CIS) to 10.7MT during FY14-FY20E. Overall pipeline demand is likely to generate over US$400 bn opportunity during 2018-2022. North America, Latin America, Africa, Australia and the domestic market would be key volume drivers for global pipe manufacturers. In addition, fall in crude oil prices make steel pipeline a preferred route for transportation as compared to road transport. As per the company, pipeline transport of crude to be ~50% cheaper v/s road transport. We expect markets like North America, the Middle East and India to form a large portion of the global opportunity. In addition, replacement demand in North America would provide further upside, as over 1mn miles of pipelines date back to 1975 or even earlier.
Global Opportunity during 2018-2022
Region Projects Total length Business Potential ('000 km) (US$ Bn)
North America 340 20 89 Latin America 169 16 74 Europe 109 12 43 Africa 82 17 81 Middle East 77 5 29 Asia 55 9 29 Australia 79 22 77
Source: Simdex, Kotak Securities – Private Client Research
US$468bn of business potential over the next four years

Kotak Securities – Private Client Research Please see the Disclosure/Disclaimer on the last page For Private Circulation 14
MARCH 28, 2019
Demand driver
Region Descriptions
North America LNG export terminals in USA - 1st operational; more to come Focus on LNG export projects – Prince Rupert, Coastal Gas Link Transnational gas pipeline projects from USA to Mexico Middle East Iraq-Jordan crude export pipeline (over 1,100 km) Pipeline development in Kuwait & Oman Saudi – substituting oil with gas for domestic consumption, emphasis on oil
exports, increased demand for water pipelines Opening up of Iran Asia Pacific Doubling of gas pipeline infrastructure to 30,000km ~2.5mn ton water pipeline projects expected in near future Transnational projects – TAPI, Middle East to India City gas distribution pipeline projects in multiple cities Offshore development in Thailand – Myanmar region
Source: Industry data, Company, Kotak Securities – Private Client Research
Energy Demand: The global energy demand is expected to increase from 274mboe/d in 2015 to around 365 mboe/d by the end of 2040 i.e. an increase of 91 mboe/d, or an average annual growth of 1.2%. Almost 95% of the increase will be accounted by developing Countries (including China and India), with an average annual growth of 1.9%. Energy demand in developing countries is projected to increase by almost 86 mboe/d between 2015 and 2040. China is the largest contributor to world demand growth, is expected to by 22 mboe/d during the same period. The OECD demand is expected to remain stagnant, as the market has been already energy efficient and population growth is limited.
Oil scenario: For the second consecutive year, long-term oil demand projections have been revised upward. Oil demand at the global level is expected to continue to grow at healthy rates over the medium-term to reach a level of 104.5 mb/d by 2023. In the long-term oil demand is set to increase by 14.5 mb/d to reach 111.7 mb/d in 2040. India is projected to be the country with the fastest demand growth and see the largest additional demand during the stated period. OECD demand is expected to remain muted in the medium term and projected to fall to 38.7 mb/d by the end of 2040. Non-OECD consumption will reach 66.6 Mb/d by 2040 with demand in China is projected to reach 17.4 Mb/d in 2040.
World Oil Demand Outlook, 2017 – 2040 (mb/d)
2017 2018 2019 2020 2021 2022 2023 2025 2030 2035 2040
OECD America 25 25.3 25.5 25.7 25.8 25.7 25.6 25.2 23.9 22.5 20.9 OECD Europe 14.3 14.4 14.4 14.5 14.4 14.3 14.2 13.9 13.1 12.4 11.6 OECD Asia Oceania 8.1 8.1 8 8 8 7.9 7.8 7.6 7.2 6.7 6.2 OECD 47.3 47.8 48 48.3 48.1 47.9 47.6 46.8 44.2 41.5 38.7 Latin America 5.7 5.8 5.9 6 6.1 6.2 6.3 6.4 6.8 7.1 7.3 Middle East & Africa 3.8 3.9 4 4.1 4.2 4.3 4.4 4.6 5.1 5.7 6.3 India 4.5 4.7 5 5.2 5.4 5.6 5.9 6.4 7.6 9 10.4 China 12.3 12.7 13.1 13.4 13.7 14 14.3 14.7 15.8 16.6 17.4 Other Asia 8.7 8.9 9.1 9.4 9.6 9.7 9.9 10.3 11.3 12.2 12.9 OPEC 9.3 9.4 9.5 9.8 9.9 10.1 10.3 10.7 11.5 12 12.3 Developing countries 44.4 45.5 46.6 47.9 48.90 49.9 51 53.1 58.1 62.6 66.6 Russia 3.5 3.5 3.6 3.7 3.7 3.8 3.8 3.9 3.9 3.9 3.9 Other Eurasia 1.9 2 2 2.1 2.1 2.2 2.2 2.2 2.3 2.4 2.5 Eurasia 5.4 5.6 5.7 5.8 5.9 5.9 6 6.1 6.3 6.4 6.4 World 97.2 98.8 100.3 101.9 102.9 103.7 104.5 106 108.6 110.5 111.7
Source: OPEC, World Oil Outlook 2018
Oil demand to grow to the level of 104.5 mb/d and 111.7 mb/d
by end of 2023 and 2040, respectively

Kotak Securities – Private Client Research Please see the Disclosure/Disclaimer on the last page For Private Circulation 15
MARCH 28, 2019
Gas scenario: In 2040, gas is projected to become the second largest energy source and reach an estimated share of 25%, up by more than 3% percentage points from 2015. The expansion of natural gas demand continued in 2017 with a healthy global growth rate of around 3% year-on-year (y-o-y), or 1.8 mboe/d. This is the highest level recorded since 2010. The majority of the increase in gas demand is expected to come from three countries China, Middle East and Europe, which cover almost 85% of the global YoY increase in gas consumption in 2017.
Gas demand and production, 2017-2040
Source: BP Energy Outlook 2019
Non-OECD regions continue to drive natural gas demand: Global gas demand is expected to increase from 59 mboe/d in 2015 to 91 mboe/d in 2040, which is more than a 50% increase in 25 years. In China, demand is projected to increase by around 6 mboe/d between 2015 and 2040, to reach slightly above 9 mboe/d. In OECD regions, the long-term future of gas demand is mixed. While in OECD America and OECD Europe gas demand still has some potential to increase, gas demand in OECD Asia Oceania is set to stagnate throughout the forecast period.
Non-OECD regions will provide 85% of the additional consumption. China alone represents 30% of this demand, followed by the Middle East with 22%. In contrast, consumption in FSU/non-OECD Europe remains stable.
The global outlook for gas appears to be optimistic over the coming years, as demand is likely to increase by 50% to 169 trillion cubic feet in 2035. New sources of gas, both conventional and unconventional, are expected to bring greater diversity to global supply. Changes in the list of major LNG suppliers will result in the creation of new linkages between regional gas markets, notably between those of North America and the Asia-Pacific, narrowing to a degree the wide regional gas price differentials that exist today.
Natural Gas Scenario: The global demand for Natural Gas is projected to rise by 65% from 2010 to 2040, the largest volume in any energy source. Natural gas is the world’s fastest growing fossil fuel, with consumption expected to increase from 113.0 trillion cubic feet in 2010 to 185.0 trillion cubic feet in 2040. Natural gas production is projected to grow across regions, so will be the consumption. It is anticipated that, the Natural gas consumption is mostly concentrated in non-OECD countries, where demand increases twice as fast as in OECD countries. Non-OECD producers account for more than 70% of the total growth in world natural gas production from 2010 to 2040.
85% of incremental consumption is expected from
Non-OECD regions
Natural gas consumption to increase to 185 trillion cubic feet
by end of 2040

Kotak Securities – Private Client Research Please see the Disclosure/Disclaimer on the last page For Private Circulation 16
MARCH 28, 2019
FINANCIAL ANALYSIS Revenue to see a CAGR of ~11% WCL registered a fall of ~7% CAGR in revenue over FY2013-18 owing to fall in revenue from coils and plate segments, as sourcing of plate from a third party was cheaper, compared to its in-house manufacturing cost. We believe that pick-up in orders from the overseas markets is likely to drive the revenue growth from the pipes segment. Overall, backed by good order book and bids in the pipeline we are expecting a revenue CAGR of 11% in FY18-21E.
Order book provides revenue visibility
Source: Company, Kotak Securities – Private Client Research
EBITDA/T improvement backed by higher contribution from overseas market Given the higher contribution from US orders and near completion of low margin order in the Middle East, we expect EBITDA/tonne to improve from Rs6,306 in FY18 and Rs6,500 in 9MFY19 to Rs7,700 in FY20E & FY21E. This would be better compared to its domestic peers in the welded line pipe industry. As per management, the US operations is likely to report EBITDA/tonne in the range of $180-$200. Due to excess capacity in the domestic market and stiff competition, EBITDA/tonne in India is likely to remain stable. Backed by higher margin order, we expect EBITDA to grow at a CAGR of 8.6% during FY18-FY21E. With strong operating performance, coupled with reduction in interest outgo (focus is on reducing debt), PAT is likely to grow at 31% CAGR during the same period.
EBITDA/T to remain range bound (Rs ‘000/T) EBITDA Margins to show improvement
Source: Company, Kotak Securities – Private Client Research Source: Company, Kotak Securities – Private Client Research
-30
-20
-10
0
10
20
30
40
0
20,000
40,000
60,000
80,000
100,000
120,000
FY14 FY15 FY16 FY17 FY18 FY19E FY20E FY21E
Net sales (Rs Mn) - LHS Growth (%) - RHS
5 5
9
6
10
7
5
67
67
68 8
0.0
2.0
4.0
6.0
8.0
10.0
12.0
0
2,000
4,000
6,000
8,000
10,000
EBITDA (Rs Mn) - LHS EBITDA Margin (%)
Kotak Securities – Private Client Research Please see the Disclosure/Disclaimer on the last page For Private Circulation 17
MARCH 28, 2019
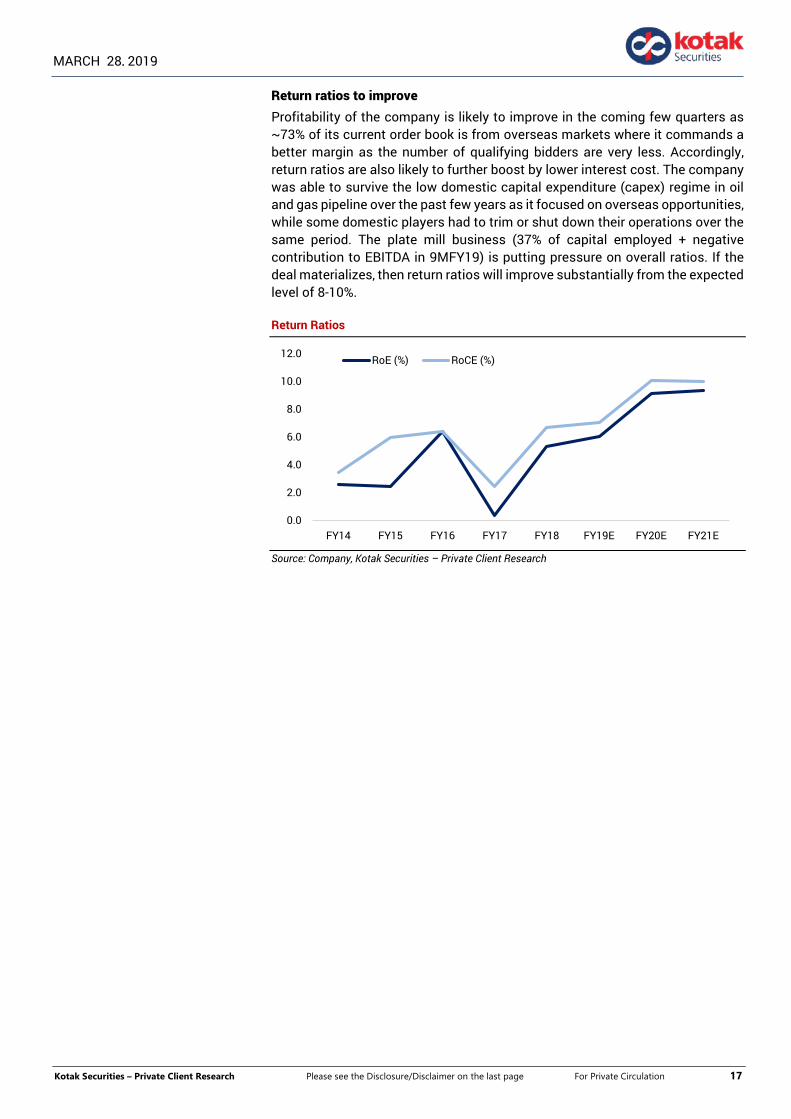
Return ratios to improve Profitability of the company is likely to improve in the coming few quarters as ~73% of its current order book is from overseas markets where it commands a better margin as the number of qualifying bidders are very less. Accordingly, return ratios are also likely to further boost by lower interest cost. The company was able to survive the low domestic capital expenditure (capex) regime in oil and gas pipeline over the past few years as it focused on overseas opportunities, while some domestic players had to trim or shut down their operations over the same period. The plate mill business (37% of capital employed + negative contribution to EBITDA in 9MFY19) is putting pressure on overall ratios. If the deal materializes, then return ratios will improve substantially from the expected level of 8-10%.
Return Ratios
Source: Company, Kotak Securities – Private Client Research
0.0
2.0
4.0
6.0
8.0
10.0
12.0
FY14 FY15 FY16 FY17 FY18 FY19E FY20E FY21E
RoE (%) RoCE (%)
Kotak Securities – Private Client Research Please see the Disclosure/Disclaimer on the last page For Private Circulation 18
MARCH 28, 2019
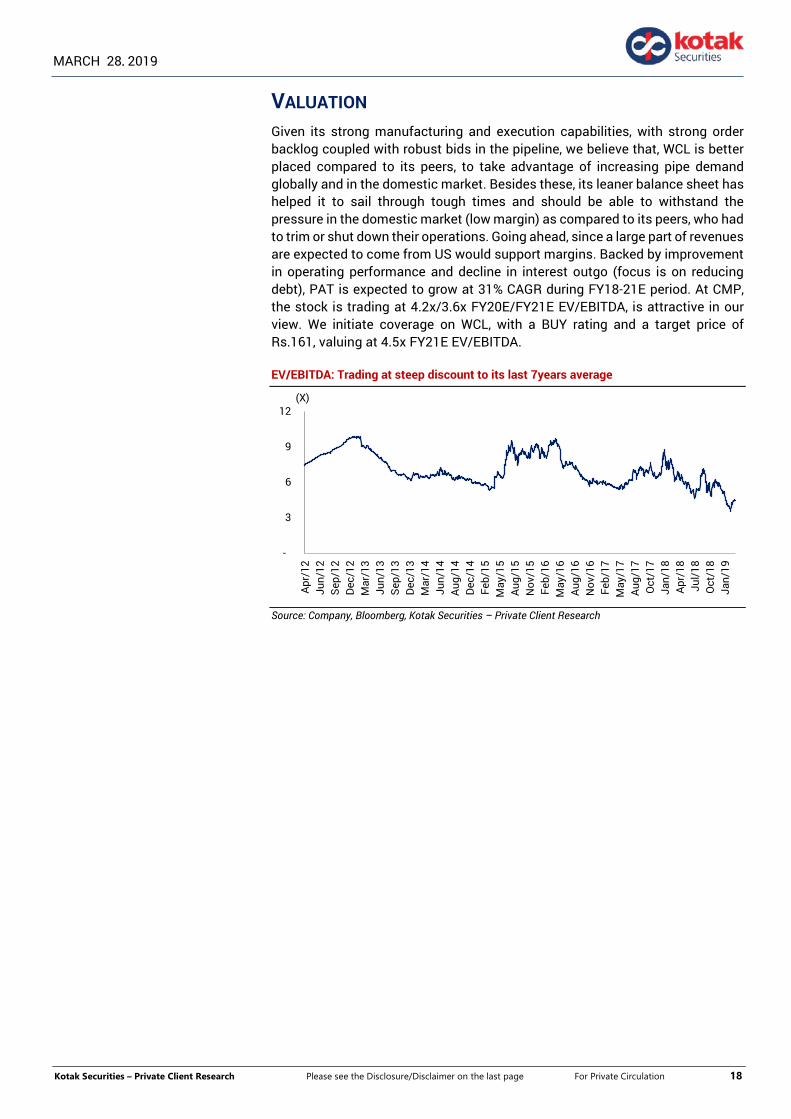
VALUATION Given its strong manufacturing and execution capabilities, with strong order backlog coupled with robust bids in the pipeline, we believe that, WCL is better placed compared to its peers, to take advantage of increasing pipe demand globally and in the domestic market. Besides these, its leaner balance sheet has helped it to sail through tough times and should be able to withstand the pressure in the domestic market (low margin) as compared to its peers, who had to trim or shut down their operations. Going ahead, since a large part of revenues are expected to come from US would support margins. Backed by improvement in operating performance and decline in interest outgo (focus is on reducing debt), PAT is expected to grow at 31% CAGR during FY18-21E period. At CMP, the stock is trading at 4.2x/3.6x FY20E/FY21E EV/EBITDA, is attractive in our view. We initiate coverage on WCL, with a BUY rating and a target price of Rs.161, valuing at 4.5x FY21E EV/EBITDA.
EV/EBITDA: Trading at steep discount to its last 7years average
Source: Company, Bloomberg, Kotak Securities – Private Client Research
-
3
6
9
12
Apr/
12Ju
n/12
Sep/
12De
c/12
Mar
/13
Jun/
13Se
p/13
Dec/
13M
ar/1
4Ju
n/14
Aug/
14De
c/14
Feb/
15M
ay/1
5Au
g/15
Nov
/15
Feb/
16M
ay/1
6Au
g/16
Nov
/16
Feb/
17M
ay/1
7Au
g/17
Oct
/17
Jan/
18Ap
r/18
Jul/1
8O
ct/1
8Ja
n/19
(X)
Kotak Securities – Private Client Research Please see the Disclosure/Disclaimer on the last page For Private Circulation 19
MARCH 28, 2019
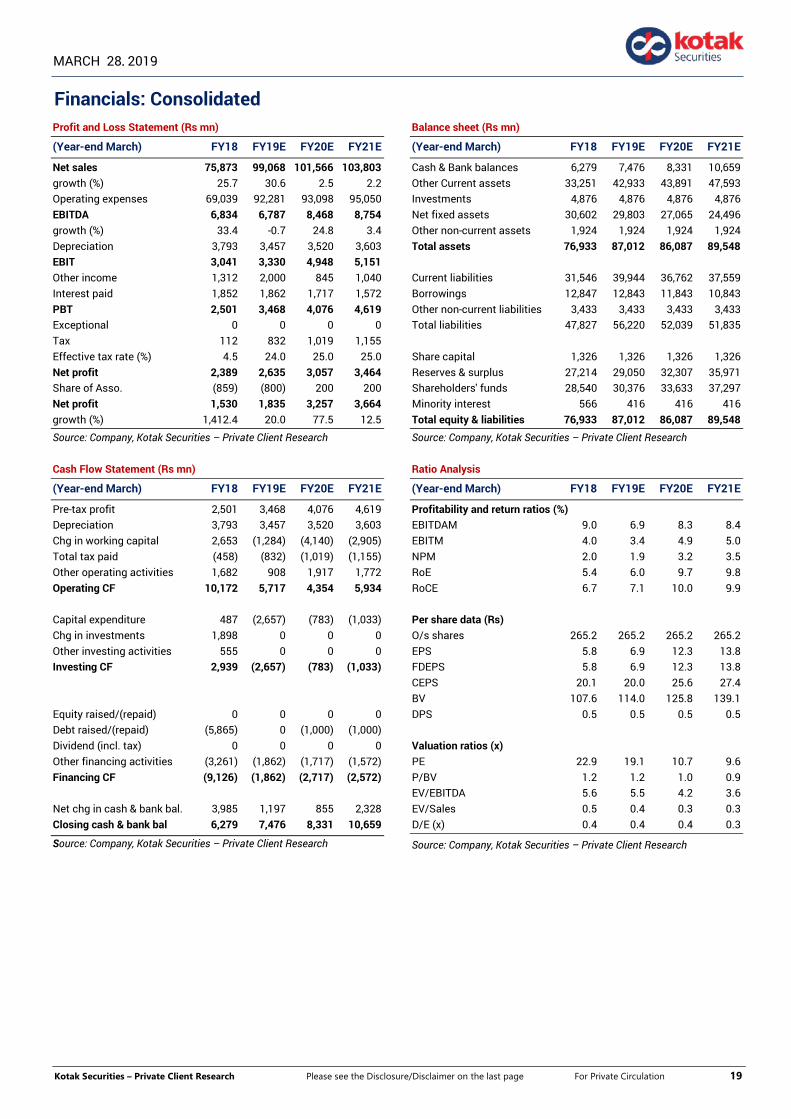
Financials: Consolidated Profit and Loss Statement (Rs mn)
(Year-end March) FY18 FY19E FY20E FY21E
Net sales 75,873 99,068 101,566 103,803 growth (%) 25.7 30.6 2.5 2.2 Operating expenses 69,039 92,281 93,098 95,050 EBITDA 6,834 6,787 8,468 8,754 growth (%) 33.4 -0.7 24.8 3.4 Depreciation 3,793 3,457 3,520 3,603 EBIT 3,041 3,330 4,948 5,151 Other income 1,312 2,000 845 1,040 Interest paid 1,852 1,862 1,717 1,572 PBT 2,501 3,468 4,076 4,619 Exceptional 0 0 0 0 Tax 112 832 1,019 1,155 Effective tax rate (%) 4.5 24.0 25.0 25.0 Net profit 2,389 2,635 3,057 3,464 Share of Asso. (859) (800) 200 200 Net profit 1,530 1,835 3,257 3,664 growth (%) 1,412.4 20.0 77.5 12.5
Source: Company, Kotak Securities – Private Client Research Cash Flow Statement (Rs mn)
(Year-end March) FY18 FY19E FY20E FY21E
Pre-tax profit 2,501 3,468 4,076 4,619 Depreciation 3,793 3,457 3,520 3,603 Chg in working capital 2,653 (1,284) (4,140) (2,905) Total tax paid (458) (832) (1,019) (1,155) Other operating activities 1,682 908 1,917 1,772 Operating CF 10,172 5,717 4,354 5,934 Capital expenditure 487 (2,657) (783) (1,033) Chg in investments 1,898 0 0 0 Other investing activities 555 0 0 0 Investing CF 2,939 (2,657) (783) (1,033) Equity raised/(repaid) 0 0 0 0 Debt raised/(repaid) (5,865) 0 (1,000) (1,000) Dividend (incl. tax) 0 0 0 0 Other financing activities (3,261) (1,862) (1,717) (1,572) Financing CF (9,126) (1,862) (2,717) (2,572) Net chg in cash & bank bal. 3,985 1,197 855 2,328 Closing cash & bank bal 6,279 7,476 8,331 10,659
Source: Company, Kotak Securities – Private Client Research
Balance sheet (Rs mn)
(Year-end March) FY18 FY19E FY20E FY21E
Cash & Bank balances 6,279 7,476 8,331 10,659 Other Current assets 33,251 42,933 43,891 47,593 Investments 4,876 4,876 4,876 4,876 Net fixed assets 30,602 29,803 27,065 24,496 Other non-current assets 1,924 1,924 1,924 1,924 Total assets 76,933 87,012 86,087 89,548 Current liabilities 31,546 39,944 36,762 37,559 Borrowings 12,847 12,843 11,843 10,843 Other non-current liabilities 3,433 3,433 3,433 3,433 Total liabilities 47,827 56,220 52,039 51,835 Share capital 1,326 1,326 1,326 1,326 Reserves & surplus 27,214 29,050 32,307 35,971 Shareholders' funds 28,540 30,376 33,633 37,297 Minority interest 566 416 416 416 Total equity & liabilities 76,933 87,012 86,087 89,548
Source: Company, Kotak Securities – Private Client Research Ratio Analysis
(Year-end March) FY18 FY19E FY20E FY21E
Profitability and return ratios (%) EBITDAM 9.0 6.9 8.3 8.4 EBITM 4.0 3.4 4.9 5.0 NPM 2.0 1.9 3.2 3.5 RoE 5.4 6.0 9.7 9.8 RoCE 6.7 7.1 10.0 9.9 Per share data (Rs) O/s shares 265.2 265.2 265.2 265.2 EPS 5.8 6.9 12.3 13.8 FDEPS 5.8 6.9 12.3 13.8 CEPS 20.1 20.0 25.6 27.4 BV 107.6 114.0 125.8 139.1 DPS 0.5 0.5 0.5 0.5 Valuation ratios (x) PE 22.9 19.1 10.7 9.6 P/BV 1.2 1.2 1.0 0.9 EV/EBITDA 5.6 5.5 4.2 3.6 EV/Sales 0.5 0.4 0.3 0.3 D/E (x) 0.4 0.4 0.4 0.3
Source: Company, Kotak Securities – Private Client Research
Kotak Securities – Private Client Research Please see the Disclosure/Disclaimer on the last page For Private Circulation 20
MARCH 28, 2019
RATING SCALE Definitions of ratings
BUY – We expect the stock to deliver more than 15% returns over the next 12 months
ADD – We expect the stock to deliver 5% - 15% returns over the next 12 months
REDUCE – We expect the stock to deliver -5% - +5% returns over the next 12 months
SELL – We expect the stock to deliver < -5% returns over the next 12 months
NR – Not Rated. Kotak Securities is not assigning any rating or price target to the stock.
The report has been prepared for information purposes only.
SUBSCRIBE – We advise investor to subscribe to the IPO.
RS – Rating Suspended. Kotak Securities has suspended the investment rating and price target for this stock, either because there is not a sufficient fundamental basis for determining, or there are legal, regulatory or policy constraints around publishing, an investment rating or target. The previous investment rating and price target, if any, are no longer in effect for this stock and should not be relied upon.
NA – Not Available or Not Applicable. The information is not available for display or is not applicable
NM – Not Meaningful. The information is not meaningful and is therefore excluded.
NOTE – Our target prices are with a 12-month perspective. Returns stated in the rating scale are our internal benchmark.
FUNDAMENTAL RESEARCH TEAM Rusmik Oza Arun Agarwal Amit Agarwal Nipun Gupta Deval Shah Head of Research Auto & Auto Ancillary Transportation, Paints, FMCG Information Tech, Midcap Research Associate [email protected] [email protected] [email protected] [email protected] [email protected] +91 22 6218 6441 +91 22 6218 6443 +91 22 6218 6439 +91 22 6218 6433 +91 22 6218 6423
Sanjeev Zarbade Ruchir Khare Jatin Damania Cyndrella Carvalho Ledo Padinjarathala, CFA Cap. Goods & Cons. Durables Cap. Goods & Cons. Durables Metals & Mining, Midcap Pharmaceuticals Research Associate [email protected] [email protected] [email protected] [email protected] [email protected] +91 22 6218 6424 +91 22 6218 6431 +91 22 6218 6440 +91 22 6218 6426 +91 22 6218 7021
Teena Virmani Sumit Pokharna Pankaj Kumar Krishna Nain K. Kathirvelu Construction, Cement, Buildg Mat Oil and Gas, Information Tech Midcap M&A, Corporate actions Support Executive [email protected] [email protected] [email protected] [email protected] [email protected] +91 22 6218 6432 +91 22 6218 6438 +91 22 6218 6434 +91 22 6218 7907 +91 22 6218 6427
TECHNICAL RESEARCH TEAM Shrikant Chouhan Amol Athawale Faisal Shaikh, FRM, CFTe Siddhesh Jain [email protected] [email protected] Research Associate Research Associate +91 22 6218 5408 +91 20 6620 3350 [email protected] [email protected] +91 22 62185499 +91 22 62185498
DERIVATIVES RESEARCH TEAM Sahaj Agrawal Malay Gandhi Prashanth Lalu Prasenjit Biswas, CMT, CFTe [email protected] [email protected] [email protected] [email protected] +91 79 6607 2231 +91 22 6218 6420 +91 22 6218 5497 +91 33 6625 9810
Kotak Securities – Private Client Research Please see the Disclosure/Disclaimer on the last page For Private Circulation 21
MARCH 28, 2019
Disclosure/Disclaimer Kotak Securities Limited established in 1994, is a subsidiary of Kotak Mahindra Bank Limited. Kotak Securities is one of India's largest brokerage and distribution house.
Kotak Securities Limited is a corporate trading and clearing member of Bombay Stock Exchange Limited (BSE), National Stock Exchange of India Limited (NSE), Metropolitan Stock Exchange of India Limited (MSE), National Commodity and Derivatives Exchange (NCDEX) and Multi Commodity Exchange (MCX). Our businesses include stock broking, services rendered in connection with distribution of primary market issues and financial products like mutual funds and fixed deposits, depository services and Portfolio Management.
Kotak Securities Limited is also a depository participant with National Securities Depository Limited (NSDL) and Central Depository Services (India) Limited (CDSL). Kotak Securities Limited is also registered with Insurance Regulatory and Development Authority as Corporate Agent for Kotak Mahindra Old Mutual Life Insurance Limited and is also a Mutual Fund Advisor registered with Association of Mutual Funds in India (AMFI). We are registered as a Research Analyst under SEBI (Research Analyst) Regulations, 2014.
We hereby declare that our activities were neither suspended nor we have defaulted with any stock exchange authority with whom we are registered in last five years. However SEBI, Exchanges and Depositories have conducted the routine inspection and based on their observations have issued advise/warning/deficiency letters/ or levied minor penalty on KSL for certain operational deviations. We have not been debarred from doing business by any Stock Exchange / SEBI or any other authorities; nor has our certificate of registration been cancelled by SEBI at any point of time.
We offer our research services to clients as well as our prospects.
This document is not for public distribution and has been furnished to you solely for your information and must not be reproduced or redistributed to any other person. Persons into whose possession this document may come are required to observe these restrictions.
This material is for the personal information of the authorized recipient, and we are not soliciting any action based upon it. This report is not to be construed as an offer to sell or the solicitation of an offer to buy any security in any jurisdiction where such an offer or solicitation would be illegal. It is for the general information of clients of Kotak Securities Ltd. It does not constitute a personal recommendation or take into account the particular investment objectives, financial situations, or needs of individual clients.
We have reviewed the report, and in so far as it includes current or historical information, it is believed to be reliable though its accuracy or completeness cannot be guaranteed. Neither Kotak Securities Limited, nor any person connected with it, accepts any liability arising from the use of this document. The recipients of this material should rely on their own investigations and take their own professional advice. Price and value of the investments referred to in this material may go up or down. Past performance is not a guide for future performance. Certain transactions -including those involving futures, options and other derivatives as well as non-investment grade securities - involve substantial risk and are not suitable for all investors. Reports based on technical analysis centers on studying charts of a stock's price movement and trading volume, as opposed to focusing on a company's fundamentals and as such, may not match with a report on a company's fundamentals.
Opinions expressed are our current opinions as of the date appearing on this material only. While we endeavor to update on a reasonable basis the information discussed in this material, there may be regulatory, compliance or other reasons that prevent us from doing so. Prospective investors and others are cautioned that any forward-looking statements are not predictions and may be subject to change without notice. Our proprietary trading and investment businesses may make investment decisions that are inconsistent with the recommendations expressed herein.
Kotak Securities Limited has two independent equity research groups: Institutional Equities and Private Client Group. This report has been prepared by the Private Client Group.
We and our affiliates/associates, officers, directors, and employees, Research Analyst(including relatives) worldwide may: (a) from time to time, have long or short positions in, and buy or sell the securities thereof, of company (ies) mentioned herein or (b) be engaged in any other transaction involving such securities and earn brokerage or other compensation or act as a market maker in the financial instruments of the subject company/company (ies) discussed herein or act as advisor or lender / borrower to such company (ies) or have other potential/material conflict of interest with respect to any recommendation and related information and opinions at the time of publication of Research Report or at the time of public appearance. Kotak Securities Limited (KSL) may have proprietary long/short position in the above mentioned scrip(s) and therefore may be considered as interested. The views provided herein are general in nature and does not consider risk appetite or investment objective of particular investor; readers are requested to take independent professional advice before investing. This should not be construed as invitation or solicitation to do business with KSL. Kotak Securities Limited is also a Portfolio Manager. Portfolio Management Team (PMS) takes its investment decisions independent of the PCG research and accordingly PMS may have positions contrary to the PCG research recommendation. Kotak Securities Limited does not provide any promise or assurance of favourable view for a particular industry or sector or business group in any manner. The investor is requested to take into consideration all the risk factors including their financial condition, suitability to risk return profile and take professional advice before investing.
The analyst for this report certifies that all of the views expressed in this report accurately reflect his or her personal views about the subject company or companies and its or their securities, and no part of his or her compensation was, is or will be, directly or indirectly related to specific recommendations or views expressed in this report.
No part of this material may be duplicated in any form and/or redistributed without Kotak Securities' prior written consent.
Details of Associates are available on www.kotak.com
1. “Note that the research analysts contributing to the research report may not be registered/qualified as research analysts with FINRA; and 2. Such research analysts may not be associated persons of Kotak Mahindra Inc and therefore, may not be subject to NASD Rule 2711 restrictions on communications
with a subject company, public appearances and trading securities held by a research analyst account Any U.S. recipients of the research who wish to effect transactions in any security covered by the report should do so with or through Kotak Mahindra Inc. (Member FINRA/SIPC) and (ii) any transactions in the securities covered by the research by U.S. recipients must be effected only through Kotak Mahindra Inc. (Member FINRA/SIPC)at 369 Lexington Avenue 28th Floor NY NY 10017 USA (Tel:+1 212-600-8850).
Kotak Securities Limited and its non US affiliates may, to the extent permissible under applicable laws, have acted on or used this research to the extent that it relates to non US issuers, prior to or immediately following its publication. This material should not be construed as an offer to sell or the solicitation of an offer to buy any security in any jurisdiction where such an offer or solicitation would be illegal. This research report and its respective contents do not constitute an offer or invitation to purchase or subscribe for any securities or solicitation of any investments or investment services. Accordingly, any brokerage and investment services including the products and services described are not available to or intended for Canadian persons or US persons.”
Research Analyst has served as an officer, director or employee of subject company(ies): No
We or our associates may have received compensation from the subject company(ies) in the past 12 months.
We or our associates have managed or co-managed public offering of securities for the subject company(ies) in the past 12 months: No
We or our associates may have received compensation for investment banking or merchant banking or brokerage services from the subject company(ies) in the past 12 months. We or our associates may have received any compensation for products or services other than investment banking or merchant banking or brokerage services from the subject company(ies) in the past 12 months. We or our associates may have received compensation or other benefits from the subject company(ies) or third party in connection with the research report. Our associates may have financial interest in the subject company(ies).
Research Analyst or his/her relative's financial interest in the subject company(ies): No
Kotak Securities Limited has financial interest in the subject company(ies) at the end of the month immediately preceding the date of publication of Research Report: No
Nature of financial interest is holding of equity shares or derivatives of the subject company.
Our associates may have actual/beneficial ownership of 1% or more securities of the subject company(ies) at the end of the month immediately preceding the date of publication of Research Report.
Research Analyst or his/her relatives has actual/beneficial ownership of 1% or more securities of the subject company(ies) at the end of the month immediately preceding the date of publication of Research Report: No.
Kotak Securities Limited has actual/beneficial ownership of 1% or more securities of the subject company(ies) at the end of the month immediately preceding the date of publication of Research Report: No
By referring to any particular sector, Kotak Securities Limited does not provide any promise or assurance of favourable view for a particular industry or sector or business group in any manner. The investor is requested to take into consideration all the risk factors including their financial condition, suitability to risk return profile and take professional advice before investing. Such representations are not indicative of future results.
Subject company(ies) may have been client during twelve months preceding the date of distribution of the research report.

Kotak Securities – Private Client Research Please see the Disclosure/Disclaimer on the last page For Private Circulation 22
MARCH 28, 2019
"A graph of daily closing prices of securities is available at https://www.nseindia.com/ChartApp/install/charts/mainpage.jsp and http://economictimes.indiatimes.com/markets/stocks/stock-quotes. (Choose a company from the list on the browser and select the "three years" icon in the price chart)."
Kotak Securities Limited. Registered Office: 27 BKC, C 27, G Block, Bandra Kurla Complex, Bandra (E), Mumbai 400051. CIN: U99999MH1994PLC134051, Telephone No.: +22 43360000, Fax No.: +22 67132430. Website: www.kotak.com/www.kotaksecurities.com. Correspondence Address: Infinity IT Park, Bldg. No 21, Opp. Film City Road, A K Vaidya Marg, Malad (East), Mumbai 400097. Telephone No: 42856825. SEBI Registration No: INZ000200137 (Member of NSE, BSE, MSE, MCX & NCDEX), AMFI ARN 0164, PMS INP000000258 and Research Analyst INH000000586. NSDL/CDSL: IN-DP-NSDL-23-97. Our research should not be considered as an advertisement or advice, professional or otherwise. The investor is requested to take into consideration all the risk factors including their financial condition, suitability to risk return profile and the like and take professional advice before investing. Investments in securities market are subject to market risks, read all the related documents carefully before investing. Derivatives are a sophisticated investment device. The investor is requested to take into consideration all the risk factors before actually trading in derivative contracts. Compliance Officer Details: Mr. Manoj Agarwal. Call: 022 - 4285 8484, or Email: [email protected].
In case you require any clarification or have any concern, kindly write to us at below email ids:
Level 1: For Trading related queries, contact our customer service at '[email protected]' and for demat account related queries contact us at [email protected] or call us on: Toll free numbers 18002099191 / 1860 266 9191
Level 2: If you do not receive a satisfactory response at Level 1 within 3 working days, you may write to us at [email protected] or call us on 022-42858445 and if you feel you are still unheard, write to our customer service HOD at [email protected] or call us on 022-42858208.
Level 3: If you still have not received a satisfactory response at Level 2 within 3 working days, you may contact our Compliance Officer (Mr. Manoj Agarwal) at [email protected] or call on 91- (022) 4285 8484.
Level 4: If you have not received a satisfactory response at Level 3 within 7 working days, you may also approach CEO (Mr. Kamlesh Rao) at [email protected] or call on 91- (022) 4285 8301.