Smart Grid Tutorial - Office of Technology Services...
66
Department of Chemical and Biological Engineering Department of Chemical and Biological Engineering Illinois Institute of Technology Illinois Institute of Technology Smart Grid Tutorial: Smart Grid Tutorial: What? Why? How? What? Why? How? and Who? and Who? Donald J. Chmielewski Associate Professor Department of Chemical and Biological Engineering Illinois Institute of Technology
Transcript of Smart Grid Tutorial - Office of Technology Services...
Department of Chemical and Biological EngineeringDepartment of Chemical and Biological Engineering
Illinois Institute of TechnologyIllinois Institute of Technology
Smart Grid Tutorial: Smart Grid Tutorial: What? Why? How?What? Why? How? and Who?and Who?
Donald J. Chmielewski
Associate Professor Department of Chemical and Biological Engineering
Illinois Institute of Technology

Department of Chemical and Biological EngineeringDepartment of Chemical and Biological Engineering
Illinois Institute of TechnologyIllinois Institute of Technology
Presentation OutlinePresentation Outline
What is the smart grid?
Why would the chemical industry be interested?
How does one participate in the smart grid?
Who should participate in the smart grid?
2

Department of Chemical and Biological EngineeringDepartment of Chemical and Biological Engineering
Illinois Institute of TechnologyIllinois Institute of Technology
What is the Smart Grid?What is the Smart Grid?
A smart grid is an electrical grid that uses information and
communications technology to gather and act on information,
such as information about the behaviors of suppliers and
consumers, in an automated fashion to improve the efficiency,
reliability, economics, and sustainability of the production and
distribution of electricity.
Wikipedia:
3

Department of Chemical and Biological EngineeringDepartment of Chemical and Biological Engineering
Illinois Institute of TechnologyIllinois Institute of Technology
What is the Smart Grid?What is the Smart Grid?
The electric industry is poised to make the transformation
from a centralized, producer-controlled network to one that is
less centralized and more consumer interactive.
The move to a smarter grid promises to change the
industry’s entire business model and its relationship with
all stakeholders, involving and affecting utilities, regulators,
energy service providers, technology and automation vendors
and all consumers of electric power.
DOE Smart Grid Primer:
4
Department of Chemical and Biological EngineeringDepartment of Chemical and Biological Engineering
Illinois Institute of TechnologyIllinois Institute of Technology
What is the Smart Grid?What is the Smart Grid?
By integrating an end-to-end, advanced communications
infrastructure into the electric power system, a Smart Grid can
provide consumers near real-time information on their energy
use, support pricing that reflects changes in supply and
demand, and enable smart appliances and devices to help
consumers avoid higher energy bills.
NIST SMART GRID COLLABORATION WIKI:
5

Department of Chemical and Biological EngineeringDepartment of Chemical and Biological Engineering
Illinois Institute of TechnologyIllinois Institute of Technology
What is the Smart Grid?What is the Smart Grid?
6

Department of Chemical and Biological EngineeringDepartment of Chemical and Biological Engineering
Illinois Institute of TechnologyIllinois Institute of Technology
What is the Smart Grid?What is the Smart Grid?
7
Department of Chemical and Biological EngineeringDepartment of Chemical and Biological Engineering
Illinois Institute of TechnologyIllinois Institute of Technology
8
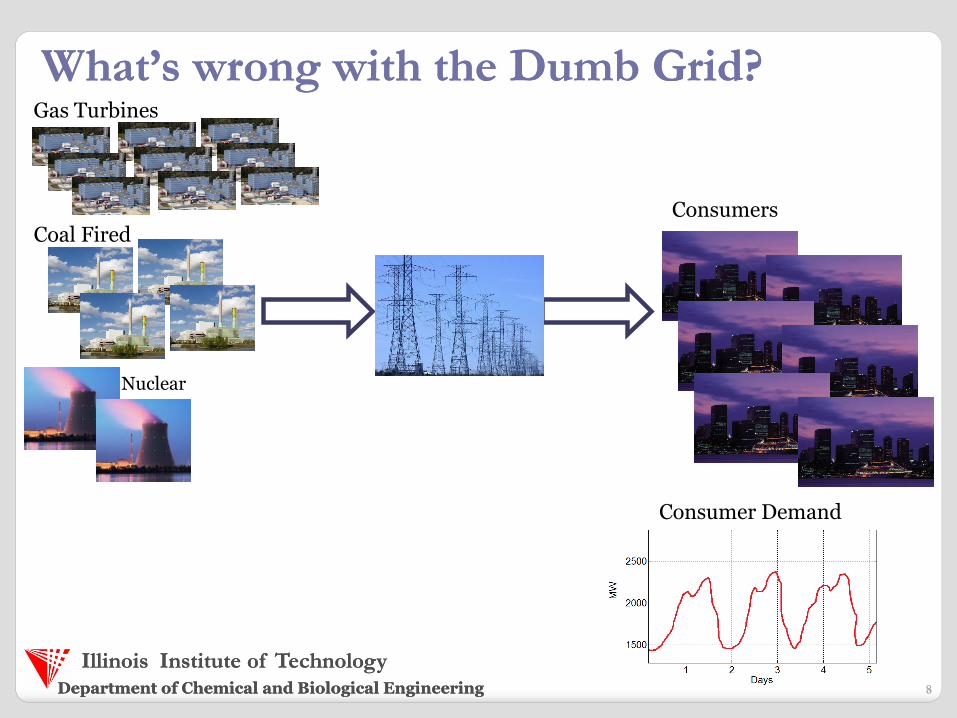
Gas Turbines
Coal Fired
Nuclear
What’s wrongWhat’s wrong with the Dumb Gridwith the Dumb Grid??
Consumer Demand
Consumers

Department of Chemical and Biological EngineeringDepartment of Chemical and Biological Engineering
Illinois Institute of TechnologyIllinois Institute of Technology
9
Gas Turbines
Coal Fired
Nuclear
What’s wrongWhat’s wrong with the Dumb Gridwith the Dumb Grid??
Consumer Demand
Consumers
If demand is low then few generators
needed

Department of Chemical and Biological EngineeringDepartment of Chemical and Biological Engineering
Illinois Institute of TechnologyIllinois Institute of Technology
10
Gas Turbines
Coal Fired
Nuclear
What’s wrongWhat’s wrong with the Dumb Gridwith the Dumb Grid??
Consumer Demand
Consumers
If demand is high then many generators
needed
Department of Chemical and Biological EngineeringDepartment of Chemical and Biological Engineering
Illinois Institute of TechnologyIllinois Institute of Technology
11
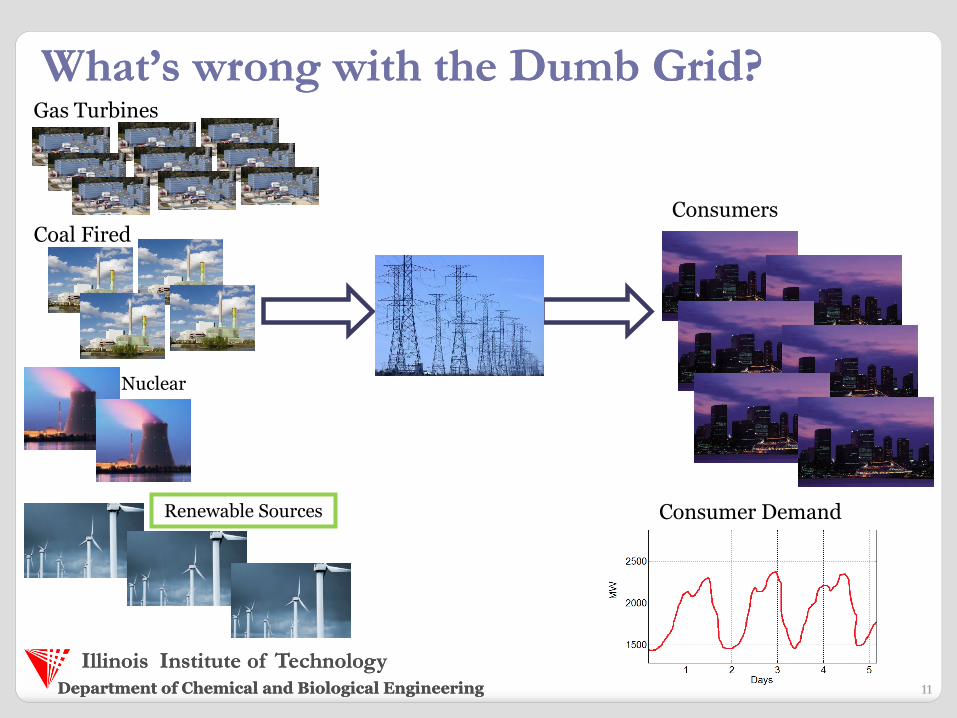
Gas Turbines
Coal Fired
Nuclear
What’s wrongWhat’s wrong with the Dumb Gridwith the Dumb Grid??
Consumer Demand
Consumers
Renewable Sources
Department of Chemical and Biological EngineeringDepartment of Chemical and Biological Engineering
Illinois Institute of TechnologyIllinois Institute of Technology
12
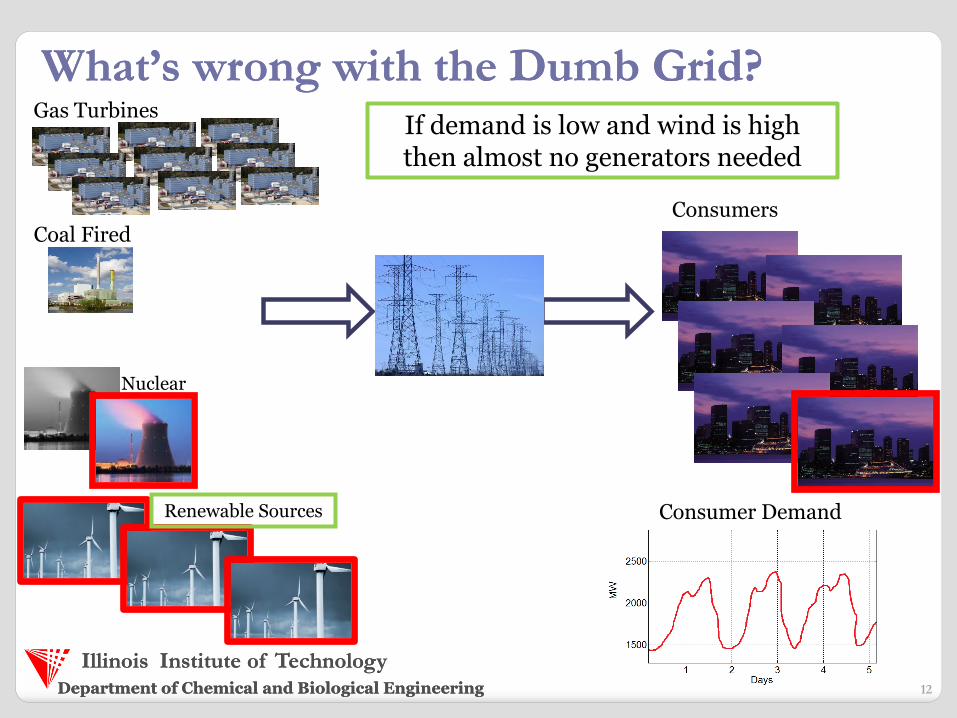
Gas Turbines
Coal Fired
Nuclear
What’s wrongWhat’s wrong with the Dumb Gridwith the Dumb Grid??
Consumer Demand
Consumers
If demand is low and wind is high then almost no generators needed
Renewable Sources

Department of Chemical and Biological EngineeringDepartment of Chemical and Biological Engineering
Illinois Institute of TechnologyIllinois Institute of Technology
13
Gas Turbines
Coal Fired
Nuclear
What’s wrongWhat’s wrong with the Dumb Gridwith the Dumb Grid??
Consumer Demand
Consumers
If demand is high and wind is low then all generators needed
Renewable Sources

Department of Chemical and Biological EngineeringDepartment of Chemical and Biological Engineering
Illinois Institute of TechnologyIllinois Institute of Technology
14
Gas Turbines
Coal Fired
Nuclear
SomeSome Solutions to the Solutions to the DispatchDispatch ProblemProblem
Consumer Demand
Consumers
Renewable Sources
Massive Energy Storage
Consumer Flexibility
Advanced Communication Network
The Smart Grid

Department of Chemical and Biological EngineeringDepartment of Chemical and Biological Engineering
Illinois Institute of TechnologyIllinois Institute of Technology
Presentation OutlinePresentation Outline
What is the smart grid?
Why would the chemical industry be interested?
How does one participate in the smart grid?
Who should participate in the smart grid?
15

Department of Chemical and Biological EngineeringDepartment of Chemical and Biological Engineering
Illinois Institute of TechnologyIllinois Institute of Technology
MotivatingMotivating ConsumerConsumer FlexibilityFlexibility
16

Department of Chemical and Biological EngineeringDepartment of Chemical and Biological Engineering
Illinois Institute of TechnologyIllinois Institute of Technology
17
Consumers
Consumers
Consumers
Centralized Power Systems Centralized Power Systems Gas Turbines
Coal Fired
Nuclear
Renewables
Electric Utility

Department of Chemical and Biological EngineeringDepartment of Chemical and Biological Engineering
Illinois Institute of TechnologyIllinois Institute of Technology
18
Consumers
Consumers
Consumers
DeregulatedDeregulated Power SystemsPower Systems Gas Turbines
Coal Fired
Nuclear
Renewables
I S O
Independent System Operator
Department of Chemical and Biological EngineeringDepartment of Chemical and Biological Engineering
Illinois Institute of TechnologyIllinois Institute of Technology
19
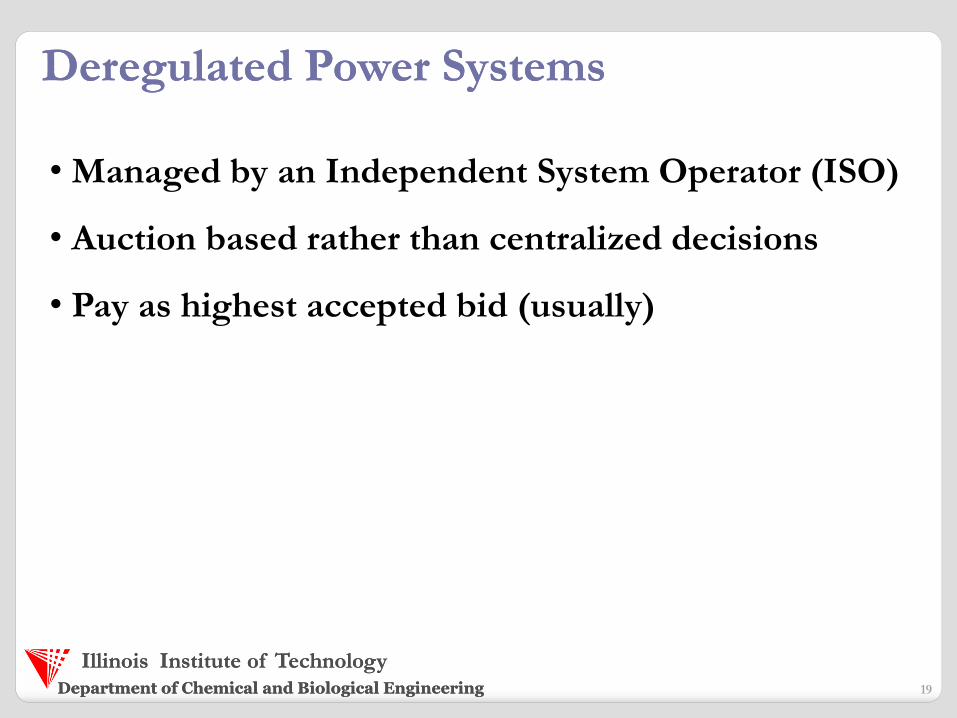
• Managed by an Independent System Operator (ISO)
• Auction based rather than centralized decisions
• Pay as highest accepted bid (usually)
Deregulated Power SystemsDeregulated Power Systems

Department of Chemical and Biological EngineeringDepartment of Chemical and Biological Engineering
Illinois Institute of TechnologyIllinois Institute of Technology
20
Cost of Power GenerationCost of Power Generation
0 200 400 600 800 10000
10
20
30
40
50
Power Output (MW)
Op
erati
ng C
ost
s ($
/hr)
Coal Plant
Gas Turbine

Department of Chemical and Biological EngineeringDepartment of Chemical and Biological Engineering
Illinois Institute of TechnologyIllinois Institute of Technology
21
Price of ElectricityPrice of Electricity
0 200 400 600 800 10000
10
20
30
40
50
Power Output (MW)
Ele
ctr
icit
y P
ric
e (
$/M
Wh
r)
Coal Plant
Gas Turbine
If demand
is 600MW
then, electricity
price is $18/MW-hr

Department of Chemical and Biological EngineeringDepartment of Chemical and Biological Engineering
Illinois Institute of TechnologyIllinois Institute of Technology
22
Price of ElectricityPrice of Electricity
0 200 400 600 800 10000
10
20
30
40
50
Power Output (MW)
Ele
ctr
icit
y P
ric
e (
$/M
Wh
r)
Coal Plant
Gas Turbine
If demand
is 1200MW
then, electricity
price is $33/MW-hr

Department of Chemical and Biological EngineeringDepartment of Chemical and Biological Engineering
Illinois Institute of TechnologyIllinois Institute of Technology
23
RealReal--time Pricing for Electricity time Pricing for Electricity
PJM Western Hub, Day-Ahead prices: June 1, 2001 through June 20, 2001,
http://www.pjm.com/markets-and-operations/energy/day-ahead/day-ahead-historical.aspx
0 2 4 6 8 10 12 14 16 18 200
20
40
60
80
time (days)
En
erg
y V
alu
e
($/M
Wh
r)
6 6.5 7 7.5 8 8.5 9 9.5 100
20
40
time (days)
En
erg
y V
alu
e
($/M
Wh
r)

Department of Chemical and Biological EngineeringDepartment of Chemical and Biological Engineering
Illinois Institute of TechnologyIllinois Institute of Technology
24
RealReal--time Pricing for Electricity time Pricing for Electricity
Texas Hub: July 2012
0 2 4 6 8 10 12 14 16 18 20 22 24 26 28 30
20
40
60
80
Time (days)
Ele
ctri
city
Pri
ce (
$/M
Wh
r)
0 2 4 6 8 10 12 14 16 18 20 22 24 26 28 30
500
1000
1500
2000
Time (days)
Ele
ctri
city
Pri
ce (
$/M
Wh
r)

Department of Chemical and Biological EngineeringDepartment of Chemical and Biological Engineering
Illinois Institute of TechnologyIllinois Institute of Technology
25
Consumers
Consumers
Consumers
LoadLoad--Serving Entity Serving Entity Gas Turbines
Coal Fired
Nuclear
Renewables
I S O
LSE
LSE
LSE
Electricity price to consumers is the annual average
Department of Chemical and Biological EngineeringDepartment of Chemical and Biological Engineering
Illinois Institute of TechnologyIllinois Institute of Technology
26
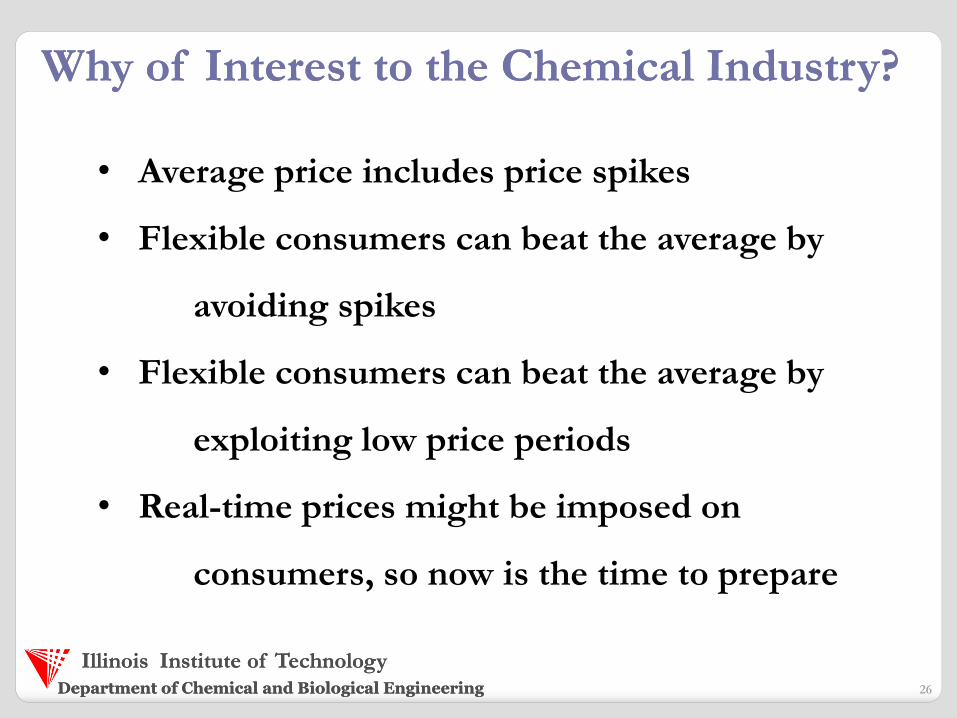
• Average price includes price spikes
• Flexible consumers can beat the average by
avoiding spikes
• Flexible consumers can beat the average by
exploiting low price periods
• Real-time prices might be imposed on
consumers, so now is the time to prepare
Why ofWhy of Interest to theInterest to the Chemical Industry?Chemical Industry?
Department of Chemical and Biological EngineeringDepartment of Chemical and Biological Engineering
Illinois Institute of TechnologyIllinois Institute of Technology
Presentation OutlinePresentation Outline
What is the smart grid?
Why would the chemical industry be interested?
How does one participate in the smart grid?
Who should participate in the smart grid?
27

Department of Chemical and Biological EngineeringDepartment of Chemical and Biological Engineering
Illinois Institute of TechnologyIllinois Institute of Technology
Presentation OutlinePresentation Outline
What is the smart grid?
Why would the chemical industry be interested?
How does one participate in the smart grid?
Power Generation Example
HVAC Example
Chemical Plant Example
Who should participate in the smart grid?
28

Department of Chemical and Biological EngineeringDepartment of Chemical and Biological Engineering
Illinois Institute of TechnologyIllinois Institute of Technology
Integrated Gasification Combined CycleIntegrated Gasification Combined Cycle
29
Department of Chemical and Biological EngineeringDepartment of Chemical and Biological Engineering
Illinois Institute of TechnologyIllinois Institute of Technology
30
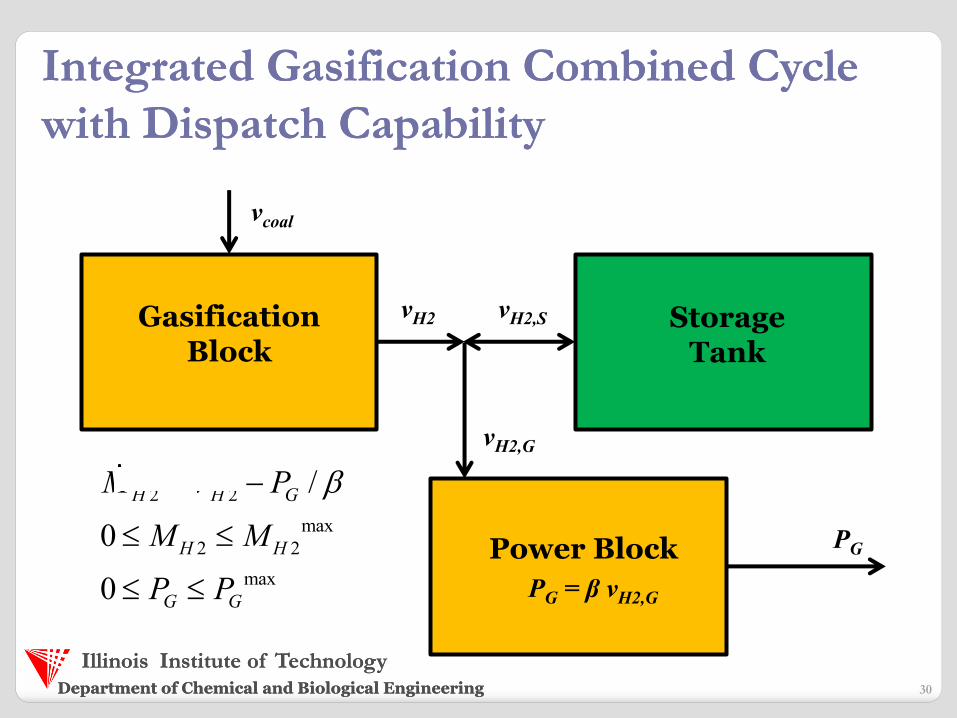
Integrated Gasification Combined Cycle Integrated Gasification Combined Cycle
with Dispatch Capability with Dispatch Capability
Storage Tank
vH2,S Gasification Block
PG Power Block
vH2,G
vcoal
vH2
2 2
max
2 2
max
/
0
0
H H G
H H
G G
M P
M M
P P
PG = β vH2,G

Department of Chemical and Biological EngineeringDepartment of Chemical and Biological Engineering
Illinois Institute of TechnologyIllinois Institute of Technology
Economic Model Predictive Control Economic Model Predictive Control
,
min max
min g , ,
. . ( , , )
( , , )
( )
t T
x ut
x u w d
s t x f x u w
z h x u w
z z z
, ,g x u w
Economic Objective
- (Instantaneous Profit)
Department of Chemical and Biological EngineeringDepartment of Chemical and Biological Engineering
Illinois Institute of TechnologyIllinois Institute of Technology
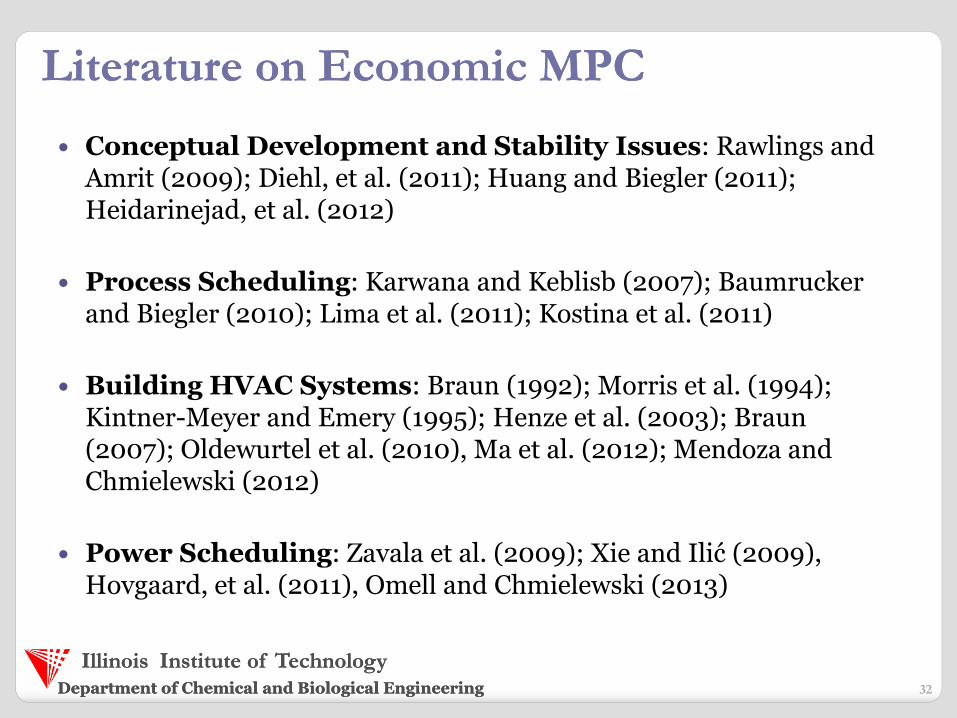
Literature on EconomicLiterature on Economic MPCMPC
32
Conceptual Development and Stability Issues: Rawlings and Amrit (2009); Diehl, et al. (2011); Huang and Biegler (2011); Heidarinejad, et al. (2012)
Process Scheduling: Karwana and Keblisb (2007); Baumrucker and Biegler (2010); Lima et al. (2011); Kostina et al. (2011)
Building HVAC Systems: Braun (1992); Morris et al. (1994); Kintner-Meyer and Emery (1995); Henze et al. (2003); Braun (2007); Oldewurtel et al. (2010), Ma et al. (2012); Mendoza and Chmielewski (2012)
Power Scheduling: Zavala et al. (2009); Xie and Ilić (2009), Hovgaard, et al. (2011), Omell and Chmielewski (2013)

Department of Chemical and Biological EngineeringDepartment of Chemical and Biological Engineering
Illinois Institute of TechnologyIllinois Institute of Technology
EMPC Applied to IGCC with Dispatch EMPC Applied to IGCC with Dispatch
2 2
max
2 2
max
min
. . /
0
0
G
t T
e GP
t
H H G
H H
G G
C P d
s t M P
M M
P P
( )eC t is the cost (or value) of electricity
33

Department of Chemical and Biological EngineeringDepartment of Chemical and Biological Engineering
Illinois Institute of TechnologyIllinois Institute of Technology
34
EMPC Applied to IGCC withEMPC Applied to IGCC with DispatchDispatch
0 1 2 3 4 5 6 7 8 9 100
20
40
Energ
y V
alu
e
($/M
Whr)
0 1 2 3 4 5 6 7 8 9 100
500
1000
1500
Genera
ted P
ow
er
(MW
)
0 1 2 3 4 5 6 7 8 9 100
500
1000
Time (days)
H2 in
Sto
rage (
tonnes)

Department of Chemical and Biological EngineeringDepartment of Chemical and Biological Engineering
Illinois Institute of TechnologyIllinois Institute of Technology
Presentation OutlinePresentation Outline
What is the smart grid?
Why would the chemical industry be interested?
How does one participate in the smart grid?
Power Generation Example
HVAC Example
Chemical Plant Example
Who should participate in the smart grid?
35
Department of Chemical and Biological EngineeringDepartment of Chemical and Biological Engineering
Illinois Institute of TechnologyIllinois Institute of Technology
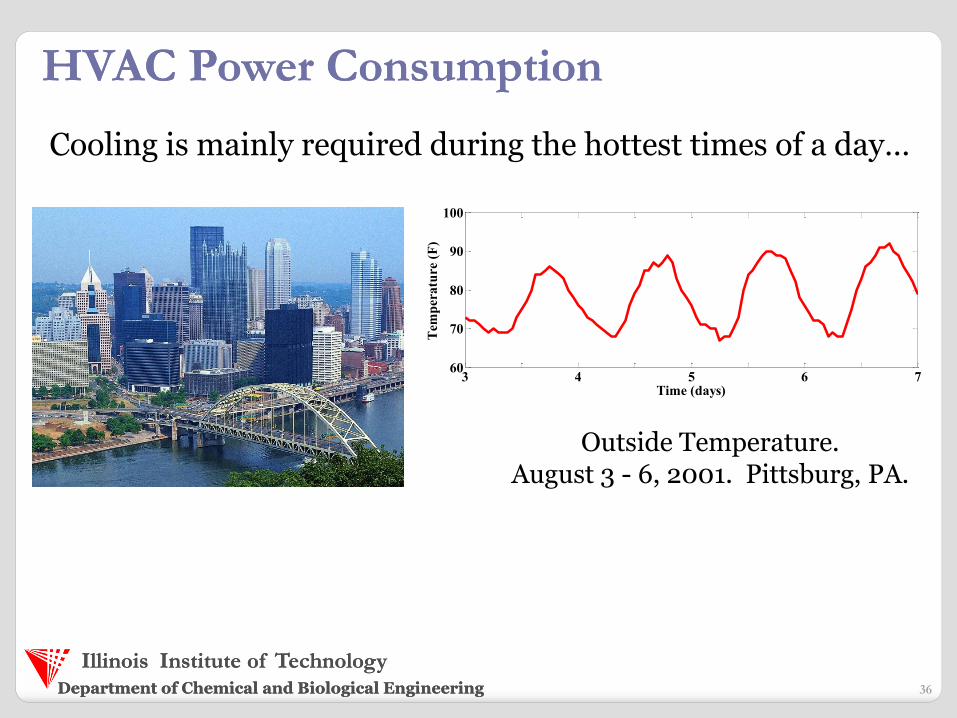
HVAC Power ConsumptionHVAC Power Consumption
Cooling is mainly required during the hottest times of a day…
Outside Temperature. August 3 - 6, 2001. Pittsburg, PA.
3 4 5 6 760
70
80
90
100
Time (days)
Tem
per
atu
re (
F)
36

Department of Chemical and Biological EngineeringDepartment of Chemical and Biological Engineering
Illinois Institute of TechnologyIllinois Institute of Technology
Traditional HVAC SystemTraditional HVAC System
Heat from
BuildingBuilding
Heat from
Environment
Power
Consumption Chiller
• Heat is removed from the building by a chiller
• Chiller consumes electric power
• Heat removal correlated with real-time electricity prices
37

Department of Chemical and Biological EngineeringDepartment of Chemical and Biological Engineering
Illinois Institute of TechnologyIllinois Institute of Technology
Correlation Between Cooling Load and Correlation Between Cooling Load and
Energy Prices Energy Prices
3 4 5 6
70
80
90
Time (hours)
Tem
per
atu
re (
F)
3 4 5 60
50
100
150
Time (days)
Ele
ctri
city
Pri
ce (
$/M
Wh
r)
August 3 - 6, 2001. Pittsburg, PA.
38

Department of Chemical and Biological EngineeringDepartment of Chemical and Biological Engineering
Illinois Institute of TechnologyIllinois Institute of Technology
Thermal Energy Storage (TES)Thermal Energy Storage (TES)
TES helps time
shift electricity
consumption to
periods of low
electricity prices.
39

Department of Chemical and Biological EngineeringDepartment of Chemical and Biological Engineering
Illinois Institute of TechnologyIllinois Institute of Technology
Impact of ThermalImpact of Thermal Energy StorageEnergy Storage
Heat from
BuildingBuilding
Heat from
Environment
Power
Consumption Chiller
Heat to
TES
Thermal
Energy Storage
Heat to
Chiller
Heat from
BuildingBuilding
Heat from
Environment
Power
Consumption Chiller
Heat to
Chiller
23 24 25 26
200
300
400
500
600
Chiller Cooling Load (Qc)
Time (days)
Hea
t F
low
(K
We)
Qc
Qr
23 24 25 26
200
300
400
500
600
Chiller Cooling Load (Qc)
Time (days)H
eat
Flo
w (
KW
e)
Qc
Qr
23 24 25 26
2000
4000
6000
Time (days)
Hea
t F
low
(K
We)
Heat to Chiller Heat from Room
Heat from
BuildingBuilding
Heat from
Environment
Power
Consumption Chiller
Heat to
TES
Thermal Energy Storage
Heat to
Chiller
23 24 25 26
200
300
400
500
600
Chiller Cooling Load (Qc)
Time (days)
Hea
t F
low
(K
We)
Qc
Qr
40

Department of Chemical and Biological EngineeringDepartment of Chemical and Biological Engineering
Illinois Institute of TechnologyIllinois Institute of Technology
EMPC SimulationEMPC Simulation with TESwith TES
41
0 20 40 60 80 100 120 14020
30
40
Time (hours)
Ou
tsid
e
Tem
peratu
re (
C)
0 20 40 60 80 100 120 140
40
60
80
100
120
140
Time (hours)
Ele
ctr
icit
y
Pric
e (
$/M
Wh
r)
0 20 40 60 80 100 120 140
0
200
400
600
Time (hours)
Hea
t to
C
hil
ler (
kW
T)
0 20 40 60 80 100 120 140
-2000
-1000
0
Time (hours)
En
erg
y i
n
Sto
ra
ge (
MW
hr T
)
0 20 40 60 80 100 120 140
0
200
400
600
800
Time (hours)H
ea
t fr
om
R
oo
m (
kW
T)
0 20 40 60 80 100 120 14020
22
24
26
Time (hours)
Tem
peratu
re
in R
oom
(C
)
Heat from
BuildingBuilding
Heat from
Environment
Power
Consumption Chiller
Heat to
TES
Thermal
Energy Storage
Heat to
Chiller Note: EMPC Prediction Horizon is
12 hours
Department of Chemical and Biological EngineeringDepartment of Chemical and Biological Engineering
Illinois Institute of TechnologyIllinois Institute of Technology
Presentation OutlinePresentation Outline
What is the smart grid?
Why would the chemical industry be interested?
How does one participate in the smart grid?
Who should participate in the smart grid?
42
Department of Chemical and Biological EngineeringDepartment of Chemical and Biological Engineering
Illinois Institute of TechnologyIllinois Institute of Technology
WhoWho should participate in the Smart Grid?should participate in the Smart Grid?
Those with revenue gains larger
than investment costs!
43

Department of Chemical and Biological EngineeringDepartment of Chemical and Biological Engineering
Illinois Institute of TechnologyIllinois Institute of Technology
Impact of ThermalImpact of Thermal Energy StorageEnergy Storage
Heat from
BuildingBuilding
Heat from
Environment
Power
Consumption Chiller
Heat to
TES
Thermal
Energy Storage
Heat to
Chiller
Heat from
BuildingBuilding
Heat from
Environment
Power
Consumption Chiller
Heat to
Chiller
23 24 25 26
200
300
400
500
600
Chiller Cooling Load (Qc)
Time (days)
Hea
t F
low
(K
We)
Qc
Qr
23 24 25 26
200
300
400
500
600
Chiller Cooling Load (Qc)
Time (days)H
eat
Flo
w (
KW
e)
Qc
Qr
23 24 25 26
2000
4000
6000
Time (days)
Hea
t F
low
(K
We)
Heat to Chiller Heat from Room
Heat from
BuildingBuilding
Heat from
Environment
Power
Consumption Chiller
Heat to
TES
Thermal Energy Storage
Heat to
Chiller
23 24 25 26
200
300
400
500
600
Chiller Cooling Load (Qc)
Time (days)
Hea
t F
low
(K
We)
Qc
Qr

Department of Chemical and Biological EngineeringDepartment of Chemical and Biological Engineering
Illinois Institute of TechnologyIllinois Institute of Technology
Capital Cost of Thermal Energy StorageCapital Cost of Thermal Energy Storage
45
??$$$
Department of Chemical and Biological EngineeringDepartment of Chemical and Biological Engineering
Illinois Institute of TechnologyIllinois Institute of Technology
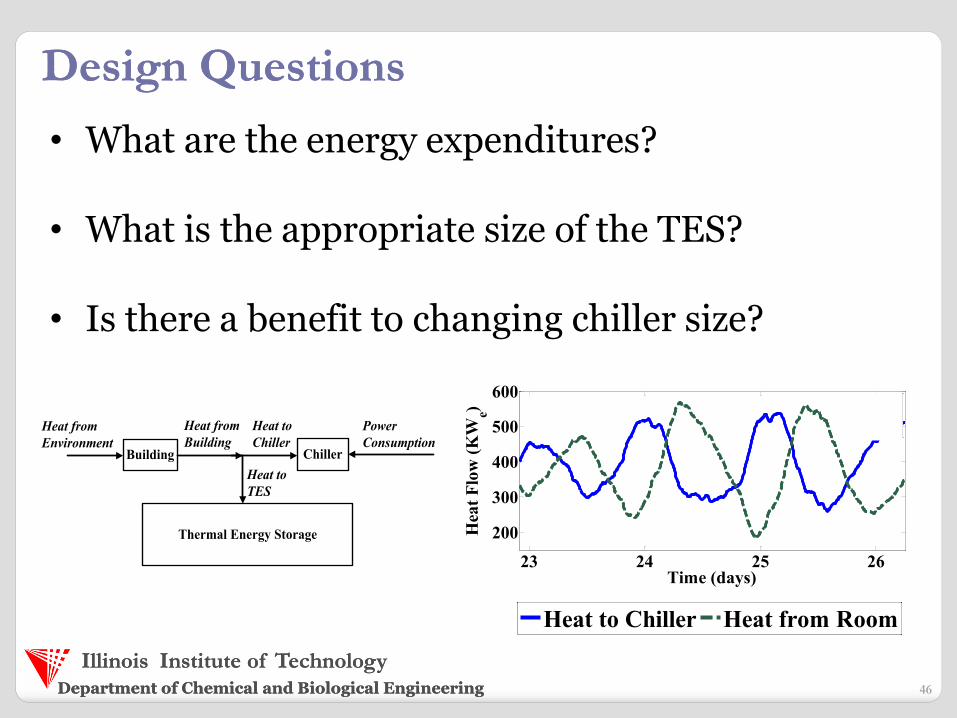
Design Questions Design Questions
• What are the energy expenditures?
• What is the appropriate size of the TES?
• Is there a benefit to changing chiller size?
Heat from
BuildingBuilding
Heat from
Environment
Power
Consumption Chiller
Heat to
TES
Thermal Energy Storage
Heat to
Chiller
23 24 25 26
200
300
400
500
600
Chiller Cooling Load (Qc)
Time (days)
Hea
t F
low
(K
We)
Qc
Qr
23 24 25 26
2000
4000
6000
Time (days)
Hea
t F
low
(K
We)
Heat to Chiller Heat from Room
46

Department of Chemical and Biological EngineeringDepartment of Chemical and Biological Engineering
Illinois Institute of TechnologyIllinois Institute of Technology
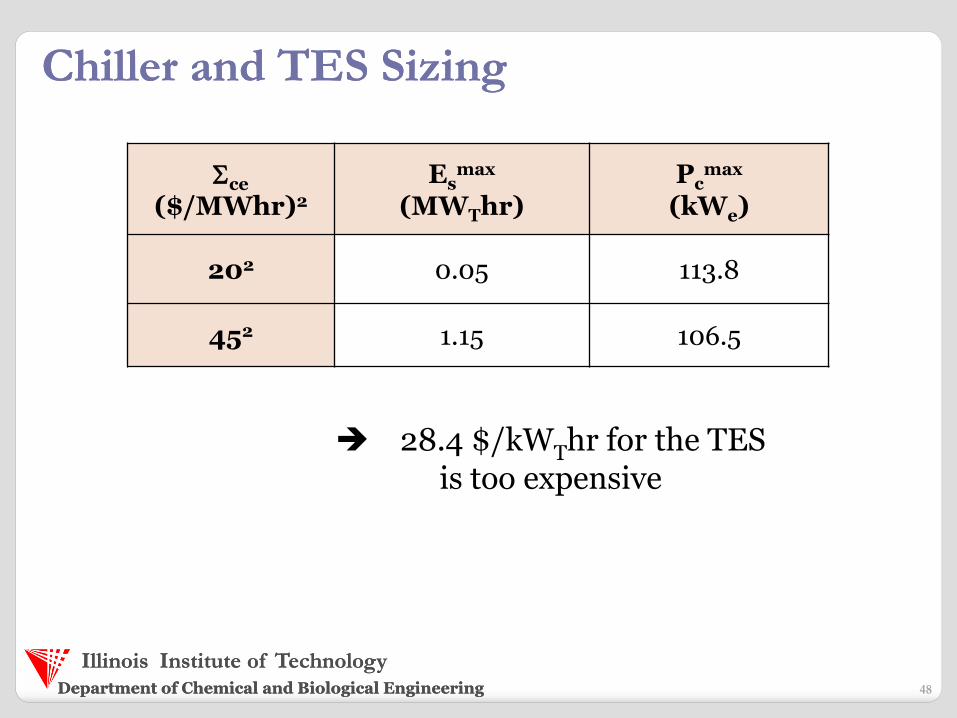
Equipment costs: Chiller: Cc = 500 $/kWe TES: Cs = 28.4 $/kWThr
Present value parameters:
ri = 7% n = 30yrs
nii
frr
PV)1(
11
124365
47
Chiller and TES Sizing Chiller and TES Sizing
Department of Chemical and Biological EngineeringDepartment of Chemical and Biological Engineering
Illinois Institute of TechnologyIllinois Institute of Technology
Sce
($/MWhr)2 Es
max (MWThr)
Pcmax
(kWe)
202 0.05 113.8
452 1.15 106.5
48
28.4 $/kWThr for the TES is too expensive
Chiller and TES Sizing Chiller and TES Sizing

Department of Chemical and Biological EngineeringDepartment of Chemical and Biological Engineering
Illinois Institute of TechnologyIllinois Institute of Technology
Hot Oil Utility
P1
P2
P3
P4
Hot Oil Based
Utility Plant
Electric Grid
Utility Plant Configuration Utility Plant Configuration
49

Department of Chemical and Biological EngineeringDepartment of Chemical and Biological Engineering
Illinois Institute of TechnologyIllinois Institute of Technology
Hot Oil Utility PlantHot Oil Utility Plant
50
Furnace
Hot Utility Oil
(to the process)
Fuel
Cold Utility Oil
(from the process)

Department of Chemical and Biological EngineeringDepartment of Chemical and Biological Engineering
Illinois Institute of TechnologyIllinois Institute of Technology
Utility Plant with Electric Power OptionUtility Plant with Electric Power Option
51
Electric
Heater
Furnace
Hot Utility Oil
(to the process)
Fuel
Cold Utility Oil
(from the process)
Electric Power
(from the grid)

Department of Chemical and Biological EngineeringDepartment of Chemical and Biological Engineering
Illinois Institute of TechnologyIllinois Institute of Technology
Energy Costs in 2005Energy Costs in 2005
52
0 100 200 300
0
50
100
150
Day ofthe Year
En
erg
y C
ost
($
/MW
hr)
Energy Costs 2005
Electricity
Natural Gas
Department of Chemical and Biological EngineeringDepartment of Chemical and Biological Engineering
Illinois Institute of TechnologyIllinois Institute of Technology
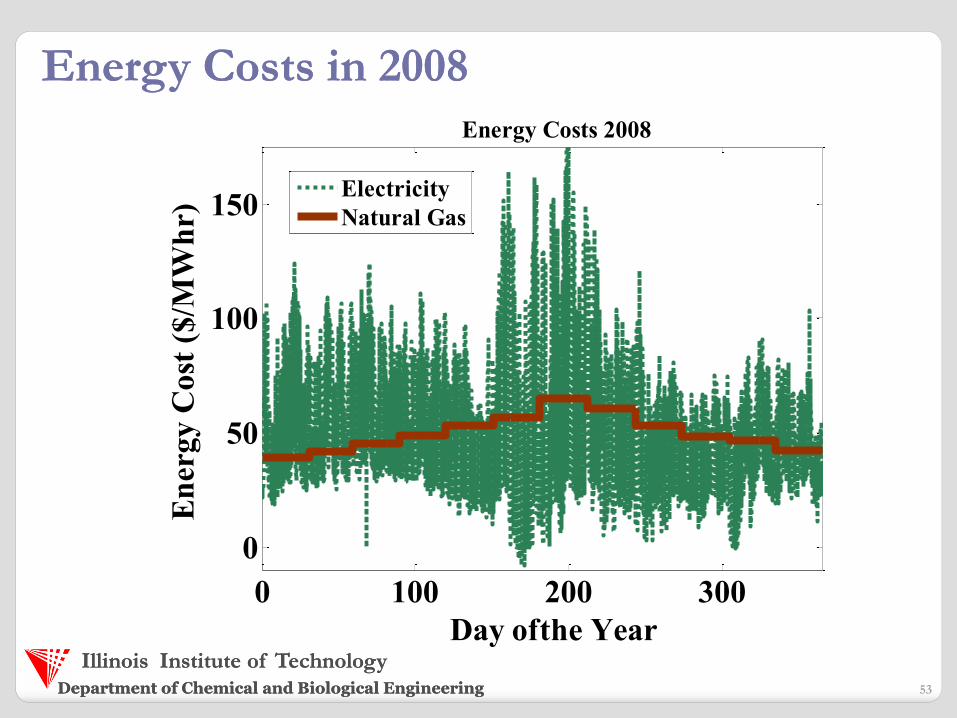
Energy Costs in 2008Energy Costs in 2008
53
0 100 200 300
0
50
100
150
Day ofthe Year
En
erg
y C
ost
($
/MW
hr)
Energy Costs 2008
Electricity
Natural Gas

Department of Chemical and Biological EngineeringDepartment of Chemical and Biological Engineering
Illinois Institute of TechnologyIllinois Institute of Technology
Energy Costs in 2012Energy Costs in 2012
54
0 100 200 300
0
50
100
150
Day ofthe Year
En
erg
y C
ost
($
/MW
hr)
Energy Costs 2012
Electricity
Natural Gas

Department of Chemical and Biological EngineeringDepartment of Chemical and Biological Engineering
Illinois Institute of TechnologyIllinois Institute of Technology
Energy CostsEnergy Costs –– Three Sample YearsThree Sample Years
55
0 100 200 300
0
50
100
150
Day ofthe Year
En
ergy C
ost
($/M
Wh
r)
Energy Costs 2012
Electricity
Natural Gas
0 100 200 300
0
50
100
150
Day ofthe YearE
ner
gy C
ost
($/M
Wh
r)
Energy Costs 2008
Electricity
Natural Gas
0 100 200 300
0
50
100
150
Day ofthe Year
En
erg
y C
ost
($
/MW
hr)
Energy Costs 2005
Electricity
Natural Gas
Department of Chemical and Biological EngineeringDepartment of Chemical and Biological Engineering
Illinois Institute of TechnologyIllinois Institute of Technology
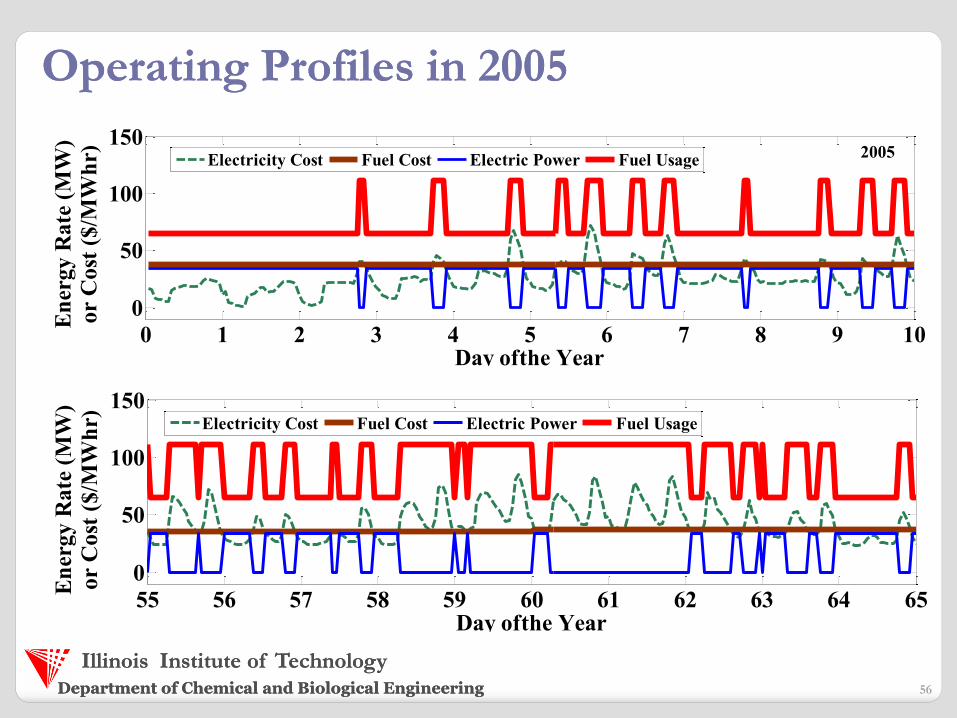
Operating Profiles in 2005Operating Profiles in 2005
56
55 56 57 58 59 60 61 62 63 64 65
0
50
100
150
Day ofthe Year
En
ergy R
ate
(M
W)
or
Cost
($/M
Wh
r)2005
Electricity Cost Fuel Cost Electric Power Fuel Usage
0 1 2 3 4 5 6 7 8 9 10
0
50
100
150
Day ofthe Year
En
erg
y R
ate
(M
W)
or
Co
st (
$/M
Wh
r) 2005
Electricity Cost Fuel Cost Electric Power Fuel Usage
Department of Chemical and Biological EngineeringDepartment of Chemical and Biological Engineering
Illinois Institute of TechnologyIllinois Institute of Technology
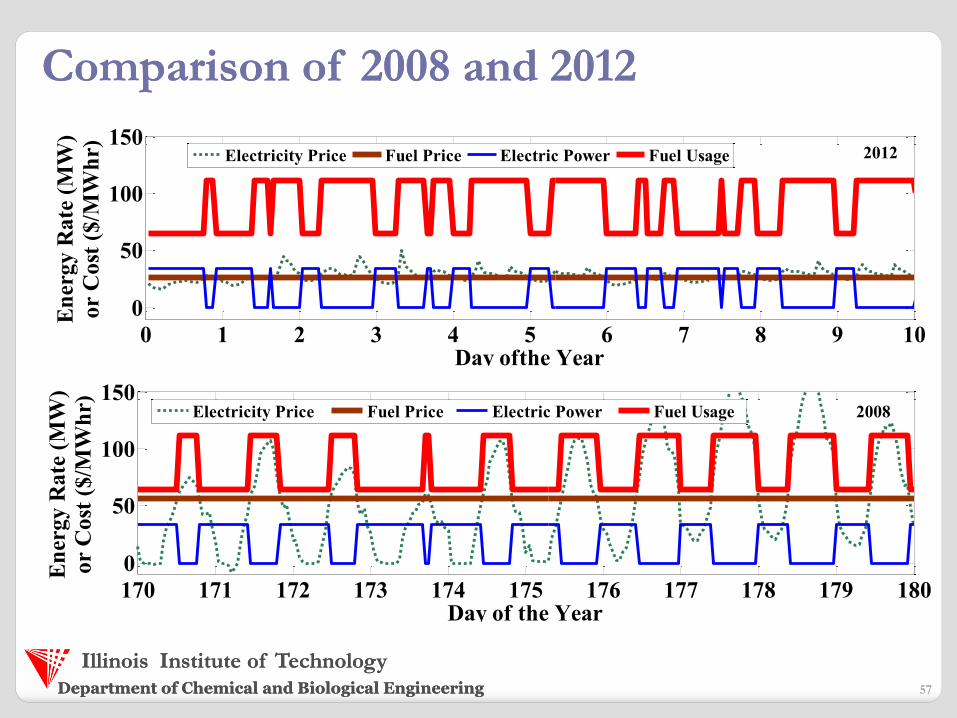
Comparison of 2008 and 2012Comparison of 2008 and 2012
57
0 1 2 3 4 5 6 7 8 9 10
0
50
100
150
Day ofthe Year
En
erg
y R
ate
(M
W)
or
Co
st (
$/M
Wh
r) 2012
Electricity Price Fuel Price Electric Power Fuel Usage
170 171 172 173 174 175 176 177 178 179 180
0
50
100
150
Day of the Year
En
erg
y R
ate
(M
W)
or
Co
st (
$/M
Wh
r) 2008
Electricity Price Fuel Price Electric Power Fuel Usage

Department of Chemical and Biological EngineeringDepartment of Chemical and Biological Engineering
Illinois Institute of TechnologyIllinois Institute of Technology
Annual Operating Costs (in millions)Annual Operating Costs (in millions)
58
2005 2008 2012
Baseline $37.4 $32.9 $18.8
With Electric
Heater $33.7 $30.3 $18.3
Savings $3.7 $2.6 $0.5
Percent Savings 10% 8% 3%

Department of Chemical and Biological EngineeringDepartment of Chemical and Biological Engineering
Illinois Institute of TechnologyIllinois Institute of Technology
Electric Heaters Electric Heaters
59
http://www.armstrong-chemtec.com
Department of Chemical and Biological EngineeringDepartment of Chemical and Biological Engineering
Illinois Institute of TechnologyIllinois Institute of Technology
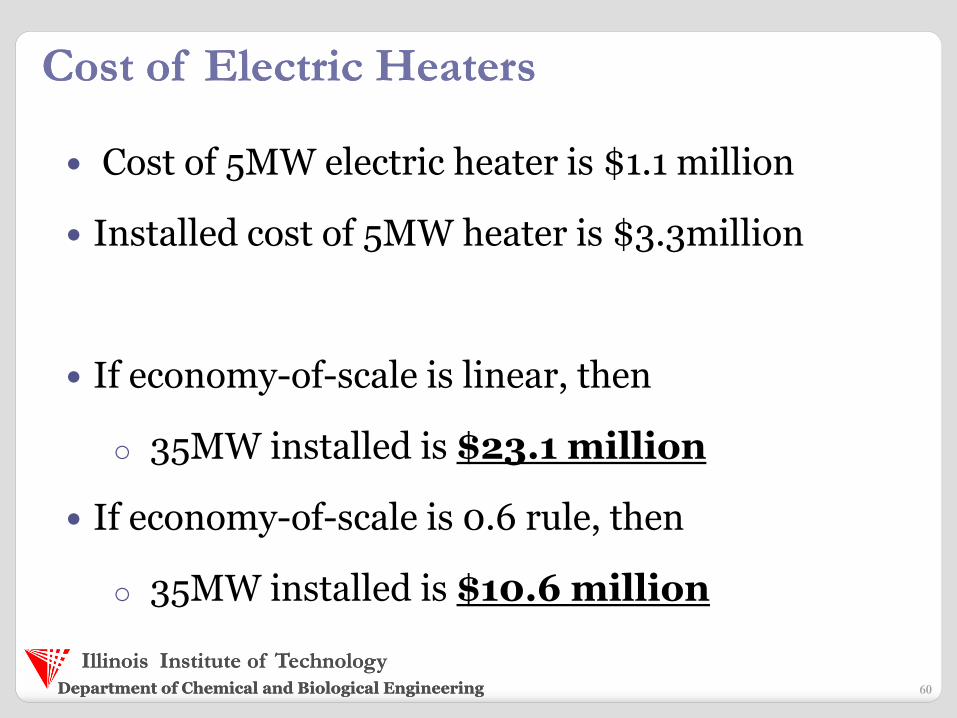
Cost of Electric Heaters Cost of Electric Heaters
60
Cost of 5MW electric heater is $1.1 million
Installed cost of 5MW heater is $3.3million
If economy-of-scale is linear, then
o 35MW installed is $23.1 million
If economy-of-scale is 0.6 rule, then
o 35MW installed is $10.6 million

Department of Chemical and Biological EngineeringDepartment of Chemical and Biological Engineering
Illinois Institute of TechnologyIllinois Institute of Technology
Economic AnalysisEconomic Analysis
61
2005 2008 2012
Savings from
electric heater $3.7 $2.6 $0.5
Heater Cost
(Linear EOS) $23.1 $23.1 $23.1
Payback (years) 6.2 8.8 46
Heater Cost
(0.6 Rule EOS) $10.6 $10.6 $10.6
Payback (years) 2.8 4.1 21

Department of Chemical and Biological EngineeringDepartment of Chemical and Biological Engineering
Illinois Institute of TechnologyIllinois Institute of Technology
Alcoa Alcoa and Aluminum Smelting and Aluminum Smelting
62
• 40% of Costs to Produce Aluminum is Electricity
• Production is Directly Proportional to Power Input
• Process Focused Demand Response – Not Aux. Load
Department of Chemical and Biological EngineeringDepartment of Chemical and Biological Engineering
Illinois Institute of TechnologyIllinois Institute of Technology
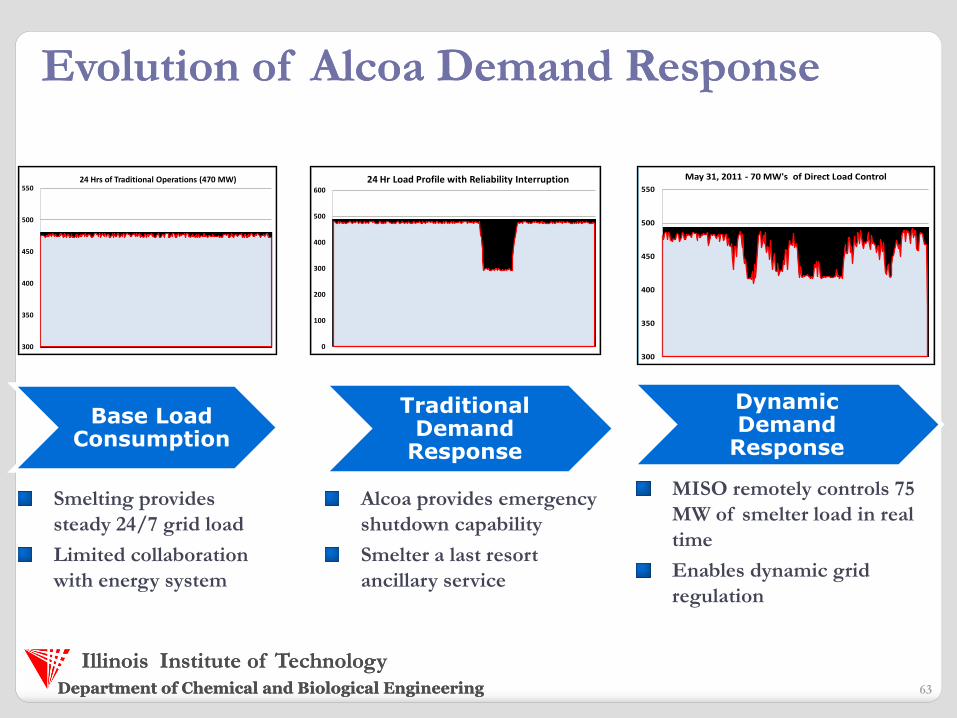
Evolution of Alcoa Demand ResponseEvolution of Alcoa Demand Response
63
Dynamic Demand
Response
300
350
400
450
500
550
May 31, 2011 - 70 MW's of Direct Load Control
300
350
400
450
500
55024 Hrs of Traditional Operations (470 MW)
Base Load Consumption
Smelting provides
steady 24/7 grid load
Limited collaboration
with energy system
0
100
200
300
400
500
600
24 Hr Load Profile with Reliability Interruption
Traditional Demand
Response
Alcoa provides emergency
shutdown capability
Smelter a last resort
ancillary service
MISO remotely controls 75
MW of smelter load in real
time
Enables dynamic grid
regulation
Department of Chemical and Biological EngineeringDepartment of Chemical and Biological Engineering
Illinois Institute of TechnologyIllinois Institute of Technology
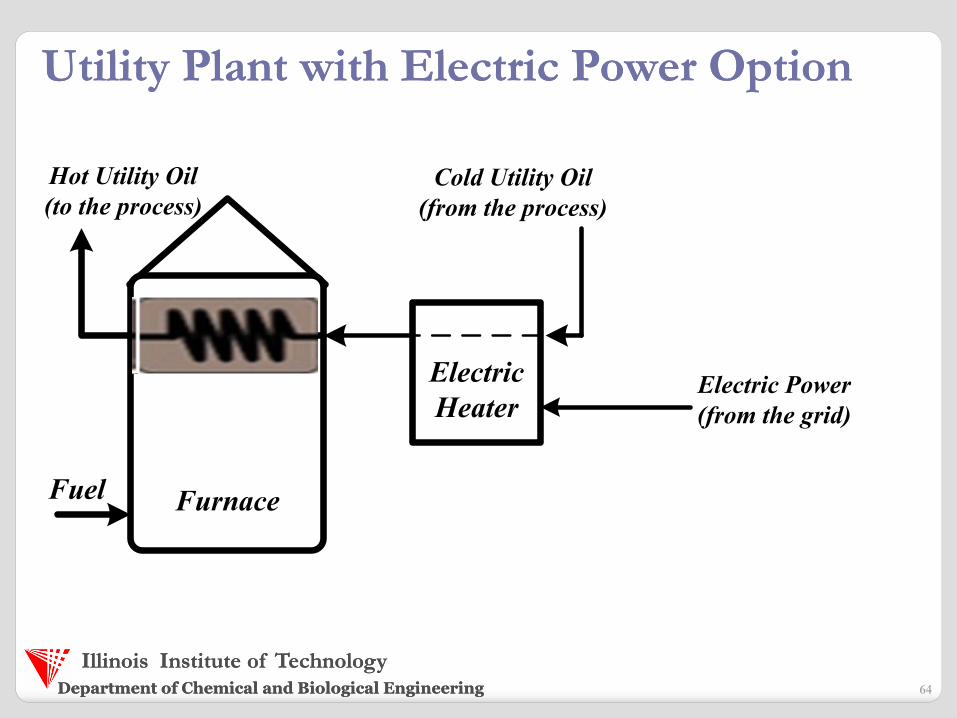
Utility Plant with Electric Power OptionUtility Plant with Electric Power Option
64
Electric
Heater
Furnace
Hot Utility Oil
(to the process)
Fuel
Cold Utility Oil
(from the process)
Electric Power
(from the grid)
Department of Chemical and Biological EngineeringDepartment of Chemical and Biological Engineering
Illinois Institute of TechnologyIllinois Institute of Technology
ConclusionsConclusions What is the smart grid?
Demand Response!
Why would the chemical industry be interested?
Lower Energy Costs!
How does one participate in the smart grid?
Economic MPC!
Who should participate in the smart grid?
Those with positive Net Present Value!
65

Department of Chemical and Biological EngineeringDepartment of Chemical and Biological Engineering
Illinois Institute of TechnologyIllinois Institute of Technology
66
AcknowledgementsAcknowledgements
Current and Former Students:
Jianyuan Feng Avery Brown
Benjamin Omell David Mendoza-Serrano
Oluwasanmi Adeodu Ming Yang (Taiwan Electric)
Collaborators and Personal Communications:
Dennis O’Brien (Jacobs)
Kiran Sheth and Don Bartusiak (ExxonMobil)
Funding:
National Science Foundation (CBET – 0967906)
Wanger Institute for Sustainable Engineering Research (IIT)