A Synergistic Analysis of Coal Based IGCC and Corn...
15
A Synergistic Analysis of Coal Based IGCC and Corn Based Ethanol Production Syed K. Ahmed, Benjamin P. Omell and Donald J. Chmielewski Department of Chemical & Biological Engineering Illinois Institute of Technology, Chicago, IL ([email protected] ) ABSTRACT The objective of this work is to identify potential synergies between a dry-mill corn fed (EtOH) plant and a coal based Integrated Gasification Combined Cycle (IGCC) power plant. The general conclusion is that heat integration opportunities do exist between EtOH production and IGCC, and indicate that further investigation of the topic is warranted. Specific results indicate that in a best case scenario all of the heat load due to EtOH distillation, evaporator and drum dryer could be met by unutilized heat from the IGCC, and would result in significant economic and carbon emission benefits. In the worst case scenario, it is concluded that only a significant portion of drum dryer load could be met, which would still yield significant economic and moderate carbon emission reduction benefits. INTRODUCTION AND BACKGROUND The objective this study was to identify potential synergies that may result from the collocation of a dry-mill corn ethanol plant and an Integrated Gasification Combined Cycle (IGCC) electric power plant. The underlying premise is that fermentation based ethanol production requires significant heat input. This heat is used to drive the ethanol purification process as well as the drying of co-products. However, the quality of heat required for these two separations is fairly low. As with most power cycles, the IGCC process utilizes large quantities of high quality heat, but then must also expel similarly large quantities of low quality heat. Thus, the thesis of the project is to determine if the IGCC process has sufficient heat available at sufficient quality to meet the needs of the ethanol plant. To facilitate the analysis, two representative processes were selected. The first is a corn fed dry mill ethanol plant that produces 100 million gal/yr of ethanol (EtOH), which can be classified as a medium-to-large sized EtOH plant. Regarding IGCC, our calculations were based on the size and configuration of the Wabash River demonstration plant, which can be classified as a small-to-medium sized power plant (265MWe). The study was divided into three tasks. First was a baseline analysis for each process. This analysis included material and energy calculations as well as cost and carbon balance estimates. The second task was to identify heat integration opportunities between the two processes. The third task was to determine the impact of material exchange between the two processes, specifically the feed of ethanol co-products to the gasification plant. A dry mill ethanol plant contains three major sections [1-5]: the biological conversion
Transcript of A Synergistic Analysis of Coal Based IGCC and Corn...

A Synergistic Analysis of Coal Based IGCC and Corn Based Ethanol Production
Syed K. Ahmed, Benjamin P. Omell and Donald J. Chmielewski
Department of Chemical & Biological Engineering Illinois Institute of Technology, Chicago, IL
ABSTRACT
The objective of this work is to identify potential synergies between a dry-mill corn fed (EtOH) plant and a coal based Integrated Gasification Combined Cycle (IGCC) power plant. The general conclusion is that heat integration opportunities do exist between EtOH production and IGCC, and indicate that further investigation of the topic is warranted. Specific results indicate that in a best case scenario all of the heat load due to EtOH distillation, evaporator and drum dryer could be met by unutilized heat from the IGCC, and would result in significant economic and carbon emission benefits. In the worst case scenario, it is concluded that only a significant portion of drum dryer load could be met, which would still yield significant economic and moderate carbon emission reduction benefits.
INTRODUCTION AND BACKGROUND
The objective this study was to identify potential synergies that may result from the collocation of a dry-mill corn ethanol plant and an Integrated Gasification Combined Cycle (IGCC) electric power plant. The underlying premise is that fermentation based ethanol production requires significant heat input. This heat is used to drive the ethanol purification process as well as the drying of co-products. However, the quality of heat required for these two separations is fairly low. As with most power cycles, the IGCC process utilizes large quantities of high quality heat, but then must also expel similarly large quantities of low quality heat. Thus, the thesis of the project is to determine if the IGCC process has sufficient heat available at sufficient quality to meet the needs of the ethanol plant. To facilitate the analysis, two representative processes were selected. The first is a corn fed dry mill ethanol plant that produces 100 million gal/yr of ethanol (EtOH), which can be classified as a medium-to-large sized EtOH plant. Regarding IGCC, our calculations were based on the size and configuration of the Wabash River demonstration plant, which can be classified as a small-to-medium sized power plant (265MWe). The study was divided into three tasks. First was a baseline analysis for each process. This analysis included material and energy calculations as well as cost and carbon balance estimates. The second task was to identify heat integration opportunities between the two processes. The third task was to determine the impact of material exchange between the two processes, specifically the feed of ethanol co-products to the gasification plant. A dry mill ethanol plant contains three major sections [1-5]: the biological conversion
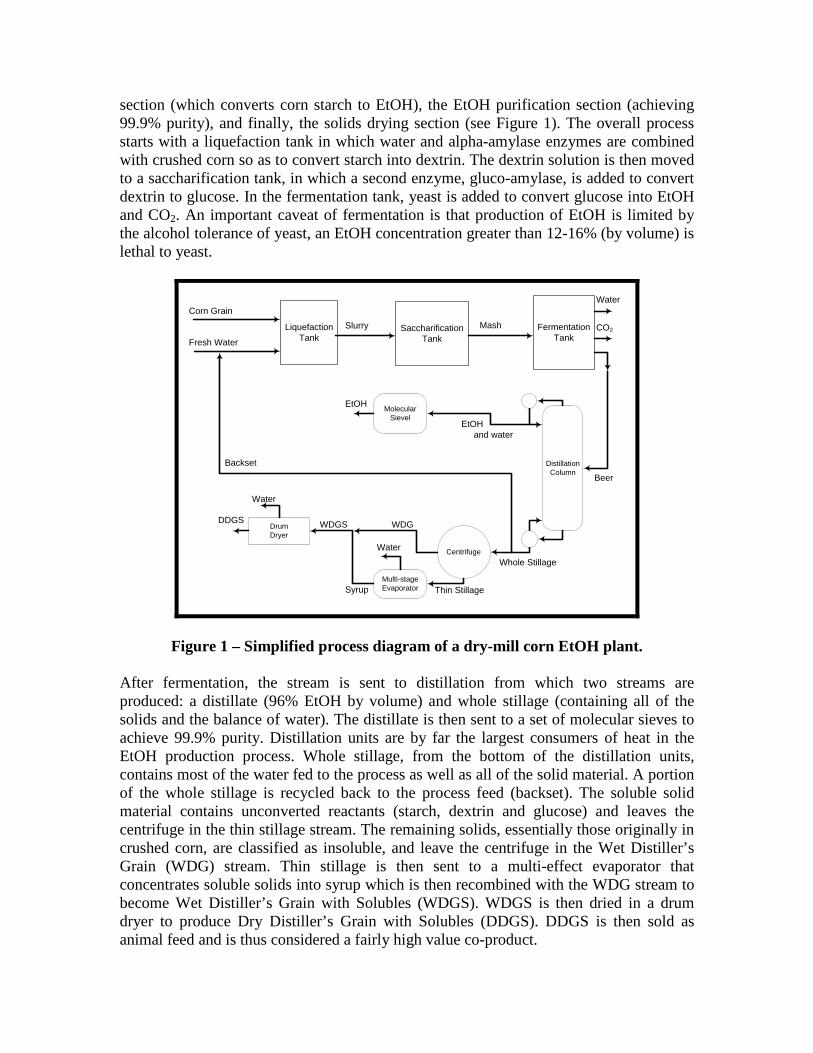
section (which converts corn starch to EtOH), the EtOH purification section (achieving 99.9% purity), and finally, the solids drying section (see Figure 1). The overall process starts with a liquefaction tank in which water and alpha-amylase enzymes are combined with crushed corn so as to convert starch into dextrin. The dextrin solution is then moved to a saccharification tank, in which a second enzyme, gluco-amylase, is added to convert dextrin to glucose. In the fermentation tank, yeast is added to convert glucose into EtOH and CO2. An important caveat of fermentation is that production of EtOH is limited by the alcohol tolerance of yeast, an EtOH concentration greater than 12-16% (by volume) is lethal to yeast.
LiquefactionTank
SaccharificationTank
FermentationTank
Corn GrainSlurry Mash
Backset
CO2
Water
BeerDistillationColumn
MolecularSievel
Centrifuge
Multi-stageEvaporator
DrumDryer
Whole Stillage
Thin Stillage
WDG
Syrup
Water
EtOH and water
EtOH
DDGS WDGS
Water
Fresh Water
Figure 1 – Simplified process diagram of a dry-mill corn EtOH plant. After fermentation, the stream is sent to distillation from which two streams are produced: a distillate (96% EtOH by volume) and whole stillage (containing all of the solids and the balance of water). The distillate is then sent to a set of molecular sieves to achieve 99.9% purity. Distillation units are by far the largest consumers of heat in the EtOH production process. Whole stillage, from the bottom of the distillation units, contains most of the water fed to the process as well as all of the solid material. A portion of the whole stillage is recycled back to the process feed (backset). The soluble solid material contains unconverted reactants (starch, dextrin and glucose) and leaves the centrifuge in the thin stillage stream. The remaining solids, essentially those originally in crushed corn, are classified as insoluble, and leave the centrifuge in the Wet Distiller’s Grain (WDG) stream. Thin stillage is then sent to a multi-effect evaporator that concentrates soluble solids into syrup which is then recombined with the WDG stream to become Wet Distiller’s Grain with Solubles (WDGS). WDGS is then dried in a drum dryer to produce Dry Distiller’s Grain with Solubles (DDGS). DDGS is then sold as animal feed and is thus considered a fairly high value co-product.

Figure 2 – Simplified process diagram of the Wabash River IGCC plant (from [7]). An IGCC plant can be divided into two major sections: the syn-/flue-gas side and the steam cycle side. The syn-/flue-gas side will generate electric power via a Brayton cycle as well as a large amount of heat which is transferred to the steam side and converted to electric power via a standard Rankine cycle. The IGCC process modeled in this study is based on the size and configuration of the Wabash River demonstration plant [6-8]. On the syn-/flue-gas side we begin with the gasifier (see Figure 2), which is fed coal in a 60/40 ratio with water at an operating pressure of 2.8 MPa and an exit temperature of 1038C. The carbon conversion rate is about 95%, and the pure oxygen feed is generated from a cryogenic air separation unit. Raw syn-gas is cooled via heat transfer to the steam side of the IGCC plant. Through the candle filter, particulates are recycled back to the gasifier for further conversion and all ash and unreacted carbon are removed via the slag stream. Syn-gas is then further cooled to a temperature appropriate for cold gas cleaning (~ 37C). Clean, dry syn-gas is then reheated and fed as fuel to a gas turbine (Brayton cycle – see Figure 3). The typical pressure ratio is 12 with a maximum inlet turbine temperature of 1222C. Flue-gas exiting the turbine is fed to a heat recovery unit for transfer to the steam side of the plant. Turning to the steam side, a fairly standard Rankine cycle is employed (see Figure 4), which utilizes two turbines (one high pressure and one low) and two feed-water heaters (one open and one closed).
Figure 3 – Typical Brayton cycle (from [9]).
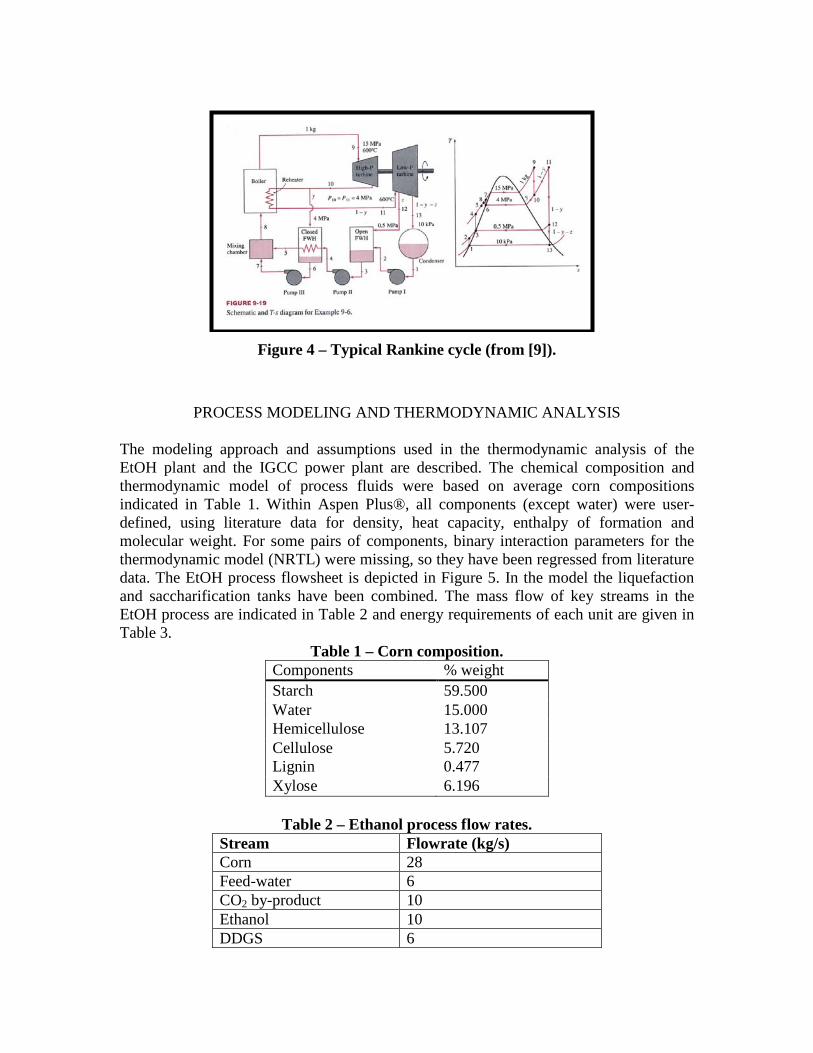
Figure 4 – Typical Rankine cycle (from [9]).
PROCESS MODELING AND THERMODYNAMIC ANALYSIS The modeling approach and assumptions used in the thermodynamic analysis of the EtOH plant and the IGCC power plant are described. The chemical composition and thermodynamic model of process fluids were based on average corn compositions indicated in Table 1. Within Aspen Plus®, all components (except water) were user-defined, using literature data for density, heat capacity, enthalpy of formation and molecular weight. For some pairs of components, binary interaction parameters for the thermodynamic model (NRTL) were missing, so they have been regressed from literature data. The EtOH process flowsheet is depicted in Figure 5. In the model the liquefaction and saccharification tanks have been combined. The mass flow of key streams in the EtOH process are indicated in Table 2 and energy requirements of each unit are given in Table 3.
Table 1 – Corn composition. Components % weight Starch 59.500 Water 15.000 Hemicellulose 13.107 Cellulose 5.720 Lignin 0.477 Xylose 6.196
Table 2 – Ethanol process flow rates.
Stream Flowrate (kg/s) Corn 28 Feed-water 6 CO2 by-product 10 Ethanol 10 DDGS 6
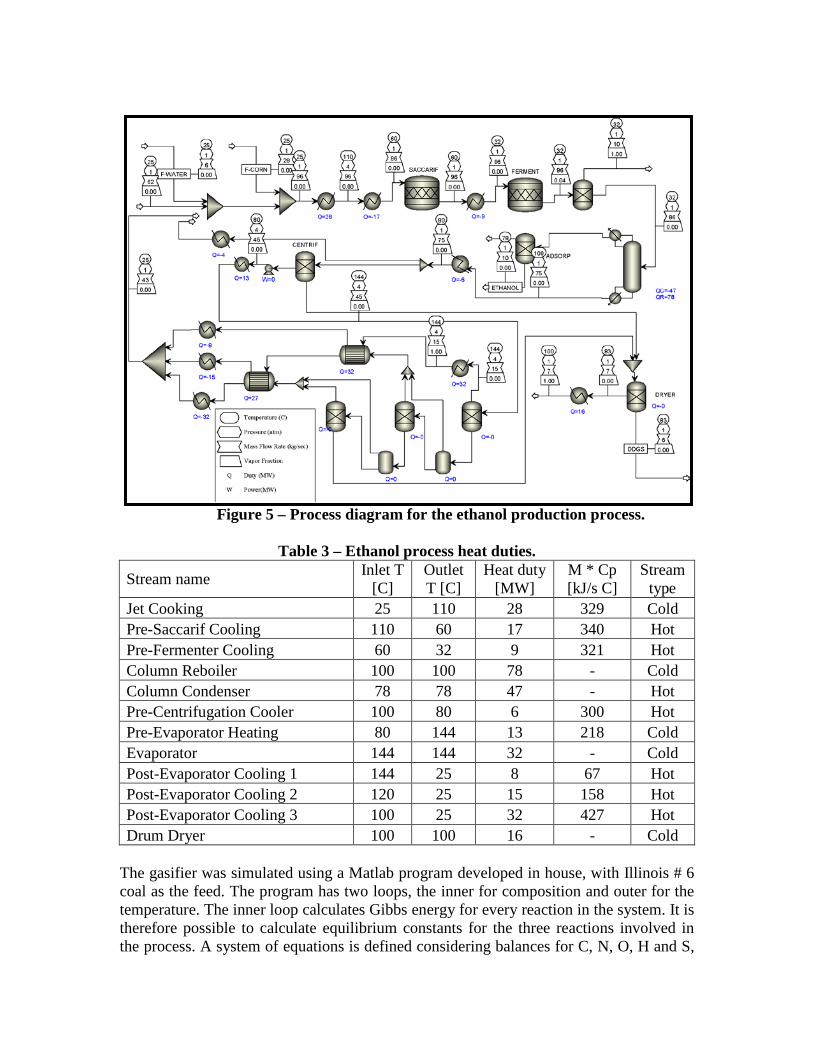
Figure 5 – Process diagram for the ethanol production process.
Table 3 – Ethanol process heat duties.
Stream name Inlet T [C]
Outlet T [C]
Heat duty [MW]
M * Cp [kJ/s C]
Stream type
Jet Cooking 25 110 28 329 Cold Pre-Saccarif Cooling 110 60 17 340 Hot Pre-Fermenter Cooling 60 32 9 321 Hot Column Reboiler 100 100 78 - Cold Column Condenser 78 78 47 - Hot Pre-Centrifugation Cooler 100 80 6 300 Hot Pre-Evaporator Heating 80 144 13 218 Cold Evaporator 144 144 32 - Cold Post-Evaporator Cooling 1 144 25 8 67 Hot Post-Evaporator Cooling 2 120 25 15 158 Hot Post-Evaporator Cooling 3 100 25 32 427 Hot Drum Dryer 100 100 16 - Cold
The gasifier was simulated using a Matlab program developed in house, with Illinois # 6 coal as the feed. The program has two loops, the inner for composition and outer for the temperature. The inner loop calculates Gibbs energy for every reaction in the system. It is therefore possible to calculate equilibrium constants for the three reactions involved in the process. A system of equations is defined considering balances for C, N, O, H and S,

the constraint that the sum of compositions equals 1.0, and relationships between compositions via equilibrium constants. The system of equations is solved, and the result is the composition of the effluent. The outer loop then calculates the enthalpy of products to compare with the enthalpy of reactants. If the two are different, the system temperature is changed. The resulting syn-gas is used as the feed to the Aspen simulation of Figure 6.
Table 4 – IGCC plant flowrates. Stream Flowrate (kg/s) Coal 33 (dry) Slurry water 22 Oxygen 19 Brayton air feed 415
The mass flow of key streams in the IGCC process are indicated in Table 4. Raw syn-gas is sent to a set of syn-gas coolers prior to a syn-gas water condenser, which is used to meet inlet requirements of the acid gas removal system. The acid gas removal system of Figure 7 consists of an absorber and a distillation column, and is methyldiethanolamine (MDEA) absorbent based [10-11]. The Brayton cycle has two compressors with intercooling and two turbines with heat recuperation. The compressor and turbine efficiencies are 80%, and the electric generator efficiency is 95%. The Brayton power output of 192 MW is consistent with published Wabash River plant data. The Rankine cycle of Figure 8 has an electric power output of 105 MW, also consistent with Wabash River data. Heat duty requirements of each unit in the IGCC are given in Table 5.
Figure 6 – Syn-gas cleaning units and Brayton cycle.

Figure 7 – Acid gas removal process.
Figure 8 – Rankine cycle.

Table 5 – IGCC heat duties.
Stream name Inlet T [C]
Outlet T [C]
Heat duty [MW]
M * Cp [kJ/s C]
Stream type
Coal Slurry Pre-heater 25 200 23 131 Cold SG Cooler 1 1038 500 84 156 Hot SG Cooler 2 500 151 41 117 Hot SG Water Condenser 151 37 41 360 Hot SG Reheater 80 240 13 88 Cold Amine Heater 43 90 11 234 Cold Amine Column Reboiler 98 98 48 - Cold Amine Column Cooler 89 51 33 868 Hot Amine Cooler 98 42 12 214 Hot Brayton Intercooler 182 25 67 427 Hot Brayton Regenerator 189 355 82 494 Cold Brayton Flue Gas 931 25 516 569 Hot Rankine Economizer 243 342 54 545 Cold Rankine Boiler 342 342 97 - Cold Rankine Superheater 342 600 94 360 Cold Rankine Reheater 420 600 34 189 Cold Rankine Condenser 46 46 170 - Hot
Table 6 data is used to estimate operational economics of both plants [12]. Within the EtOH plant, it is assumed that steam utility is generated by a natural gas boiler with 80% efficiency (heat of water vaporization / heat of gas combustion) [13]. Additionally, the drum dryer is assumed to be natural gas fired with 70% efficiency (heat of moisture evaporated / heat of gas combustion) [13]. Table 7 data is used to determine the carbon balance of both plants [12]. The corn production entry is associated with fuel and fertilizer used in farming and transportation. This data does not include carbon uptake from the environment to the corn (we assume that carbon in the product and co-product will eventually be released back to the environment).
Table 6 – Assumed cost data (from [12]). Corn Grain $4.50 per bu DDGS $132 per ton Ethanol $2 per gal Electric Power $0.07 per kWh Coal $33.40 per ton Natural Gas $8.22 per MMBTU
Table 7 – Assumed carbon balance data (from [12]).
CO2e of corn grain production 26.1 g CO2e /MJ EtOH produced CO2e of natural gas combustion 50.3 g CO2e /MJ CO2e of steam 62.9 g CO2e /MJ steam produced CO2e of drum dryer 71.9 g CO2e /MJ drum evaporation CO2e of coal combustion 2.4 g CO2e / g coal
The heat transfer coefficient for a fin tube heat exchanger is estimated as [14, 15]: U = 810 W/m2 C. The bare tube heat exchanger area is estimated as [14]: A = Q / (U ∆Tln ). The cost of the exchanger is given by [15]: CP = 1970 A0.4, where A is in ft2 and the CE index is 394 (for 2006 the CE index is 559). As a point of reference to heat exchanger costs, [12] reports the initial capital cost of a 100MM gal/yr EtOH plant to be 1.32 times the gal/yr capacity: $132MM. The DOE target for IGCC capital costs is $1000 /kW, [6], which would put the Wabash River plant at $265MM.
RESULTS AND DISCUSSION The first task was to perform baseline material and energy balance modeling and an economic and carbon balance analysis of each process operating in isolation. It was assumed that all heating and cooling loads could only be met through utilization of natural gas, natural gas generated steam and cooling water. The simulation data and descriptions of the previous section indicate the results of material and energy balance models. Of particular interest is the simulation data of Tables 3 and 5. Using this process data, a standard heat integration analysis [16], was performed to match the heat loads of each stream within the boundaries of each process. A minimum approach temperature of 15C was assumed throughout. In the EtOH process, all cold streams were matched except for column reboiler (78MW), evaporator (32MW) and drum dryer (16MW). A number of hot streams were also unmatched, but due to their low quality, they had to be left to cooling water duty. In the IGCC plant, all cold streams were matched by suitable hot streams. The only remaining energy of sufficient quality was SG cooler 2 (41MW), and 162MW of Brayton flue gas. Except for the Brayton flue gas, each of the remaining hot streams was met by cooling water duty. Table 8 summarizes the expected operating data for each plant operating in isolation. Of particular interest are loads to steam generator and drum dryer of the EtOH plant. In both cases, the cost of meeting this demand is proportional to the cost of natural gas. These energy costs are equal to 25% of the corn feedstock cost and nearly 92% of the EtOH plant profit. Table 9 summarizes the expected CO2 equivalent (CO2e) associated with each plant (see [12] and [17] for definition of CO2 equivalent). Again, CO2 emissions associated with steam generation and drum drying are highlighted. Emissions from these two activities represent 26% of total EtOH plant emissions.

Table 8 – Operational costs for baseline plant designs.
Rate [kg/s or MW]
Cost or Value [$/s]
Cost or Value [$MM/yr]
Corn Grain Feedstock 28 4.96 156.4 DDGS Produced 6 0.87 27.5 EtOH Produced 10 6.70 211.1 Steam Generator Load 110 1.07 33.8 Drum Dryer Load 16 0.18 5.6 Baseline EtOH Plant Profit 1.36 42.9 Coal Feedstock 33 1.21 38.3 Electric Power Generated 265 5.15 162.5 Baseline IGCC Plant Profit 3.94 124.2
Table 9 – CO2e emission rates for baseline plant designs.
Emission Rate [kg CO2e /s]
Emission Rate [MM tonne CO2e /yr]
Corn Production 19.7 0.62 CO2 co-product 10.0 0.32 Natural Gas Combustion (Steam Gen.) 8.65 0.27 Natural Gas Combustion (Drum Dryer) 1.44 0.05 EtOH Plant Total 39.8 1.25 IGCC Plant Total (coal combustion) 79.2 2.50 Combined Plant Total 119.0 3.75
The second task was to perform heat integration analysis utilizing both processes. As indicated by the baseline analysis, most of the streams in Tables 3 and 5 were matched with other streams within the respective processes. In the EtOH plant, three cold streams were left unmatched (see Table 10). In the IGCC, two hot streams were left unmatched (see Table 11). The objective of this task was to utilize unmatched IGCC streams to meet heating requirements of unmatched EtOH streams. The proposed design change is to introduce three additional streams to carry heat from the IGCC to the EtOH plant. The first is a flow of steam to the EtOH column reboiler. To satisfy the required approach temperature of 15C, this steam must be at a temperature of at least 115C (saturation pressure of 2.5 psia). To meet the 78MW load, Brayton flue gas is to be cooled from 311C to 175C in a fin tube heat exchanger. Assuming a constant steam temperature of 115C results in ∆Tln = 115C, which gives a bare tube surface area of 8905 ft2. The purchase cost of this heat exchanger in 2006 dollars is $106,227. It is noted that alternative EtOH plant designs may remove the column reboiler in favor of direct steam injection. In this case, atmospheric pressure steam (at 100C) would suffice. This increase in ∆Tln would reduce the required heat exchange area and result in a purchase cost of $84,409. After generating steam for the EtOH column reboiler, the Brayton flue gas stream will be at 175C. It is proposed to inject this stream (essentially hot air) directly into the drum

dryer. If the entire 415 kg/s is used to meet the 16 MW load, the flue gas would be cooled to 147C. Alternatively, a fraction of the Brayton flue gas flow could be used (if 45% then cooling to 115C would occur). A second alternative is to use Brayton flue gas as pre-heated air to a traditional natural gas fired dryer so as to increase efficiency. In all of these scenarios, it is expected that the purchase cost will be negligible. The steam used to drive the evaporator is required to be at a pressure of 9 psia (saturation temperature of 160C). To meet the 32 MW load the SG cooler 2 stream should be cooled from 500C to 226C, also in a fin tube heat exchanger. With a constant steam temperature of 160C results in ∆Tln = 151C, which gives a bare tube surface area of 2820 ft2, and a 2006 purchase cost of $67,063. The impact of the above heat integration on the EtOH plant operating cost is as follows: A 100% decrease in natural gas costs (from $39.4MM/yr to zero) and a 92% increase in EtOH plant profit (from $42.9MM/yr to $82.3MM/yr). On the carbon balance side, there will be a 100% reduction in natural gas based CO2e emissions (from 0.32 MM tones/yr to zero), a 26% reduction for the EtOH plant (from 1.25 MM tones/yr to 0.93 MM tones/yr) and an 8.5% reduction for the combination of both plants.
Table 10 – Unmatched cold streams for the ethanol plant.
Stream name Inlet T [C]
Outlet T [C]
Heat duty [MW]
M * Cp [kJ/s C]
Stream type
Column Reboiler 100 100 78 - Cold Evaporator 144 144 32 - Cold Drum Dryer 100 100 16 - Cold
Table 11 – Unmatched hot streams for the IGCC plant.
Stream name Inlet T [C]
Outlet T [C]
Heat duty [MW]
M * Cp [kJ/s C]
Stream type
SG Cooler 2 500 151 41 117 Hot Brayton Flue Gas 311 25 162 569 Hot
The third task was to determine the impact of feeding a portion of WDG to the gasifier. The benefit is a CO2e emission reduction, due to displacement of coal as well as a reduction in the drying load associated with DDGS production. The downside is a loss in revenue due to a reduction in DDGS output. Table 12 indicates the HHV of various downstream products of WDG, [18]. Table 4 indicates that the gasifier feed contain 22 kg/s of water. Using this figure as the maximum amount of water that can be fed along with the co-product, we develop a number of scenarios. Consider the case of whole stillage. The mass fraction of water in whole stillage is 90.4%, indicating the maximum amount of whole stillage one could feed to the gasifier is 24.3 kg/s, which amounts to 2.3 kg/s of dry DDGS. Similarly, thin stillage is 97.5% water and would allow 22.6 kg/s and 0.6 kg/s of dry syrup. WDGS is 55% water, allowing 40 kg/s and 18 kg/s of dry DDGS. (It is noted that 18 kg/s is greater than the 6 kg/s of DDGS available in the WDGS stream of the baseline EtOH plant.)

Next consider the displacement of coal. Given the HHVs of Table 12, one would need 1.08 kg of dry DDGS to replace the energy value of 1 kg of coal. Similarly, 1.07 kg of dry DDG and 1.19 kg of dry syrup is equivalent to 1 kg of coal. Now assume the value of DDG and syrup are both equal to that of DDGS ($132/ton) and recall the cost of coal as $33.4/ton. Thus, Table 13 indicates a simple cost analysis for the above scenarios. This analysis does not take into account economics and CO2 savings associated with reduced evaporation and drying loads. Clearly, the extremely low cost of coal makes all of the proposed options far out of reach from an economic stand point. From a carbon perspective, the most costly scenario would result in an 11% reduction in CO2e emissions, but would cut the EtOH plant profits by nearly 50%. For the case of corn stover, a cost of $50/ton [12], suggests that any reductions in CO2 emissions, due to coal replacement, will result in lost profit, although at rates much lower than co-product cases.
Table 12 – Biomass HHVs (from [18]). HHV (dry basis)
[BTU/lbs] Dry DDGS 9349 Dry DDG 9438 Dry Syrup 8482 Corn Stover 7709 Illinois #6 Coal 10100
Table 13 – Co-product HHV.
Biomass Feed Source
Dry Biomass
Fed [kg/s]
Coal Displaced
[kg/s]
Value of Biomass
[$/s]
Value of Coal [$/s]
Revenue Lost [$/s]
CO2 Displaced
[kg CO2e /s] Whole Stillage 2.3 DDGS 2.130 0.334 0.078 0.255 5.111
Thin Stillage 0.6 Syrup 0.504 0.087 0.019 0.068 1.210
WDGS 6 DDGS 5.556 0.870 0.204 0.666 13.33
TECHNICAL SUMMARY The results of the baseline analysis, assuming each plant operates in isolation, are that the EtOH plant requires 126 MW of hot utility which corresponds to nearly 92% of the plant profit and 26% of the CO2e emissions from EtOH production. On the IGCC side, it was found that over 200 MW of intermediate quality heat may be available. Heat integration analysis between the two plants concluded that the EtOH plant may be able receive the entire 126 MW of heating load from the IGCC. The heat exchanger purchase cost for this new configuration was calculated as $173,290 (in 2006 dollars). The resulting increase in EtOH plant profit was calculated as $39.4 MM/yr (an increase of 92% for the EtOH plant and 23% for the EtOH/IGCC complex). The reductions in
CO2e emissions were also substantial (26% for the EtOH plant and 8.5% for the complex). An additional analysis of material exchange between the processes concluded that using EtOH co-products as feed to the gasifier is far from economical and provides only marginal reductions in CO2e emissions.
CONCLUSIONS AND RECOMMENDATIONS Based on this case study for a specific pair of plant configurations, it is concluded that heat integration opportunities between IGCC and EtOH production are possible and may yield meaningful profit improvements and CO2e emission reductions. This initial evidence, based on two arbitrary plant designs, suggests that operating condition modifications to either or both plants may yield even greater integration opportunities, and gives credence to future efforts aimed at achieving this goal. However, while the economic figures of this study suggest enormous economic and CO2e emission improvements, it should be highlighted that portions of the analysis contain significant uncertainty. Of greatest concern is the feed rate of coal to the IGCC. While this figure was calculated from the literature [7], we suspect that the employed rate was a bit higher than the actual. This suspicion stems from the larger than expected quality and quantity of unutilized heat from the IGCC. Given this caveat, and a less troubling uncertainty with the EtOH distillation process configuration, it is still concluded that heat integration opportunities are a realistic possibility. Specifically, if the actual quality of heat from the IGCC is substantially lower then larger heat exchange areas will be required. However, given the large ratio of profit improvement to exchanger cost determined in this study, a fairly large increase in exchanger cost would be required to invalidate the general conclusion. Concerning the quantity of heat from the IGCC, recall that the representative IGCC of this study is a small-to-medium size power plant, while the EtOH plant is on the larger side of the spectrum. Thus, if this study has over-estimated the quantity of heat available from the IGCC, then it is plausible to assume that a rescaling of either plant will recover a matching of the heat loads. In the worst case scenario, we expect that even a very low quality Brayton flue gas stream will be able to substantially reduce the drum dryer heat load, which from the current analysis suggests a $5.6 MM/yr reduction in operating costs. In summary, it is concluded that further investigation of heat integration opportunities between these two processes is warranted.
ACKNOWLEDGMENTS Financial support for this project was provided by the Illinois Department of Commerce and Economic Opportunity through the Office of Coal Development and the Illinois Clean Coal Institute (ICCI Project Number: 07-1/ER7).
REFERENCES 1. Kroschwitz. “Ethanol.” Kirk-Othmer Encyclopedia of Chemical Technology, John
Wiley & Sons, Inc., London, 2004. 2. Kosaric, Duvnjak, Farkas, Sahm, Bringer-Meyer, Goebel and Mayer. “Ethanol.”
Ullmann’s Encyclopedia of Industrial Chemistry, VCH, Weinheim, Germany, 1987. 3. Dale and Tyner. “Economic and Technical Analysis of Ethanol Dry Milling: Model
Description.” Agricultural Economics Dept., Purdue University, Staff Paper # 06-04, April 2006.
4. Cuttica and Mueller. “Research Investigation for the Potential Use of Illinois Coal in Dry Mill Ethanol Plant.” http://www.icci.org/06final/06toc.html, ICCI Project # DEV05-12, October 2006.
5. Kwiatkowski, McAloon, Taylor, and Johnston. “Modeling the Process and Costs of Fuel Ethanol Production by the Corn Dry-grind Process.” Industrial Crops and Products, 23, 2006.
6. US DOE. “The Wabash River Coal Gasifaction Repowering Project: An Update.” Topical Report Number 20, September 2000.
7. Wabash River Energy Ltd. “Wabash River Coal Gasification Repowering Project, Final Technical Report.” http://www.netl.doe.gov, August 2000.
8. Dowd, Roy A. “Wabash River Coal Gasification Repowering Project, Annual Technology Report.” http://www.netl.doe.gov, December 1997.
9. Çengel and Boles. Thermodynamics: An Engineering Approach. McGraw-Hill Inc., New York, NY, 1998.
10. Echt. “Chemical Solvent-Based Processes for Acid Gas Removal in Gasification Applications.” Gasification Technology in Practice IChemE Conference. www.dow.com/PublishedLiterature/dh_003a/0901b8038003a89e.pdf, 1997.
11. Mackenzie, Daniels and Bullin. “Design & Operation of a Selective Sweetening Plant using MDEA.” Energy Progress March: 31-36, 1987.
12. Plevin and Mueller. “The Effect of CO2 Regulations on the Cost of Corn Ethanol Production.” Environmental Research Letters 3:1-9, 2008.
13. Energy and Environmental Analysis, Inc. “An Assessment of the Potential for Energy Savings in Dry Mill Ethanol Plants from the Use of Combined Heat and Power (CHP).” www.epa.gov/CHP/documents/ethanol_energy_assessment.pdf, 2006.
14. Singh. Heat Transfer Fluids and Systems for Process and Energy Applications. Marcel Dekker, New York, NY, 1985.
15. Seider, Seader, and Lewin. Product & Process Design Principles. 2nd ed., John Wiley & Sons, Inc., New York, NY, 2004.
16. Douglas. Conceptual Design of Chemical Processes. McGraw-Hill, New York, NY, 1988.
17. Farrell, Plevin, Turner, Jones, O’Hare and Kammen. “Ethanol Can Contribute to Energy and Environmental Goals.” Science 311.506: 506-08, 2006.
18. Morey, Hatfield, Sears, and Tiffany. “Characterization of Feed Streams and Emissions.” ASABE Meeting Presentation #064180, www.biomasschpethanol.umn.edu/papers/ASABEPaper064180.pdf, 2006.
19. Stultz and Kitto. Steam: Its’ Generation and Use, 40th ed., Babcock & Wilcox, Barberton, OH, 1992.
20. Doherty and Malone. Conceptual Design of Distillation Systems. McGraw-Hill Inc., New York, NY, 2001.
21. Harriot, McCabe, and Smith. Unit Operations of Chemical Engineering. McGraw-Hill Inc., New York, NY, 1993.
22. Geankoplis. Transport Processes and Unit Operations. Prentice-Hall, Inc., Englewood Cliffs, NJ, 1993.
23. McAloon, Taylor, Yee, Ibsen, and Wooley. “Determining the Cost of Producing Ethanol from Corn Starch and Lignocellulosic Feedstocks.” Technical Report, National Renewable Energy Laboratory, 2000.