![Chromatin Remodeling in Nucleotide Excision …...chromatin remodeling factors and the addition of post-translational modifications on histones [19], which could facilitate their removal.](https://static.fdocuments.in/doc/165x107/5fa904ab20681022df35f6c5/chromatin-remodeling-in-nucleotide-excision-chromatin-remodeling-factors-and.jpg)
SMARCA3, a Chromatin-Remodeling Factor, Is Required · PDF fileSMARCA3, a Chromatin-Remodeling...
25
SMARCA3, a Chromatin-Remodeling Factor, Is Required for p11-Dependent Antidepressant Action Yong-Seok Oh, 1 Pu Gao, 3 Ko-Woon Lee, 1 Ilaria Ceglia, 1 Ji-Seon Seo, 1 Xiaozhu Zhang, 1 Jung-Hyuck Ahn, 4 Brian T. Chait, 2 Dinshaw J. Patel, 3 Yong Kim, 1, * and Paul Greengard 1, * 1 Laboratory of Molecular and Cellular Neuroscience 2 Laboratory of Mass Spectrometry and Gaseous Ion Chemistry The Rockefeller University, New York, NY 10065, USA 3 Structural Biology Program, Memorial Sloan-Kettering Cancer Center, New York, NY 10065, USA 4 Department of Biochemistry, Ewha Womans University School of Medicine, Yangcheon-ku, Seoul 158-710, Republic of Korea *Correspondence: [email protected] (Y.K.), [email protected] (P.G.) http://dx.doi.org/10.1016/j.cell.2013.01.014 SUMMARY p11, through unknown mechanisms, is required for behavioral and cellular responses to selective sero- tonin reuptake inhibitors (SSRIs). We show that SMARCA3, a chromatin-remodeling factor, is a target for the p11/annexin A2 heterotetrameric complex. Determination of the crystal structure indicates that SMARCA3 peptide binds to a hydrophobic pocket in the heterotetramer. Formation of this complex increases the DNA-binding affinity of SMARCA3 and its localization to the nuclear matrix fraction. In the dentate gyrus, both p11 and SMARCA3 are highly enriched in hilar mossy cells and basket cells. The SSRI fluoxetine induces expression of p11 in both cell types and increases the amount of the ternary complex of p11/annexin A2/SMARCA3. SSRI- induced neurogenesis and behavioral responses are abolished by constitutive knockout of SMARCA3. Our studies indicate a central role for a chromatin- remodeling factor in the SSRI/p11 signaling pathway and suggest an approach to the development of improved antidepressant therapies. INTRODUCTION Selective serotonin reuptake inhibitors (SSRIs) are currently the most widely used class of antidepressants (Berton and Nestler, 2006). SSRI medications generally take several weeks to show clinical efficacy, including mood elevation, despite their imme- diate effect on serotonergic neurotransmission. This therapeutic delay suggests the involvement of complicated downstream mechanisms, including long-term changes in gene expression and neuroplasticity. However, our knowledge of the molecular mechanisms underlying the efficacy of long-term treatment with SSRIs and of the pathophysiology of depression is still rudimentary. p11 (S100A10) is a pivotal regulator of depression-like behav- iors and a mediator of antidepressant responses (Svenningsson et al., 2006). Despite the importance of p11 in the actions of SSRIs, our knowledge about its underlying molecular mecha- nisms is limited (Svenningsson et al., 2006). Annexin A2 (AnxA2) is a well-characterized binding partner for p11. AnxA2, together with p11, plays a role in trafficking of membranous/ cytoplasmic proteins to plasma membrane or in providing them with firm anchorage at the plasma membrane and the cyto- skeletal structure (Rescher and Gerke, 2008). p11 and AnxA2 were also found to localize in the nucleus and interact with nuclear proteins (Das et al., 2010; Liu and Vishwanatha, 2007), although the precise roles of p11 and AnxA2 in the nucleus have not been clearly defined. In this study, we have observed that chronic treatment with an SSRI, fluoxetine (FLX), increases the levels of the p11/AnxA2 complex. We have identified SMARCA3, a chromatin-remodeling factor, as a downstream target of the p11/AnxA2 complex. Our data indicate that the p11/AnxA2/SMARCA3 pathway mediates both neurogenic and behavioral responses to SSRIs. RESULTS Identification of SMARCA3 as a Specific Binding Partner of p11/AnxA2 Complex p11, together with AnxA2, forms a heterotetramer in cells. However, it is not yet established that p11 exists in a protein complex with AnxA2 in brain tissue. Here, we show that the protein level of AnxA2 is drastically downregulated in the frontal cortex and hippocampus of p11 knockout (KO) mice (Figure 1A), despite unchanged levels of AnxA2 transcript (Figure 1B). In contrast, the protein level of AnxA1, another annexin family member, and of S100B, another S100 family member, was not altered in the brain of p11 KO mice, indicating the specificity of the physiological interaction between p11 and AnxA2 in the brain (Figure 1A). We have also observed that p11 protein level in the hippocampal lysates from AnxA2 KO mice is reduced (data not shown). Given that components of a protein complex often stabi- lize each other, the data strongly support the existence of Cell 152, 831–843, February 14, 2013 ª2013 Elsevier Inc. 831
Transcript of SMARCA3, a Chromatin-Remodeling Factor, Is Required · PDF fileSMARCA3, a Chromatin-Remodeling...

SMARCA3, a Chromatin-RemodelingFactor, Is Required for p11-DependentAntidepressant ActionYong-Seok Oh,1 Pu Gao,3 Ko-Woon Lee,1 Ilaria Ceglia,1 Ji-Seon Seo,1 Xiaozhu Zhang,1 Jung-Hyuck Ahn,4 Brian T. Chait,2
Dinshaw J. Patel,3 Yong Kim,1,* and Paul Greengard1,*1Laboratory of Molecular and Cellular Neuroscience2Laboratory of Mass Spectrometry and Gaseous Ion Chemistry
The Rockefeller University, New York, NY 10065, USA3Structural Biology Program, Memorial Sloan-Kettering Cancer Center, New York, NY 10065, USA4Department of Biochemistry, Ewha Womans University School of Medicine, Yangcheon-ku, Seoul 158-710, Republic of Korea
*Correspondence: [email protected] (Y.K.), [email protected] (P.G.)http://dx.doi.org/10.1016/j.cell.2013.01.014
SUMMARY
p11, through unknown mechanisms, is required forbehavioral and cellular responses to selective sero-tonin reuptake inhibitors (SSRIs). We show thatSMARCA3, a chromatin-remodeling factor, is a targetfor the p11/annexin A2 heterotetrameric complex.Determination of the crystal structure indicates thatSMARCA3 peptide binds to a hydrophobic pocketin the heterotetramer. Formation of this complexincreases the DNA-binding affinity of SMARCA3and its localization to the nuclear matrix fraction. Inthe dentate gyrus, both p11 and SMARCA3 are highlyenriched in hilar mossy cells and basket cells. TheSSRI fluoxetine induces expression of p11 in bothcell types and increases the amount of the ternarycomplex of p11/annexin A2/SMARCA3. SSRI-induced neurogenesis and behavioral responsesare abolished by constitutive knockout ofSMARCA3.Our studies indicate a central role for a chromatin-remodeling factor in the SSRI/p11 signaling pathwayand suggest an approach to the development ofimproved antidepressant therapies.
INTRODUCTION
Selective serotonin reuptake inhibitors (SSRIs) are currently the
most widely used class of antidepressants (Berton and Nestler,
2006). SSRI medications generally take several weeks to show
clinical efficacy, including mood elevation, despite their imme-
diate effect on serotonergic neurotransmission. This therapeutic
delay suggests the involvement of complicated downstream
mechanisms, including long-term changes in gene expression
and neuroplasticity. However, our knowledge of the molecular
mechanisms underlying the efficacy of long-term treatment
with SSRIs and of the pathophysiology of depression is still
rudimentary.
p11 (S100A10) is a pivotal regulator of depression-like behav-
iors and a mediator of antidepressant responses (Svenningsson
et al., 2006). Despite the importance of p11 in the actions of
SSRIs, our knowledge about its underlying molecular mecha-
nisms is limited (Svenningsson et al., 2006). Annexin A2
(AnxA2) is a well-characterized binding partner for p11. AnxA2,
together with p11, plays a role in trafficking of membranous/
cytoplasmic proteins to plasma membrane or in providing
themwith firm anchorage at the plasmamembrane and the cyto-
skeletal structure (Rescher and Gerke, 2008). p11 and AnxA2
were also found to localize in the nucleus and interact with
nuclear proteins (Das et al., 2010; Liu and Vishwanatha, 2007),
although the precise roles of p11 and AnxA2 in the nucleus
have not been clearly defined. In this study, we have observed
that chronic treatment with an SSRI, fluoxetine (FLX), increases
the levels of the p11/AnxA2 complex. We have identified
SMARCA3, a chromatin-remodeling factor, as a downstream
target of the p11/AnxA2 complex. Our data indicate that the
p11/AnxA2/SMARCA3 pathway mediates both neurogenic and
behavioral responses to SSRIs.
RESULTS
Identification of SMARCA3 as a Specific Binding Partnerof p11/AnxA2 Complexp11, together with AnxA2, forms a heterotetramer in cells.
However, it is not yet established that p11 exists in a protein
complex with AnxA2 in brain tissue. Here, we show that the
protein level of AnxA2 is drastically downregulated in the frontal
cortex and hippocampus of p11 knockout (KO) mice (Figure 1A),
despite unchanged levels of AnxA2 transcript (Figure 1B). In
contrast, the protein level of AnxA1, another annexin family
member, and of S100B, another S100 family member, was not
altered in the brain of p11 KO mice, indicating the specificity of
the physiological interaction between p11 and AnxA2 in the brain
(Figure 1A). We have also observed that p11 protein level in the
hippocampal lysates from AnxA2 KO mice is reduced (data not
shown). Given that components of a protein complex often stabi-
lize each other, the data strongly support the existence of
Cell 152, 831–843, February 14, 2013 ª2013 Elsevier Inc. 831

Figure 1. p11/AnxA2 as an Antidepressant-
Regulated Protein Complex
(A) Brain lysates from frontal cortex and hippo-
campus of WT (+/+) and p11 KO (�/�) mice were
immunoblotted for p11, AnxA2, S100B, and
AnxA1.
(B) mRNA levels of p11 and AnxA2 in the
hippocampus were measured using qPCR in WT
(+/+) and p11 KO (�/�) mice. Data represent
mean ±SEM.
(C) Coimmunoprecipitation of p11 and AnxA2 from
lysates of N2a neuroblastoma cells and mouse
hippocampus using anti-p11 antibody. IP, immu-
noprecipitate.
(D) WT (+/+) or p11 KO (�/�) mice were adminis-
tered VEH or FLX for 2 weeks. Hippocampal
lysates were immunoblotted for p11, AnxA2, and
b-actin.
(E) Quantitation of the immunoblot shown in (D)
using infrared imaging system (Odyssey; LI-COR).
Data represent mean ±SEM. *p < 0.05 and **p <
0.01, t test. ns, nonsignificant; n.d., not detectable.
a protein complex of p11 and AnxA2 in the brain. In addition, we
were able to coimmunoprecipitate AnxA2 with p11 from lysates
of the hippocampus as well as from lysates of N2a neuroblas-
toma cells (Figure 1C).
Previous studies showed that p11 was induced in the frontal
cortex (Svenningsson et al., 2006) and hippocampus (Warner-
Schmidt et al., 2010) by chronic administration of antidepres-
sants. In the present study, we observed concomitant upre-
gulation of p11 (170.4% ± 7.3% of p11(+/+)-vehicle (VEH) group;
p = 0.004) and of AnxA2 (167.1% ± 20.8%; p = 0.042) (Figures 1D
and 1E). This AnxA2 increase was not observed in p11 KO mice
(Figure 1E). Collectively, these results suggest that p11 and
AnxA2 exist as a protein complex, which can be induced by
antidepressant administration.
Next, we undertook a search for binding partners for p11/
AnxA2. To ensure the specificity of the interaction with the
p11/AnxA2 heterotetramer, we compared wild-type (WT) versus
C83S and C83Q mutants of p11, which prevent the interaction
between p11 and AnxA2 (Kube et al., 1992). C83S and C83Q
mutations in p11 significantly decreased the interaction with
AnxA2, without altering the interaction with endogenous p11 to
form a p11 dimer, suggesting that C83 mutations selectively
interfere with the heterotetramer formation, but not the homodi-
merization of p11 molecules (Figure S1A available online). After
transfection of p11 WT and C83 mutant plasmids into HEK293
cells, we isolated the protein complex of p11 using immunopre-
cipitation (Figure 2A). Four proteins with relative molecular mass
of 700, 260, 125, and 36 kDa were coprecipitated with WT p11
and were identified by mass spectrometry as AHNAK1 (AHNAK
nucleoprotein), SPT6 (suppressor of Ty 6 homolog S. cerevisiae),
832 Cell 152, 831–843, February 14, 2013 ª2013 Elsevier Inc.
SMARCA3 (SWI/SNF-related, matrix-
associated, actin-dependent regulator of
chromatin, subfamily A, member 3), and
AnxA2, respectively (Figure 2A). The iden-
tity of each protein was further confirmed
by immunoblotting with specific anti-
bodies (Figure 2B). AHNAK1, SPT6, and SMARCA3 were copre-
cipitatedwithWT p11, and the interactionwas greatly reduced or
abolished by either C83S or C83Q mutation of p11, indicating
that the interaction likely needs AnxA2 binding to p11. AHNAK1
has been reported as a binding protein of p11/AnxA2 (Benaud
et al., 2004). We focused on SMARCA3 in the following studies
because of the potential physiological importance of this chro-
matin-remodeling factor. To evaluate the role of AnxA2 in the
intermolecular interaction, an in vitro pull-down assay using
GST-p11, AnxA2, and 35S-labeled SMARCA3 was used. The
SMARCA3 interaction was significantly increased by the addi-
tion of AnxA2 to the pull-down assay mixture (Figure S1B). The
interaction of SMARCA3 with p11/AnxA2 was further confirmed
by the inverse immunoprecipitation using anti-SMARCA3
antibodies (Figure 2C). Collectively, these results identified
SMARCA3 as a binding partner of p11/AnxA2.
SMARCA3 belongs to the family of SWI/SNF proteins that use
the energy of ATP hydrolysis to remodel chromatin in a variety of
nuclear processes, such as transcriptional regulation, and DNA
replication and repair (Debauve et al., 2008). SMARCA3 contains
multiple domain structures, including DNA-binding, helicase
ATP-binding, RING-type Zinc finger, and helicase C-terminal
domains (Figure 2D). We next performed in vitro pull-down assay
with a series of deletion constructs of SMARCA3 to determine
the binding region for p11/AnxA2 (Figures 2D, S1C, and S1D).
Although the serial deletion from the SMARCA3 C terminus
had no effect on the interaction with p11 (Figure S1C), the dele-
tion of the N terminus of SMARCA3 abolished the interaction
(Figure S1D), localizing a binding region close to the N terminus
of SMARCA3 (Figure 2D). Through sequence alignment between

Figure 2. Identification of the Binding
Proteins of p11/AnxA2 Complex
(A) Control vector (Vec.) and vectors containingWT
or interaction-defective mutants (C83S and C83Q)
of p11 were transfected into HEK293 cells. Pro-
teins that coprecipitated with WT are marked with
arrowheads (red). A nonspecific band is indicated
by a black arrowhead. The proteins were identified
by tandem mass spectrometry (black arrows).
(B) Immunoblots for AHNAK1, SPT6, SMARCA3,
AnxA2, and Flag-p11, as indicated.
(C) Coimmunoprecipitation of p11/AnxA2/
SMARCA3 complex from brain lysates by two
different anti-SMARCA3 antibodies.
(D) WT, deletion mutants, and a peptide were
tested for their interaction with p11/AnxA2.
(E) Putative p11-binding sequences of AHNAK1
(aa 5654–5671), AHNAK2 (aa 5382–5399), and
SMARCA3 (aa 26–42).
(F) Interaction of the AHNAK1 or SMARCA3
peptides with p11/AnxA2 was confirmed by the
pull-down assay of biotinylated peptides. Scram-
bled peptide was used as control.
See also Figure S1.
AHNAK family proteins and the N terminus of SMARCA3, we
found a highly conserved putative binding motif, represented
byV-P-#-F-X-F (V, hydrophobic amino acid; P, proline; #, basic
amino acid; F, phenylalanine; X, any amino acid) (Figure 2E).
Next, we performed a peptide pull-down assay to validate p11/
AnxA2 binding to the putative binding motif. Indeed, the short
synthetic peptides from AHNAK1, AHNAK2, and SMARCA3
covering the putative motif were sufficient to bind to p11/
AnxA2 (Figure 2F; data not shown for AHNAK2 peptide).
Crystal Structure of p11/AnxA2 Bound to Its TernaryTarget, SMARCA3To understand the molecular interaction of SMARCA3 and
AHNAK1 with p11/AnxA2 in detail, we conducted structural
studies of p11 and AnxA2 complexed with SMARCA3 or
AHNAK1 peptides. We have used a p11-AnxA2 fusion protein
(henceforth named p11-AnxA2 peptide cassette) in which
p11 (1-92) is connected to AnxA2 peptide with a nine amino
Cell 152, 831–843,
acid linker (QENLYFQGD) (Rezvanpour
et al., 2009) to generate complexes
with added SMARCA3 (P26-F39) and
AHNAK1 (G5654-F5668) peptides. Crys-
tals of the complexes with SMARCA3
peptide (Figure 3) and AHNAK1 peptide
(Figure S2) diffracted to 3.0 and 2.0 A
resolution, respectively. The structures
of the two complexes exhibited similar
recognition principles; although the pep-
tide sequences are different, the back-
bones of bound SMARCA3 and AHNAK1
peptides superimpose well with an rmsd
of 0.4 A. The higher-resolution structure
of the AHNAK1 peptide complex (Figures
S2A–S2F) proved useful in resolving ambiguities in the lower-
resolution structure of the SMARCA3 peptide complex (Figures
3A–3F).
We have solved the 3.0 A crystal structure of the complex
between SMARCA3 (P26-F39) peptide and the p11-AnxA2
peptide cassette (Figures 3A and 3B; crystallization statistics in
Table S1). The fusion linker does not affect the binding between
p11 and AnxA2 peptide because we observe the same intermo-
lecular contacts in this complex as those reported previously
for nonlinked components (Rety et al., 1999). The p11-AnxA2
peptide cassette forms a symmetrical dimer, with individual
SMARCA3 peptides (electron density for bound peptide shown
in Figure 3C), binding eachmonomer in the dimer, while retaining
2-fold symmetry (Figures 3A and 3B). Complex formation
between SMARCA3 and p11-AnxA2 peptide cassette is medi-
ated by van derWaals contacts and hydrogen bond interactions,
whereby the SMARCA3 peptide interacts with elements of both
p11 and AnxA2 peptide (Figure 3D). Two highly conserved amino
February 14, 2013 ª2013 Elsevier Inc. 833

Figure 3. Crystal Structure of SMARCA3Peptide Bound to p11-AnxA2PeptideCassette asBinary Complex and to p11 and Full-Length AnxA2
as Ternary Complex
(A) Ribbon view of crystal structure of p11-AnxA2 peptide cassette in complex with SMARCA3 peptide. p11 (blue and green) and AnxA2 peptide (salmon) are
shown in ribbon, with the bound SMARCA3 peptides (yellow) in stick representations.
(B) Space-filling (peptide) and electrostatic surface (p11-AnxA2 peptide cassette) view of the complex illustrating the positioning of the pair of SMARCA3peptides
within the binding groove of the dimeric complex.
(C) Omit 2Fo�Fc electron densitymaps contoured at 1s level of bound SMARCA3 peptide in onemonomer of the complex. AnxA2 peptide (salmon) and p11 (blue)
are represented in ribbon views, SMARCA3 peptide (yellow) is represented in a stick view, and electron density contours are in green.
(D) Intermolecular contacts within one monomer of the complex between the SMARCA3 peptide (yellow) and p11 (blue)-AnxA2 peptide (salmon) cassette, with
hydrogen bonds depicted as red dashed lines.
(legend continued on next page)
834 Cell 152, 831–843, February 14, 2013 ª2013 Elsevier Inc.
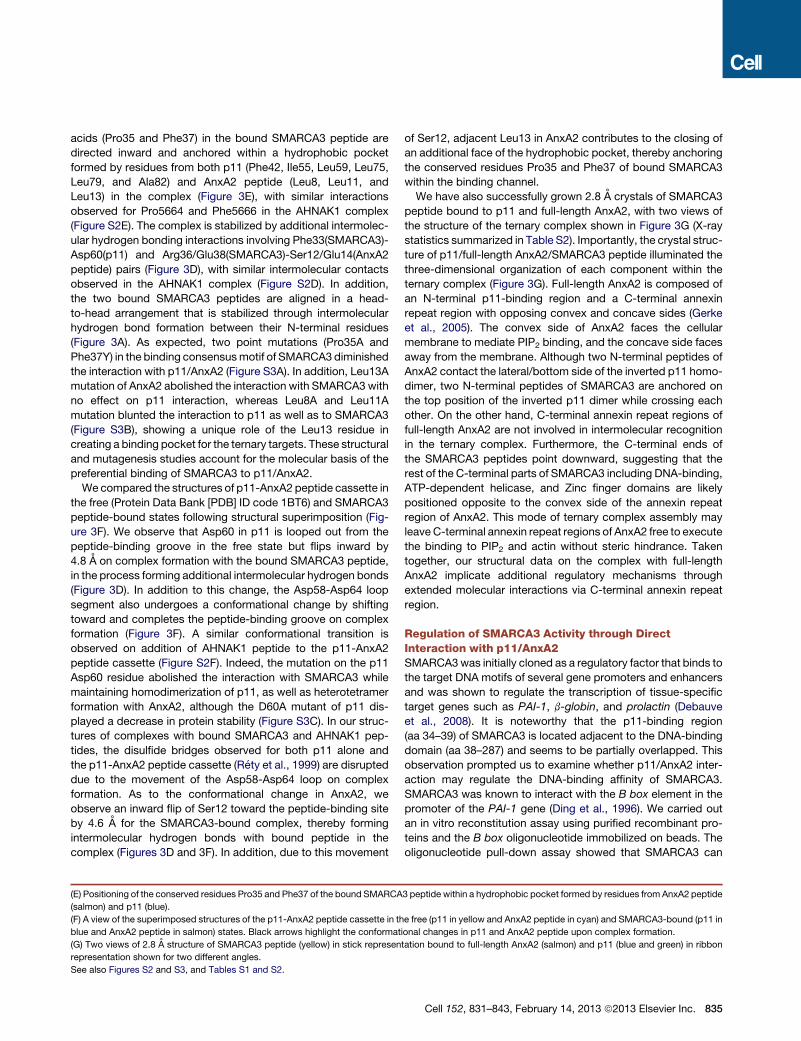
acids (Pro35 and Phe37) in the bound SMARCA3 peptide are
directed inward and anchored within a hydrophobic pocket
formed by residues from both p11 (Phe42, Ile55, Leu59, Leu75,
Leu79, and Ala82) and AnxA2 peptide (Leu8, Leu11, and
Leu13) in the complex (Figure 3E), with similar interactions
observed for Pro5664 and Phe5666 in the AHNAK1 complex
(Figure S2E). The complex is stabilized by additional intermolec-
ular hydrogen bonding interactions involving Phe33(SMARCA3)-
Asp60(p11) and Arg36/Glu38(SMARCA3)-Ser12/Glu14(AnxA2
peptide) pairs (Figure 3D), with similar intermolecular contacts
observed in the AHNAK1 complex (Figure S2D). In addition,
the two bound SMARCA3 peptides are aligned in a head-
to-head arrangement that is stabilized through intermolecular
hydrogen bond formation between their N-terminal residues
(Figure 3A). As expected, two point mutations (Pro35A and
Phe37Y) in the binding consensusmotif of SMARCA3 diminished
the interaction with p11/AnxA2 (Figure S3A). In addition, Leu13A
mutation of AnxA2 abolished the interaction with SMARCA3 with
no effect on p11 interaction, whereas Leu8A and Leu11A
mutation blunted the interaction to p11 as well as to SMARCA3
(Figure S3B), showing a unique role of the Leu13 residue in
creating a binding pocket for the ternary targets. These structural
and mutagenesis studies account for the molecular basis of the
preferential binding of SMARCA3 to p11/AnxA2.
We compared the structures of p11-AnxA2 peptide cassette in
the free (Protein Data Bank [PDB] ID code 1BT6) and SMARCA3
peptide-bound states following structural superimposition (Fig-
ure 3F). We observe that Asp60 in p11 is looped out from the
peptide-binding groove in the free state but flips inward by
4.8 A on complex formation with the bound SMARCA3 peptide,
in the process forming additional intermolecular hydrogen bonds
(Figure 3D). In addition to this change, the Asp58-Asp64 loop
segment also undergoes a conformational change by shifting
toward and completes the peptide-binding groove on complex
formation (Figure 3F). A similar conformational transition is
observed on addition of AHNAK1 peptide to the p11-AnxA2
peptide cassette (Figure S2F). Indeed, the mutation on the p11
Asp60 residue abolished the interaction with SMARCA3 while
maintaining homodimerization of p11, as well as heterotetramer
formation with AnxA2, although the D60A mutant of p11 dis-
played a decrease in protein stability (Figure S3C). In our struc-
tures of complexes with bound SMARCA3 and AHNAK1 pep-
tides, the disulfide bridges observed for both p11 alone and
the p11-AnxA2 peptide cassette (Rety et al., 1999) are disrupted
due to the movement of the Asp58-Asp64 loop on complex
formation. As to the conformational change in AnxA2, we
observe an inward flip of Ser12 toward the peptide-binding site
by 4.6 A for the SMARCA3-bound complex, thereby forming
intermolecular hydrogen bonds with bound peptide in the
complex (Figures 3D and 3F). In addition, due to this movement
(E) Positioning of the conserved residues Pro35 and Phe37 of the bound SMARCA
(salmon) and p11 (blue).
(F) A view of the superimposed structures of the p11-AnxA2 peptide cassette in th
blue and AnxA2 peptide in salmon) states. Black arrows highlight the conformat
(G) Two views of 2.8 A structure of SMARCA3 peptide (yellow) in stick represen
representation shown for two different angles.
See also Figures S2 and S3, and Tables S1 and S2.
of Ser12, adjacent Leu13 in AnxA2 contributes to the closing of
an additional face of the hydrophobic pocket, thereby anchoring
the conserved residues Pro35 and Phe37 of bound SMARCA3
within the binding channel.
We have also successfully grown 2.8 A crystals of SMARCA3
peptide bound to p11 and full-length AnxA2, with two views of
the structure of the ternary complex shown in Figure 3G (X-ray
statistics summarized in Table S2). Importantly, the crystal struc-
ture of p11/full-length AnxA2/SMARCA3 peptide illuminated the
three-dimensional organization of each component within the
ternary complex (Figure 3G). Full-length AnxA2 is composed of
an N-terminal p11-binding region and a C-terminal annexin
repeat region with opposing convex and concave sides (Gerke
et al., 2005). The convex side of AnxA2 faces the cellular
membrane to mediate PIP2 binding, and the concave side faces
away from the membrane. Although two N-terminal peptides of
AnxA2 contact the lateral/bottom side of the inverted p11 homo-
dimer, two N-terminal peptides of SMARCA3 are anchored on
the top position of the inverted p11 dimer while crossing each
other. On the other hand, C-terminal annexin repeat regions of
full-length AnxA2 are not involved in intermolecular recognition
in the ternary complex. Furthermore, the C-terminal ends of
the SMARCA3 peptides point downward, suggesting that the
rest of the C-terminal parts of SMARCA3 including DNA-binding,
ATP-dependent helicase, and Zinc finger domains are likely
positioned opposite to the convex side of the annexin repeat
region of AnxA2. This mode of ternary complex assembly may
leave C-terminal annexin repeat regions of AnxA2 free to execute
the binding to PIP2 and actin without steric hindrance. Taken
together, our structural data on the complex with full-length
AnxA2 implicate additional regulatory mechanisms through
extended molecular interactions via C-terminal annexin repeat
region.
Regulation of SMARCA3 Activity through DirectInteraction with p11/AnxA2SMARCA3was initially cloned as a regulatory factor that binds to
the target DNA motifs of several gene promoters and enhancers
and was shown to regulate the transcription of tissue-specific
target genes such as PAI-1, b-globin, and prolactin (Debauve
et al., 2008). It is noteworthy that the p11-binding region
(aa 34–39) of SMARCA3 is located adjacent to the DNA-binding
domain (aa 38–287) and seems to be partially overlapped. This
observation prompted us to examine whether p11/AnxA2 inter-
action may regulate the DNA-binding affinity of SMARCA3.
SMARCA3 was known to interact with the B box element in the
promoter of the PAI-1 gene (Ding et al., 1996). We carried out
an in vitro reconstitution assay using purified recombinant pro-
teins and the B box oligonucleotide immobilized on beads. The
oligonucleotide pull-down assay showed that SMARCA3 can
3 peptide within a hydrophobic pocket formed by residues from AnxA2 peptide
e free (p11 in yellow and AnxA2 peptide in cyan) and SMARCA3-bound (p11 in
ional changes in p11 and AnxA2 peptide upon complex formation.
tation bound to full-length AnxA2 (salmon) and p11 (blue and green) in ribbon
Cell 152, 831–843, February 14, 2013 ª2013 Elsevier Inc. 835

Figure 4. SMARCA3 Regulation by p11/
AnxA2 Complex
(A) The B box oligonucleotide was incubated with
the N-terminal domain of SMARCA3 (aa 1–350)
and p11 and/or AnxA2. Bound proteins were
immunoblotted.
(B) Quantitation of SMARCA3 bound to the B box
oligonucleotide.
(C) Whole cells (WC) and the nuclear matrix (NM)
were prepared from control (Control) or p11-
knockdown (KD) COS-7 cells and immunostained
with the indicated antibodies. Arrows indicate
knockdown cells, and open arrowheads show
nonknockdown cells. Scale bars, 20 mm.
(D) Whole-cell lysates and NM were prepared from
COS-7 cells transfected as indicated and im-
munoblotted for SMARCA3-V5 (a-V5), p11, AnxA2,
and Lamin-B (nuclear matrix marker).
(E) Transcriptional activity of SMARCA3 in N2a
cells after cotransfection of luciferase reporter
gene conjugated to PAI-1 promoter, together with
indicated plasmids. Immunoblots of cell lysates
and luciferase activity are shown.
(F) Transcriptional activity of SMARCA3 in Control
or p11-knockdown (KD) COS-7 cells transfected
with indicated SMARCA3 plasmids.
Mean ±SEM. *p < 0.05, **p < 0.01, and ***p < 0.001,
t test.
form a quaternary complex together with p11/AnxA2 and the
B box oligonucleotide (Figure 4A). Furthermore, p11/AnxA2
interaction increases the DNA-binding affinity of SMARCA3 by
up to 2.5-fold, whereas the equivalent amount of AnxA2 alone
did not show any effect (Figure 4B).
The distinct subnuclear localizations of nuclear factors are
essential to conduct chromatin remodeling, transcription, repli-
cation, and mRNA processing (Zaidi et al., 2007). In fact, among
SWI/SNF family chromatin remodelers, the hBAF (Brg1-associ-
ated factors) complex is known to be targeted to the nuclear
matrix/chromatin through direct interaction with nuclear PIP2
836 Cell 152, 831–843, February 14, 2013 ª2013 Elsevier Inc.
and actin/actin-related protein (Rando
et al., 2002; Zhao et al., 1998). It is well
established that p11/AnxA2 binds to
PIP2 as well as actin (Rescher and Gerke,
2008). Thus, we examined the possibility
that p11/AnxA2 may regulate the subnu-
clear localization of SMARCA3. In the
whole-cell preparation, p11 is predomi-
nantly cytoplasmic, and a much less but
significant level of p11 is in the nucleus,
whereas SMARCA3 is mainly localized
inside the nucleus. Our unpublished stud-
ies with primary cultured neurons indicate
that p11, together with AnxA2, shuttles
between cytoplasm and nucleus (data
not shown). In the nuclear matrix, which
is prepared after cell permeabilization fol-
lowed by chromatin digestion, the pres-
ence and the colocalization of p11 and
SMARCA3 are evident (Figure 4C). Impor-
tantly, the retention of SMARCA3 in the nuclear matrix is dramat-
ically reduced by the silencing of p11 expression with siRNA.
Consistent with that, biochemical fractionation of the nuclear
matrix revealed that WT SMARCA3 is in the nuclear matrix prep-
aration, whereas the P35A mutant, defective in p11/AnxA2 inter-
action, is not (Figure 4D), confirming the importance of the p11/
AnxA2 complex in the subnuclear localization of SMARCA3.
Taken together, p11/AnxA2 not only increases the DNA-
binding affinity of SMARCA3 but also anchors SMARCA3 to
the nuclear matrix presumably via the interaction of AnxA2 with
actin and PIP2.

Figure 5. SSRI Regulates p11 Expression in
Mossy Cells and Basket Cells in the Dentate
Gyrus
(A) Cell types expressing [p11]-EGFP in the dentate
gyrus. CRT (hilar mossy cells [MC]), parvalbumin
(PV, subpopulation of basket cells [BC(PV+)]),
calbindin (CBD, mature granule cells [GC]) neuro-
peptide Y (NPY, hilar interneurons perforant path
[HIPP]), glial fibrillary acidic protein (GFAP, astro-
cytes), and nestin (neural stem cells [SC]) were
used to identify cell types. Solid arrowheads indi-
cate representative doubly labeled cells. Open
arrowheads show cells labeled only with markers.
Scale bars, 20 mm.
(B) Distinct laminar projections of mossy cells
and parvalbumin-positive basket cells in the den-
tate gyrus. GCL, granule cell layer; OML, outer
molecular layer. Scale bar, 100 mm.
(C–E) Induction of [p11]-EGFP in dentate gyrus by
chronic SSRI. The dentate gyrus slices were
costained with anti-EGFP antibody (C and D) and
either anti-CRT (C) or anti-PV (D) antibodies. Scale
bars, 100 mm. EGFP intensity was quantitated in
the indicated subregions (E). Values were nor-
malized to fluorescence intensity in OML. Data
represent mean ±SEM (n = 5–6 mice per group).
*p < 0.05 and **p < 0.01, t test. Rel. Fluorescence,
relative fluorescence.
See also Figure S4.
To assess the functional consequence of p11-AnxA2 interac-
tion in the transcriptional activity of SMARCA3, we utilized a
PAI-1 promoter-driven luciferase reporter assay. First, we exam-
ined the effect of overexpression of the p11/AnxA2 complex in
N2a cells, which express low endogenous levels of p11 and
AnxA2. Cotransfection of SMARCA3 with p11 and AnxA2 poten-
tiated luciferase activity (Figure 4E). In addition, we examined the
effect of p11 gene silencing in COS-7 cells, which express rela-
tively higher endogenous levels of p11 and AnxA2. The silencing
of the p11 gene leads to the downregulation of SMARCA3-
mediated luciferase activity (Figure 4F). In the same experimental
set, we also compared WT SMARCA3 with its mutants (P35A,
F37Y) defective in the interaction with the p11/AnxA2 complex.
As expected, SMARCA3-mediated luciferase activity was abol-
ished in the two mutants (Figure 4F). Collectively, these results
suggest that p11/AnxA2 regulates transcriptional activity of
SMARCA3 by controlling the DNA-binding affinity of SMARCA3,
as well as its localization.
Regulation of the p11/AnxA2/SMARCA3 Complex inHilar Mossy Cells and Basket Cells in the Dentate Gyrusp11 mediates the actions of antidepressants (Svenningsson
et al., 2006). Chronic antidepressant administration increased
the level of p11 in the hippocampus (Figures 1D and 1E). Antide-
pressant actions including neurogenesis require several weeks
Cell 152, 831–843,
to show therapeutic effects. SMARCA3-
mediated regulation of transcription may
be associated with the therapeutic delay.
Our previous study showed that p11 is
expressed in GABAergic basket cells in
the dentate gyrus and might play a critical role in antidepres-
sant-induced hippocampal neurogenesis (Egeland et al., 2010).
We thus examined the neuronal types expressing p11 and
SMARCA3 in the dentate gyrus.
We took advantage of BAC (bacterial artificial chromosome)
transgenic mice (Heintz, 2001), in which the expression of
EGFP reporter is driven by p11 promoter activity ([p11]-EGFP).
The excellence of immunostaining analysis using anti-EGFP anti-
body enabled us to visualize the entire neuronal processes of
the neurons expressing p11. Because EGFP-positive neurons
in the BAC-[p11]-EGFPmice are doubly positive for the immuno-
staining of endogenous p11, EGFP-positive neurons represent
p11-expressing neurons (Figure S4A). p11-expressing cells as-
sessed with [p11]-EGFP signal localize in the hilus region of
the dentate gyrus (Figure 5A). To identify neuronal types for the
p11-expressing neurons, hippocampal sections from BAC-
[p11]-EGFP transgenic mice were doubly stained with EGFP
and neuronal-type markers. Notably, [p11]-EGFP reporter signal
was found to be enriched both in calretinin (CRT)-positive mossy
cells and in PV-positive basket cells, whereas the signal was
negligible in granule cells and is rarely (<5%) observed in HIPP
cells (Figure 5A). Furthermore, p11 expression is not observed
in astrocytes or neural stem cells (Figure 5A).
We next examined whether p11 expression in hippocampal
neuronal subpopulations is altered in response to antidepressant
February 14, 2013 ª2013 Elsevier Inc. 837

Figure 6. SMARCA3 Expression in Mossy
Cells and Basket Cells in the Dentate Gyrus
(A) Dentate gyrus slices from WT (top) or
SMARCA3 KO mice (bottom) stained with anti-
SMARCA3 antibody (red) and nuclear dye DraQ5
(blue). Scale bars, 100 mm.
(B) Neuronal cell types expressing SMARCA3
in the dentate gyrus. Scale bars, 20 mm. Repre-
sentative cells doubly labeled are indicated by
arrowheads.
(C) Coexpression of [p11]-EGFP and SMARCA3.
BAC-[p11]-EGFP mice were stained with anti-
EGFP and anti-SMARCA3 antibodies. Represen-
tative cells doubly labeled are indicated by
arrowheads. Scale bar, 20 mm.
(D and E) Level of SMARCA3 is not altered by FLX
administration for 2 weeks. Hippocampal lysates
were immunoblotted for SMARCA3 and b-actin
(D). mRNA level of SMARCA3 in the hippocampus
was measured using qPCR (E). Data repre-
sent mean ±SEM (n = 6–7 mice per group). ns,
nonsignificant.
(F) Formation of p11/AnxA2/SMARCA3 complex is
increased after treatment with FLX for 2 weeks.
SMARCA3 was immunoprecipitated from hippo-
campal lysates. Total lysates and immunoprecip-
itates (IPs) were immunoblotted for SMARCA3,
p11, and AnxA2.
See also Figure S5.
administration. We took advantage of the distinct laminar
segregation of the two types of p11-expressing neurons. The
mossy cells assessed by CRT expression locate their soma
and dendrites within the deep hilus and project their axonal
arbor to the inner molecular layer (IML), whereas a subpopula-
tion of basket cells visualized by PV staining locates its somas
in the hilar border and projects its axons to the granule cells
within the granular cell layer (GCL) (Figure 5B). Because p11
is mainly enriched in mossy cells and basket cells, the [p11]-
EGFP signal in the hilus and IML represents p11 promoter
activity in mossy cells, and the signal of EGFP in GCL does
for basket cell activity. BAC-[p11]-EGFP mice were treated
with FLX for 2 weeks, and [p11]-EGFP signal was examined
in the areas of hilus, IML, and GCL (Figures 5C–5E). Because
a high density of serotonergic innervation prevails in the caudal
part of the hippocampal formation, whereas the rostral part
receives only a moderate-to-weak serotonergic innervation
(Bjarkam et al., 2003; Gage and Thompson, 1980), the caudal
part (bregma �2.5 to �4.0) of the dentate gyrus was used for
the analysis. FLX treatment increased [p11]-EGFP in the den-
tate gyrus (Figures 5C and 5D). Quantitative analysis revealed
that FLX increased [p11]-EGFP intensity in hilus and IML as
well as in GCL, suggesting p11 induction in mossy cells and
basket cells (Figure 5E). p11 is also induced in the rostral part
of the hippocampus but with less potency (Figure S4B).
AnxA2, together with p11, is induced by FLX and requires
p11 for its protein stability (Figures 1D and 1E). Conversely,
p11 protein requires AnxA2 for its protein stability (data not
838 Cell 152, 831–843, February 14, 2013 ª2013 Elsevier Inc.
shown). Thus, AnxA2 is also likely to be induced in the same
neurons.
We examined the expression of SMARCA3 in the dentate
gyrus by immunohistochemistry. The specificity of the immuno-
staining was tested using SMARCA3 KO mice. SMARCA3 KO
mice were generated by targeting exons 11–13 of the SMARCA3
gene (Figure S5A). Immunoblotting (Figures S5B and S5C) and
immunohistochemistry (Figure 6A) confirmed the absence of
SMARCA3. SMARCA3 is expressed primarily in the hilar area
of the dentate gyrus (Figure 6A), where it is enriched in mossy
cells and parvalbumin-positive basket cells (Figure 6B), and is
expressed in [p11]-EGFP-positive cells (Figure 6C).
In contrast to p11 and AnxA2 (Figures 1D and 1E), the levels of
SMARCA3 protein (Figure 6D) and mRNA (Figure 6E) were not
altered after treatment with FLX. Analysis of hippocampal
lysates, following immunoprecipitation of SMARCA3, revealed
that chronic FLX administration increased the ternary complex
of p11/AnxA2/SMARCA3 by about 2.3-fold (Figure 6F). Thus,
p11 and AnxA2 induction facilitates the assembly of the p11/
AnxA2/SMARCA3 complex. Taken together, these results iden-
tify the mossy cells and the basket cells in the dentate gyrus as
primary neuronal types for SSRI/p11/SMARCA3 signaling.
SMARCA3 Is Required for Neurogenic and BehavioralResponse to Chronic SSRI Administrationp11 KO results in the loss of enhanced hippocampal neurogen-
esis and behavioral change in response to chronic antidepres-
sant treatment (Egeland et al., 2010), suggesting a crucial role

Figure 7. SMARCA3 Is Required for SSRI-
Induced Neurogenesis and Behavioral
Changes
(A and B) FLX-induced cell proliferation in WT and
SMARCA3 KO mice. WT (+/+) and SMARCA3 KO
(�/�) mice were administered VEH or FLX for
14 days and labeledwith BrdU for the last 2 hr prior
to perfusion. (A) Immunostaining with anti-BrdU.
Scale bars, 100 mm. (B) Quantitation of BrdU-
positive cells in the subgranular zone (n = 6–8 mice
per group).
(C and D) FLX-induced increase of DCX-positive
cells in WT and SMARCA3 KO mice. (C) Immu-
nostaining with anti-DCX. Scale bars, 20 mm. (D)
Quantitation of DCX-positive cells in the sub-
granular and granular zone (n = 6–8 per group).
(E and F) Survival of newborn cells in WT and
SMARCA3KOmice treatedwith VEH or FLX. BrdU
was injected for three consecutive days prior to
FLX administration for 28 days. (E) Immunostaining
with anti-BrdU and anti-NeuN. Scale bars, 100 mm.
(F) Quantitation of BrdU-positive cells.
(G and H) Behavior was assayed using (G) the NSF
paradigm after chronic administration of VEH or
FLX (4 weeks, n = 14–16 per group), or (H) the SPT
in NS or RS mice after chronic administration of
VEH or eCIT (4 weeks, n = 8–11 per group).
All data represent mean ±SEM. *p < 0.05, **p <
0.01, and ***p < 0.001, two-way ANOVA followed
by the post hoc Bonferroni test. ns, nonsignificant.
See also Figure S6 and Table S3.
for p11 and its downstream signaling pathways in those
antidepressant actions. We examined here whether SMARCA3,
as a downstream signaling molecule of p11, might mediate
chronic antidepressant-induced hippocampal neurogenesis
and behaviors.
Adult neurogenesis is controlled by multistep processes
including the proliferation of neural progenitors, differentiation,
and maturation into functional granule neurons (Ming and
Song, 2011). We examined proliferation using in vivo BrdU
labeling of the neural progenitors in the S phase in WT and
SMARCA3 KO mice. A significant increase was observed in
the number of BrdU-labeled neural progenitors in WT mice
Cell 152, 831–843,
treated with FLX (160.6% ± 13.7% of
VEH group; p < 0.01), but not in
SMARCA3 KO mice (Figures 7A and
7B). We also carried out an alternative
assay measuring an endogenous mitotic
marker Ki-67. Ki-67-positive cells were
significantly increased in response to
FLX in WT mice (143.8% ± 8.6%; p <
0.01), but not in SMARCA3 KO mice
(Figures S6A and S6B), confirming the
results of the BrdU assay.
We next analyzed the expression level
of doublecortin (DCX), a marker for
immature neurons, which represents a
snapshot of newborn cells undergoing
neuronal maturation and differentiation
(Couillard-Despres et al., 2005). DCX immunofluorescence
signal was increased by chronic FLX administration in WT mice
(218.4% ± 18.0%; p < 0.001), but not in SMARCA3 KO mice
(Figures 7C and 7D). Chronic FLX administration promotes the
newborn cells to survive at postmitotic stages and also to
becomemature neurons (Wang et al., 2008). Chronic FLX admin-
istration greatly increased the survival of the BrdU-labeled
newborn cells in WT mice (288.2% ± 21.1%; p < 0.01), but the
effect of FLX was attenuated in SMARCA3 KO mice (196.0% ±
20.3%; p < 0.05) (Figures 7E and 7F). Taken together, these
results indicate that SMARCA3 contributes to multiple stages
of antidepressant-stimulated neurogenesis, and this phenotype
February 14, 2013 ª2013 Elsevier Inc. 839

of SMARCA3 KOmice is reminiscent of that observed in p11 KO
mice (Egeland et al., 2010).
Next, we investigated the functional significance of the p11/
AnxA2/SMARCA3 complex for SSRI-induced behavioral
changes. WT and SMARCA3 KOmice did not display a baseline
difference in locomotor activity (open field test, Figure S6C),
depressive behaviors (tail suspension test [TST] and sucrose
preference test [SPT], Figures S6D and S6E), or anxiety behav-
iors (light/dark and elevated plus maze tests, Figures S6F and
S6G). Novelty-suppressed feeding (NSF) is believed to represent
depression-like and anxiety behavior, and this test is commonly
used to measure the chronic effect of antidepressants (David
et al., 2009; Surget et al., 2011). p11 KO mice are refractory to
behavioral change in response to chronic FLX administration in
the NSF test (Egeland et al., 2010; Schmidt et al., 2012). In the
same model, we analyzed the behavior of SMARCA3 KO mice.
Chronic treatment with FLX shortened latency to feed compared
to VEH treatment in WT mice (VEH versus FLX, 279 ± 13 versus
187 ± 20; p < 0.01), but not in SMARCA3 KO mice (Figure 7G),
as with p11 KO mice (Egeland et al., 2010). Neither FLX nor
SMARCA3 KO caused any significant effect on home cage
feeding (Figure S6H) or body weight (data not shown).
Anhedonia is a core symptom of human depression (Berton
and Nestler, 2006), and a chronic stress-induced decrease in
sucrose preference in rodents is regarded as a sign of a hedonic
deficit (Katz, 1982), which can be treated with chronic SSRI. We
examined the effect of chronic administration of escitalopram
(eCIT, another SSRI) on the behaviors of nonstressed (NS)
or restraint-stressed (RS) mice in the SPT. Daily restraint for
14 days induced a reduction of sucrose consumption in both
WT (NS plus VEH versus RS plus VEH, 100% ± 12% versus
68% ± 8%, respectively) and SMARCA3 KO mice (NS plus
VEH versus RS plus VEH, 97% ± 6% versus 61% ± 8%, respec-
tively). Poststress treatment with eCIT recovered sucrose
consumption to the normal level in WTmice (RS plus VEH versus
RS plus eCIT, 68% ± 8% versus 99% ± 13%, respectively), but
not in SMARCA3 KO mice (Figure 7H). No differences were
observed between WT and SMARCA3 KO mice as well as
among the experimental groups used for the SPT with regard
to their locomotor activities (Figure S6I). Notably, the behavioral
despair in the TST is known to be treated by acute SSRI, whereas
the therapeutic effect of SSRI in the NSF and SPT requires
chronic treatment. SMARCA3 KO did not alter the effect of acute
administration of eCIT in the TST (Figure S6J). Taken together,
our results suggest a crucial role for SMARCA3 in p11-depen-
dent neurogenic and behavioral response to chronic antidepres-
sant administration.
DISCUSSION
Molecular Interaction of p11/AnxA2 with SMARCA3p11 and AnxA2 cooperate to create a unique binding pocket, but
the optimal binding condition is not achieved without conforma-
tional changes associated with target binding. Upon interaction
with the SMARCA3 peptide, both Asp60 in p11 and Ser12
in AnxA2 flip inward toward the peptide-binding groove,
forming additional intermolecular hydrogen bonds (Figures
3D–3F). Similar intermolecular contacts were also observed in
840 Cell 152, 831–843, February 14, 2013 ª2013 Elsevier Inc.
the AHNAK1 complex (Figures S2D–S2F). These findings
support an induced-fit model for the assembly of the p11/
AnxA2/SMARCA3 complex. Among the key residues found in
the binding pocket, the role of Ser12 (AnxA2) is of particular
interest because this residue is regulated by phosphorylation
(Jost and Gerke, 1996), which may interfere with high-affinity
binding of ternary targets.
The current study identifies a binding motif, which is repre-
sented as f-P-#-F-X-F, and can be used for in silico analysis
to identify binding targets of p11/AnxA2. Our binding motif is
different from the p11-binding sequences previously reported
for TRPV5/6 (VATTV) (van de Graaf et al., 2003) and TASK1
(RRSSV) (Girard et al., 2002). It is possible that the p11/AnxA2
heterotetramer has additional binding pocket(s) on the surface.
Regulation of SMARCA3 Function by Interaction withthe p11/AnxA2 ComplexMost chromatin remodelers, including four well-characterized
subfamily members (SWI/SNF, INO80/SWR1, ISWI, and CHD),
form a large multisubunit complex with a core ATPase motor
subunit and unique accessory/regulatory subunits (Hargreaves
and Crabtree, 2011). The core subunit displays DNA- and nucle-
osome-dependent ATPase activity, and the accessory/regula-
tory subunits are essential for the function of the core ATPase
subunit, by facilitating the interaction with the transcriptional
regulatory factors, mediating the indirect binding to DNA and/
or modified histones, and targeting the complex to subnuclear
locations (Mohrmann andVerrijzer, 2005). SMARCA3, a relatively
uncharacterized member of the SWI/SNF protein family, is
composed of multiple functional domains, including a DNA-
binding domain, a SWI2/SNF2 ATPase domain, a RING-type
zinc finger domain for the binding to RFBP, a Type IV P-type
ATPase, and a C-terminal domain for the binding of transcription
factors such as Sp1, Sp3, Egr1, and cRel (Debauve et al., 2008)
(Figure 2D). Although p11 and AnxA2 stabilize each other as
structural components of a protein complex (Figure 1), the levels
of p11 and AnxA2 are not altered in SMARCA3 KOmice (Figures
S5B and S5C), and the level of SMARCA3 is not altered in p11
KO mice (data not shown). Thus, p11 and AnxA2 act as regula-
tory proteins but are not likely structural core components of
SMARCA3. Notably, the DNA-binding domain at the N-terminal
side of the ATPase domain mediates the sequence-dependent
binding of SMARCA3 to the target DNA (Debauve et al., 2008).
p11/AnxA2 facilitates the DNA-binding affinity of SMARCA3
(Figures 4A and 4B). Most chromatin-remodeling complexes,
including SMARCA3, display DNA- and/or nucleosome-depen-
dent ATPase activity (Hargreaves and Crabtree, 2011). There-
fore, it is conceivable that the enhanced DNA binding of
SMARCA3, upon the interaction with p11/AnxA2, may lead to
the activation of SMARCA3 to initiate ATP-dependent chromatin
remodeling of the target genes. Thus, p11/AnxA2 binding to
SMARCA3 would open the chromatin structure and recruit
specific transcription factors bound to the C-terminal domain
of SMARCA3 to the specific locus of the genomic DNA.
Critical nuclear events such as gene expression, replica-
tion, and repair processing occur at a distinct subnuclear
region, the nuclear matrix, which is composed of nuclear
lamins, nuclear actin/actin-related proteins, and phospholipids

(Barlow et al., 2010; Zaidi et al., 2007). Indeed, key gene regula-
tory machineries such as transcription factors, chromatin-
remodeling complexes, RNA polymerase II, and processing
factor SC35 are associated with nuclear matrix structures (Zaidi
et al., 2007). p11/AnxA2 mediates the subnuclear targeting of
SMARCA3 (Figures 4C and 4D). The subnuclear targeting of
SMARCA3 is likely controlled by intrinsic phospholipid- and
actin-binding properties of AnxA2 (Gerke et al., 2005). Our
crystal structure of p11/full-length AnxA2/SMARCA3 peptide
visualized the spatial organization of each component in the
ternary complex, in which the p11 dimer is ideally positioned in
the core of the complex to link SMARCA3 to AnxA2 (Figure 3G).
Thus, our current model is reminiscent of the role of p11/AnxA2
in mediating the membrane translocation of AHNAK1 (Benaud
et al., 2004). Both SMARCA3 and AHNAK1 use the interaction
with p11/AnxA2 to localize properly to the distinct subcellular
sites where they become functionally active.
p11/AnxA2/SMARCA3 Complex in AntidepressantActionp11/AnxA2/SMARCA3 complex-mediated hippocampal neuro-
genesis may contribute to the behavioral response to SSRIs.
However, the involvement of hippocampal neurogenesis in
depression andantidepressant-inducedbehavioral change is still
controversial (Hanson et al., 2011). Such neurogenesis has been
associated with mood, stress responses, and antidepressant
effects in some studies (Santarelli et al., 2003; Snyder et al.,
2011; Surget et al., 2011), but not in others (Bessa et al., 2009).
p11 and SMARCA3 are enriched in mossy cells and basket
cells but not detectable in neural progenitor cells. Thus, the
regulation of SSRI-induced neurogenesis by the p11/AnxA2/
SMARCA3 signaling pathway is non-cell autonomous. In fact,
GABAergic interneurons play an important role in the differentia-
tion, development, and integration of newborn neurons (Ge et al.,
2006; Tozuka et al., 2005). Specifically, interneuronal GABA
release is thought to act directly on neural progenitor cells and,
due to an age-specific increase in intracellular chloride levels in
these young cells, causes an atypical depolarization that subse-
quently affects neurogenic processes (Tozuka et al., 2005). The
synaptic regulation of granule cells by basket and mossy cells
may contribute to the neurogenic and behavioral responses to
SSRIs. It has been suggested that, upon activation by local
inputs from the granule cells in the dentate gyrus, glutamatergic
mossy cells primarily provide excitatory feedback to the granule
cells through their axonal projections to the IML and also provide
excitatory drive to local GABAergic HIPPs in the hilus (Henze and
Buzsaki, 2007; Scharfman, 1995). The basket cells primarily
provide feedforward inhibition to the granule cells in response
to excitatory inputs from the entorhinal cortex and feedback inhi-
bition to the granule cells in response to excitatory inputs from
the granule cells (Houser, 2007). Thus, despite their relatively
low abundance (�33 104mossy cells and 0.53 104 basket cells
versus 1 3 106 granule cells in rat), the mossy cells and basket
cells regulate the flow of extrinsic input to the dentate gyrus
through modulation of the activity of the granule cells and/or
the HIPPs, and such regulation is important to generate the
distinct oscillation patterns of neuronal excitation in the dentate
gyrus (Amaral et al., 2007; Henze and Buzsaki, 2007).
In this study, we have identified and characterized a nuclear
protein complex mediating chronic actions of SSRIs. Many inter-
esting questions have been raised as a result of this study: What
are the roles of p11 and SMARCA3 in the excitability and
synaptic transmission of basket cells and mossy cells? Which
genes are regulated by the p11/AnxA2/SMARCA3 complex in
basket cells and mossy cells? Which of these genes contribute
to the neurogenic and behavioral responses to antidepressants?
Current and future studies of the p11/AnxA2/SMARCA3
pathway should contribute not only to our understanding of
SSRI actions but also provide molecular and cellular targets for
the development of advanced therapeutics for mood and anxiety
disorders.
EXPERIMENTAL PROCEDURES
Generation of Transgenic Mice
All procedures involving animals were approved by the Rockefeller University
Institutional Animal Care and Use Committee and were in accordance with the
National Institutes of Health guidelines. The constitutive SMARCA3 KO mice
were generated in Taconic-Artemis (Germany) and maintained at The Rock-
efeller University. The BAC-[p11]-EGFP transgenic line (GENSAT; Clone No.
HC85) was provided by GENSAT (Gong et al., 2002). The mouse breeding
and drug treatment methods are in the Extended Experimental Procedures.
Crystallization and Structure Determination of p11/AnxA2/
SMARCA3 and p11/AnxA2/AHNAK1 Complexes
Details of protein preparations, protein expression, purification, crystallization
conditions, data collection, and refinement are included in Extended Experi-
mental Procedures.
Preparation of Nuclear Matrix Fraction
Cells were incubated with cell-permeable crosslinker, DSP (1 mM), and
extracted with CSK buffer containing 0.5% NP40. After chromatin digestion
with DNase I and then elution with 0.25 M (NH4)2SO4, the nuclear matrix
fraction was scraped for the biochemical assay or fixed with 2% parafor-
maldehyde for immunocytochemistry (detailed description is in Extended
Experimental Procedures).
Histological Methods
Immunostaining was carried out using the standard free-floating method.
Detailed description of antibody preparation, antigen retrieval, image acquisi-
tion, and quantification is in Extended Experimental Procedures.
Behavioral Analysis
Mood and anxiety-related behaviors (NSF, SPT, TST, light-dark box test, and
elevated plus maze) and locomotor activity (open field test) were tested as
described in Extended Experimental Procedures.
Data Analysis and Statistics
All data are presented as mean ±SEM. Two group comparisons were done by
two-tailed, unpaired Student’s t test. Multiple group comparisons were as-
sessed using a one-way or two-way ANOVA, followed by the post hoc
Newman-Keuls test or Bonferroni test, respectively, when significant main
effects or interactions were detected. Statistical significance was set at p <
0.05 level. Summary of statistical analysis for animal experiments is included
as Table S3.
ACCESSION NUMBERS
Coordinates and structure factors for p11-AnxA2 peptide cassette in complex
with AHNAK1 peptide (PDB 4HRG) and SMARCA3 peptide (PDB 4HRH) and
full-length p11/AnxA2 heterotetramer in complex with SMARCA3 peptide
(PDB 4HRE) have been deposited in the RCSB Protein Data Bank.
Cell 152, 831–843, February 14, 2013 ª2013 Elsevier Inc. 841

SUPPLEMENTAL INFORMATION
Supplemental Information includes Extended Experimental Procedures, six
figures, and three tables and can be found with this article online at http://
dx.doi.org/10.1016/j.cell.2013.01.014.
ACKNOWLEDGMENTS
This work was supported by DOD/USAMRAA Grant W81XWH-09-1-0392 to
Y.K.; DOD/USAMRAA Grant W81XWH-09-1-0402 to P. Greengard; the JPB
Foundation to P. Greengard; the Fisher Center Foundation to P. Greengard;
NIH grants (MH090963, DA10044, and AG09464) to Y.K. and P. Greengard;
and the Maloris Foundation and the Abby Rockefeller Mauze Trust to D.J.P.
We thank the staff at beamline 24ID-C of the Advanced Photon Source at
the Argonne National Laboratory and beamline X29 of the National Synchro-
tron Light Source at the Brookhaven National Laboratory for assistance with
data collection. We thank Daesoo Kim, Eric Schmidt, Jennifer Wagner-
Schmidt, and YotamSagi for their helpful advice and discussion, and Elisabeth
Griggs for technical assistance.Wewould like to thank Ji-Eun Kim for themass
spectrometry analysis. Finally, we would like to acknowledge Rada Norinsky
and the Rockefeller University Transgenics Services Laboratory for their excel-
lent IVF services; and Henry Zebroski III and Nagarajan Chandramouli from
The Rockefeller University Proteomics Resource Center.
Received: May 16, 2012
Revised: September 14, 2012
Accepted: January 8, 2013
Published: February 14, 2013
REFERENCES
Amaral, D.G., Scharfman, H.E., and Lavenex, P. (2007). The dentate gyrus:
fundamental neuroanatomical organization (dentate gyrus for dummies).
Prog. Brain Res. 163, 3–22.
Barlow, C.A., Laishram, R.S., and Anderson, R.A. (2010). Nuclear phosphoino-
sitides: a signaling enigma wrapped in a compartmental conundrum. Trends
Cell Biol. 20, 25–35.
Benaud, C., Gentil, B.J., Assard, N., Court, M., Garin, J., Delphin, C., and
Baudier, J. (2004). AHNAK interaction with the annexin 2/S100A10 complex
regulates cell membrane cytoarchitecture. J. Cell Biol. 164, 133–144.
Berton, O., and Nestler, E.J. (2006). New approaches to antidepressant drug
discovery: beyond monoamines. Nat. Rev. Neurosci. 7, 137–151.
Bessa, J.M., Ferreira, D., Melo, I., Marques, F., Cerqueira, J.J., Palha, J.A.,
Almeida, O.F., and Sousa, N. (2009). The mood-improving actions of antide-
pressants do not depend on neurogenesis but are associated with neuronal
remodeling. Mol. Psychiatry 14, 764–773.
Bjarkam, C.R., Sørensen, J.C., and Geneser, F.A. (2003). Distribution and
morphology of serotonin-immunoreactive axons in the hippocampal region
of the New Zealand white rabbit. I. Area dentata and hippocampus. Hippo-
campus 13, 21–37.
Couillard-Despres, S., Winner, B., Schaubeck, S., Aigner, R., Vroemen, M.,
Weidner, N., Bogdahn, U., Winkler, J., Kuhn, H.G., and Aigner, L. (2005).
Doublecortin expression levels in adult brain reflect neurogenesis. Eur. J.
Neurosci. 21, 1–14.
Das, S., Shetty, P., Valapala, M., Dasgupta, S., Gryczynski, Z., and
Vishwanatha, J.K. (2010). Signal transducer and activator of transcription 6
(STAT6) is a novel interactor of annexin A2 in prostate cancer cells. Biochem-
istry 49, 2216–2226.
David, D.J., Samuels, B.A., Rainer, Q., Wang, J.W., Marsteller, D., Mendez, I.,
Drew, M., Craig, D.A., Guiard, B.P., Guilloux, J.P., et al. (2009). Neurogenesis-
dependent and -independent effects of fluoxetine in an animal model of
anxiety/depression. Neuron 62, 479–493.
Debauve, G., Capouillez, A., Belayew, A., and Saussez, S. (2008). The
helicase-like transcription factor and its implication in cancer progression.
Cell. Mol. Life Sci. 65, 591–604.
842 Cell 152, 831–843, February 14, 2013 ª2013 Elsevier Inc.
Ding, H., Descheemaeker, K., Marynen, P., Nelles, L., Carvalho, T.,
Carmo-Fonseca, M., Collen, D., and Belayew, A. (1996). Characterization of
a helicase-like transcription factor involved in the expression of the human
plasminogen activator inhibitor-1 gene. DNA Cell Biol. 15, 429–442.
Egeland, M., Warner-Schmidt, J., Greengard, P., and Svenningsson, P. (2010).
Neurogenic effects of fluoxetine are attenuated in p11 (S100A10) knockout
mice. Biol. Psychiatry 67, 1048–1056.
Gage, F.H., and Thompson, R.G. (1980). Differential distribution of norepi-
nephrine and serotonin along the dorsal-ventral axis of the hippocampal
formation. Brain Res. Bull. 5, 771–773.
Ge, S., Goh, E.L., Sailor, K.A., Kitabatake, Y., Ming, G.L., and Song, H. (2006).
GABA regulates synaptic integration of newly generated neurons in the adult
brain. Nature 439, 589–593.
Gerke, V., Creutz, C.E., and Moss, S.E. (2005). Annexins: linking Ca2+ signal-
ling to membrane dynamics. Nat. Rev. Mol. Cell Biol. 6, 449–461.
Girard, C., Tinel, N., Terrenoire, C., Romey, G., Lazdunski, M., and Borsotto,
M. (2002). p11, an annexin II subunit, an auxiliary protein associated with the
background K+ channel, TASK-1. EMBO J. 21, 4439–4448.
Gong, S., Yang, X.W., Li, C., and Heintz, N. (2002). Highly efficient modification
of bacterial artificial chromosomes (BACs) using novel shuttle vectors contain-
ing the R6Kgamma origin of replication. Genome Res. 12, 1992–1998.
Hanson, N.D., Owens, M.J., and Nemeroff, C.B. (2011). Depression, antide-
pressants, and neurogenesis: a critical reappraisal. Neuropsychopharmacol-
ogy 36, 2589–2602.
Hargreaves, D.C., and Crabtree, G.R. (2011). ATP-dependent chromatin
remodeling: genetics, genomics and mechanisms. Cell Res. 21, 396–420.
Heintz, N. (2001). BAC to the future: the use of bac transgenic mice for neuro-
science research. Nat. Rev. Neurosci. 2, 861–870.
Henze, D.A., and Buzsaki, G. (2007). Hilar mossy cells: functional identification
and activity in vivo. Prog. Brain Res. 163, 199–216.
Houser, C.R. (2007). Interneurons of the dentate gyrus: an overview of
cell types, terminal fields and neurochemical identity. Prog. Brain Res. 163,
217–232.
Jost, M., and Gerke, V. (1996). Mapping of a regulatory important site for
protein kinase C phosphorylation in the N-terminal domain of annexin II.
Biochim. Biophys. Acta 1313, 283–289.
Katz, R.J. (1982). Animal model of depression: pharmacological sensitivity of
a hedonic deficit. Pharmacol. Biochem. Behav. 16, 965–968.
Kube, E., Becker, T., Weber, K., and Gerke, V. (1992). Protein-protein interac-
tion studied by site-directed mutagenesis. Characterization of the annexin
II-binding site on p11, a member of the S100 protein family. J. Biol. Chem.
267, 14175–14182.
Liu, J., and Vishwanatha, J.K. (2007). Regulation of nucleo-cytoplasmic
shuttling of human annexin A2: a proposed mechanism. Mol. Cell. Biochem.
303, 211–220.
Ming, G.L., and Song, H. (2011). Adult neurogenesis in the mammalian brain:
significant answers and significant questions. Neuron 70, 687–702.
Mohrmann, L., and Verrijzer, C.P. (2005). Composition and functional
specificity of SWI2/SNF2 class chromatin remodeling complexes. Biochim.
Biophys. Acta 1681, 59–73.
Rando, O.J., Zhao, K., Janmey, P., and Crabtree, G.R. (2002). Phosphatidyli-
nositol-dependent actin filament binding by the SWI/SNF-like BAF chromatin
remodeling complex. Proc. Natl. Acad. Sci. USA 99, 2824–2829.
Rescher, U., and Gerke, V. (2008). S100A10/p11: family, friends and functions.
Pflugers Arch. 455, 575–582.
Rety, S., Sopkova, J., Renouard, M., Osterloh, D., Gerke, V., Tabaries, S.,
Russo-Marie, F., and Lewit-Bentley, A. (1999). The crystal structure of a
complex of p11 with the annexin II N-terminal peptide. Nat. Struct. Biol. 6,
89–95.
Rezvanpour, A., Phillips, J.M., and Shaw, G.S. (2009). Design of high-affinity
S100-target hybrid proteins. Protein Sci. 18, 2528–2536.

Santarelli, L., Saxe, M., Gross, C., Surget, A., Battaglia, F., Dulawa, S.,
Weisstaub, N., Lee, J., Duman, R., Arancio, O., et al. (2003). Requirement of
hippocampal neurogenesis for the behavioral effects of antidepressants.
Science 301, 805–809.
Scharfman, H.E. (1995). Electrophysiological evidence that dentate hilar
mossy cells are excitatory and innervate both granule cells and interneurons.
J. Neurophysiol. 74, 179–194.
Schmidt, E.F., Warner-Schmidt, J.L., Otopalik, B.G., Pickett, S.B., Greengard,
P., and Heintz, N. (2012). Identification of the cortical neurons that mediate
antidepressant responses. Cell 149, 1152–1163.
Snyder, J.S., Soumier, A., Brewer, M., Pickel, J., and Cameron, H.A. (2011).
Adult hippocampal neurogenesis buffers stress responses and depressive
behaviour. Nature 476, 458–461.
Surget, A., Tanti, A., Leonardo, E.D., Laugeray, A., Rainer, Q., Touma, C.,
Palme, R., Griebel, G., Ibarguen-Vargas, Y., Hen, R., and Belzung, C. (2011).
Antidepressants recruit new neurons to improve stress response regulation.
Mol. Psychiatry 16, 1177–1188.
Svenningsson, P., Chergui, K., Rachleff, I., Flajolet, M., Zhang, X., El Yacoubi,
M., Vaugeois, J.M., Nomikos, G.G., and Greengard, P. (2006). Alterations in
5-HT1B receptor function by p11 in depression-like states. Science 311,
77–80.
Tozuka, Y., Fukuda, S., Namba, T., Seki, T., and Hisatsune, T. (2005).
GABAergic excitation promotes neuronal differentiation in adult hippocampal
progenitor cells. Neuron 47, 803–815.
van de Graaf, S.F., Hoenderop, J.G., Gkika, D., Lamers, D., Prenen, J.,
Rescher, U., Gerke, V., Staub, O., Nilius, B., and Bindels, R.J. (2003).
Functional expression of the epithelial Ca(2+) channels (TRPV5 and TRPV6)
requires association of the S100A10-annexin 2 complex. EMBO J. 22, 1478–
1487.
Wang, J.W., David, D.J., Monckton, J.E., Battaglia, F., and Hen, R. (2008).
Chronic fluoxetine stimulates maturation and synaptic plasticity of adult-
born hippocampal granule cells. J. Neurosci. 28, 1374–1384.
Warner-Schmidt, J.L., Chen, E.Y., Zhang, X., Marshall, J.J., Morozov, A.,
Svenningsson, P., and Greengard, P. (2010). A role for p11 in the anti-
depressant action of brain-derived neurotrophic factor. Biol. Psychiatry 68,
528–535.
Zaidi, S.K., Young, D.W., Javed, A., Pratap, J., Montecino, M., van Wijnen, A.,
Lian, J.B., Stein, J.L., and Stein, G.S. (2007). Nuclear microenvironments in
biological control and cancer. Nat. Rev. Cancer 7, 454–463.
Zhao, K., Wang, W., Rando, O.J., Xue, Y., Swiderek, K., Kuo, A., and Crabtree,
G.R. (1998). Rapid and phosphoinositol-dependent binding of the SWI/SNF-
like BAF complex to chromatin after T lymphocyte receptor signaling. Cell
95, 625–636.
Cell 152, 831–843, February 14, 2013 ª2013 Elsevier Inc. 843

Supplemental Information
EXTENDED EXPERIMENTAL PROCEDURES
Animal Breeding and Drug TreatmentsWe produced the progeny for each line using in vitro fertilization (IVF) and embryo transfer (ET) techniques, to produce a number of
animals sufficient for the behavioral tests and other animal experiments. SMARCA3KOmice were bred using heterozygousmale and
female. We carried out all the animal experiments using age (10-15 weeks)- and gender (male)-matched littermates. The BAC-[p11]-
eGFP transgenic mice were bred against C57BL/6 mice (Taconics) to obtain hemizygote and used at an adult age (12-18 weeks).
Food and water were provided ad libitum. For chronic drug treatments, mice were housed 1-2 per cage and SSRIs (fluoxetine or es-
citalopram) were administered either by the subcutaneous implantation of time-release fluoxetine pellets (Innovative Research of
America; Cat. No. X-999; 10 mg/kg/day) for 2 weeks, or by the drinking water in a mixture of fluoxetine (0.160 mg/ml) and b-cyclo-
dextrine (0.45%) up to 4 weeks, or daily I.P. injection (Escitalopram, 10 mg/kg/day) up to 4 weeks. Control groups were administered
placebo pellet or vehicle only (Covington et al., 2009; Vialou et al., 2010). Drug solution in the amber water bottles was replaced with
fresh drug solution every 3 days.
Plasmid Construction and MutagenesisTo generate the plasmid encoding p11 (pIRESneo-p11-Flag-HA), the p11 CDS with Flag-HA epitopes in the C terminus was subcl-
oned into pIRES-neo3 vector (Clontech) at the two restriction enzyme cleavage sites (NheI, NotI) by PCR tagging. The WT p11
construct was used as a template to generate the mutants including C83Q, C83S and D60A using the mutagenesis kit (QuikChange
II, Agilent). The plasmid encodingAnxA2 (pEGFP-N3-AnxA2-myc-His) was generated by cloning theAnxA2CDSwithmyc-6xHis plus
stop codon into pEGFP-N3 vector using PCR tagging with enzyme cleavage (BamHI, SmaI/EcoRV). The WT construct was used as
a template to generate the mutants including L8A, L11A, and L13A. The plasmids encoding SMARCA3 (pAAV-CBA-WPRE-
SMARCA3-V5) were generated by cloning the SMARCA3 CDS into pAAV-CBA-WPRE vector (In lab) with insertion of V5 epitope
in the C terminus using PCR tagging with enzyme cleavage (NheI, NotI). The WT SMARCA3-V5 construct was used as a template
to generate the mutants including P35A and F37Y. For the PAI1-promoter-luciferase construct, PAI-1 promoter region ranging
from �791 to +38 was amplified using primer pairs (50-ggt acc agg ctg ctg tac tgg ttc ttg-30/50-gat atc gtc ctc ggg gct ctg ct-30)from the mouse genomic DNA, cloned into pCR2.1 TOPO vector. The sequence-verified insert was cloned into pGL4.10 luciferase
reporter vector (Promega) with enzyme cleavage (KpnI, EcoRV).
For recombinant protein production in the bacterial system, p11 CDS was amplified using the primer pair (50-gcc cat atg cca tcc
caa atg gag cac gcc-30/50-cgg gaattc cta ttt ctt ccc ctt ctg ctt cat-30), cloned into both pGEX-6P1 vector (GE healthcare) and pET29b+
vector (Novagen) for GST-tag (pGEX-6P1-p11) and 6xHis tag (pET29b-p11), respectively by using the restriction enzyme cut (NdeI,
EcoRI). For recombinant AnxA2 production, AnxA2CDSwas amplified using the primer pair (50-gct cat atg tct act gtc cac gaa atc ctg
tg-30/50-cgt gcg gcc gct cag tca tcc cca cca cac ag-30), cloned into pET29b+ vector (Novagen) to generate the pET29b+AnxA2
construct (NdeI, NotI). For expression of recombinant SMARCA3 protein, the coding region for the N-terminal fragment of SMARCA3
(Met1-350) was amplified using the primer pair (50-ccctctagaaataatgtcctggatgttcaagagggat-30/50-ggcaagctttgccttttcactggtattgtttcc-30) and inserted into pET29b(+) vector (XbaI, HindIII).
SMARCA3 deletion constructs were generated using PCR with the primer pairs shown below, followed by cloning into pCR2.1
TOPO vector (Invitrogen), and used for in vitro translation (Figures S1B–S1D). Primer pairs (forward/reverse) for PCR: SMARCA3
full length (cacc agg cgc tcc tct tgt catc/ taa gtc aat taa tgt tct gat ttc at), D854-C (cacc agg cgc tcc tct tgt catc/ttt tat gtt ggg att
ctt ctt tct), D744-C (cacc agg cgc tcc tct tgt catc/ctt ctt tct cag ttc ttc agg tgt), D631-C (cacc agg cgc tcc tct tgt catc/aat tcc tcc
ttc atc tcc cat t), D231-C (cacc agg cgc tcc tct tgt catc/cat ttc atg ggt ttt atc atc ttc), DN1-122 (cac caa agt aaa caa tgt gaa tgg
aaa tc/taa gtc aat taa tgt tct gat ttc at), DN1-155 (cac cat gaa tag aaa agc ggt ttc aga tca gt/taa gtc aat taa tgt tct gat ttc at),
DN1-230 (cac cat ggt tct agc ttg gat ggt gtc/taa gtc aat taa tgt tct gat ttc at).
Quantitative RT-PCRTotal RNA was extracted with standard method using Trixol-LS reagent (Invitrogen), precipitated with sodium acetate, treated with
DNase I (QIAGEN), and purified with RNeasy kit (QIAGEN). RNA quantity was measured with a Nanodrop 1000 spectrophotometer
and quality was assayed with RNA nanochip kit (Agilent 2100 Bioanalyzer). cDNA was synthesized from 1 mg of total RNA using
ImProm-II Reverse Transcription System (Promega) with Oligo dT primer according to manufacturer’s protocol. 10-50 ng of cDNA
was used for each qPCR reaction and all samples were run in triplicate. Q-PCR was carried out in Applied Biosystems 7900HT
system following standard cycling conditions (50�C for 2 min, 95�C for 10 min, then 40 cycle of 95�C for 15 s and 60�C for
1 min). All Taqman assays were purchased from Applied Biosystems as follows. Tagman assay ID for each gene; p11
(Mm00501457_m1), AnxA2 (Mm00500307_m1), SMARCA3 (Mm00447302_m1). All data were normalized to TaqMan Rodent
GAPDH Control, and relative expression levels between conditions were calculated by the comparative CT (2-DDCT) method, and
all statistical analyses were done using Student’s t test.
Western Blot AnalysisCell pellets were lysed in lysis buffer (30 mM HEPES, pH7.2, 140 mM NaCl, 1 mM EDTA, 2 mM MgCl2 and 0.2% Triton X-100) sup-
plemented with a protease inhibitor cocktail (Complete-EDTAfree; Roche) and a phosphatase inhibitor cocktail (PhosStop, Roche).
Cell 152, 831–843, February 14, 2013 ª2013 Elsevier Inc. S1

The lysates were incubated on ice for 30 min with intermittent vortex mixing every 5 min. The hippocampal tissues were added in 5
times excess volume of the lysis buffer, sonicated with probe-type sonicator (Branson) for 10 s, twice. The cell or tissue lysate was
centrifuged and the protein level in the supernatant was measured by BCA. The protein samples were boiled in standard protein
sample buffer, and subjected to SDS-PAGE followed by protein transfer onto a nitrocellulose membrane. Immunoblotting was per-
formed with a standard protocol using the following antibodies: anti-p11 (mouse monoclonal, 1:1000, BD bioscience), anti-p11 (goat
polyclonal, 1:200, R&D systems), anti-SMARCA3 (goat polyclonal, 1:200, NOVUS), anti-SMARCA3 (rabbit polyclonal, 1:500), anti-
AnxA2 (mouse monoclonal, Santa Cruz), anti-myc (mouse monoclonal, 9E10, Sigma-Aldrich), anti-V5 (rabbit polyclonal, Chemicon),
anti-GAPDH (mouse monoclonal, Chemicon), anti-AnxA1 (rabbit polyclonal, Zymed), anti-S100B (mouse monoclonal, BD transduc-
tion lab), anti-SPT6 (rabbit polyclonal, Bethyl lab), anti-AHNAK1 (mouse monoclonal, NOVUS), anti-lamin-B (rabbit polyclonal,
Abcam), Anti-HA (rat monoclonal, Roche), and anti-actin (rabbit polyclonal, Cytoskeleton).
ImmunoprecipitationLysates from cultured cells or brain tissue were prepared as described above. After centrifugation at 12,000 x g for 10min, the super-
natant was precleared with protein A/G agarose beads (Pierce), and incubated with antibody-coupled agarose beads for 3 hr at 4�C,with constant rotation. After washing three timeswith the lysis buffer and one timewith the lysis buffer without Triton X-100, the bound
proteins were eluted by boiling in the protein sample buffer for 5 min, and subjected to SDS-PAGE. Antibody-coupled beads were as
follows: anti-p11 antibody-coupled protein A/G agarose gel (mouse polyclonal anti-p11 antibody), anti-SMARCA3 antibody-coupled
protein A/G agarose gel (rabbit polyclonal anti-SMARCA3 antibody I or II), anti-Flag affinity agarose gel (mouse monoclonal anti-Flag
M2 antibody; Sigma-Aldrich), anti-Myc affinity agarose gel (goat polyclonal anti-Myc antibody; Bethyl laboratory), and anti-V5 affinity
agarose gel (mouse monoclonal anti-V5 antibody, Sigma-Aldrich).
Antibody GenerationMouse polyclonal antisera against mouse p11were obtained by immunizing recombinantmouse p11 into p11 homozygous KOmice.
p11 homozygous KO mice at 6-7 weeks old were immunized subcutaneously with recombinant p11 (50 mg) protein emulsified with
TiterMax adjuvant (CytRx Co.) according to themanufacturer’s instruction. Themice were boostedmore than 6 times with emulsified
antigen at 3 week intervals prior to the final boosting with the intravenous injection of soluble antigen (100 mg). A week later, sera were
collected with retro-orbital bleeding under deep anesthesia, and tested by immunoblotting and immunoprecipitation. Rabbit poly-
clonal antibody was purified as reported (Czernik et al., 1991) with minor modification. The 14-mer peptides derived from SMARCA3
(rabbit polyclonal-I; DIIPPDDFLTSDEE) and (rabbit polyclonal-II; EERKIYQSVKNEGK) were synthesized with C-terminal cysteine
residue, coupled to the KLH protein using Sulfo-MBS cross-linker (Pierce Biotech). The peptide-KLH conjugates were desalted using
a PD-10 column (GE healthcare), emulsified with TiterMax adjuvant (CytRx Co.), and immunized into rabbits (Cocalico Inc.). The IgG
fraction was purified using protein A/G affinity chromatography from the sera of the immunized rabbit and the specific antibody frac-
tion was further purified using peptide-coupled resins (SulfoLink Coupling Resins and Immobilization Kits, Pierce Biotech).
In Vitro Binding AnalysisGST-p11 Pull-Down Assay
GST or GST-p11 (5 mg) was immobilized on GSH-agarose (GE healthcare), and preincubated with AnxA2 (15 mg or as indicated) for
1 hr at 4�C to produce p11/AnxA2 complex in the binding buffer (30mMHEPES, pH7.2, 140mMNaCl, 1 mMEDTA, 2mMMgCl2 and
0.2% Triton X-100) supplemented with the protease inhibitor cocktail (Roche). After washing out the unbound AnxA2with the binding
buffer, GST, GST-p11 or GST-p11/AnxA2 complex were incubated with either full-length SMARCA3 or its fragments which were
generated by in vitro transcription/translation with [35S-Methionine] labeling (TnT Quick Coupled Transcription/Translation System,
Promega). After 3 hr incubation at 4�C with constant rotation, the protein complexes on the beads were eluted using the sample
buffer, and were subjected to SDS-PAGE. The 35S-labeled SMARCA3 proteins on the dried gels were visualized using PhosphoIm-
ager (Figures S1B–S1D).
Peptide Pull-Down Assay
Short peptides derived from SMARCA3 (aa26-42) or AHNAK1 (aa5654-5671) were synthesized with a biotin-tag at the C terminus,
and immobilized onto streptavidin-coupled magnetic beads (DynabeadM-280 Streptavidin, Invitrogen). The peptide-coupled beads
were incubated with p11/AnxA2 complex (1 mg of the complex) in the binding buffer. After three timeswashing, the bound protein was
eluted by boiling in the sample buffer, and subjected to SDS-PAGE followed by western blot analysis using the antibodies indicated
(Figure 2F).
Oligonucleotide Pull-Down Assay
Oligonucleotide pull-down assay was performed as described (Herlt et al., 1988) with minor modification. Briefly, the streptavidin
magnetic beads (Dynabeads MyOne Streptavidin T1, Invitrogen) were preabsorbed with the blocking/coupling buffer for 30 min
at room temperature with constant rotation. The preabsorbed beads were dispensed into individual reaction tubes, coupled with
1 mg of the biotinylated oligonucleotide duplex (tandem B-box from mouse PAI-1 promoter: 50-TTA GAA AGT GGG TGG GGC
TGG AAC ATG TTA GAA AGT GGG TGG GGC TGG AAC ATG-30/50- CAT GTT CCA GCC CCA CCC ACT TTC TAA CAT GTT CCA
GCCCCACCCACT TTC TAA-30-Biotin) (Ding et al., 1996), andwashed three timeswith 13 oligonucleotide binding buffer to remove
the unbound oligonucleotide duplex. The washed beads were incubated with the protein solution prediluted in the reaction buffer, for
S2 Cell 152, 831–843, February 14, 2013 ª2013 Elsevier Inc.

3 hr at 4�C with constant rotation. The protein complex bound to the magnetic beads was washed three times with 1 3 oligonucle-
otide binding buffer, eluted by boiling in the protein sample buffer, and subjected to SDS-PAGE followed by quantitative western blot
analysis (Odyssey Infrared System, LI-COR).
Oligonucleotide binding buffer (3 3 ): 36 mM HEPES, pH 7.9, 12 mM TRIS, 450 mM KCl, 36% glycerol, 3 mM EDTA, 3 mM DTT.
Blocking/coupling buffer: 13 oligonucleotide binding buffer supplementedwith 2mg/ml BSA (DNase- and lipid-free; Calbiochem),
20 mg/ml poly dI-dC (poly deoxyinosinic-deoxycytidylic acid; Sigma-Aldrich), 200 mg/ml sheared salmon spermDNA (Invitrogen), and
0.2% NP-40 (Sigma-Aldrich).
Reaction buffer: 1 3 oligonucleotide binding buffer supplemented with 2 mg/ml BSA, 20 mg/ml poly dI-dC, and 0.2% NP-40.
Protein Expression and PurificationThe p11-AnxA2 peptide cassette [p11(1-92) - QENLYFQGD linker - AnxA2 peptide (2-15)] was designed according to a published
protocol (Rety et al., 1999; Rezvanpour et al., 2009). The gene fragment encoding p11-AnxA2 peptide cassette was inserted into
a sumo-pRSFDuet-1 vector (modified pRSFDuet-1 vector with 6xHis plus yeast Sumo as the N-terminal fusion tag). The protein
was expressed in BL21 (DE3) RILE. coli cells in LBmedium. Cells were grown at 37�C till OD600 reached around 0.8. Then themedium
was cooled and 0.4 mM IPTGwas added to the culture to induce protein expression overnight at 25�C. The cell extract was prepared
using a French Press in buffer A (50 mM TRIS, pH 7.5, 400 mM NaCl, 20 mM imidazole, 5 mM b-mercaptoethanol and 5% glycerol).
After centrifugation, the supernatant was loaded onto a Ni-NTA affinity column. The eluted target protein was exchanged in buffer A
by dialysis overnight, with Ulp1 protease added for removal of the Sumo-tag. Digested protein was loaded onto a Ni-NTA column
again to remove the 6xHis-Sumo tag and the His-tagged protease. The flow through containing target protein was further purified
by using a Hiload 16/60 G75 column in buffer B (10 mM HEPES, pH 7.5, 150 mM NaCl, 1 mM DTT, 0.1 mM EGTA and 5% glycerol).
The p11-AnxA2 fusion protein was concentrated to about 20 mg/ml for crystallization trials.
We used the coexpression strategy to prepare the complex of full-length p11 and full-length AnxA2. The gene fragments encoding
p11 and AnxA2were inserted into the firstMCS and the secondMCSof themodified pRSFDuet-1 vector, respectively. All the expres-
sionandpurificationconditionswere the sameas for thep11-AnxA2peptide cassette except for usingaheparin column to remove free
p11 protein from the complex. The complex of full-length p11 and full-length AnxA2 was concentrated to about 20 mg/ml in buffer B.
CrystallizationCrystals of p11-AnxA2 peptide cassette in complex with AHNAK1 peptide were obtained by mixing at a cassette:peptide molar ratio
of 1:2 on ice for 30 min, followed by mixing with an equal volume of reservoir buffer containing 100 mM Tris, pH 7.4, and 30%
PEG6000 at 20�C. The complex of the p11-AnxA2 peptide cassette with SMARCA3 peptide was also prepared by mixing the
cassette with peptide at a 1:2 molar ratio. When adding the SMARCA3 peptide, precipitation was found in the mixture. By incubating
the sample at 37�C for 10 min, the precipitation almost disappeared. Crystals were obtained by mixing 1 ml complex with 1 ml crys-
tallization buffer containing 100 mM MES, pH 5.0 and 1.6 M (NH4)2SO4.
The crystals of full-length p11 and full-length AnxA2 in complex with SMARCA3 peptide were obtained by mixing at a full-length
complex:peptide molar ratio of 1:2 on ice for 30 min, followed by mixing with an equal volume of crystallization buffer containing
100 mM citric acid, pH 3.7 and 25% PEG3350.
Structure DeterminationX-ray diffraction data sets for complexes of p11-AnxA2 peptide cassette with AHNAK1 and SMARCA3 peptides were collected at the
Advanced Photon Source NE-CAT 24ID-E beam line. The data sets were indexed, integrated and scaled using HKL2000. The struc-
ture of p11-AnxA2 peptide cassette - AHNAK1 peptide complex was solved by the molecular replacement method in PHASER
(McCoy et al., 2007) using the structure of p11 and AnxA2 complex (PDB 1BT6) as the search model. Further modeling of AHNAK1
peptide was carried out using COOT (Emsley and Cowtan, 2004), and model refinement was performed in PHENIX (Adams et al.,
2002). The final model of the complex was refined to 2.0 A.
The structure of p11-AnxA2 peptide cassette - SMARCA3 peptide complex was solved by molecular replacement method in
PHASER using the 2.0 A structure of the p11-AnxA2 peptide cassette - AHNAK1 peptide complex as the search model. The
SMARCA3 peptide was then modeled in COOT and the whole structure of the complex was refined using PHENIX. The final model
of the complex was refined to 3.0 A resolution. Data collection statistics and structural refinement parameters for complexes of p11-
AnxA2 peptide cassette with bound AHNAK1 and bound SMARCA3 peptides are summarized in Table S1.
The structure of the ternary complex of full-length p11/full-length AnxA2/SMARCA3 peptide was solved by the molecular replace-
ment method in PHASER using the 3.0 A structure of the p11-AnxA2 peptide cassette bound to SMARCA3 peptide and also free
AnxA2 (PDB 1W7B) as search models. The missing parts were then modeled in COOT and the entire structure of the complex
was refined using PHENIX. Data collection statistics and structural refinement parameters for the p11/AnxA2/SMARCA3 peptide
ternary complex are summarized in Table S2.
Nuclear Matrix PreparationNuclear matrix was prepared as reported with minor modification (van Steensel et al., 1995). After washing two times with ice-cold
PBS, cells were incubated with a cell-permeable cross-linker, 1 mM DSP (Pierce), in 13 PBS for 1 hr on ice. The cells were washed
Cell 152, 831–843, February 14, 2013 ª2013 Elsevier Inc. S3

twice in CSK buffer, incubated with CSK buffer supplemented with 0.5% NP-40, and 0.5 mM sodium tetrathionate (Sigma-Aldrich),
and incubated 3min with CSK buffer supplemented with 0.5mM sodium tetrathionate. After washing twice with CSK buffer and once
with digestion buffer, the chromatin was digested with 200 mg/ml RNase-free DNase I (Sigma-Aldrich) in the digestion buffer for
30 min, extracted with 0.25 M (NH4)2SO4 in digestion buffer for 10 min, and washed twice with the CSK buffer. For western blot anal-
ysis, the nuclearmatrix preparationwas solubilizedwith 13RIPA buffer and scraped. For the in situ immunocytochemistry, thewhole
cells and the nuclear matrices on coverslips (BD BioCoat) were fixed for 10 min with 2% PFA solution. The cells were incubated with
PBS containing 0.5%NP-40, followed by 5 min incubation in PBS containing 100 mM glycine. The washed whole cells or the nuclear
matrices were subjected to the standard immunocytochemistry procedures using anti-p11 antibody (mouse monoclonal, 1:500, BD
bioscience) and anti-SMARCA3 antibody (goat polyclonal, 1:200, Novus biological).
CSK buffer: 10 mM PIPES, pH 6.8, 100 mM NaCl, 300 mM sucrose, 3 mM MgCl2, 1 mM EGTA, protease inhibitor cocktail
(Complete-EDTAfree; Roche).
Digestion buffer: 10 mM PIPES, pH 6.8, 50 mM NaCl, 300 mM sucrose, 3 mM MgCl2, 1 mM EGTA, protease inhibitor cocktail.
Luciferase Reporter AssayPAI-1 promoter-driven luciferase activity (pGL4.10-mPAI1 promoter) was measured using the Dual-Luciferase Reporter Assay
System (Promega) with Renilla (pGL4.73, Promega) as a reference. The reporter plasmid mixture of Firefly luciferase/Renilla lucif-
erase vectors (50 ng/0.5 ng) was cotransfected with SMARCA3 (0.2 mg), p11 and AnxA2 expression plasmids (0.4 mg each) into
N2a cells. At 24 hr posttransfection, the luciferase activity in the transfected cells was assayed according to the manufacturer’s
manual. For p11 silencing, COS-7 cells were transfected with either p11 siRNA duplex (5’-UUG CCA UCU CUA CAC UGG UCC
AGGU-3’/5’-ACC UGG ACC AGU GUA GAG AUG GCAA-3’) or negative control duplex (20 pmol; medium GC; Invitrogen). At
24 hr posttransfection, the cells were detached and replated onto 12-well plates. Next day, the cells were cotransfected with
SMARCA3 plasmids (0.2 mg) along with the reporter plasmid mixture (50 ng/0.5 ng), and the luciferase activity was measured
24 hr later. All analyses were performed in triplicate, with each experiment repeated at least twice.
ImmunohistochemistryAnimals were deeply anesthetized and perfused transcardially with PBS, followed by 4% paraformaldehyde (PFA) in PBS. Brains
were postfixed in 4% PFA 12 hr at 4�C, and then saturated with 30% sucrose, followed by freezing in the OCT medium on the
dry ice block. A cryostat was used to collect coronal sections of 40 mm thickness along the rostro-caudal axis of the hippocampus.
Immunofluorescent staining of the sections was carried out by the free floatingmethod. For immunostaining for p11, SMARCA3, nes-
tin, and Ki-67, the sections were pretreated with citrate buffer (10 mM sodium citrate, pH 6.0, 0.05% Triton X-100) for 30 min at 80�Cfor antigen retrieval, and then rinsed three times with PBS. For BrdU immunostaining, the sections were pretreated with 1 N HCl for
1 hr at 45�C to denature DNA. After being neutralized, the sectionswere rinsed twicewith PBS, and incubatedwith the blocking buffer
(13 PBS, 0.2%BSA, 2% normal donkey serum, 0.3% Triton X-100) at room temperature for 1 hr. After blocking, sections were incu-
bated with the primary antibodies diluted in the blocking buffer. The immunohistochemistry was done using the following antibodies:
anti-p11 (goat polyclonal, 1:100, R&D systems), anti-eGFP (chicken polyclonal, 1:200, Abcam), anti-eGFP (rabbit polyclonal, 1:200,
Abcam), anti-SMARCA3 (rabbit polyclonal, 1:500, Thermo Scientific), anti-calretinin (mousemonoclonal, 1:4000, Swant), anti-parval-
bumin (rabbit polyclonal, 1:1000, Swant), anti-parvalbumin (mouse monoclonal, 1:1000, Swant), anti-calbindin-D28K (mouse mono-
clonal, 1:1000, Swant), anti-neuropeptide Y (rabbit polyclonal, 1:1000, Phoenix Pharmaceutical), anti-GFAP (rabbit polyclonal,
1:1000, Sigma-Aldrich), anti-nestin (mouse monoclonal, 1:200, Abcam), anti-BrdU (rat monoclonal, 1:200, Abcam), anti-Ki-67 (rabbit
polyclonal, 1:200, Abcam), anti-doublecortin (goat polyclonal, 1:200, Santa-Cruz Biotech), and anti-NeuN (rabbit polyclonal, 1:1000,
Millipore). After incubation for 48-72 hr, sections were washed, incubated with Alexa-fluor-conjugated secondary antibodies (Invitro-
gen), and counterstained with DraQ5. All the sections were examined under a Zeiss LSM710 confocal microscope or wide-field fluo-
rescence microscope (Zeiss).
Immunohistochemistry of BAC-[p11]-eGFP Mice and Densitometric AnalysisBrain tissue (n = 5-6/group) was prepared for immunohistochemistry using a standard protocol. Brains were sectioned at 40 mm, and
every twelfth coronal section, along the rostro-caudal axis of hippocampus (�2.5 to �4.0 mm AP) was stained immunohistochemi-
cally, as described above. Sections were scannedwith a Zeiss LSM710 confocal microscopewith a 20 x objective lens. Densitometry
on digitized images was carried out using ImageJ software (NIH). Hippocampal subregions (Amaral et al., 2007) were defined by
referencing the well-characterized laminar distribution pattern, as well as well-defined anatomical landmarks visualized with counter-
staining with DraQ5, a nuclei-staining dye. The average fluorescent intensity is measured by outlining the region of interest (ROI) for
each laminar subregion including the hilus, the inner molecular layer (IML), the granular cell layer (GCL), and the outer molecular layer
(OML). Relative fluorescence intensity of each subregion was given after normalization within the same section: the value of individual
subregion was divided by the value of the outer molecular layer (OML), which shows background fluorescence with negligible immu-
nostaining and also with no change upon fluoxetine treatment. All imaging and analyses were performed blind to the experimental
conditions. For quantification comparisons, we used a two-way ANOVA followed by Bonferroni’s t test for pairwise comparisons
using Prism (GraphPad Software).
S4 Cell 152, 831–843, February 14, 2013 ª2013 Elsevier Inc.

BrdU Labeling and Neurogenesis AssayThe effect of chronic fluoxetine treatment on cell proliferation or cell survival in the WT and KO mice was assessed as described
(Malberg et al., 2000). For the proliferation assay, the mice were labeled with BrdU solution (200 mg/kg) for 2 hr prior to sacrifice
by perfusion. For the survival/neurogenesis assay, the mice were injected with BrdU (75 mg/kg) two times per day for three consec-
utive days, and were perfused 4 weeks later. Preparation of brain sections and immunostaining were done as described above, and
stereological quantitation of BrdU-positive cells were performed as described (Malberg et al., 2000). Briefly, serial coronal sections
(40 mm) were cut through the entire hippocampus in its rostro-caudal extension on a cryostat and stored in PBS with 0.1% NaN3.
Every sixth section throughout the hippocampus was processed for BrdU immunohistochemistry as described. After the staining
procedure, all the slides were coded. An experimenter blinded to the slide code counted all BrdU-labeled cells in the granule cell
layer (GCL) and the subgranular zone (SGZ) of the dentate gyrus (DG) in the total 12 sections from the individual mouse. The total
number of BrdU-labeled cells per section was determined and multiplied by 6 to obtain the total number of cells per dentate gyrus.
Two-way ANOVA and post hoc Bonferroni tests were performed on these totals.
Behavioral TestingAll the behavioral tests were done during the light cycle in a dedicated sound-proof behavioral facility by experimenters blind to treat-
ment- and genotype information.
Novelty suppressed feeding was performed as described (Samuels and Hen, 2011). The behavior testing room was soundproof
and the illumination level was maintained at 100 lux. After food-deprivation for 20-24 hr, mice were habituated to the testing room
in their home cage for 1 hr, and then singly housed in a fresh plastic cage with no food, or water for an additional 30 min. During
the test sessions, three pellets of standard mouse chow were placed on a white filter paper platform in the center of the box
(50x50x20 cm, 2 cm of wooden bedding) and the latency to feed (defined as the mouse sitting on its haunches and biting the pellet
with the use of forepaws) wasmeasured. Eachmouse was weighed before food deprivation to assess the percentage of body weight
loss during the period of drug treatment.
The restraint treatment used in this study was performed as previously described (Seo et al., 2012). In brief, mice were individually
placed head-first into well ventilated 50 ml polypropylene conical tubes, which were then plugged with a 4.5-cm-long middle tube,
and finally tied with a cap of the 50ml tube. After each session of restraint, themicewere returned to their home environment, in which
theywere housed in pairs in normal plastic cageswith free access to food andwater. From the next day after the last restraint session,
mice were intraperitoneally injected with escitalopram daily for 4 weeks) in the posttreatment paradigm.
Tail suspension test was performed as described (Svenningsson et al., 2006).
For sucrose preference test, a bottle with tap water and another bottle with 1% (Figure S6E) or 2% (Figure 7H) sucrose solution
were given to mice. After habituation for 3 days, mice were given a free choice between two bottles. To prevent a possible effect
of drinking behavior, the left/right location of the bottles was switched every day. The consumption of water and sucrose solution
was measured daily for 3 days by weighing the bottles. The sucrose preference was calculated as the ratio of consumed sucrose
solution to consumed water.
For open-field test, mice were habituated in the testing room in their home cages for 30 min and the open-field behavior was
assayed in a square arena (50x50x22.5 cm) for 60 min (Figure S6C) or 30 min (Figure S6I). The measures were automatized using
two rows of infrared photocells placed 20 and 50 mm above the floor, spaced 31 mm apart. Photocell beam interruptions were re-
corded on a computer using the superflex software (Accuscan Instruments). Horizontal activity was measured by counting all inter-
ruptions of photobeams in the lower rows. Total distance traveled was measured using the automated superflex software.
For elevated plus maze test, the test apparatus comprised two open arms (25 3 5 x 0.5 cm) across from each other and perpen-
dicular to two closed arms (253 5 x 16 cm) with a center platform (53 5 x 0.5 cm) and the entire apparatus was 50 cmabove the floor.
Amouse was placed in the center area of themaze and wasmonitored using a video camera connected to a computer. Time spent in
the open arms and the number of entries into each arm were quantified as described (Lister, 1987).
For light/dark box, a dark insert was placed into the open field arena to divide the chamber into light and dark compartments. Mice
were placed in the dark side of the box. The time spent and distance traveled in the light side of the arena were recorded for 10 min.
For the elevated plus maze test, mice were placed in the middle of the elevated plus maze (50 cm from the floor) and allowed to
explore the maze for 10 min. Time spent and the number of entries into open arms were measured using a tracking software
(Ethovision).
SUPPLEMENTAL REFERENCES
Adams, P.D., Grosse-Kunstleve, R.W., Hung, L.W., Ioerger, T.R., McCoy, A.J., Moriarty, N.W., Read, R.J., Sacchettini, J.C., Sauter, N.K., and Terwilliger, T.C.
(2002). PHENIX: building new software for automated crystallographic structure determination. Acta Crystallogr. D Biol. Crystallogr. 58, 1948–1954.
Covington, H.E., 3rd,Maze, I., LaPlant, Q.C., Vialou, V.F., Ohnishi, Y.N., Berton, O., Fass, D.M., Renthal,W., Rush, A.J., 3rd,Wu, E.Y., et al. (2009). Antidepressant
actions of histone deacetylase inhibitors. J. Neurosci. 29, 11451–11460.
Czernik, A.J., Girault, J.A., Nairn, A.C., Chen, J., Snyder, G., Kebabian, J., and Greengard, P. (1991). Production of phosphorylation state-specific antibodies.
Methods Enzymol. 201, 264–283.
Emsley, P., and Cowtan, K. (2004). Coot: model-building tools for molecular graphics. Acta Crystallogr. D Biol. Crystallogr. 60, 2126–2132.
Cell 152, 831–843, February 14, 2013 ª2013 Elsevier Inc. S5

Herlt, M., Schwarz, H.P., Neumann, R., and Eggers, H.J. (1988). Detection of DNA-protein binding in western blots by phosphorus-labeled and biotinylated DNA
probes. Biotechniques 6, 324–331.
Lister, R.G. (1987). The use of a plus-maze to measure anxiety in the mouse. Psychopharmacology (Berl.) 92, 180–185.
Malberg, J.E., Eisch, A.J., Nestler, E.J., andDuman, R.S. (2000). Chronic antidepressant treatment increases neurogenesis in adult rat hippocampus. J. Neurosci.
20, 9104–9110.
McCoy, A.J., Grosse-Kunstleve, R.W., Adams, P.D., Winn, M.D., Storoni, L.C., and Read, R.J. (2007). Phaser crystallographic software. J. Appl. Cryst. 40,
658–674.
Samuels, B.A., and Hen, R. (2011). Novelty-suppressed feeding in the mouse. In Mood and Anxiety Related Phenotypes in Mice: Characterization Using Behav-
ioral Tests, Volume II, T.D. Gould, ed. (New York: Springer), pp. 107–121.
Seo, J.S., Park, J.Y., Choi, J., Kim, T.K., Shin, J.H., Lee, J.K., and Han, P.L. (2012). NADPH oxidase mediates depressive behavior induced by chronic stress in
mice. J. Neurosci. 32, 9690–9699.
van Steensel, B., Brink, M., van der Meulen, K., van Binnendijk, E.P., Wansink, D.G., de Jong, L., de Kloet, E.R., and van Driel, R. (1995). Localization of the gluco-
corticoid receptor in discrete clusters in the cell nucleus. J. Cell Sci. 108, 3003–3011.
Vialou, V., Robison, A.J., Laplant, Q.C., Covington, H.E., 3rd, Dietz, D.M., Ohnishi, Y.N., Mouzon, E., Rush, A.J., 3rd, Watts, E.L., Wallace, D.L., et al. (2010).
DeltaFosB in brain reward circuits mediates resilience to stress and antidepressant responses. Nat. Neurosci. 13, 745–752.
S6 Cell 152, 831–843, February 14, 2013 ª2013 Elsevier Inc.

Figure S1. Characterization of SMARCA3 as a Binding Partner of p11/AnxA2 Complex, Related to Figure 2
(A) Effect of p11mutation in C83 residue on the interactionwith AnxA2 and endogenous p11.WT, C83S, and C83Qmutants of p11were immunoprecipitated from
transfected COS-7 cells, and immunoblotted for AnxA2 and p11 as indicated.
(B) Potentiation of the interaction between p11 and SMARCA3 by AnxA2. GST-p11 was immobilized on GSH-agarose beads, preincubated with various
concentrations of AnxA2, and incubated with 35S-labeled SMARCA3. The coprecipitated protein complex was visualized by autoradiography (top) and Coo-
massie staining (bottom). Intensities of autoradiographic SMARCA3 were quantified and compared with the value in the absence of AnxA2.
(C and D) GST-p11 pull-down assay using a series of C-terminal (C) and N-terminal (D) truncations of SMARCA3.
Cell 152, 831–843, February 14, 2013 ª2013 Elsevier Inc. S7

Figure S2. Crystal Structure of AHNAK1 Peptide Bound to p11-AnxA2 Peptide Cassette as a Binary Complex, Related to Figure 3
(A) A ribbon view of the crystal structure of the p11-AnxA2 peptide cassette in complex with AHNAK1 peptide solved at 2.0 A resolution. In this dimeric complex,
p11 (blue and green) and AnxA2 peptide (salmon) are shown in ribbon, with the bound AHNAK1 peptides (yellow) in stick representations.
(B) Space-filling (peptide) and electrostatic surface (p11-AnxA2 peptide cassette) view of the complex illustrating the positioning of the pair of AHNAK1 peptides
within the binding groove of the dimeric complex.
(C) Omit 2Fo-Fc electron density maps contoured at 1s level of bound AHNAK1 peptide in one monomer of the complex. AnxA2 peptide (salmon) and p11 (blue)
are represented in ribbon views, SMARCA3 peptide (yellow) is represented in a stick view, and electron density contours are in green.
(D) Details of intermolecular contacts within one monomer of the complex between the AHNAK1 peptide (yellow) and p11 (blue) - AnxA2 peptide (salmon)
cassette, with hydrogen bonds depicted as red dashed lines.
(E) Positioning of the conserved residues Pro5664 and Phe5666 of the bound AHNAK1 peptide within a hydrophobic pocket formed by residues of AnxA2 peptide
(salmon) and p11 (blue).
(F) View of the superimposed structures of the p11-AnxA2 peptide cassette in the free (p11 in yellow and AnxA2 peptide in cyan) and AHNAK1-bound (p11 in blue
and AnxA2 peptide in red) states. The black arrows highlight the conformational changes in p11 and AnxA2 peptide upon complex formation.
S8 Cell 152, 831–843, February 14, 2013 ª2013 Elsevier Inc.

Figure S3. Point Mutations in the Key Residues Found in the Binding Interface of p11, AnxA2, and SMARCA3 Abolish Ternary Complex
Formation, Related to Figure 3
(A) Effect of SMARCA3 mutation (P35A and F37Y) on the interaction with p11/AnxA2 complex. WT, P35A, and F37Y mutants of SMARCA3 were immunopre-
cipitated using C-terminal V5 epitope from transfected COS-7 cells, and immunoblotted for SMARCA3-V5, AnxA2, and p11 as indicated.
(B) Effect of AnxA2mutation (L8A, L11A, L13A) on the interaction with p11 and SMARCA3. WT, L8A, L11A, and L13Amutants of AnxA2were immunoprecipitated
using C-terminal myc epitope from transfected COS-7 cells, and immunoblotted for SMARCA3, AnxA2, and p11 as indicated.
(C) Effect of p11 mutation (D60A) on the interaction with AnxA2 and SMARCA3. WT and D60A mutant of p11 were immunoprecipitated using C-terminal Flag-
epitope from transfected COS-7 cells, and immunoblotted for Flag-p11 (overexpressed), p11 (endogenous), SMARCA3, and AnxA2 as indicated. D60A mutant
appears to be in lower amount in total lysate (not shown) and in the immune complex, presumably due to instability. Although comparable amounts of
endogenous p11 and AnxA2were coprecipitated, SMARCA3wasmarkedly reduced in the immune complex containing the D60Amutant compared to that of WT
p11, supporting a critical role for the D60 residue in the interaction with SMARCA3.
Cell 152, 831–843, February 14, 2013 ª2013 Elsevier Inc. S9

Figure S4. SSRI Regulates p11 Expression in the Dentate Gyrus, Related to Figure 5
(A) Expression of p11 in BAC-[p11]-eGFP reporter mice. P11 expression was assessed in dentate gyrus slices from BAC-[p11]-eGFP reporter mice after staining
with anti-eGFP or anti-p11 antibody. The layered dentate gyrus structure was visualized with nuclear dye staining (Blue; DraQ5) in the merged image. IML, inner
molecular layer; GCL, granule cell layer. Scale Bar, 20 mm. Representative cells doubly labeled are marked with arrow heads.
(B) Induction of [p11]-eGFP in dentate gyrus by chronic SSRI. BAC-[p11]-eGFP mice were treated with either VEH or FLX for 2 weeks. The dentate gyrus slices
were costained with anti-eGFP antibody (Green) and nuclear dye (Blue; DraQ5). Representative images are from the rostral (upper panels) or the caudal (lower
panels) side of the hippocampus. Scale Bars, 100 mm.
S10 Cell 152, 831–843, February 14, 2013 ª2013 Elsevier Inc.

Figure S5. Generation and Characterization of SMARCA3 KO Mouse Line, Related to Figure 6
(A) Schematic for SMARCA3 gene KO strategy. In the targeting vector, exons 11-13 were flanked by loxP sites. Selection marker (Puro) was flanked by F3 sites,
inserted into intron 10. Constitutive KO line was established after in vivo Cre recombinase-mediated deletion of exons 11-13 and selectionmarker (Puro). Deletion
of exons 11-13 creates a frame shift in downstream exons and generates a premature STOP codon.
(B and C) Western blot analysis of SMARCA3, p11, AnxA2 and actin proteins in the hippocampus of SMARCA3 WT (+/+), heterozygote (+/�), homozygote KO
(�/�) mice. Representative images (B) and quantitation (C) are shown. The levels of p11 and AnxA2 are not altered. Data represent mean ± SEM (n = 5 mice per
group). ns (non-significant).
Cell 152, 831–843, February 14, 2013 ª2013 Elsevier Inc. S11

Figure S6. Fluoxetine-Induced Increase in Number of Ki-67-Positive Cells; Baseline Locomotor Activity and Depression-like and Anxiety
Behaviors in SMARCA3 WT and KO Mice; Food Consumption and Locomotor Activity as Control Behaviors in Chronic Antidepressant-
Treated Mice; the Effect of SMARCA3 KO in Acute Antidepressant Action, Related to Figure 7
(A and B) Fluoxetine-induced increase of Ki-67-positive cells in WT (+/+) and SMARCA3 KO (�/�) mice. (A) Immunostaining with anti-Ki-67. Scale Bars, 100 mm.
(B) Quantitation of Ki-67-positive cells in the subgranular zone (n = 7-8 mice per group). Data represent mean ± SEM. *p < 0.05, **p < 0.01, ns (non-significant),
two-way ANOVA followed by the post-hoc Bonferroni test. See also Table S3.
(C–G) Naive WT and SMARCA3 KO mice were tested for the following behaviors. Total distance traveled was measured in an open field (C). Depression-like
behavior was measured by immobility in the tail suspension test (D) and anhedonia was assayed by sucrose preference (E). Anxiety was measured by time spent
in the light compartment of the light/dark box (F) or by time spent in the open arm of the elevated plusmaze (G). All data are presented asmean ±SEMn= 7-8mice
per group. ns (nonsignificant), t test.
(H) WT and SMARCA3 KO mice were treated with either VEH or FLX for 4 weeks. Hunger level was assessed by measuring food consumption over a period of
5 min. Data represent mean ± SEM (n = 14-16 per group).
(I) WT and SMARCA3 KO mice were exposed to control condition (nonstressed, NS) or restraint stress (RS) for 2 weeks, followed by either VEH or eCIT
(escitalopram) for 4 weeks. The total distance traveled was assessed using open field test. Data represent mean ± SEM (n = 8-11 per group).
(J) WT and SMARCA3 KO mice were tested for behavioral despair after acute escitalopram, for 30 min, in the tail suspension test. Data represent mean ± SEM
(n = 8 per group). *p < 0.05, ns (nonsignificant), two-way ANOVA followed by the post hoc Bonferroni test.
See also Table S3.
S12 Cell 152, 831–843, February 14, 2013 ª2013 Elsevier Inc.