Small Scale Crack Growth Sensor for Determination of ...
12
J. Siegel, M. Schindelholz, F. Friedersdorf, Small Scale Crack Growth Sensor for Determination of AA5XXX Susceptibility to SCC, NACE Corrosion Conference Proceedings, Dallas, Texas, March 2015. © 2015 by NACE International. Requests for permission to publish this manuscript in any form, in part or in whole, must be in writing to NACE International, Publications Division, 1440 South Creek Drive, Houston, Texas 77084. The material presented and the views expressed in this paper are solely those of the author(s) and are not necessarily endorsed by the Association. www.nace.org Small Scale Crack Growth Sensor for Determination of AA5XXX Susceptibility to SCC Jacob Siegel, Mara Schindelholz, Fritz Friedersdorf Luna Innovations Inc. 1 Riverside Circle, Suite 400 Roanoke, VA 24016 ABSTRACT Stress corrosion cracking (SCC) of AA5XXX exposed to the atmosphere is a critical safety issue for DoD assets, often resulting in service failures. Previous research found in literature has demonstrated that SCC is controlled by complex interactions of load, environment, electrochemistry, and alloy properties. Traditional environmental fracture testing conducted under immersion conditions may produce results that are much different than measurements collected under thin electrolyte layers or droplets formed during atmospheric exposure. To more accurately assess AA5XXX susceptibility to SCC, a standalone in situ crack growth sensor has been developed to monitor crack propagation within a surrogate tensile sample under realistic atmospheric conditions. Using tailored test specimens and exacting methods for loading, corrosive conditions and load interaction effects on SCC can be evaluated in accelerated tests and outdoor environments. These measurements can then be used to identify the significant relationships between environmental parameters and SCC failure processes. Systematically varying environmental and mechanical parameters (e.g., relative humidity, salt molarity, degree of sensitization, and stress intensity) has shown a strong dependence of crack velocity on cyclic relative humidity (RH). Specifically, an increase in crack velocity has been observed with decreasing RH. This is contradictory to previous perceptions that cracking increases proportionally with increasing RH, and reflects ongoing uncertainty in literature of the exact mechanism of corrosion and SCC during drying of a thin electrolyte. To extend this analysis to more realistic conditions and further investigate the effects of drying on SCC, susceptibility of UNS A95083 material to cracking has been monitored during standard accelerated corrosion tests, including ASTM B117 and ASTM G85 A5. The effect of specific environmental test cycles and cyclic drying on SCC velocity was quantified and will be presented. The application of these results to establish more aggressive accelerated corrosion test conditions that mimic service environment cracking processes will also be discussed. Key words: Stress-corrosion cracking, accelerated corrosion testing, cyclic relative humidity INTRODUCTION Stress corrosion cracking (SCC) is controlled by complex interactions of load, environment, electrochemistry, and alloy properties 1 . Traditional environmental fracture testing conducted under immersion conditions may produce results that are much different from measurements made using thinelectrolyte layers formed under atmospheric conditions. For instance, oxygen, reactive halogens, and free radicals are likely to be present in higher concentrations within thin electrolytes. The present effort is directed toward utilizing a unique crack growth sensor for continuous in situ measurements of SCC propagation rates in AA5XXX series aluminum alloys under varying atmospheric conditions. Using tailored test specimens and exacting methods for loading, corrosive conditions and load interaction effects on SCC can be evaluated in accelerated tests and outdoor environments. These measurements can then be used to identify significant relationships between environmental parameters and SCC failure processes.
Transcript of Small Scale Crack Growth Sensor for Determination of ...

J. Siegel, M. Schindelholz, F. Friedersdorf, Small Scale Crack Growth Sensor for Determination of AA5XXX Susceptibility to SCC, NACE Corrosion Conference Proceedings, Dallas, Texas, March 2015. © 2015 by NACE International. Requests for permission to publish this manuscript in any form, in part or in whole, must be in writing to NACE International, Publications Division, 1440 South Creek Drive, Houston, Texas 77084. The material presented and the views expressed in this paper are solely those of the author(s) and are not necessarily endorsed by the Association. www.nace.org
Small Scale Crack Growth Sensor for Determination of AA5XXX Susceptibility to SCC
Jacob Siegel, Mara Schindelholz, Fritz Friedersdorf
Luna Innovations Inc. 1 Riverside Circle, Suite 400
Roanoke, VA 24016
ABSTRACT Stress corrosion cracking (SCC) of AA5XXX exposed to the atmosphere is a critical safety issue for DoD assets, often resulting in service failures. Previous research found in literature has demonstrated that SCC is controlled by complex interactions of load, environment, electrochemistry, and alloy properties. Traditional environmental fracture testing conducted under immersion conditions may produce results that are much different than measurements collected under thin electrolyte layers or droplets formed during atmospheric exposure. To more accurately assess AA5XXX susceptibility to SCC, a standalone in situ crack growth sensor has been developed to monitor crack propagation within a surrogate tensile sample under realistic atmospheric conditions. Using tailored test specimens and exacting methods for loading, corrosive conditions and load interaction effects on SCC can be evaluated in accelerated tests and outdoor environments. These measurements can then be used to identify the significant relationships between environmental parameters and SCC failure processes. Systematically varying environmental and mechanical parameters (e.g., relative humidity, salt molarity, degree of sensitization, and stress intensity) has shown a strong dependence of crack velocity on cyclic relative humidity (RH). Specifically, an increase in crack velocity has been observed with decreasing RH. This is contradictory to previous perceptions that cracking increases proportionally with increasing RH, and reflects ongoing uncertainty in literature of the exact mechanism of corrosion and SCC during drying of a thin electrolyte. To extend this analysis to more realistic conditions and further investigate the effects of drying on SCC, susceptibility of UNS A95083 material to cracking has been monitored during standard accelerated corrosion tests, including ASTM B117 and ASTM G85 A5. The effect of specific environmental test cycles and cyclic drying on SCC velocity was quantified and will be presented. The application of these results to establish more aggressive accelerated corrosion test conditions that mimic service environment cracking processes will also be discussed. Key words: Stress-corrosion cracking, accelerated corrosion testing, cyclic relative humidity
INTRODUCTION
Stress corrosion cracking (SCC) is controlled by complex interactions of load, environment, electrochemistry, and alloy properties1. Traditional environmental fracture testing conducted under immersion conditions may produce results that are much different from measurements made using thinelectrolyte layers formed under atmospheric conditions. For instance, oxygen, reactive halogens, and free radicals are likely to be present in higher concentrations within thin electrolytes. The present effort is directed toward utilizing a unique crack growth sensor for continuous in situ measurements of SCC propagation rates in AA5XXX series aluminum alloys under varying atmospheric conditions. Using tailored test specimens and exacting methods for loading, corrosive conditions and load interaction effects on SCC can be evaluated in accelerated tests and outdoor environments. These measurements can then be used to identify significant relationships between environmental parameters and SCC failure processes.

J. Siegel, M. Schindelholz, F. Friedersdorf, Small Scale Crack Growth Sensor for Determination of AA5XXX Susceptibility to SCC, NACE Corrosion Conference Proceedings, Dallas, Texas, March 2015. © 2015 by NACE International. Requests for permission to publish this manuscript in any form, in part or in whole, must be in writing to NACE International, Publications Division, 1440 South Creek Drive, Houston, Texas 77084. The material presented and the views expressed in this paper are solely those of the author(s) and are not necessarily endorsed by the Association. www.nace.org
40 50 60 70 80 900
5
10
15
20
25
Relative Humidity (%)C
rack
Vel
oci
ty (
nm
/s)
RH Cycle 3
Crack Rate Decreases Below ~68% RH
Crack Rate Increasing,RH Decreasing
Crack Rate Stable, RH Increasing
Initial results to be discussed in more detail later in the paper from the SCC sensor with a preloaded UNS A95083 fracture sample exposed in a controlled humidity chamber indicate a strong dependence of crack velocity on relative humidity (RH), particularly during dynamic RH cycling (Figure 1). An increase in crack velocity was observed during periods of decreasing RH, which is contradictory to perceptions that the severity of attack is always greater with increasing RH. This reflects ongoing uncertainty in the literature as to the exact processes for corrosion and SCC during drying of thin electrolyte layers.
Figure 1. 24 hour RH cycles for a preloaded UNS A95083 sample for a total of 355 hours indicate an increase in crack velocity during the drying cycle of the cyclic RH sweeps. The sample crack tip was
sprayed with 0.1-0.5M NaCl approximately every 75 hours of testing. The UNS A95083 SCC measurements have been extended to standard accelerated corrosion tests: ASTM B1172 and ASTM G85 A53. The effect of specific environmental test cycles and cyclic drying on SCC velocity has been quantified. These results demonstrate how the crack velocity increases during drying, as was observed in the initial cyclic humidity tests. In future work, crack growth sensors with UNS A95083 samples will be placed in outdoor exposure locations to determine if natural atmospheric environments and diurnal cycles yield the same relationships between wetting and drying cycles and crack growth rates as observed in standard accelerated corrosion tests. These laboratory and outdoor exposure test results will be used to determine if static intermediate humidity or dynamic transient drying processes are more important to cracking. These results and conclusions will be directly applicable to establishing aggressive conditions in accelerated corrosion tests that mimic cracking processes that occur in service environments.
EXPERIMENTAL PROCEDURE Small scale crack growth sensor An environment assisted cracking sensor (4.7” x 3.1” x 6.6”) tailored for aluminum samples and atmospheric testing has been developed. The main sensor components include a circumferentially V-notched fracture mechanics sample (0.5” Ø x 3.85” L), load nut, load frame, load cell, temperature sensor (potted in the load frame), sealed cap, embedded electronics, and sealed enclosure (Figure 2 and Figure 3).
RH Cycle 1 RH Cycle 2 RH Cycle 3 RH Cycle 4 RH Cycle 5
Crack Velocity (nm/s)Relative Humidity (%)
J. Siegel, M. Schindelholz, F. Friedersdorf, Small Scale Crack Growth Sensor for Determination of AA5XXX Susceptibility to SCC, NACE Corrosion Conference Proceedings, Dallas, Texas, March 2015. © 2015 by NACE International. Requests for permission to publish this manuscript in any form, in part or in whole, must be in writing to NACE International, Publications Division, 1440 South Creek Drive, Houston, Texas 77084. The material presented and the views expressed in this paper are solely those of the author(s) and are not necessarily endorsed by the Association. www.nace.org
Figure 2. Stress corrosion cracking sensor
cutaway.
Figure 3. Stress corrosion cracking sensor
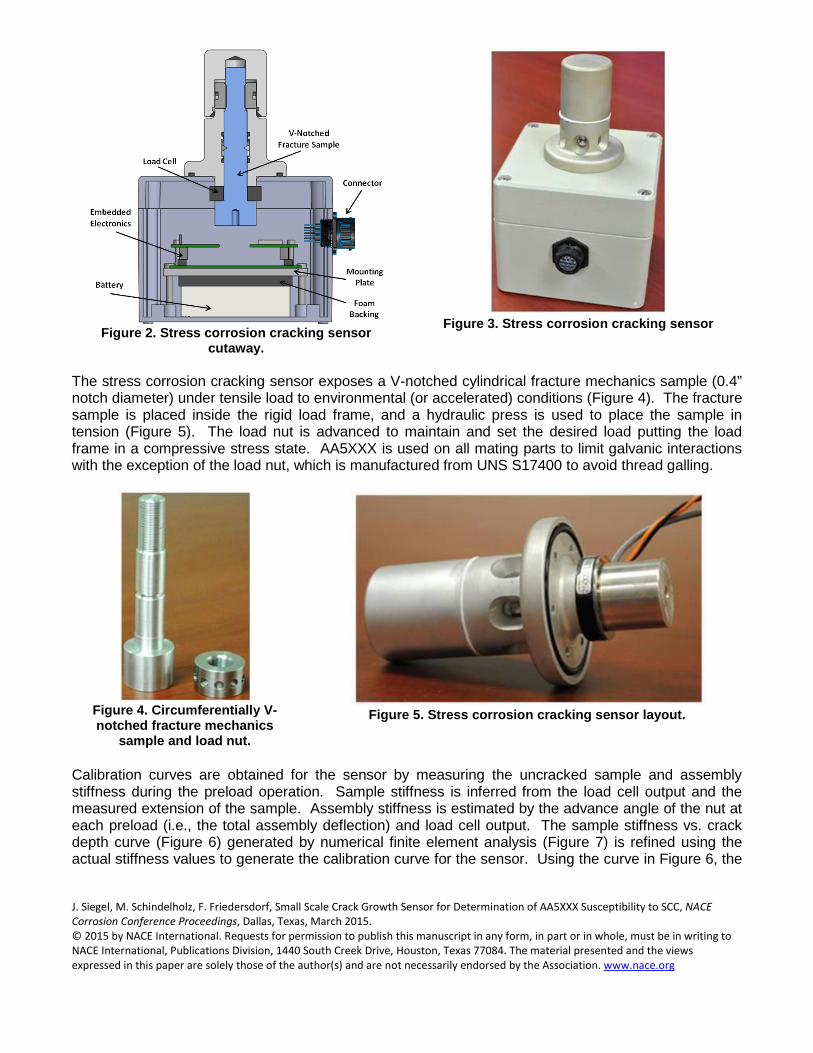
The stress corrosion cracking sensor exposes a V-notched cylindrical fracture mechanics sample (0.4” notch diameter) under tensile load to environmental (or accelerated) conditions (Figure 4). The fracture sample is placed inside the rigid load frame, and a hydraulic press is used to place the sample in tension (Figure 5). The load nut is advanced to maintain and set the desired load putting the load frame in a compressive stress state. AA5XXX is used on all mating parts to limit galvanic interactions with the exception of the load nut, which is manufactured from UNS S17400 to avoid thread galling.
Figure 4. Circumferentially V-notched fracture mechanics
sample and load nut.
Figure 5. Stress corrosion cracking sensor layout.
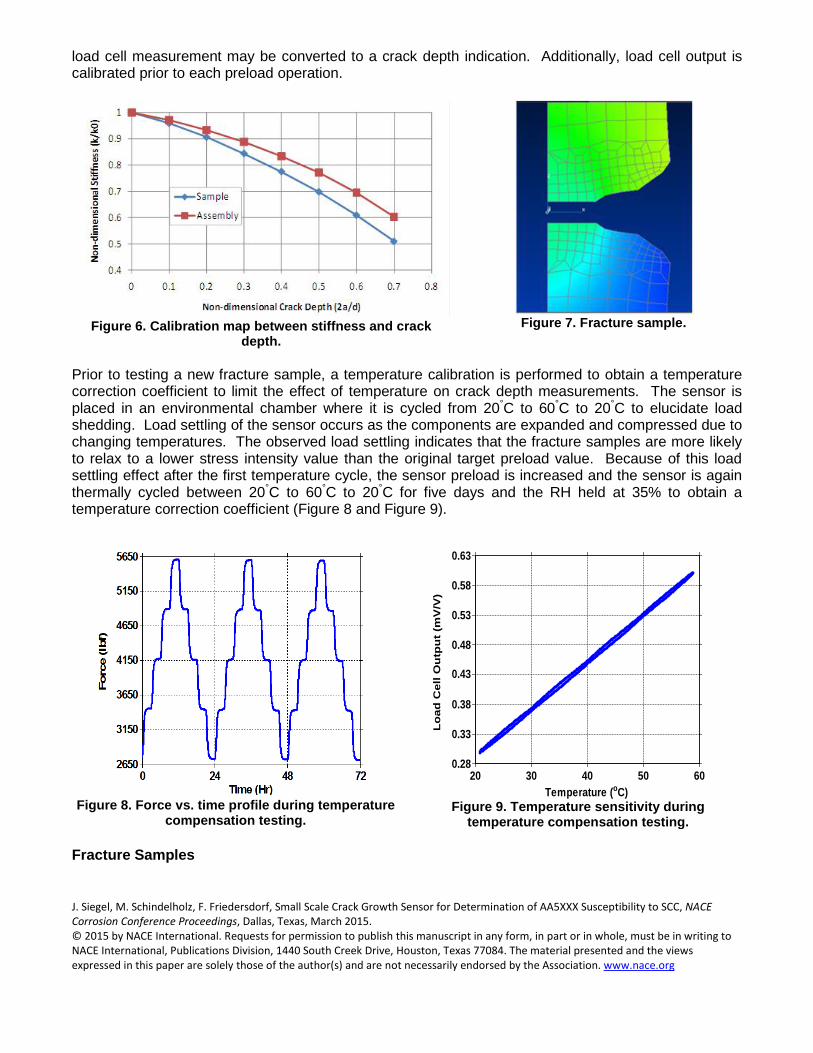
Calibration curves are obtained for the sensor by measuring the uncracked sample and assembly stiffness during the preload operation. Sample stiffness is inferred from the load cell output and the measured extension of the sample. Assembly stiffness is estimated by the advance angle of the nut at each preload (i.e., the total assembly deflection) and load cell output. The sample stiffness vs. crack depth curve (Figure 6) generated by numerical finite element analysis (Figure 7) is refined using the actual stiffness values to generate the calibration curve for the sensor. Using the curve in Figure 6, the
J. Siegel, M. Schindelholz, F. Friedersdorf, Small Scale Crack Growth Sensor for Determination of AA5XXX Susceptibility to SCC, NACE Corrosion Conference Proceedings, Dallas, Texas, March 2015. © 2015 by NACE International. Requests for permission to publish this manuscript in any form, in part or in whole, must be in writing to NACE International, Publications Division, 1440 South Creek Drive, Houston, Texas 77084. The material presented and the views expressed in this paper are solely those of the author(s) and are not necessarily endorsed by the Association. www.nace.org
load cell measurement may be converted to a crack depth indication. Additionally, load cell output is calibrated prior to each preload operation.
Figure 6. Calibration map between stiffness and crack
depth.
Figure 7. Fracture sample.
Prior to testing a new fracture sample, a temperature calibration is performed to obtain a temperature correction coefficient to limit the effect of temperature on crack depth measurements. The sensor is placed in an environmental chamber where it is cycled from 20°C to 60°C to 20°C to elucidate load shedding. Load settling of the sensor occurs as the components are expanded and compressed due to changing temperatures. The observed load settling indicates that the fracture samples are more likely to relax to a lower stress intensity value than the original target preload value. Because of this load settling effect after the first temperature cycle, the sensor preload is increased and the sensor is again thermally cycled between 20°C to 60°C to 20°C for five days and the RH held at 35% to obtain a temperature correction coefficient (Figure 8 and Figure 9).
Figure 8. Force vs. time profile during temperature
compensation testing.
Figure 9. Temperature sensitivity during
temperature compensation testing. Fracture Samples
AA5083-H116 V-Notched Sample Force Profile
20 30 40 50 600.28
0.33
0.38
0.43
0.48
0.53
0.58
0.63AA5083-H116 V-Notched Sample Temperature Sensitivity
Temperature (oC)
Lo
ad C
ell O
utp
ut
(mV
/V)

J. Siegel, M. Schindelholz, F. Friedersdorf, Small Scale Crack Growth Sensor for Determination of AA5XXX Susceptibility to SCC, NACE Corrosion Conference Proceedings, Dallas, Texas, March 2015. © 2015 by NACE International. Requests for permission to publish this manuscript in any form, in part or in whole, must be in writing to NACE International, Publications Division, 1440 South Creek Drive, Houston, Texas 77084. The material presented and the views expressed in this paper are solely those of the author(s) and are not necessarily endorsed by the Association. www.nace.org
Sensitized samples were produced by heat treating UNS A95083 samples at 150°C over a range of 0-60 days to yield degree of sensitization (DoS) levels from 2 to 55 mg/cm2. Test coupons were machined, and DoS levels were determined per the ASTM G67-994 standard for determining the susceptibility to intergranular corrosion of AA5XXX series alloys by mass loss after exposure to nitric acid (NAMLT Test). Fracture samples utilized in the testing reported here had sensitization levels ranging from 47 to 49 mg/cm2. New fracture samples were utilized for each test performed. Each test concluded when the surrogate alloy sample had fractured. Fracture sample crack tips were polished with 0.3 µm alumina suspension, and all sensor components were thoroughly cleaned prior to testing. Accelerated Testing The environments selected for testing the crack sensor include cyclic RH, ASTM B117, and ASTM G85 A5. The specific experimental procedures for each test are further described in the following subsections. Cyclic Relative Humidity. A UNS A95083 fracture sample with crack planes oriented in the S-L to S-T direction and DoS 47 mg/cm2 was placed in the SCC sensor and exposed to twenty-four hour RH cycles. Each cycle began with a three hour initial hold at 40% RH. RH was then increased from 40% to 90% over the next three hours before a hold at 90% for six hours. The RH was decreased to 40% over the next nine hours and lastly was held for an additional three hours at 40%. Testing was performed in a Thermatron 8200† environmental test chamber. Temperature was held constant at 30°C. Sodium chloride salt solution of varying molarity (0.1 M to 0.5 M) was sprayed on the crack tip at the beginning of a RH cycle approximately every 75 hours of testing (Figure 10).
Figure 10. Crack depth vs. time. Addition of salt solution to the crack tip indicated by red circles and
arrows. † Trade name.
0.5 M NaCl Spray
0.1 M NaCl Spray

J. Siegel, M. Schindelholz, F. Friedersdorf, Small Scale Crack Growth Sensor for Determination of AA5XXX Susceptibility to SCC, NACE Corrosion Conference Proceedings, Dallas, Texas, March 2015. © 2015 by NACE International. Requests for permission to publish this manuscript in any form, in part or in whole, must be in writing to NACE International, Publications Division, 1440 South Creek Drive, Houston, Texas 77084. The material presented and the views expressed in this paper are solely those of the author(s) and are not necessarily endorsed by the Association. www.nace.org
ASTM B117. A UNS A95083 fracture sample with crack planes oriented in the S-L to S-T direction and DoS 49 mg/cm2 was placed in the SCC sensor and exposed continuously in an Auto Technology† cyclic corrosion chamber to ASTM B115 salt fog (5% sodium chloride). Temperature was held constant at 35°C. Crack velocity remained low and relatively constant during ASTM B117, so RH was then ramped down until fracture of the sample. Two replicate experiments were performed with similar results. ASTM G85 A5. A UNS A95083 fracture sample with crack planes oriented in the S-L and S-T direction and DoS 49 mg/cm2 was placed in the SCC sensor and exposed to an ASTM G85 A5 environment in a cyclic corrosion chamber. This test included cyclic exposure of the sensor during one hour of drying at room temperature and one hour of fogging at 35°C, with a solution containing 0.05% sodium chloride and 0.35% ammonium sulfate by mass. A modified ASTM G85 A5 experiment was then performed by changing the steps from one hour of drying and one hour of fogging to two hours of drying at room temperature and two hours of fogging at 35°C. The same solutions were utilized.
RESULTS AND DISCUSSION
Cyclic Relative Humidity Crack depth and RH are plotted as a function of time for the last five RH cycles of the test, 230 – 355 hours (Figure 11). The crack depth data was filtered with a moving average method. It was then differentiated over time to produce a plot of crack velocity as a function of time (Figure 12). Filtering the data with a moving average decreased the crack velocity values, but removed excess noise that was dominating the response. The crack velocity plot is separated into five 24 hour RH cycles. Each cycle showed a peak in the crack velocity representative of the increase in crack rate during the dry off portion of the RH cycle. The peaks increased in magnitude with each subsequent RH cycle and increasing crack depth. This increase most likely occurred because the stress intensity at the crack tip increased as the crack propagated. Lower crack velocity values were associated with the high humidity portion of the RH cycle.
† Trade name.

J. Siegel, M. Schindelholz, F. Friedersdorf, Small Scale Crack Growth Sensor for Determination of AA5XXX Susceptibility to SCC, NACE Corrosion Conference Proceedings, Dallas, Texas, March 2015. © 2015 by NACE International. Requests for permission to publish this manuscript in any form, in part or in whole, must be in writing to NACE International, Publications Division, 1440 South Creek Drive, Houston, Texas 77084. The material presented and the views expressed in this paper are solely those of the author(s) and are not necessarily endorsed by the Association. www.nace.org
Figure 11. Crack depth vs. time (230-355 hours).
Crack velocity as a function of RH is plotted for the last five RH cycles of the test (Figure 13). RH data was also filtered with a moving average method. Little corrosion occurred during the ramp-up portion of the RH cycle. RH cycle 4 is the only cycle that displayed increasing crack velocity as the RH increased towards 90%. However, there was a sharp decrease in crack velocity immediately before reaching 90% RH. During the transition from wetting to drying, all five cycles show an increase in crack velocity that occurred between 78% and 85% RH. The crack velocities continued to increase to a maximum crack velocity around 55% to 68% RH. Each cycle’s crack velocity then decreased as the RH decreased to 40%. It should be noted that the crack velocities remained positive during the entirety of the cycle, including at low RH which is below the expected efflorescence level of sodium chloride. The fractured crack tip showed a predominate region of SCC along with a small region of ductile overload in the upper right of the crack tip (Figure 14).
Figure 13. Crack velocity vs. RH (230-355 hours).
Figure 14. UNS A95083 fracture sample
shows a predominate region of SCC along with a small region of ductile
overload in the upper right of the crack tip.
RH Cycle 1 RH Cycle 2 RH Cycle 3 RH Cycle 4 RH Cycle 5
Cycle 1Cycle 2
Cycle 3
Cycle 4
Cycle 5
Wetting
Drying
Figure 12. Crack velocity vs. time (230-355 hours).
RH Cycle 1 RH Cycle 2 RH Cycle 3 RH Cycle 4 RH Cycle 5

J. Siegel, M. Schindelholz, F. Friedersdorf, Small Scale Crack Growth Sensor for Determination of AA5XXX Susceptibility to SCC, NACE Corrosion Conference Proceedings, Dallas, Texas, March 2015. © 2015 by NACE International. Requests for permission to publish this manuscript in any form, in part or in whole, must be in writing to NACE International, Publications Division, 1440 South Creek Drive, Houston, Texas 77084. The material presented and the views expressed in this paper are solely those of the author(s) and are not necessarily endorsed by the Association. www.nace.org
ASTM B117 There was no appreciable crack depth increase during B117 salt fog exposure and during a first decrease in RH due to a power outage. However, the crack depth (and velocity) increased dramatically after B117 salt fog was shut down a second time, and the RH began to decrease from 90% to 80% (~410 hours). The cracking continued until final fracture occurred even as the RH decreased and was held constant at 35% for 15 hours (Figure 15). Three step changes in crack depth occurred during 35% RH exposure. The fractured crack tip showed indication of SCC in the upper and left areas (Figure 16). There were also large regions of ductile overload in the center and the lower and right areas of the crack tip. Minimal crack depth increase was also observed during the replicate B117 salt fog experiment. Again after salt fog ceased and the RH was decreased, crack depth increased dramatically and the sample fractured after 120 hours of testing (Figure 17). B117 salt fog was initiated just prior to final fracture, but it is assumed that cracking was still occurring from the previous drying cycle. The fractured crack tip again showed indication of SCC, this time around the outer circumference of the sample (Figure 18). There was also a region of ductile overload in the center (as previously observed in the initial B117 test) of the crack tip.
Figure 15. UNS A95083 crack testing in B117 salt fog and dynamic RH conditions. Minimal change in crack depth
occured during B117 salt fog testing. The sample fractured during 35% RH exposure.
Figure 16. UNS A95083 fracture sample
crack tip shows upper and left regions of SCC with a large centralized region of
ductile overload.
0 6033
43
53
63
73
83
93
103
Rel
ativ
e H
um
idit
y (%
)
0 60 120 180 240 300 360 420 4801
2
3
4
5
6
7
8AA5083-H116, DoS = 49 mg/cm2, k = 10.7 MPa-m1/2
Cra
ck D
epth
(m
m)
Time (hr)
Crack Depth (mm)Relative Humidity (%)
B117 Salt Fog

J. Siegel, M. Schindelholz, F. Friedersdorf, Small Scale Crack Growth Sensor for Determination of AA5XXX Susceptibility to SCC, NACE Corrosion Conference Proceedings, Dallas, Texas, March 2015. © 2015 by NACE International. Requests for permission to publish this manuscript in any form, in part or in whole, must be in writing to NACE International, Publications Division, 1440 South Creek Drive, Houston, Texas 77084. The material presented and the views expressed in this paper are solely those of the author(s) and are not necessarily endorsed by the Association. www.nace.org
Figure 17. UNS A95083 crack testing in B117 salt fog and under dynamic RH conditions. The sensor showed little
crack depth change during B117 salt fog testing. However, after the salt fog was shut down and RH began to decrease, crack depth increased dramatically and fractured after 120
hours of testing.
Figure 18. UNS A95083 fracture sample
crack tip shows SCC cracking with areas of ductile overload in the center.
ASTM G85 A5 During the first 13 hours of the first ASTM G85 A5 test, minimal change in crack growth was observed. A cyclical, systematic response, clearly evident in the first 13 hours of testing, is assumed to be the result of changing temperatures during testing. This first ASTM G85 A5 test cycle was comprised of a one hour fog at room temperature and a one hour dry-off at 35°C. The temperature compensation strategy implemented corrects data output for temperature, but is only effective for long-term transients. Therefore, it was expected to observe some change in sensor response due to changing temperature during the 2-hour ASTM G85 A5 test cycle. After 13 hours of testing, the crack depth began to increase at a decreasing rate until a slight inflection point was observed at approximately 37 hours (Figure 19). After 37 hours of testing, crack depth continued to increase but at an increasing rate. After 51 hours of testing, four small step changes of .063 mm to .163 mm of crack growth were observed prior to final fracture occurring after 54 hours of testing. The small step changes prior to final fracture are assumed to be representative of ductile overload of remaining UNS A95083 ligaments. The fractured crack tip showed predominately SCC cracking with local areas of ductile overload (Figure 20). As mentioned, the temperature compensation strategy implemented in the sensor’s data acquisition for this first ASTM G85 experiment is only capable of correcting for longer-term transients, typical of natural outdoor atmospheric temperature changes. Extremely quick transients or step changes in temperature that occurred during the one hour drying and fogging cycles resulted in a peak in the crack depth data, convoluting crack velocity values calculated by taking the first derivative of the crack depth with respect to time. Therefore, longer two hour holds were used in the replicate experiment and both the dry off and fog portions of the modified ASTM G85 A5 test were performed at 35oC. Despite changes to the ASTM G85 A5 test, the cyclic corrosion chamber’s temperature varied several degrees
0 2530
50
70
90
110
Rel
ativ
e H
um
idit
y (%
)
0 25 50 75 100 1250
2.2
4.4
6.6
8.8AA5083-H116, DoS = 49 mg/cm2, k = 8.9 MPa-m1/2
Cra
ck D
epth
(m
m)
Time (hr)
Crack Depth (mm)Relative Humidity (%)
B117 Salt Fog

J. Siegel, M. Schindelholz, F. Friedersdorf, Small Scale Crack Growth Sensor for Determination of AA5XXX Susceptibility to SCC, NACE Corrosion Conference Proceedings, Dallas, Texas, March 2015. © 2015 by NACE International. Requests for permission to publish this manuscript in any form, in part or in whole, must be in writing to NACE International, Publications Division, 1440 South Creek Drive, Houston, Texas 77084. The material presented and the views expressed in this paper are solely those of the author(s) and are not necessarily endorsed by the Association. www.nace.org
when switching between dry-off and fog portions of the test cycle, resulting in a cyclical, systematic response clearly evident in the first 54 hours of testing (Figure 21).
Figure 19. UNS A95083 crack testing under ASTM G85 A5
dynamic RH conditions. The sensor showed little crack depth change during the first 13 hours of testing. Consistent
cracking occurred until final fracture resulted after 54 hours of testing.
Figure 20. UNS A95083 fracture sample
crack tip shows predominately SCC cracking with local areas of ductile
overload.
During the first 54 hours of the modified ASTM G85 A5 test, minimal change in crack growth was observed (Figure 21). After 54.5 hours of testing, the crack depth began steadily increasing to .57 mm at an average rate of 19.55 nm/s. After 62.6 hours of testing, a steep increase in crack depth of .51 mm was observed and followed by a flatter region, representative of lower crack velocities. This cycle of a steep increase in crack depth followed by a flatter region occurred two more times, beginning after 63.9 and 66.2 hours of testing and correlates to an increase in crack depth of .79 and .86 mm, respectively. The small step changes prior to final fracture are assumed to be representative of ductile overload of remaining UNS A95083 ligaments. After 69 hours of testing and only approximately 15 hours of cracking, the UNS A95083 V-notched sample fully fractured. Crack velocity values were calculated by taking the first derivative of the crack depth with respect to time. The resulting crack velocity was plotted as a function of relative humidity to study the dependence of crack velocity on cyclic humidity (Figure 22). Three (4-hour) cycles are shown, representing 12 hours of data beginning after 57 hours of testing. The negative crack velocity values and peaks at 100% RH are assumed to be a result of temperature variation occurring when switching between dry off and fog portions of the test cycle. Minimal cracking occurred during the wetting cycle as RH was increasing. During the drying cycle, crack velocity increased to a single maximum that shifted from 31% to 37% to 48% RH as crack depth increased. The highest crack velocity of 609 nm/s occurred during the drying portion of the final RH cycle at 48%. The peaks increased in magnitude with each subsequent RH cycle and increasing crack depth. This increase most likely occurred because the stress intensity at the crack tip increased as the crack propagated. All three cycles demonstrate that cracking is predominately shut down at 22% RH and lower.
0 1420
30
40
50
60
70
80
90
100
Rela
tive
Hum
idity
(%)
0 14 28 42 560
1
2
3
4
5
6
7
8
AA5083-H116 V-Notched Sample Under ASTM G85 A5 Conditions,DoS = 49 mg/cm2, k = 9.2 MPa-m1/2
Crac
k De
pth
(mm
)
Time (hr)
Crack Depth (mm)Relative Humidity (%)

J. Siegel, M. Schindelholz, F. Friedersdorf, Small Scale Crack Growth Sensor for Determination of AA5XXX Susceptibility to SCC, NACE Corrosion Conference Proceedings, Dallas, Texas, March 2015. © 2015 by NACE International. Requests for permission to publish this manuscript in any form, in part or in whole, must be in writing to NACE International, Publications Division, 1440 South Creek Drive, Houston, Texas 77084. The material presented and the views expressed in this paper are solely those of the author(s) and are not necessarily endorsed by the Association. www.nace.org
Figure 21. UNS A95083 crack testing under ASTM G85 A5 dynamic RH conditions. The
sensor showed little crack depth change during the first 54 hours of testing. Consistent
cracking occurred until final fracture resulted after 69 hours of testing.
Figure 22. UNS A95083 crack velocity vs. relative
humidity during modified ASTM G85 A5 dynamic RH conditions. The three (4-hour) cycles shown represent
12 hours of data beginning after 57 hours of testing.
CONCLUSIONS
Testing of the atmospheric crack sensor under various accelerated environmental conditions has demonstrated that it is effective for observing small scale crack propagation under conditions of slowly changing or constant temperature. Test results from the cyclic RH and ASTM G85 A5 tests have shown the strong dependence of crack velocity on cyclic humidity. In both of these tests, the most severe environmental conditions occurred during the drying cycle, and highest crack rates were observed at moderate to low RH. An increase in crack velocity with decreasing relative humidity indicates that some thin electrolyte could still be present at lower levels of RH due to the occluded crack tip geometry and/or capillary effect inhibiting complete crack tip drying. In comparison, during ASTM B117 exposure, no appreciable increase in crack depth occurred over the course of the experiment. Future testing will seek to determine whether the increase in crack velocity during drying, as observed in the studies described, is primarily a function of transient RH or a particular range of RH. A standalone crack sensor will be deployed for outdoor exposure site testing, and corrosion monitoring systems already deployed to the same sites will provide real time corrosivity and environmental data for comparison to crack velocity measurements. Conclusions from this work will serve to establish conditions for an improved accelerated test that can more closely mimic cracking processes that occur in service environments.
ACKNOWLEDGEMENTS This material is based upon work supported by the Strategic Environmental Research and Development Program (SERDP) via contract W912HQ-09-C-0042 Any opinions, findings and conclusions or recommendations expressed in this material are those of the author(s) and do not
0 12 24 36 48 60 72
0
1
2
3
4
5
6
7
8
AA5083-H116 V-Notched Sample Under Modified ASTM G85 A5 Conditions, DoS = 49 mg/cm2, k = 9.4 MPa-m1/2
Cra
ck D
epth
(m
m)
Time (hr)
0 1210
20
30
40
50
60
70
80
90
100
Rel
ativ
e H
um
idit
y (%
)
Crack Depth (mm)Relative Humidity (%)
Cycle 1
Cycle 2 Cycle 3

J. Siegel, M. Schindelholz, F. Friedersdorf, Small Scale Crack Growth Sensor for Determination of AA5XXX Susceptibility to SCC, NACE Corrosion Conference Proceedings, Dallas, Texas, March 2015. © 2015 by NACE International. Requests for permission to publish this manuscript in any form, in part or in whole, must be in writing to NACE International, Publications Division, 1440 South Creek Drive, Houston, Texas 77084. The material presented and the views expressed in this paper are solely those of the author(s) and are not necessarily endorsed by the Association. www.nace.org
necessarily reflect the views of SERDP. The authors thank team members on this effort including James Dante, Manager of the Environmental Materials Performance Division at the Southwest Research Institute† and Francine Bovard, Technical Specialist, and James Moran, Senior Staff Engineer, at Alcoa Inc.† Discussions with Robert Kelly, Professor of Engineering at the University of Virginia† are also gratefully acknowledged.
REFERENCES 1. Sprowls, D., A Study of Environmental Characterization of Conventional and Advanced Aluminum
Alloys for Selection and Design: Phase I - Literature Review. 1984, NASA contract report no. 172387.
2. ASTM B117-11, Standard Practice for Operating Salt Spray (Fog) Apparatus, ASTM International, West Conshohocken, PA, 2011,www.astm.org.
3. ASTM G85-11, Standard Practice for Modified Salt Spray (Fog) Testing, ASTM International, West Conshohocken, PA, 2011,www.astm.org.
4. ASTM G67-99, Standard Test Method for Determining the Susceptibility to Intergranular Corrosion of 5XXX Series Aluminum Alloys by Mass Loss After Exposure to Nitric Acid (NAMLT Test), ASTM International, West Conshohocken, PA, 1999,www.astm.org.
† Trade name. † Trade name. † Trade name.


![Determination of fracture toughness using the area of micro-crack … · 2017. 8. 27. · tip of the indented section [14]; whereas in the second (half-penny) model, the crack length](https://static.fdocuments.in/doc/165x107/60e00f9e9b39906d7619172c/determination-of-fracture-toughness-using-the-area-of-micro-crack-2017-8-27.jpg)