SMALL SCALE AND MICRO IRRIGATION SUPPORT …smis-ethiopia.org/wp-content/uploads/kpdocs/255...
57
SMALL SCALE AND MICRO IRRIGATION SUPPORT PROJECT SMIS RPMU, Hawassa January 25-30/2017 (Prepared by Abdo Kedir) Training Manual on AUTOCAD CIVIL 3D 2016 for irrigation professionals
Transcript of SMALL SCALE AND MICRO IRRIGATION SUPPORT …smis-ethiopia.org/wp-content/uploads/kpdocs/255...

SMALL SCALE AND MICRO IRRIGATION
SUPPORT PROJECT
SMIS RPMU, Hawassa
January 25-30/2017 (Prepared by Abdo Kedir)
Training Manual on
AUTOCAD CIVIL 3D 2016
for irrigation professionals

i
CONTENTS
1 CIVIL 3D 2016 ................................................................................................................................... 1
1.1 Introduction ................................................................................................................................. 1
1.2 Civil 3D user Interface ................................................................................................................ 2
2 POINTS ............................................................................................................................................... 9
2.1 Understanding and creating points .............................................................................................. 9
2.2 Importing survey points ............................................................................................................. 10
2.3 Creating Point Groups ............................................................................................................... 14
2.4 Changing the style, size and item to be displayed in Points Groups ......................................... 16
3 SURFACE ......................................................................................................................................... 19
3.1 Creating the survey surface (creating a TIN surface) ................................................................ 19
3.2 Adding Points Group data to a surface ...................................................................................... 22
3.3 Editing surface style (contour interval) ..................................................................................... 23
3.4 Working with surface boundary ................................................................................................ 25
3.5 Labeling Contours ..................................................................................................................... 27
3.6 Editing contour labeling ............................................................................................................ 30
4 ALIGNMENT ................................................................................................................................... 33
4.1 Overview of Alignment ............................................................................................................. 33
4.2 Creating Alignment ................................................................................................................... 33
4.2.1 Creating Alignment from polyline ........................................................................................ 34
4.2.2 Creating an alignment with the Alignment Layout Tools ..................................................... 37
4.3 Labeling alignment .................................................................................................................... 38
5 PROFILE AND PROFILE VIEW .................................................................................................. 42

ii
5.1 Understanding profile ................................................................................................................ 42
5.2 Creating Surface profile............................................................................................................. 43
5.3 Creating a layout profile ............................................................................................................ 45
5.4 Creating profile from a file ........................................................................................................ 48
5.5 Quick Profile ............................................................................................................................. 50
5.6 Getting profile data from Civil 3D ............................................................................................ 51

Training manual on Autocad Civil 3D
~ 1 ~
1 Civil 3D 2016
1.1 Introduction
Civil 3D is an engineering software application used by civil engineers and other professionals to
plan, design, and manage civil engineering projects. These projects fall under the three main
categories of land development, water, and transportation projects; and can include construction
area development, road engineering, river development, port construction, canals, dams,
embankments, and many others. Civil 3D allows is used to create three-dimensional (3D) models
of land, water, or transportation features while maintaining dynamic relationships to source data
such as grading objects, breaklines, contours, and corridors. As an industry-leading building
information modeling (BIM) solution, Civil 3D is well known in the civil engineering community
and widely used on a variety of infrastructure projects both large and small.
Individuals who are currently using AutoCAD or plan on learning AutoCAD will inherit many
benefits of using Civil 3D. Civil 3D was originally created to be an add-on for AutoCAD but as
its popularity and demand grew, it was further evolved and developed into a stand-alone product -
built on the AutoCAD platform. Civil 3D offers a familiar design environment and many
AutoCAD-compatible shortcuts; and with true DWG (drawing) file support, Civil 3D allows you
to store and share design data with existing AutoCAD users. With Civil 3D projects, changes to
drafting and annotation are automatically reflected throughout the model for quick and efficient
visualizations that remain in sync as you make design changes at any stage of the process. A
popular use of Civil 3D is its fully integrated survey functionality, which offers a consistent
environment for survey tasks and allows for raw imports of survey data, adjustments of least-
squares, survey observation edits, and the automatic creation of survey figures and surfaces. Civil
3D offers many other beneficial tools and features that can enhance your project such as Pressure
Networks, Corridor Modeling, Earthwork Calculations, Grading, Pipes, Production Drafting,
Geospatial Analysis, Point Clouds, and much more.
Civil 3D is designed to work in a new way. The pieces from which you build your design are no
longer lines, arcs, and text; they are representations of real-world objects you design. This brings
the power of dynamic modeling to the desktop, allowing you as a designer to experiment with
multiple solutions, looking for a better solution instead of just the first working solution.

Training manual on Autocad Civil 3D
~ 2 ~
1.2 Civil 3D user Interface
When Civil 3D has finished loading, it looks something like figure below. There are all kinds of
buttons and controls along the top, bottom, and sides of the drawing area.
The Ribbon
As shown in figure below, the ribbon is a logical placement of similar functions and commands
according to the process you are doing.

Training manual on Autocad Civil 3D
~ 3 ~
Tabs
At the top of the ribbon are a series of functions called tabs. You can think of them as grouped
processes. The following tabs are displayed by default: Home, Insert, Modify, Analyze ….
Panels
Each tab contains a group of functions at the bottom of the ribbon. For example, the Home tab
contains the following panels: Palettes, Create Ground Data, Create Design, Profile & Section
Views, Draw, Modify, Layers, View, and Clipboard.
Some of the panels will have fly-out menus that contain further commands that might not be used
as often. For example, the Create Ground Data panel on the Home tab has a fly-out menu that
contains the Survey Data Collection Link command.
Menus and Commands
Menus and commands are included in each panel of the ribbon. When you select a Menu icon,
you get an expanded set of icons with more specific commands. Commands do not have a fly-out
menu associated with them, so selecting a command will either launch that command or a wizard.
For example, the Create Design panel of the Home tab expanded to more commands as shown in
figure below.
Toolspace in Civil 3D
Toolspace is where you will spend most of your time interacting with Civil 3D’s model and the
settings that drive it. Additionally, this is where you’ll work with Survey information and
generate reports to XML or text formats. Model information, drawing settings, survey, and
reporting are each handled by separate palettes: Prospector, Settings, Survey, and Toolbox
respectively.

Training manual on Autocad Civil 3D
~ 4 ~
1. Prospector
The Prospector tab in the Toolspace is the Primary window for handling property, styles and
commands for all Civil 3D objects. Prospector is the main entry to the model you’ll build with
Civil 3D. This is where you’ll dig into the various objects, work with Project Data, and create
new drawings. Prospector has some major controls that we want to look at before getting deeper
into individual model items.
The first button you’ll want to know about is the Preview toggle, , that turns on and off the
object previews on a global level. As drawing objects are created, they generate previews that can
be displayed in Prospector in a preview pane. This button toggles that pane on and off.
The second button you’ll want to familiarize yourself with is the Item View Orientation toggle,
. When you are using Toolspace as a floating-palette set, this button toggles where the Civil
3D list view of various object is oriented, at the right or at the bottom of the palette.

Training manual on Autocad Civil 3D
~ 5 ~
The last piece of the main controls you’ll want to familiarize yourself with is the drop-down
menu for view selection. In this menu, you can select between Master View and Active Drawing
View, . In Master View, all the branches are presented,
including multiple drawings if you have more than one open, the Projects branch, the Data
Shortcuts branch, and the Drawing Templates branch. In Active Drawing View, you will see only
the data relating to your current drawing. This is handy when you’re working with a large number
of drawings in general, so you can have them all open but focus on one drawing for the current
tasks.
Beyond the controls, Prospector has one main pane that never goes away, and an additional pane
that shows the list and preview areas when needed. This main pane resembles Windows
Explorer’s folder view, with plus symbols designating areas that have deeper objects. These
symbols also allow for expansion and contraction as needed to manage the display of various data
objects.
2. Setting
The setting tab contains a tree structure of object style and setting for the drawing. Like the
prospector tab, it has object collection at several level.
For example to check the drawing setting, Change the Setting tab in Toolspace as shown in the
figure below. Right-click the Drawing 1 & Select Edit drawing Setting. Then the drawing setting
dialog box will appear. Here we can set the unit and zone of coordinate system and other related
information as per our preference.

Training manual on Autocad Civil 3D
~ 6 ~
3. Survey tab
The Survey tab is specifically for working with survey data. You could call it - Prospector for
surveyors, because it serves the same functions and works in much the same way as the
Prospector tab. It displays survey data in a tree structure, and it allows you to launch commands
through contextual menus.

Training manual on Autocad Civil 3D
~ 7 ~
4. Toolbox tab
Civil 3D offers built-in reports covering alignments, corridors, parcels, points, profiles, pipes, and
surfaces. These reports are accessed from the Toolspace palette set on the Toolbox palette.
Static versus Contextual Tabs
Tabs will either be static or contextual in nature. What this means is that if you select a static tab,
the panels, menus, and commands will change, but they are still general in nature. For example,
selecting the Annotate tab reveals the following panels: Labels & Tables, Text, Dimensions,
Leaders, Tables, Markup, and Annotation Scaling. Each of the panels contains something a little
more specific to the task.
A contextual tab, on the other hand, is very task-specific. The Modify tab is a good example of
this. When you select the Modify tab, the panels all change as they do when you select a static
tab, but selecting a command under one of those panels (such as the Ground Data or Design
panel) will launch a new tab specific to that task. For example, selecting the Surface command
will launch a new tab with a new background and specific tasks designed for anything dealing

Training manual on Autocad Civil 3D
~ 8 ~
with surface. The contextual panels now reveal the following: Labels & Tables, General Tools,
Modify, Analyze, Surface Tools & Launch Pad, and Close as shown in the figure below.
Another (and more effective) method of using the contextual tabs is demonstrated by clicking an
item; whether it be an alignment, surface, parcel, or whatever. The contextual tab will change to a
green background and display only the information that pertains to that particular object. For
example, if you select an existing surface, the contextual tab shows the surface name, and the
commands in the ribbon will be applicable only to that surface as shown in figure below.
Panorama
The Panorama palette set is Civil 3D’s way of talking back to you. The data views that are
displayed in the Panorama window are referred to as vistas. The Panorama window can display
many types of data, such as the Point Editor vista and the Alignment Entities vista.
For instance to display the panorama window on Alignment Entities, click alignment in the
drawing Click Alignment tab Modify panel Geometry Editor. In the Alignment Layout
Tools toolbar, click
A table called Alignment Entities is displayed in a separate window called the Panorama as
shown in the figure below.

Training manual on Autocad Civil 3D
~ 9 ~
2 Points
2.1 Understanding and creating points
In civil engineering, points are the foundation of all geometry - both existing and design. When a
project is started, points are often used to represent ground elevations, feature locations, property
corners, and other critical elements.
In AutoCAD Civil 3D, you can create, work with, and manage points using a variety of
commands and tools. The points created by AutoCAD Civil 3D are called Coordinate Geometry
(COGO) points, which are very different from AutoCAD point nodes. AutoCAD point nodes
have only coordinate data (XYZ values) associated with them. However, COGO points, in
addition to coordinate data, have a variety of properties associated with them, including point
number, point name, raw (field) description, and full (expanded) description. Unlike AutoCAD
point nodes, which exist in a single drawing, COGO points can be stored in a project outside a
drawing and referenced by multiple users. In AutoCAD Civil 3D, the term point refers to a
COGO point, not to an AutoCAD point node.
Points in Civil3D can be created in a number of ways:
Points can be created using Points from File from the Insert tab
It can be created in Toolspace, on the prospector
Points can also be created using Point Creation Tools in the Create Ground Data panel as
shown in the figure below.
Training manual on Autocad Civil 3D
~ 10 ~
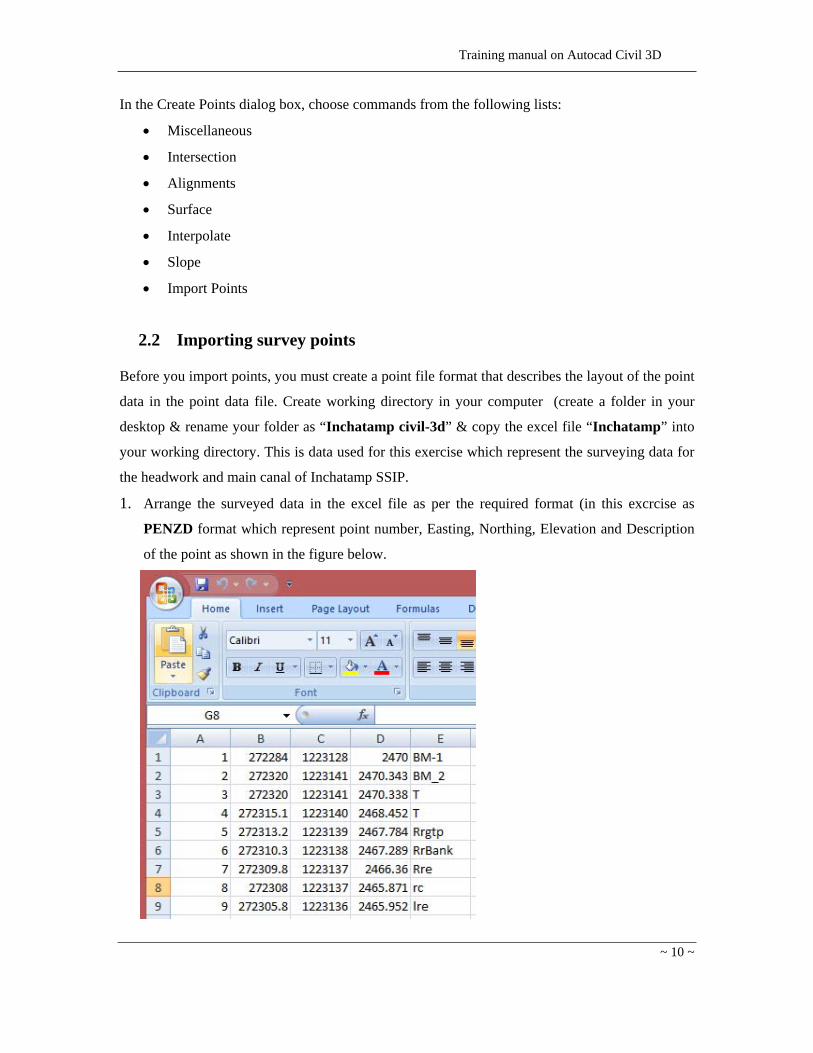
In the Create Points dialog box, choose commands from the following lists:
Miscellaneous
Intersection
Alignments
Surface
Interpolate
Slope
Import Points
2.2 Importing survey points
Before you import points, you must create a point file format that describes the layout of the point
data in the point data file. Create working directory in your computer (create a folder in your
desktop & rename your folder as “Inchatamp civil-3d” & copy the excel file “Inchatamp” into
your working directory. This is data used for this exercise which represent the surveying data for
the headwork and main canal of Inchatamp SSIP.
1. Arrange the surveyed data in the excel file as per the required format (in this excrcise as
PENZD format which represent point number, Easting, Northing, Elevation and Description
of the point as shown in the figure below.

Training manual on Autocad Civil 3D
~ 11 ~
2. Save the excel file in your working directory as CSV (comma delimted) format and name
the file as Inchatamp-csv.
3. Launch CIVIL 3D 2016 (metric) or other version from you’re your computer.
4. From the Insert tab and Import panel on the ribbon, select Point from File.
The import dialog box will open as shown in the figure below
5. In the Import point dialog, confirm that the PENZD (comma delimited) format is selected
as shown in the figure above to match with the data saved in step 2.
6. Click the plus sign at the top right of the import points daialog as shown in the above
figure. The Select Source File dialog will appear.
7. In the Select Source File dialog, navigate to the file saved in step 2 and click open. The
import point dailog will look like the figure below.

Training manual on Autocad Civil 3D
~ 12 ~
8. Back in the Import Points dialog, uncheck the Do Elevation Adjustment if possible box.
9. Click OK (You may click Zoom Extents to display the maximum extent in your screen/type
ZE on the commnand line or In Toolspace, on the Prospector tab, right-click Points/ the _All
Points. Click Zoom To.). The points look like the figure below in Civil 3D interface.

Training manual on Autocad Civil 3D
~ 13 ~
10. Locate the point entry on the Prospector tab of the Toolspace, as shown in the figure below.
11. Look at the bottom half of the Prospector and locate the item view that lists all of the points
in the drawing.
12. Scroll down to the entry for point number 21, as shown in figure below. Select the entry, and
right-click. A context-specific shortcut menu will appear. Choose Zoom to. The drawing will
zoom in on point 21 in your screen.
13. Hover your sceen over points on the screen. Note that a tooltip appears with point information
such as Number, Layer, Description, Easting, Northing, Elevation as shown in figure below.
Training manual on Autocad Civil 3D
~ 14 ~
2.3 Creating Point Groups
You can use named collections of points, called Point Groups, to organize points and to control
their appearance in a drawing.
Point Groups provide a flexible and convenient way to identify points that share common
characteristics or that are used to perform a task, such as creating a surface. You can use point
groups to create groupings of points using point number, point name, point elevation, raw (field)
or full description, and other characteristics.
Point groups also play a fundamental role in controlling how a point displays in a drawing. If you
have a set of points that share common display characteristics, you can use a point group to
identify the point style and point label style for all the points in the point group, instead of
assigning a point style and a point label style to each individual point. Also, using a point group
you can quickly change the style or label style for all the points in a point group at once, instead
of changing each point individually.
After the points are imported, they must be organized and annotated. Although it may
occasionally be useful to have points simply marked with an X, most designers will want some
labeling to help identify the points. The following exercise leads you through using the _All
Points group to assign a label style to the newly imported points:
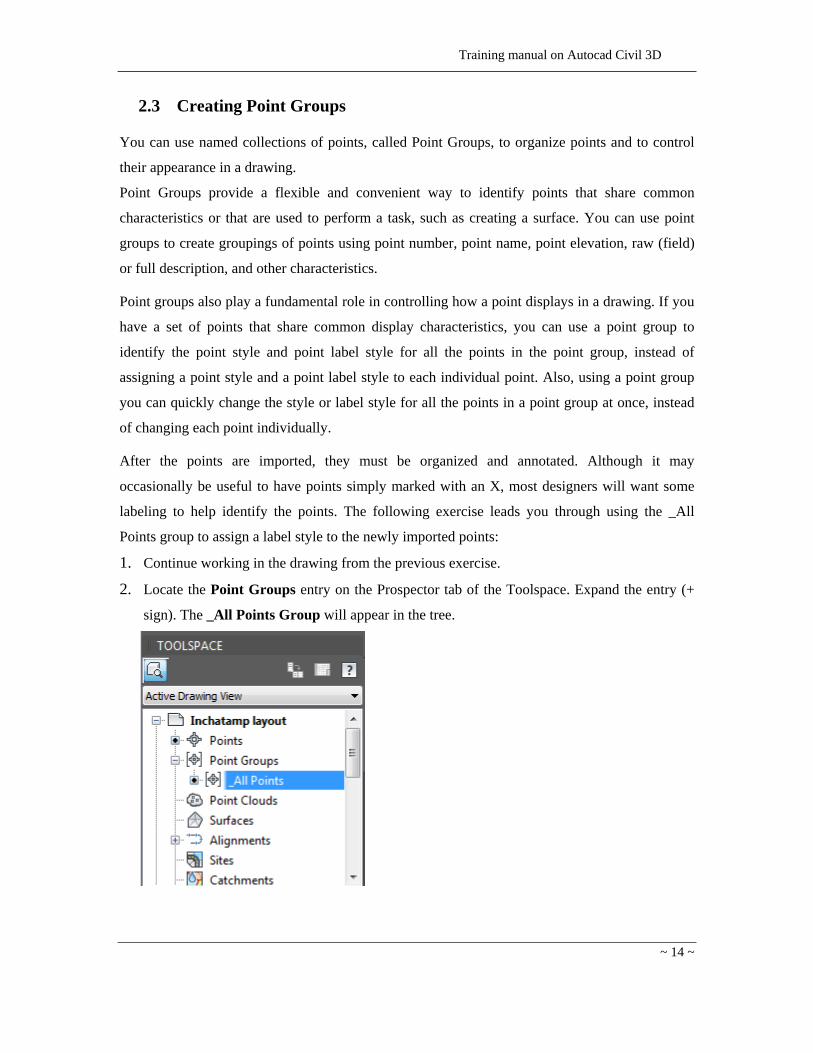
1. Continue working in the drawing from the previous exercise.
2. Locate the Point Groups entry on the Prospector tab of the Toolspace. Expand the entry (+
sign). The _All Points Group will appear in the tree.

Training manual on Autocad Civil 3D
~ 15 ~
3. Right-click the _All Points Groups, and choose Properties. The Point Group Properties
dialog appears as shown in figure below.
4. In the Point Group Properties dialog, use the Point label style pull-down list to choose
Point#-Elevation-Description as indicated in the figure below.
5. Click OK (all points will be displayed with their label in your screen as shown in the figure
below).

Training manual on Autocad Civil 3D
~ 16 ~
2.4 Changing the style, size and item to be displayed in Points Groups
I. To edit the size of points (elevation, description and symbol)
1. Expand the (+) sign of Point Groups and Right click _ All points under Point Group & Click
Properites (the Point Group Properites dialog will appear as shown in the figure below).
All of the points in the
drawing now have the
Point#-Elevation-Description
label style assigned
To change the display of
point, right click the _All
points and choose the
Properties and select point
style and point label style
which you to want display in
your screen.
Training manual on Autocad Civil 3D
~ 17 ~
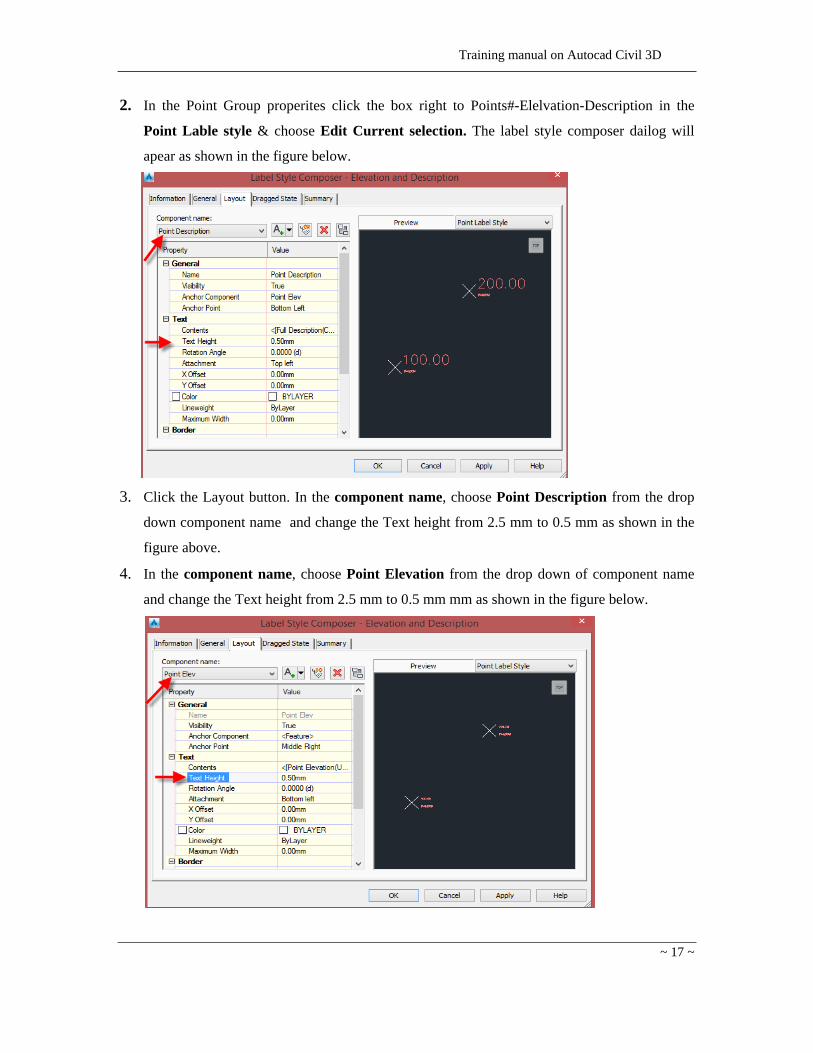
2. In the Point Group properites click the box right to Points#-Elelvation-Description in the
Point Lable style & choose Edit Current selection. The label style composer dailog will
apear as shown in the figure below.
3. Click the Layout button. In the component name, choose Point Description from the drop
down component name and change the Text height from 2.5 mm to 0.5 mm as shown in the
figure above.
4. In the component name, choose Point Elevation from the drop down of component name
and change the Text height from 2.5 mm to 0.5 mm mm as shown in the figure below.

Training manual on Autocad Civil 3D
~ 18 ~
5. Click Apply and OK (see the size of the text and elevation will be adjusted automatically in
your screen).
II. To change symbol of the point and size
1. Expand the (+) sign of Point Groups and Right click _ All points under point group and
Click Properites.
2. In the Point Groups properites click the box right to Basic in the Point style & choose Edit
Current selection.
3. Choose Marker in the point style dailog as shown in the figure below.
4. Change the symbol from x to + and change the size using the drop down in the Option as
shown in the figure above.
5. Click Apply and OK (Notcie that the symbol type and size is changed in your screen).

Training manual on Autocad Civil 3D
~ 19 ~
3 Surface
A surface is a three-dimensional geometric representation of an area of land, or, in the case of
volume surfaces, is a difference or composite between two surface areas.
Types of Surfaces
AutoCAD Civil 3D supports several types of surfaces:
TIN surfaces. Formed by triangulating an arbitrary set of points.
Grid surfaces. Formed from points that lie on a regular grid (for example, Digital
Elevation Models (DEMs)).
TIN volume surfaces. A composite surface created from a combination of points in a
top (comparison) and base surface, also known as a differential surface.
Grid volume surfaces. A differential surface based on user-specified top and bottom
surfaces with points on a user-specified grid.
3.1 Creating the survey surface (creating a TIN surface)
A TIN surface comprises the triangles that form a triangulated irregular network. TIN lines form
the triangles that make up the surface triangulation. To create TIN lines, AutoCAD Civil 3D
connects the surface points that are closest together. The elevation of any point in the surface is
defined by interpolating the elevations of the vertices of the triangles that the point lies in.
To Create a Surface:
1. On the Prospectorer tab of the Tool space, right-click on Surface and select Create Surface
as shown in the figure below.

Training manual on Autocad Civil 3D
~ 20 ~
(the Create Surface dailog will appear as shown in the figure below). Here you can specify the
name, description, default contour style and render material for your surface in next steps.
2. Confrm that TIN surface is selected as Type.
3. Click the Surface right to the Names. Click the symbol in the information box right to the
name and enter the the name, in this excercise Inchatamp as shown in the figure below.

Training manual on Autocad Civil 3D
~ 21 ~
4. Select the style for Borders and Contours
Click at the right corner of the style in the Create Surface as shown in figure below.
Choose 1m and 5 m contour background from the drop down as shown in the figure
below and click OK.
Click at the right corner of Render material and Click Cancel as shown in figure
below and click OK.
5. Confirm the surface layer is set to C-Topo (By default, a new surface layer will be created
win the name of C-Topo).
6. Click OK to close the Create Surface dialog.
Training manual on Autocad Civil 3D
~ 22 ~
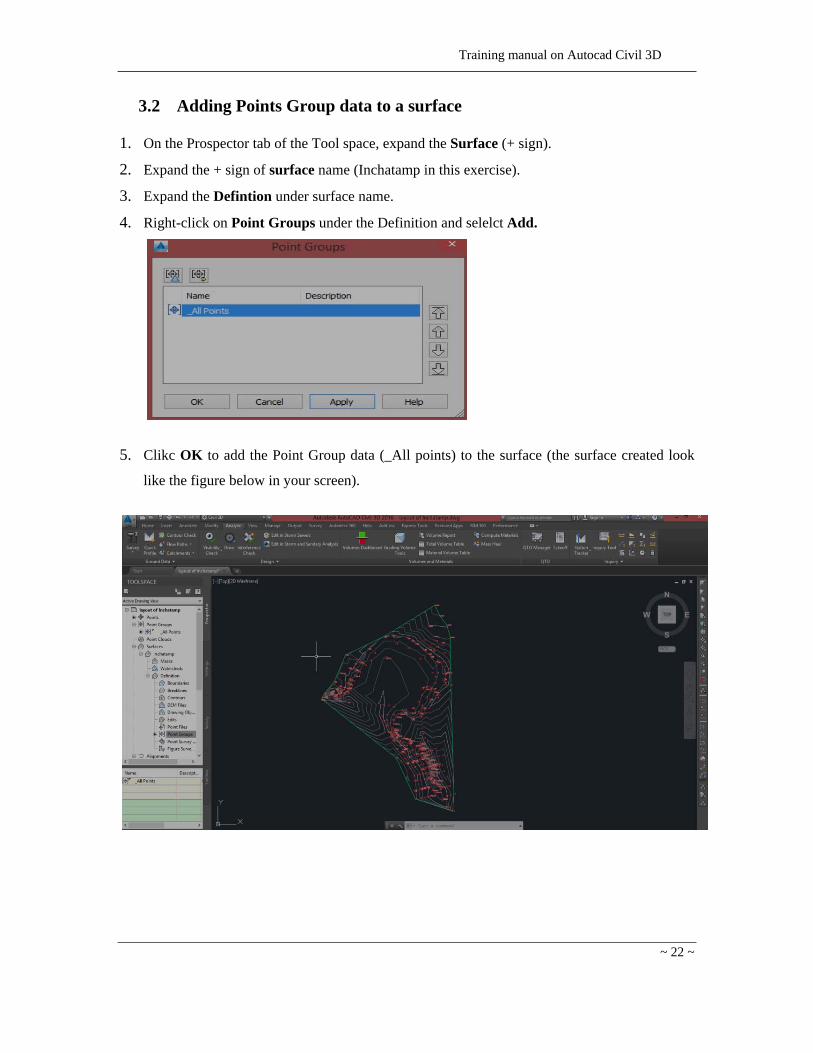
3.2 Adding Points Group data to a surface
1. On the Prospector tab of the Tool space, expand the Surface (+ sign).
2. Expand the + sign of surface name (Inchatamp in this exercise).
3. Expand the Defintion under surface name.
4. Right-click on Point Groups under the Definition and selelct Add.
5. Clikc OK to add the Point Group data (_All points) to the surface (the surface created look
like the figure below in your screen).

Training manual on Autocad Civil 3D
~ 23 ~
3.3 Editing surface style (contour interval)
1. Right-click the Surface name (in this excercise Inchatamp) and click Edit surface style. The
surface Style dialog will appear as shown in the figure below.
2. On the Surface Style dialog, click Contour and Expand the plus (+) sign on the contour
interval as shown in the above figure.
3. Adjust the minor contour interval (change the value of minor contour interval to 0.5 m for
this exercise.) The major contour interval will be automatically adjusted.
4. Click OK (look at your screen that both minor and major contour interval is changed).
Representing the surface
I. Contour and triangles
Examine the triangulation used to create the surface.
On the Prospector tab of the Tool space, expand on the surface and right-click on the surface
name (Inchatamp in this exercise) and select Surface Properties.
Choose contour and triangles from surface style drop down. The screen now shows how the
surface created and every triangulation calculation between the survey points as shown in the
figure below. The more dense the web, the more dense number of survey points.

Training manual on Autocad Civil 3D
~ 24 ~
II. Raster representation (Elevating and slope Banding)
On the Prospector tab of the Tool space, expand on the surface and right-click on the surface
name (Inchatamp in this exercise) and select Surface Properties.
Select Elevation Banding (2D) in the surface style window and click Apply. Auotcad will
display a colourful representation of your surface as shown in the figure below on the left side.
We expect the red areas are the lowest elevation and blue areas are higher elevation. The same
procedure can be used for representing slope banding as shown in the figure below on the right
side.

Training manual on Autocad Civil 3D
~ 25 ~
3.4 Working with surface boundary
Boundaries are closed polylines that affect the visibility of the triangles either inside or outside
the polylines. An outer boundary defines the extents of the surface. All triangles inside the
boundary are visible, and all triangles that are outside the boundary are invisible. Areas hidden by
boundaries are not included in calculations, such as total area and volume. There are a number of
reasons to use boundaries when building surfaces. The obvious use (and the one covered in this
exercise) is to limit the location of data and the triangles that connect the surface. Other uses can
be to divide a surface along a phase line, to hide a building pad from surface analysis, or to show
interior surface data that might be considered an island.
Before proceeding to Add boundary exercise, undo the changes made in representing the surface
in the previous exercise until your screen back to where you edit/adjust the contour interval.
To add boundary line to the surface
1. First Create the boundary line using polyline (the polygon as shown in yellow line in the case
of Inchatamp which shows the extent of the area to be used for design of headwork and main
canal).
N.B For this excerise, Launch the AutoCad program and open Inchatamp final drawing
you’re your working directory. Copy the polyline representing the boundary line and past to
the orginal coordinate in Civil3D interface as shown in the figure below.
2. In the Prospector tab, Expand the + surface name (Inchamtam for this exercise) and the
Definition.
Training manual on Autocad Civil 3D
~ 26 ~
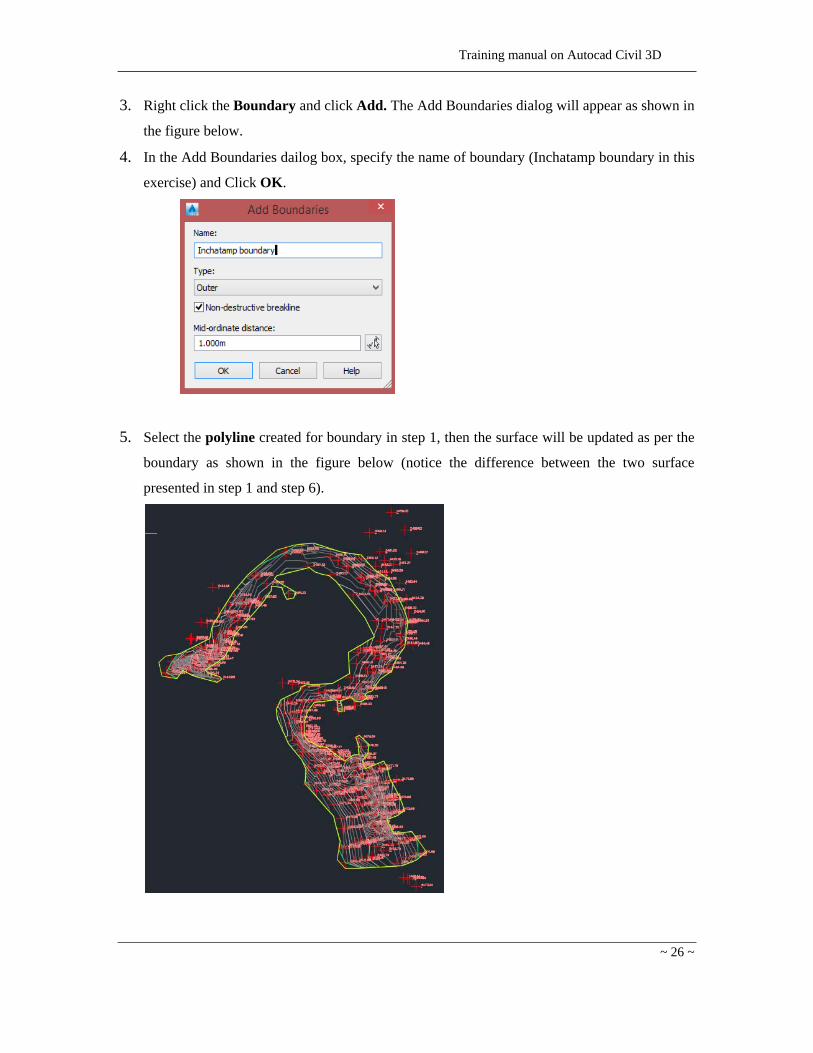
3. Right click the Boundary and click Add. The Add Boundaries dialog will appear as shown in
the figure below.
4. In the Add Boundaries dailog box, specify the name of boundary (Inchatamp boundary in this
exercise) and Click OK.
5. Select the polyline created for boundary in step 1, then the surface will be updated as per the
boundary as shown in the figure below (notice the difference between the two surface
presented in step 1 and step 6).

Training manual on Autocad Civil 3D
~ 27 ~
3.5 Labeling Contours
The contour in surface can be label in different ways. It can be label as contour - single, contour-
multiple or contour - multiple contour interval. Before preceding to the exercise, open Inchatamp
final Autocad drawing and copy the polyline representing the weir axis in blue line and paste to
the orginal coordinate in Civil 3D interface.
I. Labeling contour-single
1. From the Annotate tab and Labels & Tables panel on the ribbon, select Add Labels ➔
Surface ➔ Contour – Single.
2. Label the contour you want to label by clicking the contour in your desire location as shown
in figure below (in this exercise label the contour few meter u/s of the headwork axis).
NB. Before preceding to the next exercise, remove the contour-single by clicking undo button.
II. Labeling contour-multiple (option1)
1. From the Annotate tab and Labels & Tables panel on the ribbon, select Add Labels ➔
Surface ➔ Contour – multiple.
2. Click a point in the left side (above the weir axis in this exercise) and move the mouse to the
right side. You will see that a line follows your mouse. All contours that intersect this line
will be labeled as shown in figure below.
Training manual on Autocad Civil 3D
~ 28 ~
Draw a polyline to use as a guide for labeling contour-multiple (option 2)
1. On the command line, enter PLine.
2. When prompted for a start point, click in the left side (above the weir axis in this exercise)
and click in the right side (above the weir axis in this exercise).
3. Press Enter to end the PLine command.
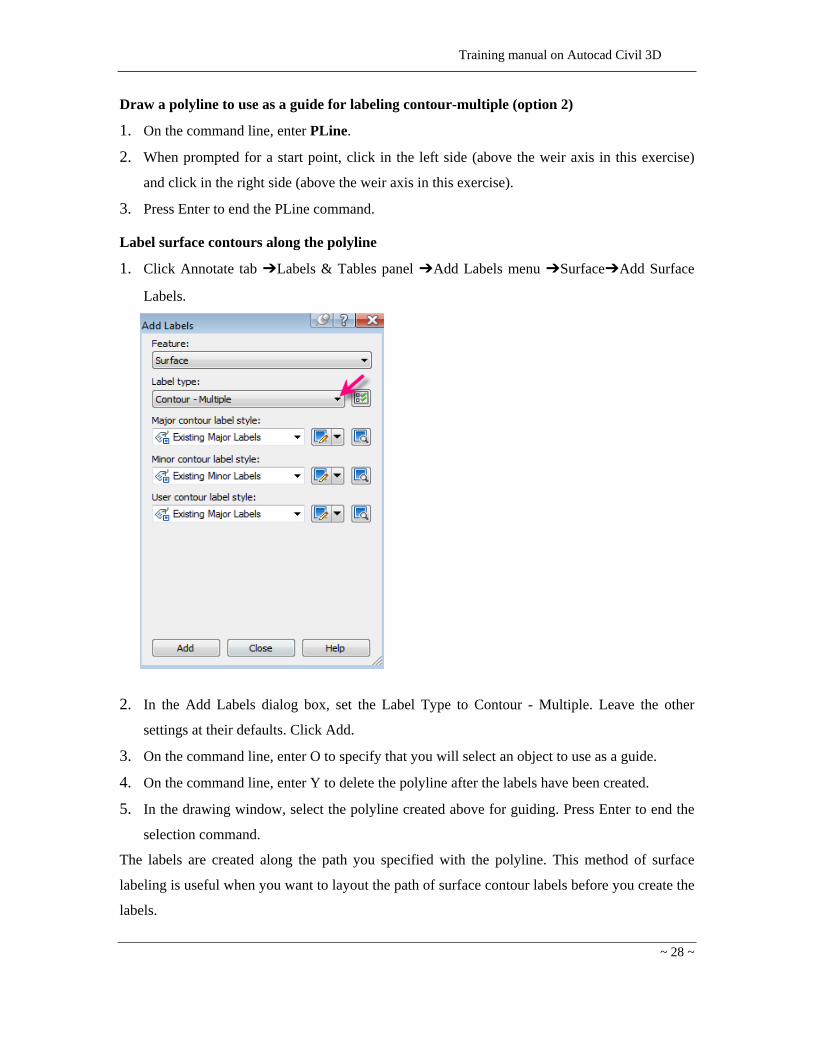
Label surface contours along the polyline
1. Click Annotate tab ➔Labels & Tables panel ➔Add Labels menu ➔Surface➔Add Surface
Labels.
2. In the Add Labels dialog box, set the Label Type to Contour - Multiple. Leave the other
settings at their defaults. Click Add.
3. On the command line, enter O to specify that you will select an object to use as a guide.
4. On the command line, enter Y to delete the polyline after the labels have been created.
5. In the drawing window, select the polyline created above for guiding. Press Enter to end the
selection command.
The labels are created along the path you specified with the polyline. This method of surface
labeling is useful when you want to layout the path of surface contour labels before you create the
labels.

Training manual on Autocad Civil 3D
~ 29 ~
Label surface contours along the polyline (labeling major contour interval only)
1. Click Annotate tab ➔Labels & Tables panel ➔Add Labels menu ➔Surface➔Add Surface
Labels.
2. In the Add Labels dialog box, set the Label Type to Contour – Multiple from label type drop
down list. Set Minor contour label style to none from minor contour label style drop down.
Click Add.
3. On the command line, enter O to specify that you will select an object to use as a guide.
4. On the command line, enter Y to delete the polyline after the labels have been created.
5. In the drawing window, select the polyline created above for guiding. Press Enter to end the
selection command.
The labels are created on the major contour interval along the path you specified with the polyline
as shown in the figure below.
Training manual on Autocad Civil 3D
~ 30 ~
If you wanted to create the path and labels simultaneously without first drawing a polyline, you
would click Annotate tab ➔Labels & Tables panel ➔Add Labels menu ➔Surface➔Contour -
Multiple, then draw the path as presented in option 1.
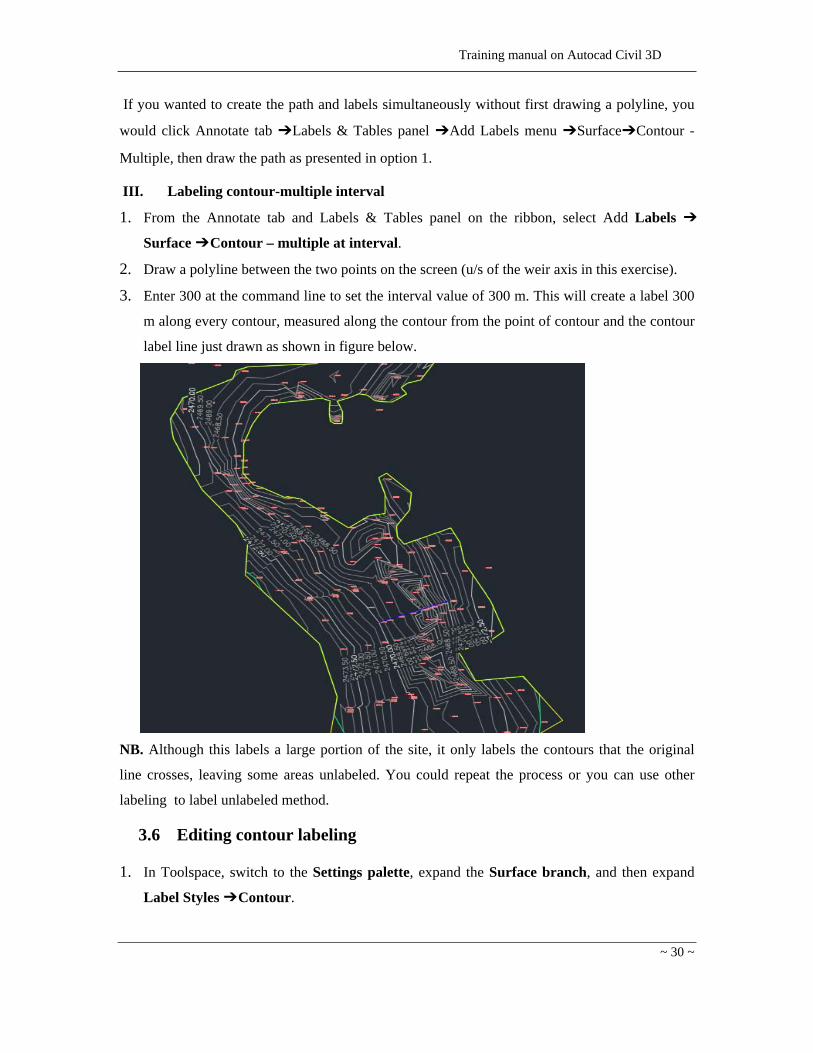
III. Labeling contour-multiple interval
1. From the Annotate tab and Labels & Tables panel on the ribbon, select Add Labels ➔
Surface ➔ Contour – multiple at interval.
2. Draw a polyline between the two points on the screen (u/s of the weir axis in this exercise).
3. Enter 300 at the command line to set the interval value of 300 m. This will create a label 300
m along every contour, measured along the contour from the point of contour and the contour
label line just drawn as shown in figure below.
NB. Although this labels a large portion of the site, it only labels the contours that the original
line crosses, leaving some areas unlabeled. You could repeat the process or you can use other
labeling to label unlabeled method.
3.6 Editing contour labeling
1. In Toolspace, switch to the Settings palette, expand the Surface branch, and then expand
Label Styles ➔ Contour.

Training manual on Autocad Civil 3D
~ 31 ~
2. Right-click Existing Major Labels and select Edit to display the Label Style Composer
dialog as shown in figure below.
3. Open the Layout tab.
4. Click the value cell in the content under text section. A small button will appear to the right
with an ellipsis (…) on it.
5. Click the ellipsis button (also referred to as the More button) to access the Text Component
Editor dialog shown in figure below.
Training manual on Autocad Civil 3D
~ 32 ~
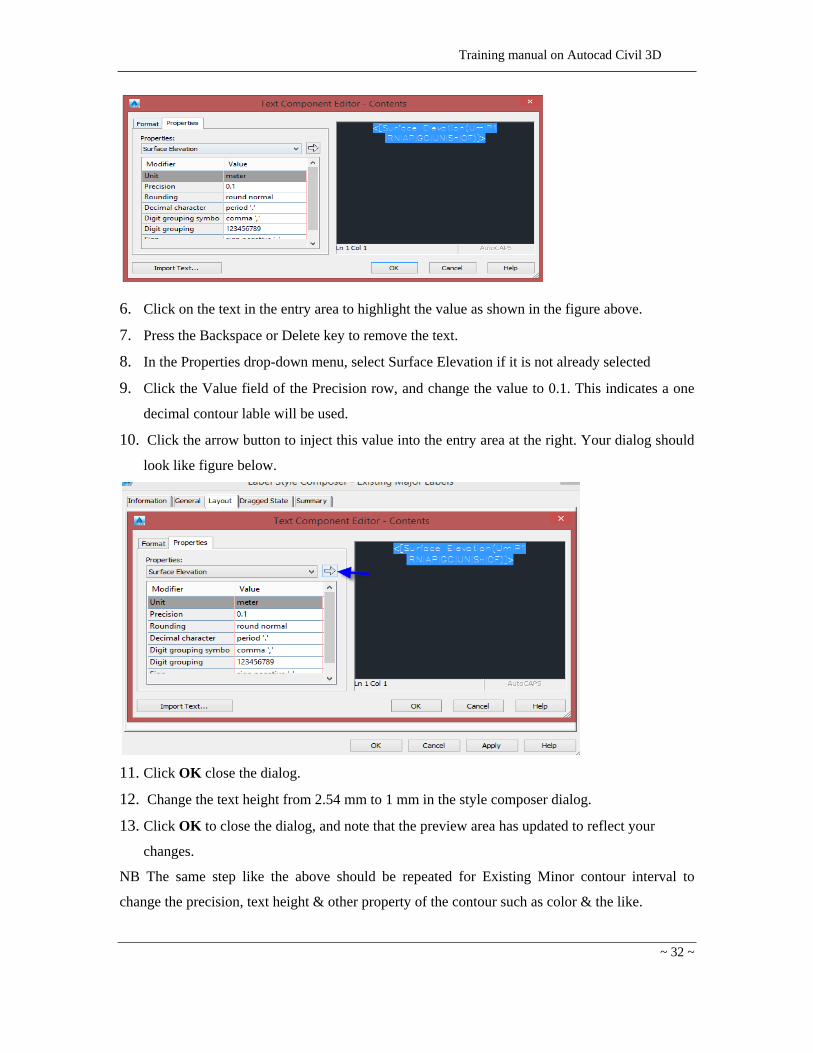
6. Click on the text in the entry area to highlight the value as shown in the figure above.
7. Press the Backspace or Delete key to remove the text.
8. In the Properties drop-down menu, select Surface Elevation if it is not already selected
9. Click the Value field of the Precision row, and change the value to 0.1. This indicates a one
decimal contour lable will be used.
10. Click the arrow button to inject this value into the entry area at the right. Your dialog should
look like figure below.
11. Click OK close the dialog.
12. Change the text height from 2.54 mm to 1 mm in the style composer dialog.
13. Click OK to close the dialog, and note that the preview area has updated to reflect your
changes.
NB The same step like the above should be repeated for Existing Minor contour interval to
change the precision, text height & other property of the contour such as color & the like.

Training manual on Autocad Civil 3D
~ 33 ~
4 Alignment
4.1 Overview of Alignment
Alignment objects can represent road centerlines, pipe networks, and other construction baselines.
Creating and defining a horizontal alignment is one of the first steps in roadway, railroad, or site
design. You can draw the alignment geometry as a polyline, and then create the named alignment
from that geometry. For greater control, you can create an alignment object using the Alignment
Layout Tools. You can also make edits to alignments using grips, or the commands on the
Alignment Layout Tools toolbar, while automatically maintaining tangency between the
alignment components.
When creating an alignment, assign it a type of centerline, offset, curb return, rail, or
miscellaneous. You can use these alignment types to categorize your data based on alignment
function. Select the centerline type for a road centerline/main canal centerline, the rail type for a
railway, or the miscellaneous type for other uses, such as a utility conduit. These types are
independent objects. Offset alignments and curb return alignments can also be independent, but
are often dynamically linked to other alignments. Both offset alignments and curb returns can be
created automatically as components of an intersection. Offsets can also be used in widenings.
Alignments are listed in either the Alignments collection or a Site collection in the Prospector tab.
From these collections, you can change alignment properties, generate reports, and export
LandXML.
4.2 Creating Alignment
The horizontal control of an alignment has some benefits beyond the simple geometry and
labeling. The main benefit is that the alignment object has the ability to understand the whole
piece instead of just being individual arcs and lines tied together. Alignments can be constructed
with relationships between the adjoining segments, so that a change in the properties of an arc
changes the length of a line tied to it or the direction of a spiral segment. These powerful
relationships are known as fixed, float, and free.
Fixed entities are independent of other segments in the alignment, fixed to the coordinate plane. A
fixed entity is typically a line based on a start point and distance and bearing, or an arc based on
three known points. This type of segment will not maintain tangency if the segments on either
side are moved or edited. Float entities have some measure of independence but are tied to one

Training manual on Autocad Civil 3D
~ 34 ~
other segment in a tangential relationship. This can be a line extending from the end of an arc in a
tangent direction for a given distance, or an arc coming from a line and passing through a given
point. If the attachment entity is edited in some way, a floating entity will adjust to maintain
tangency if at all possible.
Free entities are dependent on the segments before and after for their location. Think of a fillet
curve between two line pieces, or a tangent connecting two curves in an S-shape. These segments
will adjust and change as required to maintain the tangency on both connection points.
There are two main methods of creating alignments: converting from polylines and creating from
scratch, known as creating by Layout.
4.2.1 Creating Alignment from polyline
1. Preapre/draw a polyline where the aligmnet is proposed to be created (the polyline
representing the main canal alignment of Inchatamp as depicted in the blueline in the figure
below is used for this exercise).
Open the Inchatamp final autocad drawing from your working directory and then Copy the
blue colour polyline representing the main canal and Paste to the orginal coordinate in civil
3D interface (right-click on the screen➔ Clipboard➔ Paste to the orginal coordinate).
2. From the Home tab’s Create Design panel, select Alignment ➔ Create Alignment from
Objects.

Training manual on Autocad Civil 3D
~ 35 ~
3. Select the polyline representing the main canal aligmnent. At the Select lines/arcs or polylines
to create alignment: prompt, press Enter.
4. Notice the arrow graphic on the screen showing you the direction of the alignment. Note that
you can reverse the direction of the alignment by typing R for Reverse. At the Press enter to
accept alignment direction or [Reverse]: prompt, press Enter to accept the alignment
direction. The Create Alignment from Objects dialog appears as shown in the figure below.
5. In the Name area, enter the name of your alignment (main canal alignment for this
exercise), but leave the rest of the options alone or change according to your preference.
Training manual on Autocad Civil 3D
~ 36 ~
6. Click OK to dismiss the dialog and thus the main canal alignment is created in your screen.
Referring back to the figure the following should be noted in Create Alignment from Objects
dialog.
The Name and Description fields should be fairly self-explanatory. Descriptions become
more important as you begin modeling complex sites and have more alignments to
manage. The Description field can be displayed as part of a label, so sometimes it can be
used for ancillary information such as road type, channel lining, or other information that
could be accessed handily.
The Type field allows you to further group your alignments. The type options are
Centerline, Offset, Curb Return, and Miscellaneous. The Centerline option might be used
for any type of centerlines, whether they are stream or canal. The Offset option might be
used for a stakeout of Building Setback lines. The Offset Curb option might be used for
curb returns in an intersection. The Miscellaneous option can be used if none of the other
categories fit your design. Note that you do not have to use these options explicitly for
centerlines, offsets, or curb returns. They are merely provided to assist you with grouping
similar alignments.
The Starting Station field allows you to set the beginning station of the alignment to be
created. Most users will leave this value at 0+00, but many sewer systems are laid out
with 1+00 as the starting point to allow for some modifications later without a change in
the stationing through the line.
There are two tabs on the Create Alignment dialog: General and Design Criteria. The General tab
handles alignment properties that are general to all alignments, and the Design Criteria tab is
focused on transportation- and infrastructure-based uses.
The General tab includes the following settings:
The Site setting controls which Civil 3D site an alignment will be contained within Most
alignments are best stored in the <None> site as shown in figure above.
Alignment Style controls the display of the actual alignment object in Plan, Model, and
Section views. This style also controls the appearance of any markers at the beginning, end,
or intermittent geometry points along the alignment.
Alignment Layer controls what layer the alignment object itself will be placed on. If you
think of alignments as nested blocks, it’s easier. The object will reside on this layer, but the
subcomponents (lines, arc, spirals, and so on) will be display controlled by the style settings.

Training manual on Autocad Civil 3D
~ 37 ~
An alignment label set is a collection of label styles that are applied to an alignment at
creation. These can include labels at the beginning and end, at PC or PT points, and at vertical
data points such as a High Point or a Superelevation Critical point.
The Add Curves Between Tangents option enables you to add filleted arcs between lines
when the polyline has not had arcs placed in it. These arcs are free arcs as per the preceding
definition, dependent on the tangent lines before and after for their location.
Erase Existing Entities simply erases the polyline being converted from the drawing when the
conversion is complete
On the Design Criteria tab, there are essentially two options in play: Criteria-Based Design and
Design Check Sets. Criteria-Based Design takes the user input of a design speed, compares it with
a design criteria file based on AASHTO specifications, and sets some design parameters for the
alignment to be created. Design Check Sets allow you to specify design values, such as Minimum
Radius or Minimum Tangent Length, and will warn you when these values are violated. Again,
this tab is focused heavily on the large transportation market, and many Civil 3D users are happy
to ignore it entirely.
4.2.2 Creating an alignment with the Alignment Layout Tools
When creating alignments by layout, there are many more options to consider. Spirals cannot be
drawn at all with polylines, and laying out an alignment piece by piece gives you the ability to
control and drive the tangencies of your design.
To Create an Alignment Using the Alignment Layout Tools
1. Click Home tab➔ Create Design panel➔Alignment drop-down➔ Alignment Creation Tools.
Training manual on Autocad Civil 3D
~ 38 ~
2. In the Create Alignment - Layout dialog box, enter a unique name for the alignment.
3. Specify the alignment Type.
4. Enter an optional description.
5. Enter a starting station value.
6. On the General tab, specify the following settings:
Site: Specify a site with which to associate the alignment or accept the default <None>.
Alignment Style
Alignment Layer
Alignment Label Set
7. On the Design Criteria tab, specify a Starting Design Speed to apply to the alignment starting
station. This design speed is applied to the entire alignment. Additional design speeds can be
applied at other stations after the alignment has been created. If you do not want to apply
design criteria to the alignment, proceed to Step 8.
8. To associate design standards with the alignment, select the Use Criteria-Based Design check
box.
On the Design Criteria tab, specify the following settings:
Use Design Criteria File. Select this check box to associate a design criteria file with the
alignment. The default design criteria file location and the Default Criteria properties
becomes available when you select the check box.
Use Design Check Set. Select this check box to associate a design check set with the
alignment. The design check set list becomes available when you select the check box.
Select a design check set from the list.
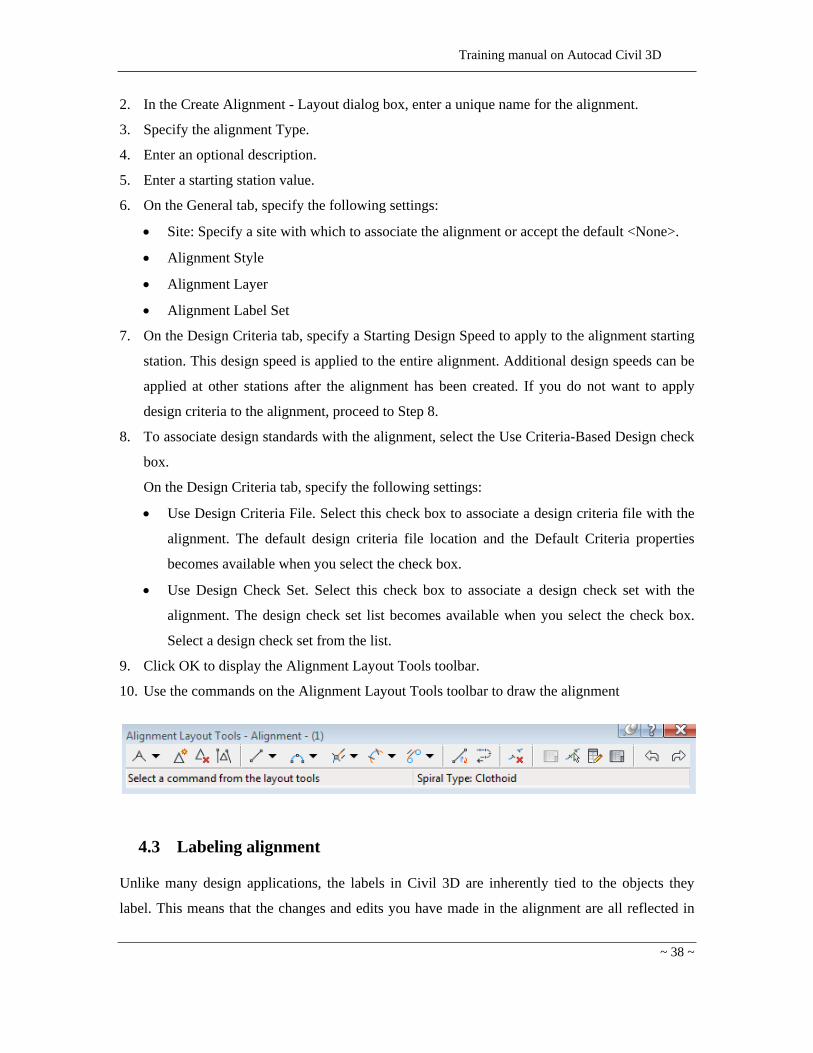
9. Click OK to display the Alignment Layout Tools toolbar.
10. Use the commands on the Alignment Layout Tools toolbar to draw the alignment
4.3 Labeling alignment
Unlike many design applications, the labels in Civil 3D are inherently tied to the objects they
label. This means that the changes and edits you have made in the alignment are all reflected in
Training manual on Autocad Civil 3D
~ 39 ~
the alignment labeling. There are three major label types related to Alignment: stationing,
segment, and station-offset. Station labeling will be explored in the following section.
Stationing
Almost every designer has stationed a road or canal. With Civil 3D, stationing refers not only to
the station values, but also to other labels that are dependent on the alignment (and associated
profile) geometry. The options for labeling points in an alignment are as follows:
Major Station
Minor Station
Geometry Point
Profile Geometry Point
Station Equation
Design Speed
Superelevation Critical Points
1. Select the carson circle alignment (activate the main canal alignment in your screen).
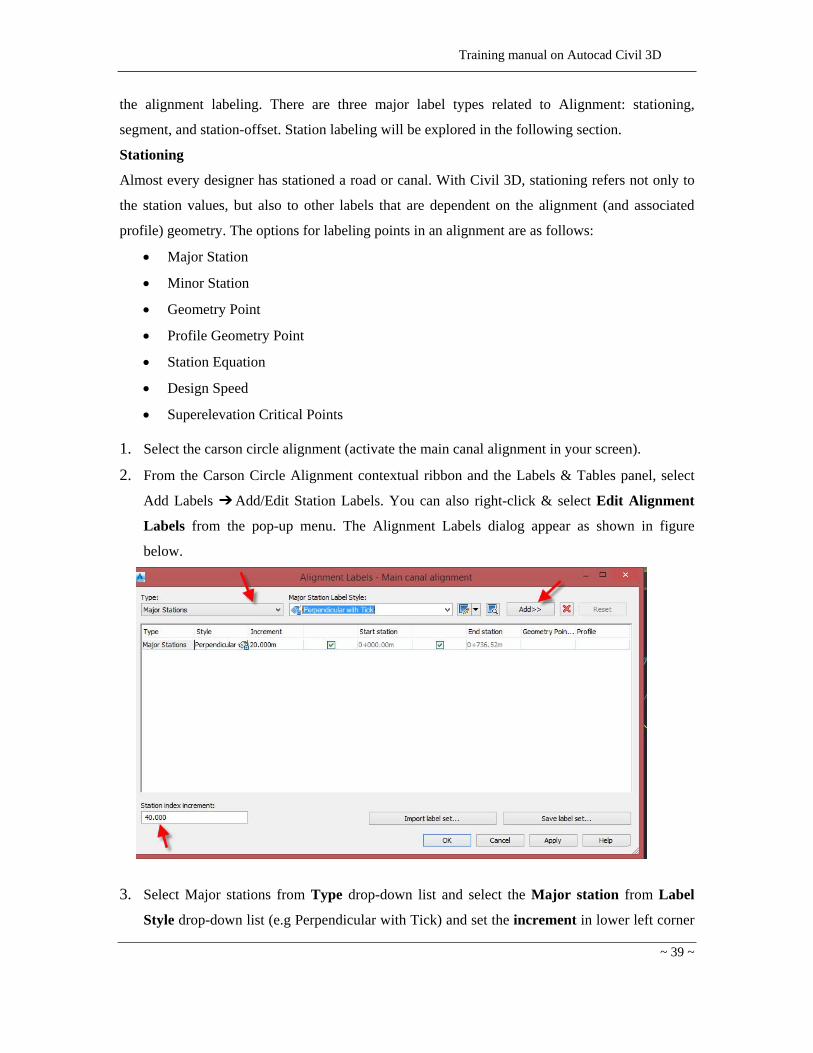
2. From the Carson Circle Alignment contextual ribbon and the Labels & Tables panel, select
Add Labels ➔ Add/Edit Station Labels. You can also right-click & select Edit Alignment
Labels from the pop-up menu. The Alignment Labels dialog appear as shown in figure
below.
3. Select Major stations from Type drop-down list and select the Major station from Label
Style drop-down list (e.g Perpendicular with Tick) and set the increment in lower left corner
Training manual on Autocad Civil 3D
~ 40 ~
for station index increment (40 m for this exercise) & click the Add >> button to add that
label to the alignment.
4. Select the Minor stations from the Type drop down list and select the Minor station style
(e.g Ticks) from the Minor stations Label style and set the increment (20 m for this
exercise) and then click the Add >> button to add that label to the alignment.
5. Click OK to dismiss the dialog and update the carson Circle Alignment.
Notice that the staion is labeled in your screen.
Segment Labeling
It is a common requirement that labels on alignments assist in the layout of the alignment
geometry in the field. To that end, individual segments can be labeled with the necessary
information such as distance and bearing, or chord bearing, radius, and other curve information.
Many Civil 3D users also use segment labels to place street names in their drawings.
To Label the segment
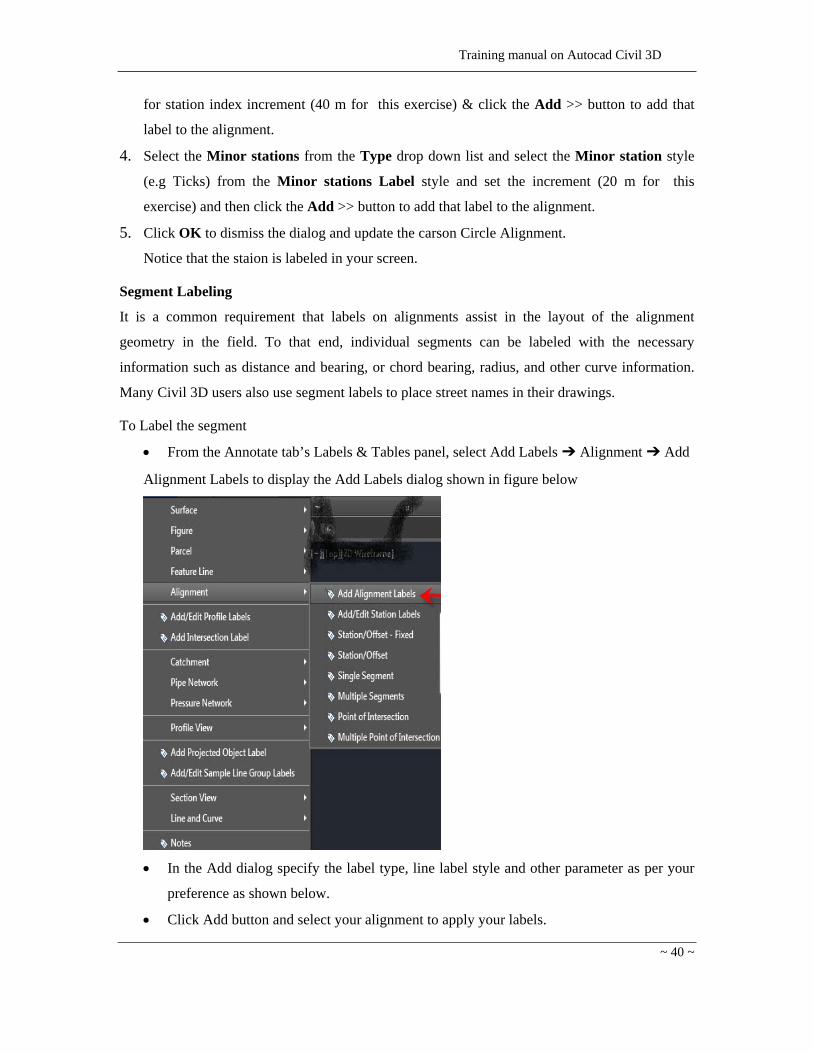
From the Annotate tab’s Labels & Tables panel, select Add Labels ➔ Alignment ➔ Add
Alignment Labels to display the Add Labels dialog shown in figure below
In the Add dialog specify the label type, line label style and other parameter as per your
preference as shown below.
Click Add button and select your alignment to apply your labels.

Training manual on Autocad Civil 3D
~ 41 ~
Using Station-Offset Labels
The last major type of label in the alignment family is a station-offset label. Some examples
of these labels are calling out curb returns, the locations of curb inlets, and street lights, or for
placing trees along a path.
To create station-offset label
From the Annotate tab and Labels & Tables panel on the ribbon, select Add Labels ➔
Alignments ➔ Add Alignment Labels to display the Add Labels dialog.
Change the Station Offset Label Style drop-down list to Station and Offset.
Change the Marker Style to your preference say, Basic X.
Click Add, and Civil 3D will prompt you at the command line to select an alignment.
Pick the Marie Court alignment to activate it.
Training manual on Autocad Civil 3D
~ 42 ~
5 Profile and Profile View
5.1 Understanding profile
The vertical component of land developments is generally controlled by one of two Civil 3D
features: surfaces or profiles. Surfaces cover the land-like sheets, defining vertical data as
connections between points. Profiles handle vertical data as linear functions: a pair of station and
elevation coordinates. Profiles define the model by providing the z-value, and an alignment
provides the x- and y-values.
To Civil 3D, a profile is simply a list of coordinates - a station and elevation pair that make up
vertical data along some alignment. The profile view comprises the grid, titles, labels, and data
bands that display that information to you as a Civil 3D user. These two are intertwined, but you
can show the same profile in multiple profile views with widely different settings for styles and
labels to create a completely different representation of the same data. The two main types of
profiles: surface profiles and layout profiles.
The main purpose of a profile is to show surface elevations along a horizontal alignment. Use
profiles to visualize the terrain along a route of interest or across a particular region.
There are several types of profiles: surface profiles, layout profiles, superimposed profiles, quick
profiles, and corridor profiles.
A surface profile - often called an existing ground (EG) profile - is extracted from a
surface, showing the changes in elevation along a particular route.
A layout profile, by contrast, is a designed object that shows the proposed elevation
changes to be constructed. The layout profile - often called a design profile or finished
grade (FG) profile - is typically used for a roadway or other graded site.
A superimposed profile is a profile of an alignment superimposed onto profile views of
different alignments. These profiles are always dynamic and update when changes are
made in the originating profile/alignment. A quick profile is a temporary object that
shows the elevations along any existing line or series of selected points.
A corridor profile is created from a corridor feature line, such as an edge of pavement.
This profile is displayed on the profile view of the baseline alignment from which it is
derived.

Training manual on Autocad Civil 3D
~ 43 ~
5.2 Creating Surface profile
A surface profile is extracted from a surface, and is often called an existing ground profile. It is
displayed on a graph called a profile view. Each profile view is associated with a single horizontal
alignment, but it can display multiple surfaces and offset profiles from that alignment. Surface
profiles are dynamically linked to both the surface and the parent alignment in Civil 3D, meaning
that a change in either source data will force to a change to the profile data.
1. From the Home tab and Create Design panel on the ribbon, select Profile ➔ Create
Surface Profile to display the Create Profile from Surface dialog shown below.
Thus the Create profile from surface dialog appear as shown below.

Training manual on Autocad Civil 3D
~ 44 ~
2. Change the Alignment drop-down list to the name of alignment where the surface profile is
proposed to be prepared from Alignment drop down list (in this exercise main canal
alignment). Notice how the Station Range area displays information about the selected
alignment. You can also use the station boxes here to sample a limited range of stations along
an alignment if you would like.
3. Click the Add >> button at mid-right, and the Existing Ground (1) - Surface (1) profile (in
this exercise Inchatamp-surface) will be added to the Profile List area as shown in figure
above.
At this stage you’ve just completed sampling your first profile. Remember, profile data and
profile views are not the same thing. To actually display this data in a form that makes sense,
you need to draw in a profile view. You’ll do that next.
4. Click the Draw in Profile View button at the bottom of the dialog to close it and open the
Create Profile View Wizard shown in figure below.
This is considered a wizard because it steps you through a number of different options in a
linear fashion. Although you can jump from step to step using the links on the left of the
dialog, you should follow the steps until you’re more familiar with all of the options
available. You’ll generally accept the defaults, but walking through the wizard gives you a
chance to see the location of many settings.
5. In the General step, change the profile view name to main canal profile and accept the other
default values and click Next.
6. The Station Range step allows you to show a limited portion of the profiles if desired. Make
sure the Automatic radio button is selected and click Next.

Training manual on Autocad Civil 3D
~ 45 ~
7. The Profile View Height step allows you to specify a specific height for your view, or to
split views that have large vertical displacements so that they fit better into your sheet. Verify
that the Automatic option is selected and click Next.
8. The Profile Display Options step allows you to select label sets for profiles, select whether
or not to draw a profile on a given profile view, select a profile to use for grid clipping, and a
number of other options that make it easy to get just the view you’d like. You’re drawing a
simple surface profile, so click Next to bypass the Pipe Network display (since there are no
pipes in this drawing) and move to the Data Bands tab.
9. Data Bands are strips of data oriented along the top or bottom of a profile (or section) view
that display relevant information based on the profile data at that station. They can be used to
display two different surface elevations desired intervals, or to display the depth of a design
profile, or to display the general shape of the horizontal geometry at that location. When you
are creating the initial profile view, there is usually one profile. In this case, the wizard
assigns the surface profile to Profile 1 and Profile 2. When you are defining the second
profile, you must change change Profile2’ assignment to the new profile. Click Next.
10. The Profile Hatch Options step allows you to hatch areas of cut/fill, handle multiple
boundaries on the profile, and perform take-off hatching. This allows better presentation of
this profile. Examine the options, but do not make any changes. When you are done, click the
Create Profile View button to dismiss the wizard.
11. Pick a point in your drawing window where you want the profile vew to be drawn. The
profile view will be drawn in your screen as shown in figure below.
5.3 Creating a layout profile
Create layout profiles to represent designed elevations along an alignment.
You typically draw a layout profile on the grid of a profile view, using the surface profile as a
guide. A profile view grid must exist in the drawing to use this command. Create curves and
tangents by freehand sketching or by entering numeric values. You can create a layout profile
with tangents, and then optionally add curves at the points of vertical intersection (PVI). You can

Training manual on Autocad Civil 3D
~ 46 ~
create a profile from an external ASCII file that contains a series of stations along an alignment,
the elevation of each station, and optionally, the length of curve at the station.
Curve attributes are set by the Curve Settings command. These curves maintain tangency when
edited.
Several methods are available for drawing a layout profile:
Use the Draw Tangents command to specify points of vertical intersection (PVIs) for
a series of straight tangents. Later you can add free curves with specific parameters
between the tangents.
Use the Draw Tangents With Curves command to specify PVIs for the tangents,
automatically creating curves between the tangents using the parameters you specify in
the Vertical Curve Settings Dialog Box.
Use the constraint-based profile design commands to create a profile one sub-entity at a
time.
When you are prompted for point locations, you can use the Transparent Commands to specify
points in the profile.
To create a layout profile
1. Click Home tab ➤ Create Design panel ➤ Profile drop-down ➤ Profile Creation Tools.
2. Click the profile view in which to draw the layout profile.
3. In the Create Profile - Draw New dialog box (figure below), enter a unique Name for the
profile. Optionally, enter a Description.
4. On the General tab, specify the following settings:
Profile Style
Profile Layer
Profile Label Set

Training manual on Autocad Civil 3D
~ 47 ~
NOTE If you do not want to apply design criteria to the profile, proceed to step 6.
5. If you would like to associate design standards with the profile, on the Design Criteria tab,
select the Use Criteria-Based Design check box.
On the Design Criteria tab, specify the following settings:
Use Design Criteria File
Select this check box to associate a design criteria file with the profile. The default design
criteria file location and the Default Criteria properties becomes available when you
select the check box.
Use Design Check Set
Select this check box to associate a design check set with the profile. The design check
set list becomes available when you select the check box. Select a design check set from
the list.

Training manual on Autocad Civil 3D
~ 48 ~
6. Click OK to display the Profile Layout Tools toolbar as shown in the figure below.
7. Use the commands on the Profile Layout Tools toolbar to draw the profile.
You can use any of the following methods to lay out a profile:
Use the Draw Tangents command to specify points of vertical intersection (PVIs) for
the tangents, and then add free curves with specific parameters between the tangents.
Use the Draw Tangents With Curves command to specify PVIs for the tangents,
automatically creating curves between the tangents using the parameters you specify in
the Vertical Curve Settings dialog box.
Use various Profile Layout Tools to create separate entities and then join them together.
TIP. When you are prompted for point locations, you can use the Transparent Commands to
specify points in the profile.
5.4 Creating profile from a file
Use profile files to record layout data for points of vertical intersection (PVIs) in a profile.
A profile file is a simple text file in ASCII format. The file contains a series of stations along an
alignment, the elevation of each station, and optionally, the length of curve at the station. Each
line can include up to three information elements, separated by spaces:
1. Station. An element required for each line. Plus characters (+) cannot be used.
2. Elevation. A required element.
3. Curve length. An optional element. However it cannot be used on the first or last line of the
file. All vertical curves must be parabolic.
Sample file lines
Training manual on Autocad Civil 3D
~ 49 ~
In this example, only the third and fifth PVIs include curves (lengths of 40.0 and 35.0). Use these
other format requirements for each profile file:
The first and last lines must not contain curve information.
The first line must provide the station and elevation for the first station.
Stations must be in ascending order.
No leading blank lines or headers.
No blank lines; a blank line is read as the end of the file.
No blank spaces at the beginning of any line.
The last item must be the elevation for the last station.
To create a profile from a profile file
1. Click Home tab ➤ Create Design panel ➤ Profile drop-down ➤ Create Profile From File.
2. Browse to the text file (a text file uses the .txt extension).
3. Click the text file and click Open. If the file is correctly formatted, it is read into the system
and then Create Profile - Draw New dialog box is displayed.
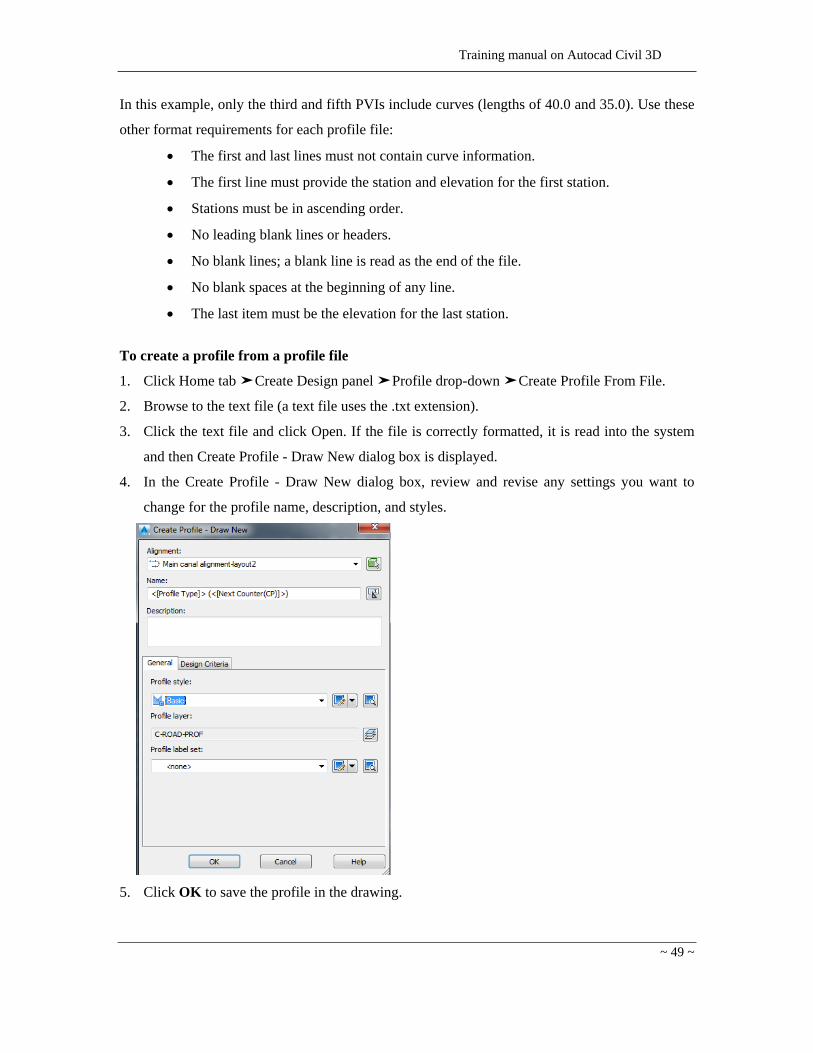
4. In the Create Profile - Draw New dialog box, review and revise any settings you want to
change for the profile name, description, and styles.
5. Click OK to save the profile in the drawing.
Training manual on Autocad Civil 3D
~ 50 ~
5.5 Quick Profile
If you select a polyline in a Civil 3D drawing and right-click, one of the shortcut menu options is
Quick Profile. Quick profiles give you the ability to get a look at your surfaces in a profile view
without creating an alignment, sampling the surface, and creating a view. They’re quick and easy,
and you’ll make explore in the following exercise.
1. Draw a line/polyline from point (1) to (2) (in this exercise draw a polyline in the weirr axis
from BM1 to BM2 as shown in blue line in the figure below.
2. Select this line and right-click to display the short cut menu. Select Quick profile to display
the Create Quick Profile dialog.
3. Click OK to dismiss the dialog.
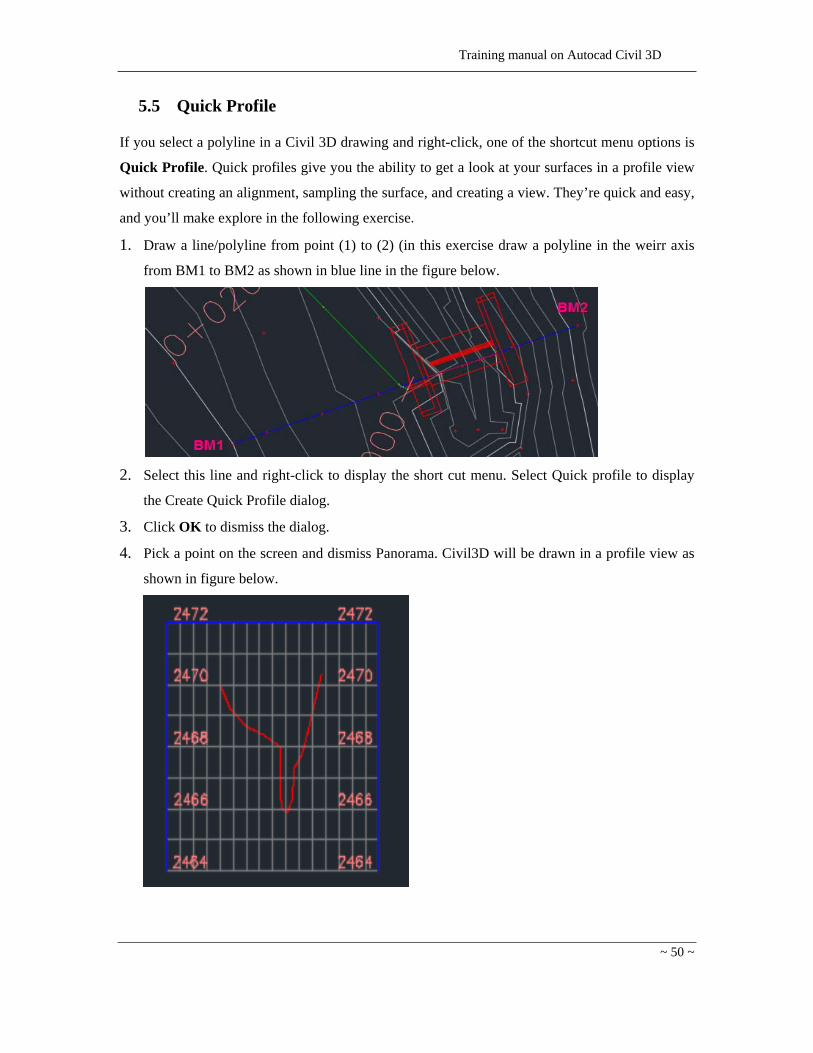
4. Pick a point on the screen and dismiss Panorama. Civil3D will be drawn in a profile view as
shown in figure below.

Training manual on Autocad Civil 3D
~ 51 ~
5.6 Getting profile data from Civil 3D
1. Click the profile (in this exercise the main canal alignment profile in civil 3D screen) as
shown in figure below.
2. Right Click and select Edit Profile Geometry (Profile Layout tools in this exercise
Inchatamp-Surface (1) will be displayed as shown in the figure below.
3. Click Profile Gird view as shown in the figure above. A table look like below will be
displayed in your screen as shown in the figure below.
NB PVI stands for point of vertical intersection
Training manual on Autocad Civil 3D
~ 52 ~
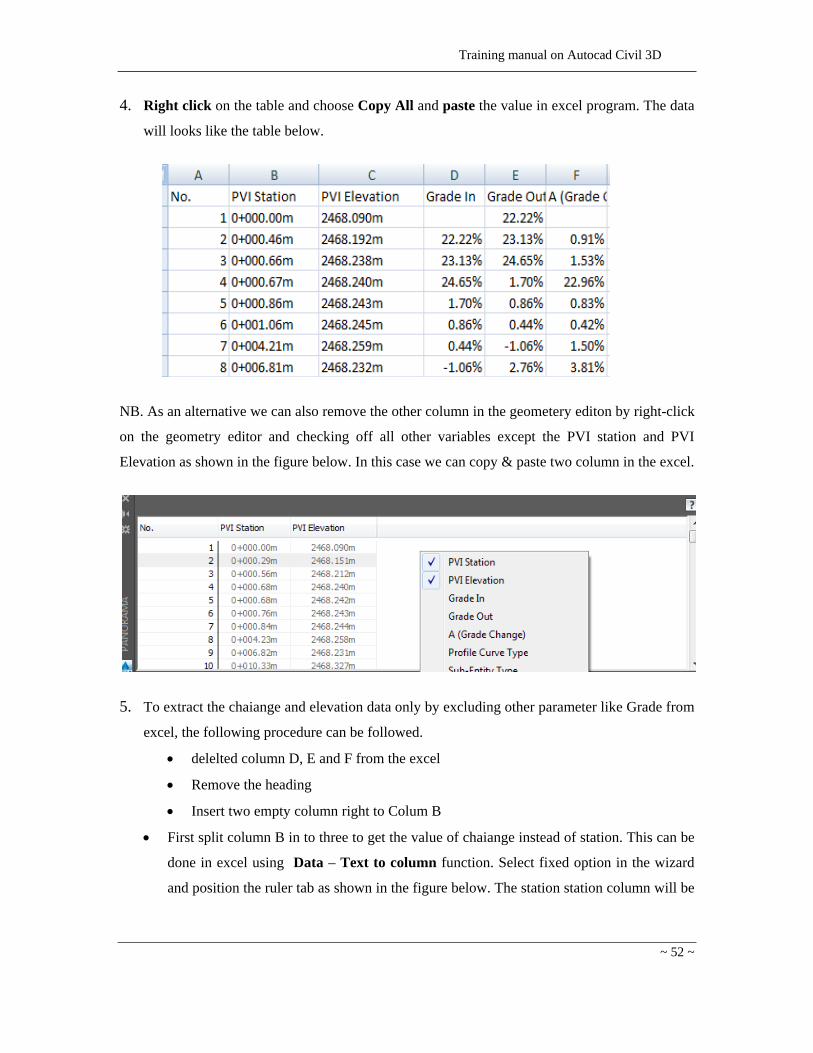
4. Right click on the table and choose Copy All and paste the value in excel program. The data
will looks like the table below.
NB. As an alternative we can also remove the other column in the geometery editon by right-click
on the geometry editor and checking off all other variables except the PVI station and PVI
Elevation as shown in the figure below. In this case we can copy & paste two column in the excel.
5. To extract the chaiange and elevation data only by excluding other parameter like Grade from
excel, the following procedure can be followed.
delelted column D, E and F from the excel
Remove the heading
Insert two empty column right to Colum B
First split column B in to three to get the value of chaiange instead of station. This can be
done in excel using Data – Text to column function. Select fixed option in the wizard
and position the ruler tab as shown in the figure below. The station station column will be

Training manual on Autocad Civil 3D
~ 53 ~
splitted in to 3 column and remove the first and third column by leaving second column
which contains the value of chainage only.
Insert one empty column right to colum C.
Split the elevation column in to two get the value of elevation by excluding the
symbol m using Data text to column function in excel.
Training manual on Autocad Civil 3D
~ 54 ~
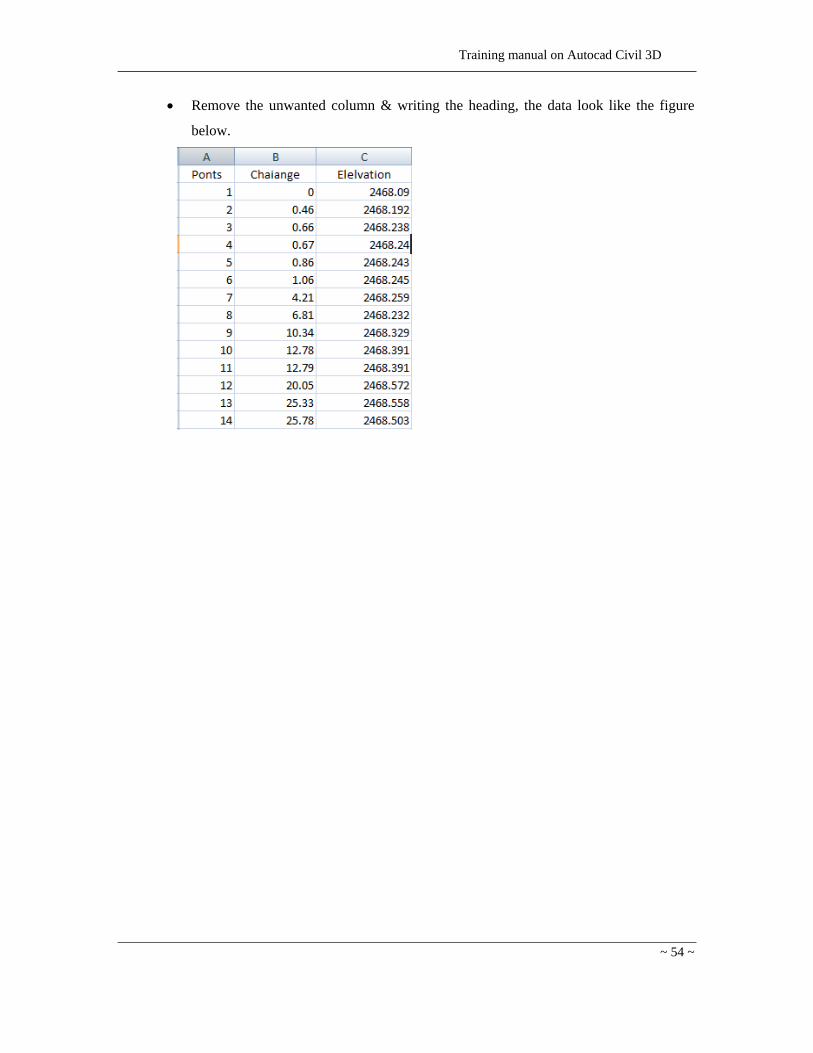
Remove the unwanted column & writing the heading, the data look like the figure
below.