Small Grains in 2017 - Virginia Tech · Small Grains in . 2017 . Table of ... 2017 harvest. Table...
97
2017 Virginia Tech CSES-198 Virginia Cooperative Extension programs and employment are open to all, regardless of age, color, disability, gender, gender identity, gender expression, national origin, political affiliation, race, religion, sexual orientation, genetic information, veteran status, or any other basis protected by law. An equal opportunity/affirmative action employer. Issued in furtherance of Cooperative Extension work, Virginia Polytechnic Institute and State University, Virginia State University, and the U.S. Department of Agriculture cooperating. Edwin J. Jones, Director, Virginia Cooperative Extension, Virginia Tech, Blacksburg; M. Ray McKinnie, Administrator, 1890 Extension Program, Virginia State University, Petersburg. Small Grains in 2017
Transcript of Small Grains in 2017 - Virginia Tech · Small Grains in . 2017 . Table of ... 2017 harvest. Table...
2017 Virginia Tech CSES-198Virginia Cooperative Extension programs and employment are open to all, regardless of age, color, disability, gender, gender identity, gender expression, national origin, political affiliation, race, religion, sexual orientation,
genetic information, veteran status, or any other basis protected by law. An equal opportunity/affirmative action employer. Issued in furtherance of Cooperative Extension work, Virginia Polytechnic Institute and State University, Virginia State University, and the U.S. Department of Agriculture cooperating. Edwin J. Jones, Director, Virginia Cooperative Extension, Virginia Tech, Blacksburg; M. Ray McKinnie, Administrator, 1890 Extension
Program, Virginia State University, Petersburg.
Small Grains in 2017
Table of Contents
Recommended Small Grain Varieties ........................................................................................................... 1
Barley and Wheat Entries .............................................................................................................................................. 4
Introduction ...................................................................................................................................................................................... 6
The Season ........................................................................................................................................................................................... 6
Section 1: Barley Varieties Discussion of barley varieties and summary of barley management practices for the ................................................. 8 2017 harvest season Table 1. Summary of performance of hulless entries in the Virginia Tech Barley Test ............................................ 12
over locations, 2017 harvest. Table 2. Two-year average summary of performance of hulless entries in the Virginia .......................................... 13
Tech Barley Tests, 2016 and 2017 harvests. Table 3. Three-year average summary of performance of hulless entries in the Virginia....................................... 14
Tech Barley Tests, 2015, 2016, and 2017 harvests. Table 4. Summary of performance of hulless entries in the Virginia Tech Barley Test ............................................ 15
planted at the Southern Piedmont AREC, Blackstone VA, 2017 harvest. Table 5. Summary of performance of hulless entries in the Virginia Tech Barley Test ............................................ 16
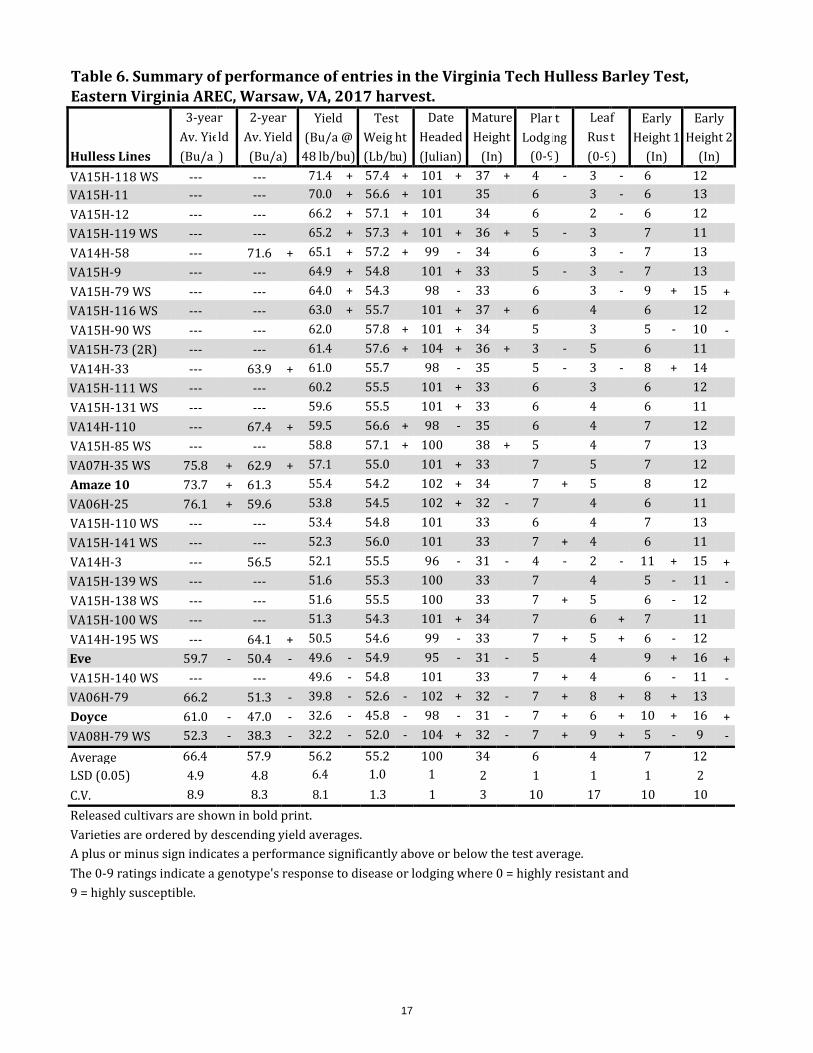
planted no-till at the Tidewater AREC, Holland VA, 2017 harvest. Table 6. Summary of performance of hulless entries in the Virginia Tech Barley Test, ........................................... 17
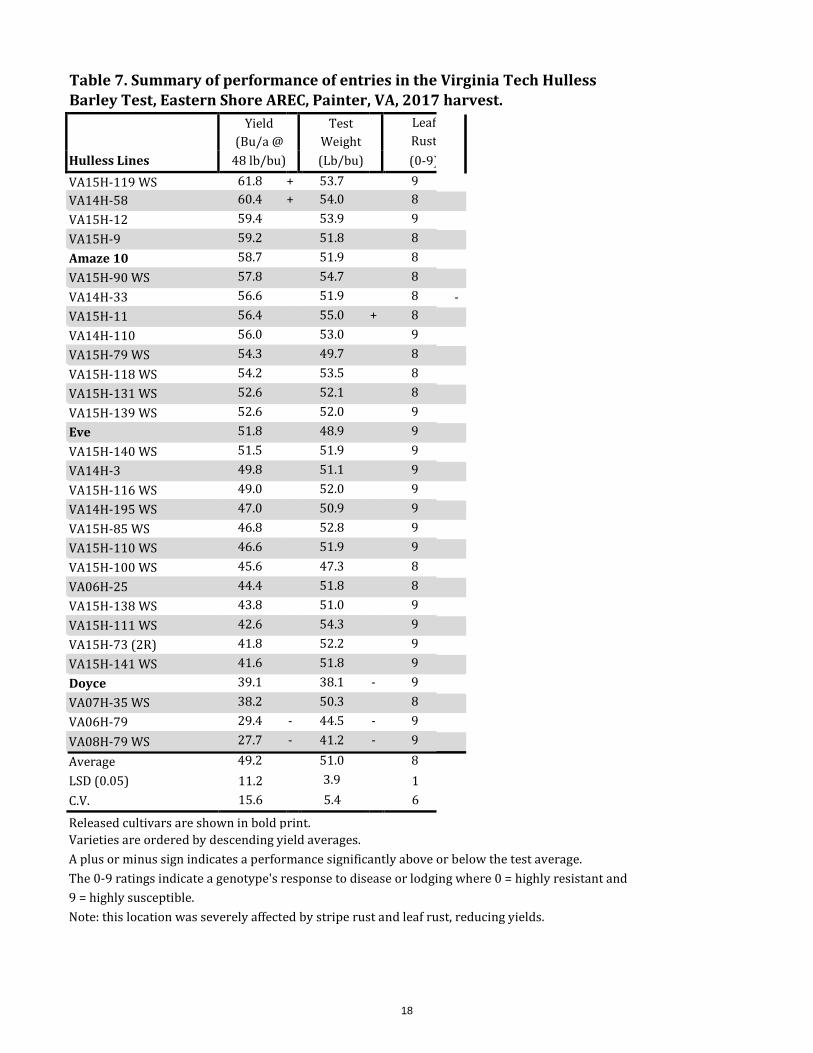
Eastern Virginia AREC, Warsaw, VA, 2017 harvest. Table 7. Summary of performance of hulless entries in the Virginia Tech Barley Test, ........................................... 18
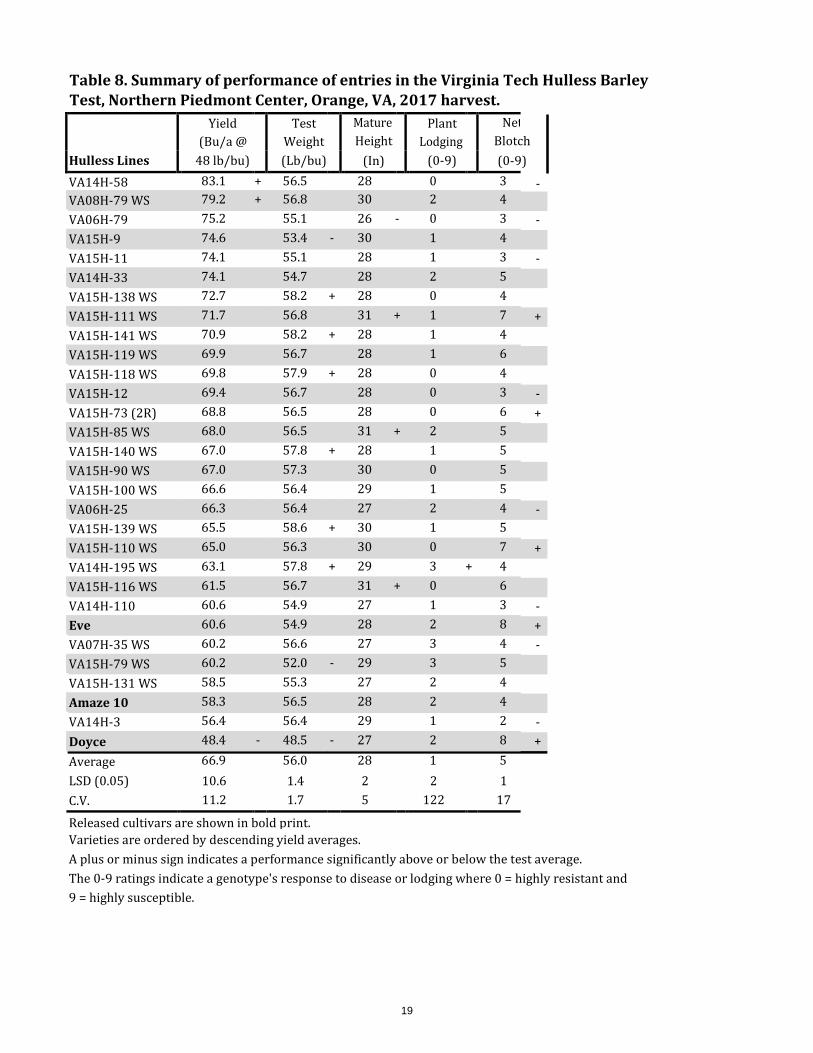
Eastern Shore AREC, Painter, VA, 2017 harvest. Table 8. Summary of performance of hulless entries in the Virginia Tech Barley Test, ........................................... 19
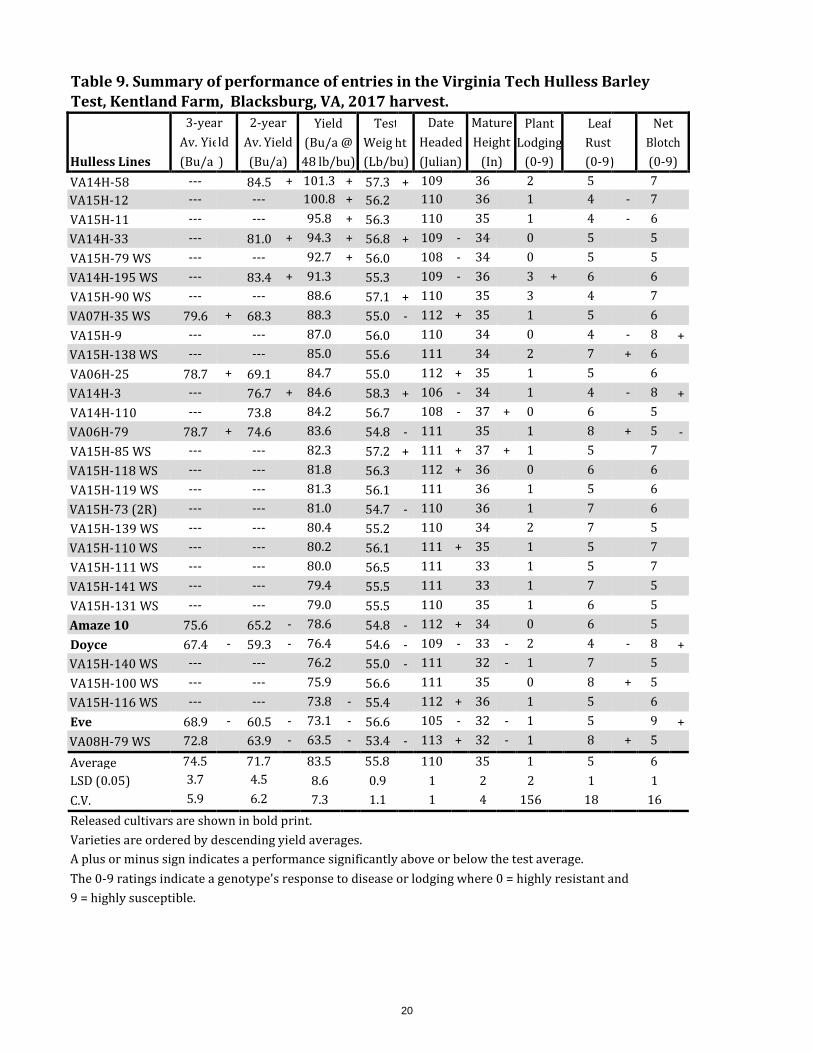
Northern Piedmont Center, Orange, VA, 2017 harvest. Table 9. Summary of performance of hulless entries in the Virginia Tech Barley Test, ........................................... 20
Kentland Farm, Blacksburg, VA, 2017 harvest. Table 10. Summary of performance of hulled entries in the Virginia Tech Barley Test over ................................... 21
locations, 2017 harvest. Table 11. Two-year average summary of performance of hulled entries in the Virginia Tech ................................ 23
Barley Tests, 2016 and 2017 harvests. Table 12. Three-year average summary of performance of hulled entries in the Virginia Tech ............................. 24
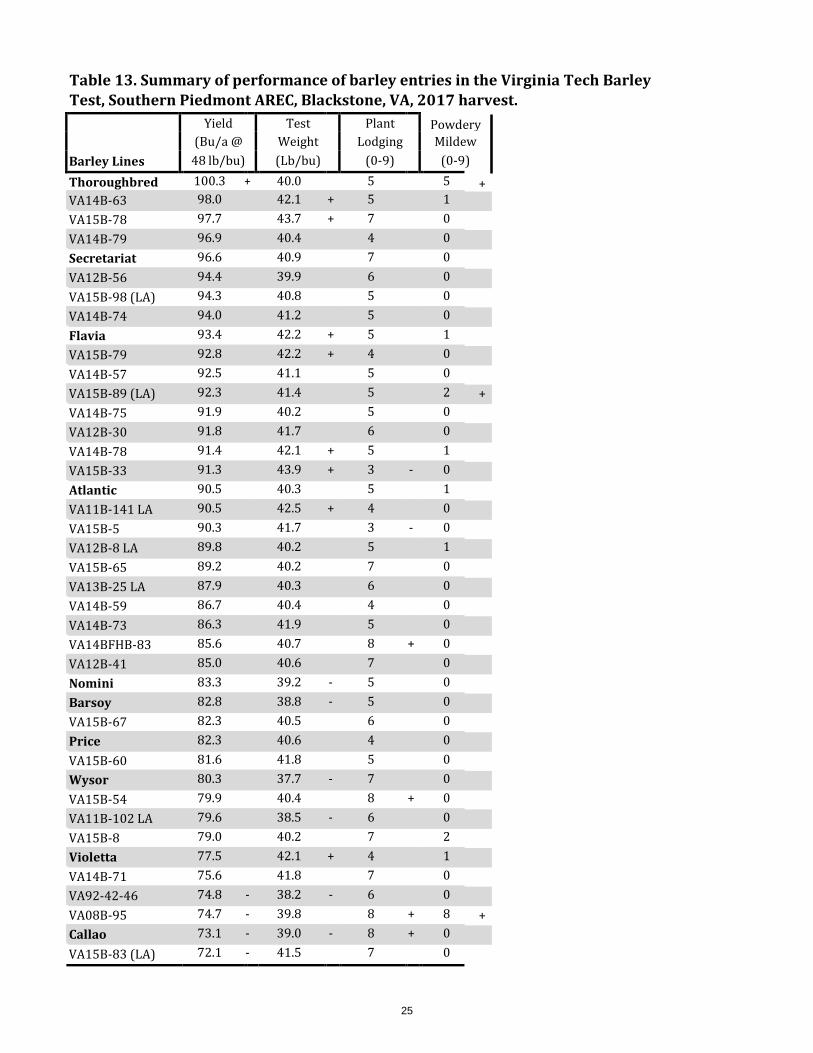
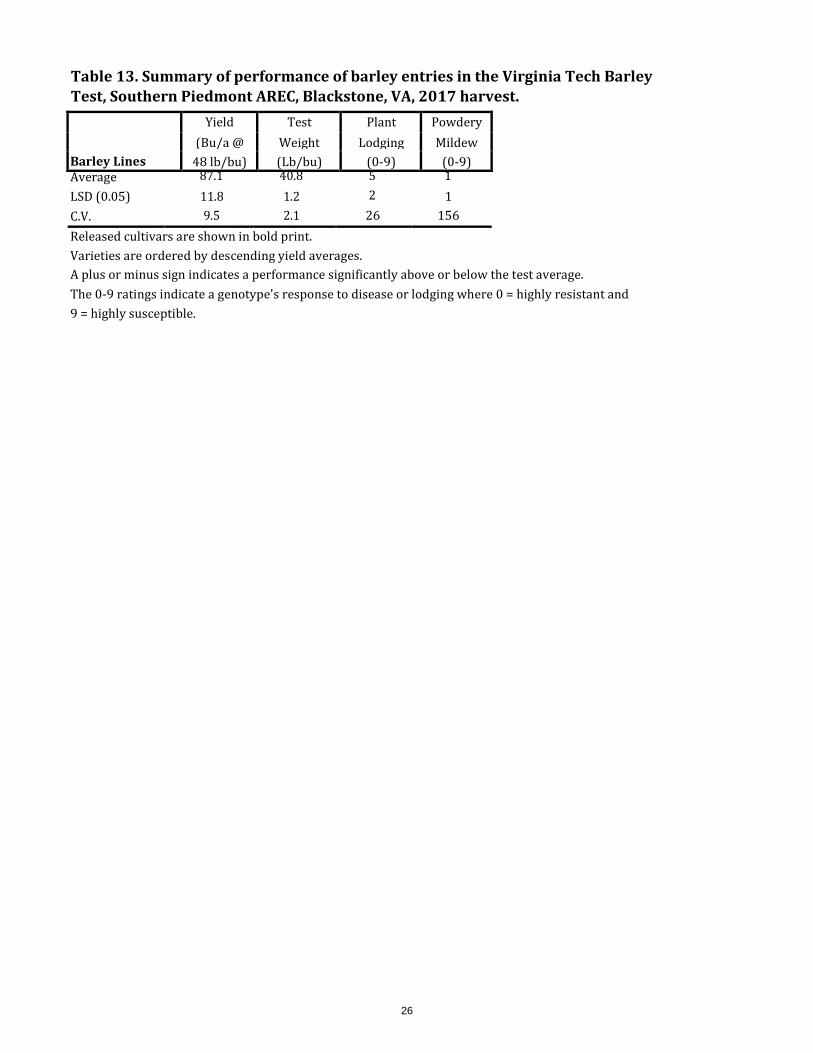
Barley Tests, 2015, 2016, and 2017 harvests. Table 13. Summary of performance of hulled entries in the Virginia Tech Barley Test ............................................. 25
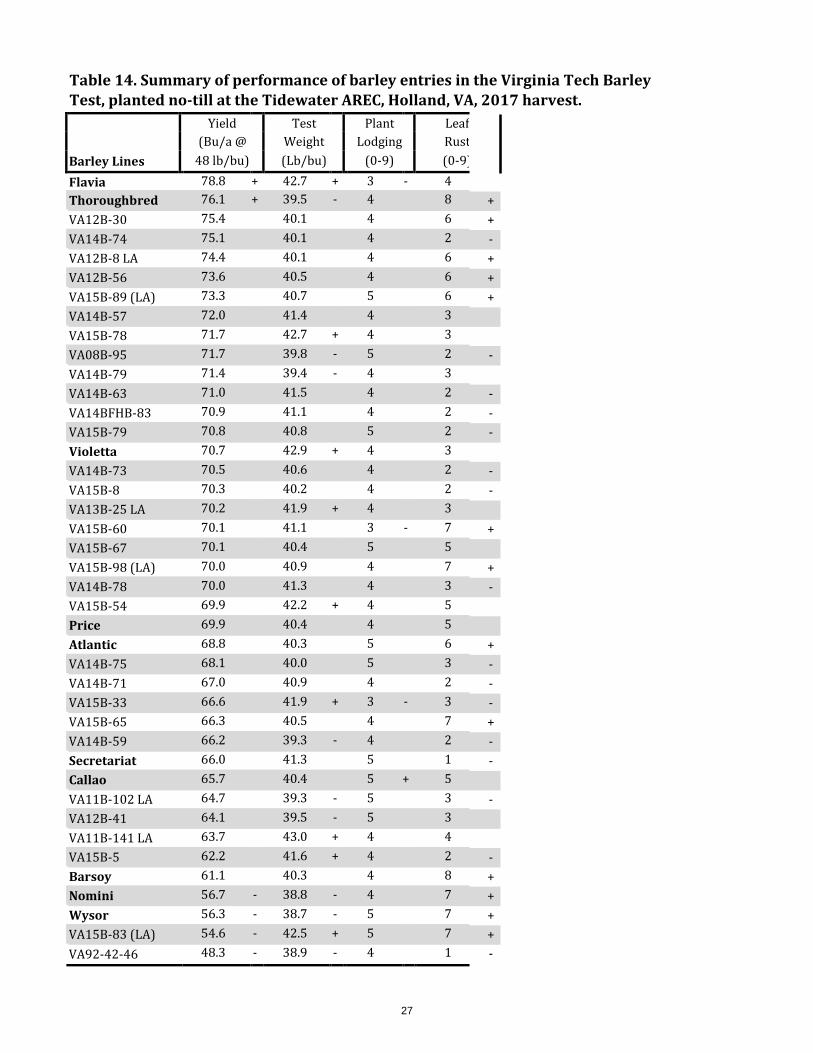
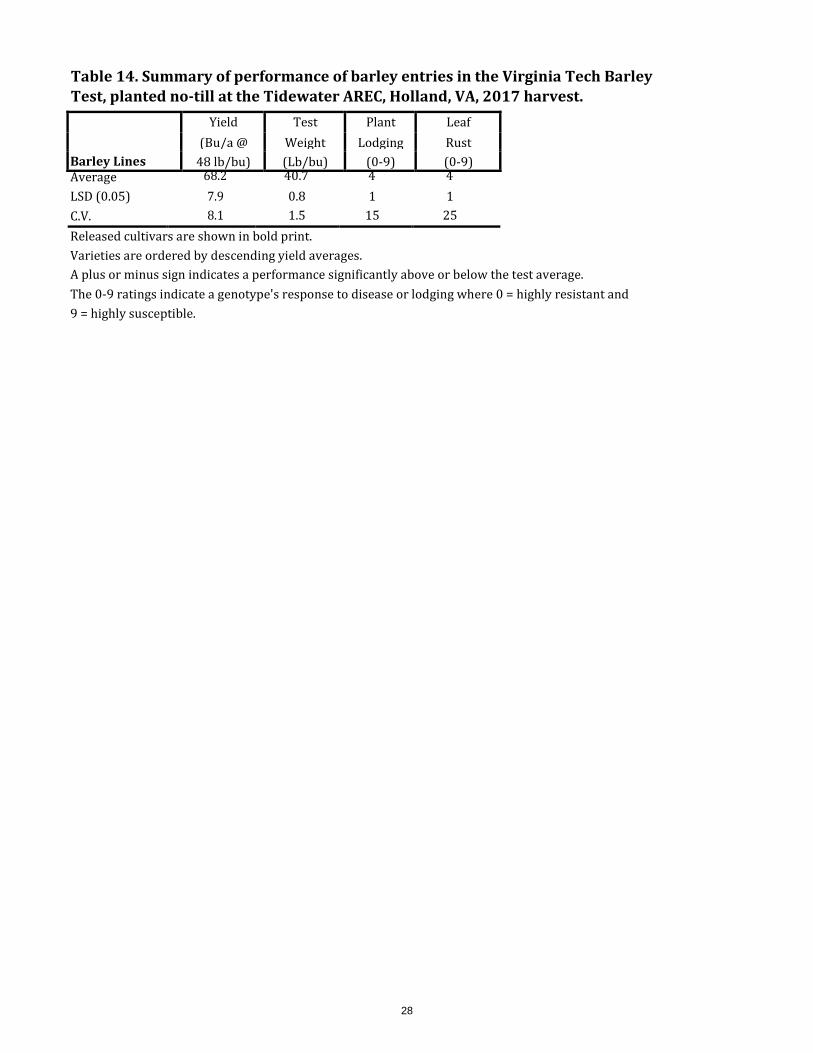
planted at the Southern Piedmont AREC, Blackstone VA, 2017 harvest. Table 14. Summary of performance of hulled entries in the Virginia Tech Barley Test ............................................. 27
planted minimum-till at the Tidewater AREC, Holland VA, 2017 harvest. Table 15. Summary of performance of hulled entries in the Virginia Tech Barley Test, ............................................ 29
Eastern Virginia AREC, Warsaw, VA, 2017 harvest. Table 16. Summary of performance of hulled entries in the Virginia Tech Barley Test, ............................................ 31
Eastern Shore AREC, Painter, VA, 2017 harvest. Table 17. Summary of performance of hulled entries in the Virginia Tech Barley Test, ............................................ 33
Northern Piedmont Center, Orange, VA, 2017 harvest. Table 18. Summary of performance of hulled entries in the Virginia Tech Barley Test, ............................................ 35
Kentland Farm, Blacksburg, VA, 2017 harvest.
Section 2: Barley Scab Research
Discussion of reaction of entries in the 2016-17 Virginia Tech Hulless Barley and Barley ........................................ 37 Tests to Fusarium head blight. Table 19. Summary of reaction of entries in Virginia Tech State Hulless Barley Test to Fusarium ....................... 38
head blight (scab), 2017 harvest. Table 20. Summary of reaction of entries in Virginia Tech State Barley Test to Fusarium ....................................... 39
head blight (scab), 2017 harvest.
Section 3: Wheat Varieties
Discussion of wheat varieties and summary of wheat management practices for the 2017 harvest season... 41 Entries in the 2016-17 Virginia Wheat Test, arranged by company ..................................................................................... 43 Table 21. Summary of performance of entries in the Virginia Tech Wheat Test, 2017 harvest .............................. 47 Table 22. Two-year average summary of performance of entries in the Virginia Tech .............................................. 53
Wheat Tests, 2016 and 2017 harvests. Table 23. Three-year average summary of performance of entries in the Virginia Tech ........................................... 56
Wheat Tests, 2015, 2016, and 2017 harvests. Table 24. Summary of performance of entries in the Virginia Tech Wheat Test, ........................................................... 58
Eastern Virginia AREC, Warsaw, VA, 2017 harvest. Table 25. Summary of performance of entries in the Virginia Tech Wheat Test, Eastern Shore ............................ 63
AREC, Painter, VA, 2017 harvest. Table 26. Summary of performance of entries in the Virginia Tech Wheat Test, Southern Piedmont ................ 67
AREC, Blackstone, VA, 2017 harvest. Table 27. Summary of performance of entries in the Virginia Tech Wheat Test, Northern Piedmont, ................ 71
Center, Orange, VA, 2017 harvest. Table 28. Summary of performance of entries in the Virginia Tech Wheat Test, Kentland Farm, ......................... 75
Blacksburg, VA, 2017 harvest. Table 29. Summary of performance of entries in the Virginia Tech Wheat Test planted minimum-till .............. 79
at the Tidewater AREC, Holland, VA, 2017 harvest.
Section 4: Milling and Baking Quality Discussion of milling and baking quality of entries in the 2015-16 Virginia Wheat Test ............................................ 83 Table 30. Milling and baking quality of entries in the Virginia Tech Wheat Test based on ....................................... 85
the evaluation of the 2016 harvest.
Section 5: Wheat Scab Research Discussion of reaction of entries in the 2016-17 Virginia Tech Wheat Test to Fusarium head blight ................... 87 Table 31. Summary of reaction of entries in the Virginia Tech State Wheat Test to Fusarium ............................... 88
head blight (scab), 2017 harvest. Table 32. Two-year average summary of entries in the Virginia Tech State Wheat Tests to Fusarium .............. 92
head blight (scab), 2016 and 2017 harvests.
1
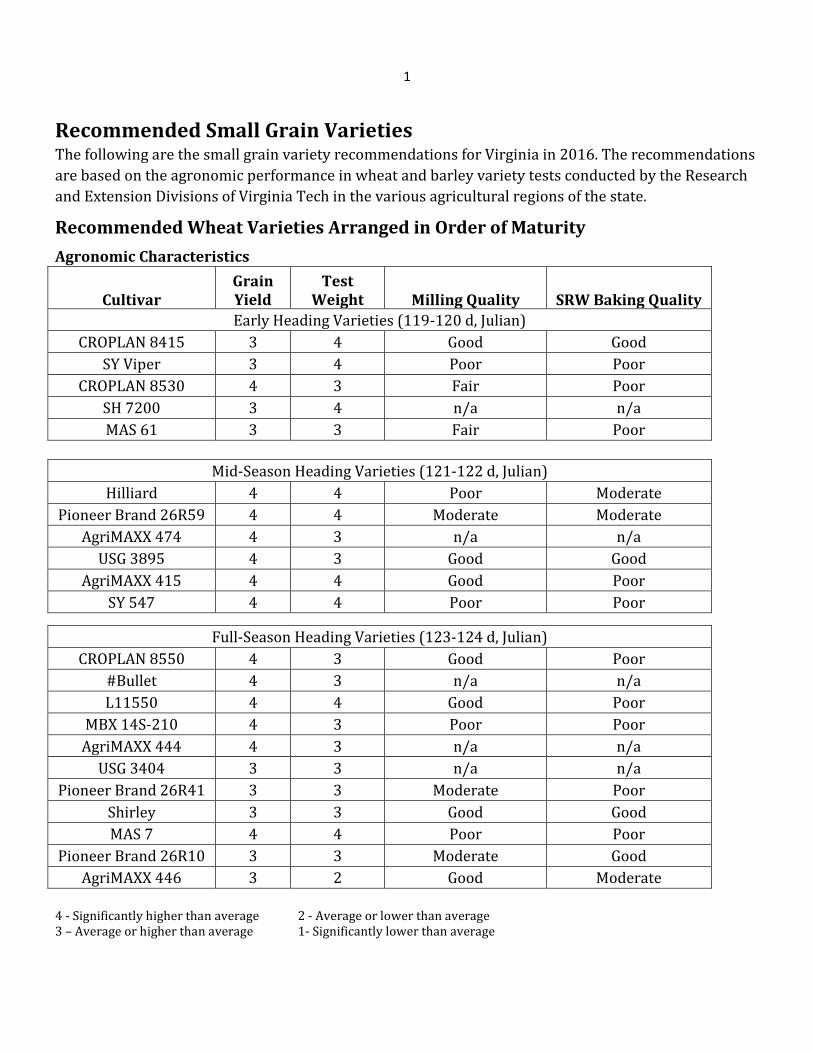
Recommended Small Grain Varieties The following are the small grain variety recommendations for Virginia in 2016. The recommendations are based on the agronomic performance in wheat and barley variety tests conducted by the Research and Extension Divisions of Virginia Tech in the various agricultural regions of the state.
Recommended Wheat Varieties Arranged in Order of Maturity Agronomic Characteristics
Cultivar
Grain Yield
Test Weight
Milling Quality
SRW Baking Quality
Early Heading Varieties (119-120 d, Julian) CROPLAN 8415 3 4 Good Good
SY Viper 3 4 Poor Poor CROPLAN 8530 4 3 Fair Poor
SH 7200 3 4 n/a n/a MAS 61 3 3 Fair Poor
Mid-Season Heading Varieties (121-122 d, Julian)
Hilliard 4 4 Poor Moderate Pioneer Brand 26R59 4 4 Moderate Moderate
AgriMAXX 474 4 3 n/a n/a USG 3895 4 3 Good Good
AgriMAXX 415 4 4 Good Poor SY 547 4 4 Poor Poor
Full-Season Heading Varieties (123-124 d, Julian) CROPLAN 8550 4 3 Good Poor
#Bullet 4 3 n/a n/a L11550 4 4 Good Poor
MBX 14S-210 4 3 Poor Poor AgriMAXX 444 4 3 n/a n/a
USG 3404 3 3 n/a n/a Pioneer Brand 26R41 3 3 Moderate Poor
Shirley 3 3 Good Good MAS 7 4 4 Poor Poor
Pioneer Brand 26R10 3 3 Moderate Good AgriMAXX 446 3 2 Good Moderate
4 - Significantly higher than average 3 – Average or higher than average
2 - Average or lower than average 1- Significantly lower than average
2
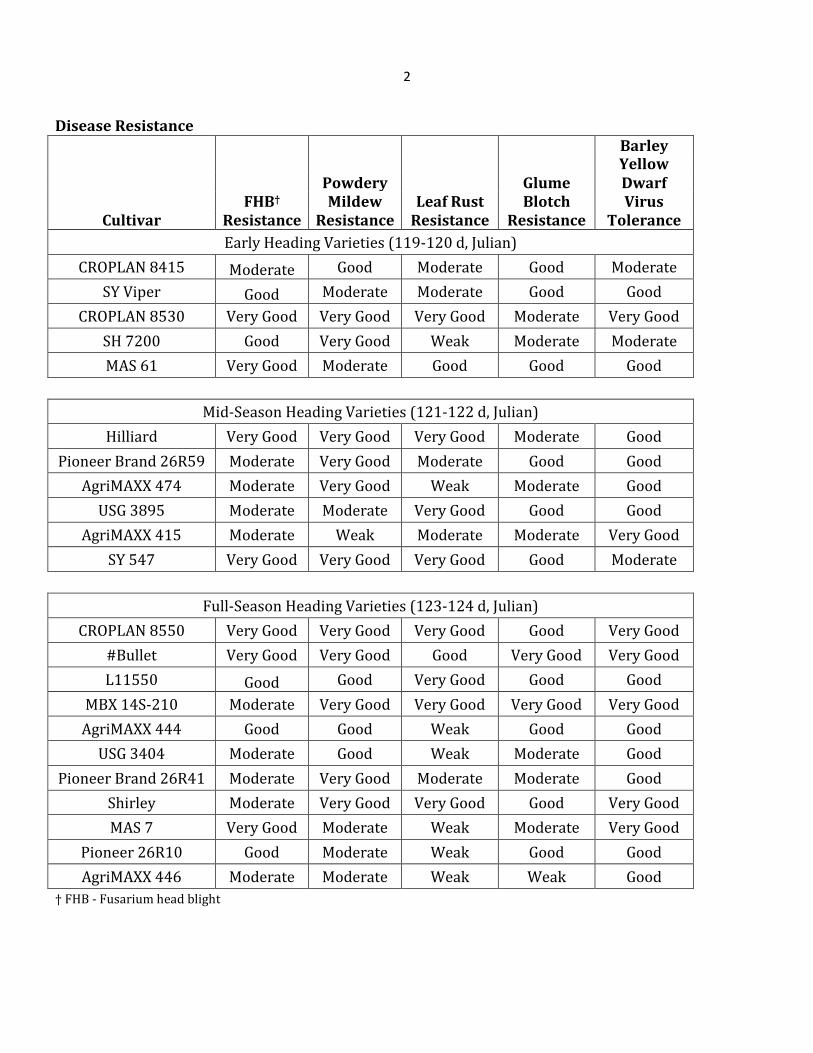
Disease Resistance
Barley Yellow Powdery Glume Dwarf FHB† Mildew Leaf Rust Blotch Virus
Cultivar Resistance Resistance Resistance Resistance Tolerance Early Heading Varieties (119-120 d, Julian)
CROPLAN 8415 Moderate Good Moderate Good Moderate SY Viper Good Moderate Moderate Good Good
CROPLAN 8530 Very Good Very Good Very Good Moderate Very Good SH 7200 Good Very Good Weak Moderate Moderate MAS 61 Very Good Moderate Good Good Good
Mid-Season Heading Varieties (121-122 d, Julian)
Hilliard Very Good Very Good Very Good Moderate Good Pioneer Brand 26R59 Moderate Very Good Moderate Good Good
AgriMAXX 474 Moderate Very Good Weak Moderate Good USG 3895 Moderate Moderate Very Good Good Good
AgriMAXX 415 Moderate Weak Moderate Moderate Very Good SY 547 Very Good Very Good Very Good Good Moderate
Full-Season Heading Varieties (123-124 d, Julian)
CROPLAN 8550 Very Good Very Good Very Good Good Very Good #Bullet Very Good Very Good Good Very Good Very Good L11550 Good Good Very Good Good Good
MBX 14S-210 Moderate Very Good Very Good Very Good Very Good AgriMAXX 444 Good Good Weak Good Good
USG 3404 Moderate Good Weak Moderate Good Pioneer Brand 26R41 Moderate Very Good Moderate Moderate Good
Shirley Moderate Very Good Very Good Good Very Good MAS 7 Very Good Moderate Weak Moderate Very Good
Pioneer 26R10 Good Moderate Weak Good Good AgriMAXX 446 Moderate Moderate Weak Weak Good
† FHB - Fusarium head blight
Barley
3
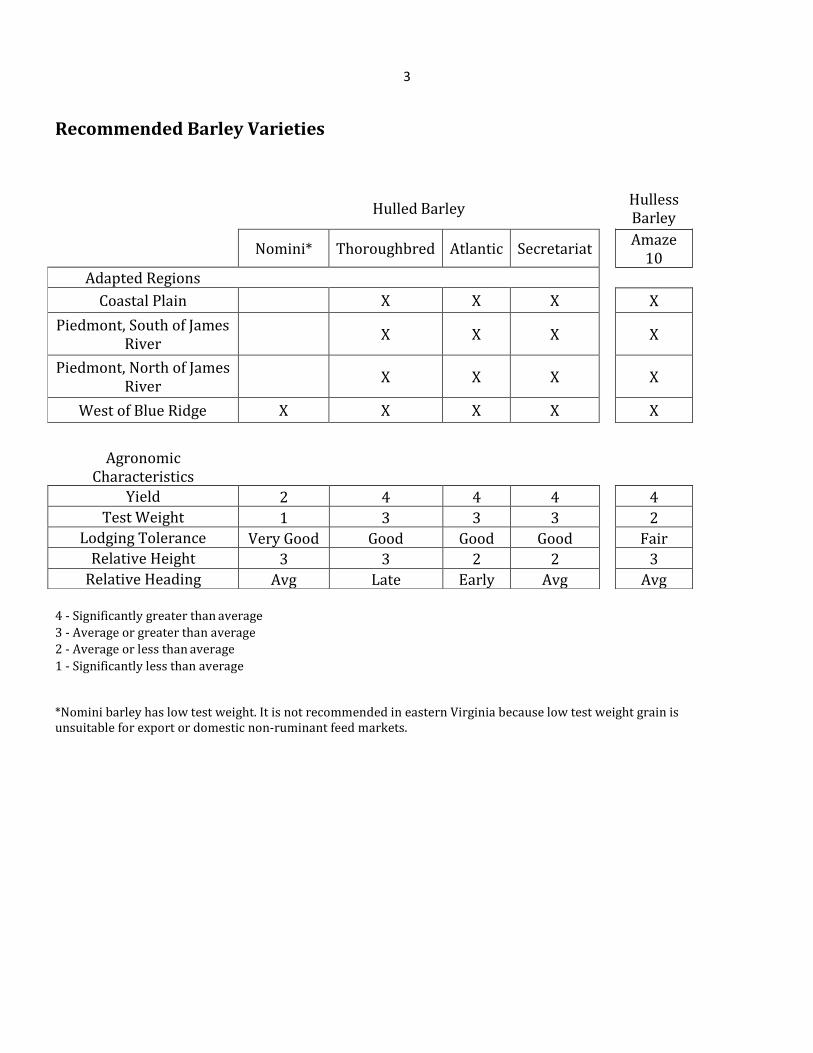
Recommended Barley Varieties
Hulled Barley Hulless
Amaze 10
X
X
X
X
Agronomic
Characteristics
4 - Significantly greater than average 3 - Average or greater than average 2 - Average or less than average 1 - Significantly less than average
*Nomini barley has low test weight. It is not recommended in eastern Virginia because low test weight grain is unsuitable for export or domestic non-ruminant feed markets.
Yield 2 4 4 4 Test Weight 1 3 3 3
Lodging Tolerance Very Good Good Good Good Relative Height 3 3 2 2
Relative Heading Avg Late Early Avg
4 2
Fair 3
Avg
Nomini* Thoroughbred Atlantic Secretariat
Adapted Regions Coastal Plain X X X
Piedmont, South of James River
X X X
Piedmont, North of James River
X X X
West of Blue Ridge X X X X
4
Barley and Wheat Entries
Commercial Barley Entries
Limagrain Cereal Seeds, 7707 Jackson Pond Dr, Charlotte, NC 28273 – Violetta. Virginia Tech and Virginia Crop Improvement Association, 9142 Atlee Station Road, Mechanicsville, VA 23116 – Amaze 10, Atlantic, Barsoy, Callao, Doyce, Eve, Nomini, Price, Secretariat, Thoroughbred, and Wysor. Note: The seed that was used to plant the variety Dan this year was from a questionable source; the associated data has been omitted from the 2017 results.
Commercial and Experimental Wheat Entries
AgriMAXX Wheat Company, 7167 Highbanks Road, Mascoutah, IL 62258 – AgriMAXX 415, AgriMAXX 444, AgriMAXX 446, AgriMAXX 463, AgriMAXX 464, AgriMAXX 473, and AgriMAXX 474. Armor Seed, L.L.C., 183 Pennsylvania Avenue, Waldenburg, AR 72475 – Mayhem, ARW1514, ARW1575, ARW1610, and ARW1611. Crop Production Services, 15277 Richmond-Tappahannock Highway, St Stephens Church, VA 23148 - Dyna- Gro 9223, Dyna-Gro 9522, Dyna-Gro 9600, Dyna-Gro 9692, Dyna-Gro 9701, Dyna-Gro 9750, Dyna-Gro 9772, Dyna-Gro 9862, Shirley, and WX16722. Dupont Pioneer, 425 Abbeydale Way, Columbia, SC 29229 – Pioneer 26R10, Pioneer 26R36, Pioneer 26R41, Pioneer 26R53, Pioneer 26R59, and Pioneer XW15C. Eddie Mercer Agri-Services, Inc, 6900 Linganore Road, Frederick, MD 21702 –MBX 14-S-210, MBX 16-B- 203, MBX 17-P-275, and MBX 17-M-245. Erwin-Keith, Inc., 1529 Highway 193, Wynne, AR 72396 – P243, P357, #Boss, #Bullet, #Turbo, #Warrior, PGX14-5, and PGX16-3. Featherstone Farm Seed, 13941 Genito Road, Amelia, VA 23002 - Featherstone 73 and Featherstone VA- 258. University of Georgia, 1109 Experiment Street, Griffin, GA 30223 – GA07353-14E19, GA051207-14E53, and GAJT 141-14E45. Limagrain Cereal Seeds, 7099 Parkbrook Lane, Cordova, TN 38018 –L11538, L11541, and L11550. University of Maryland, 1116 Research Greenhouse Complex, University of Maryland, College Park, MD 20742 – 15MW133, 15MDX1, 15MDX2, 15MDX4, and 15MDX17. Meherrin Ag & Chemical, 413 Main Street, Severn, NC 27877 – SH 4300, SH 4400, SH 7200, and SH EXP 1706. Mid Atlantic Seeds, 316 N. Albemarle Street #6, York, PA 17403 – MAS #6, MAS #7, MAS #35, MAS #42, MAS #61, MAS #67, MAX 116, MAX 216, MAX 316, and MAX 516. NC State University, 840 Method Road Unit 3, Raleigh, NC 27695 – NC13-20332, NC13-21213, NC13-23443 and NC13-23449. Syngenta Seeds, Inc., 806 N. 2nd St, Berthoud, CO 80513 – SY 007, SY 100, SY 547, SY Harrison, SY Viper, and Oakes. University of Tennessee, 2431 Joe Johnson Drive, Knoxville, TN 37996 – TN1501 and TN1604. Texas A&M AgriLife Research, 2600 S. Neal, Commerce, TX 75429 – TX EL2. UniSouth Genetics, 3205 C Highway 46S, Dickson, TN 37055 – USG 3197, USG 3228, USG 3316, USG 3404, USG 3458, USG 3536, USG 3549, and USG 3895. Virginia Tech and Virginia Crop Improvement Association, 9142 Atlee Station Road, Mechanicsville, VA 23111 –Hilliard, Massey and all lines prefixed by VA and DH. Winfield, 1080 County Road F West, MS 5850, Shoreview, MN 55126-2910 - Croplan 8415, Croplan 8530, Croplan 8550, Croplan SRW 9415, and Croplan SRW 9606.
Appreciation is expressed to the Virginia Small Grains Check-Off Board, AgriMAXX, Armor Seed LLC, Crop Production Services, Dupont Pioneer, Eddie Mercer Agri-Services, Inc., Erwin-Keith, Inc., Featherstone Farm Seed, Inc., Limagrain Cereal Seeds, Meherrin Ag & Chemical, Mid-Atlantic Seeds, Syngenta Seeds, Inc., UniSouth Genetics, Inc., Winfield, and the Virginia Crop Improvement Association for their financial support
5
of the Small Grains Variety Testing Program at Virginia Tech. Conducted and summarized by the following Virginia Tech employees: Dr. Wade Thomason, Extension Agronomist, Grains; Dr. Carl Griffey, Small Grains Breeder; Mr. Harry Behl, Agricultural Supervisor; Ms. Elizabeth Rucker, Research Associate: Dr. Bee Khim Chim, Post-Doctoral Assistant. Location Supervisors: Mr. Tom Custis (Painter); Dr. David Langston and Mr. Karl Jones (Holland); Mr. Bob Pitman and Mr. Mark Vaughn, (Warsaw); Mr. Ned Jones (Blackstone); Dr. Carl Griffey, Mr. Wynse Brooks, Mr. Jon Light (Blacksburg); Mr. Doug Horn (Shenandoah Valley); Mr. Steve Gulick and Mr. Brad Lael (Orange).
6
Introduction The following tables present results from barley and wheat varietal tests conducted in Virginia in 2015-2017. Small-grain cultivar performance tests are conducted each year in Virginia by the Virginia Tech Department of Crop and Soil Environmental Sciences and the Virginia Agricultural Experiment Station. The tests provide information to assist Virginia Cooperative Extension Service agents in formulating cultivar recommendations for small grain producers and to companies developing cultivars and/or marketing seed within the state. Yield data are given for individual locations and across locations and years; yield and other performance characteristics are averaged over the number of locations indicated in parenthesis near the column heading. Performance of a given variety often varies widely over locations and years which makes multiple location- year averages a more reliable indication of expected performance than data from a single year or location. Details about management practices for barley and wheat are listed for each experimental location.
The Season - 2017
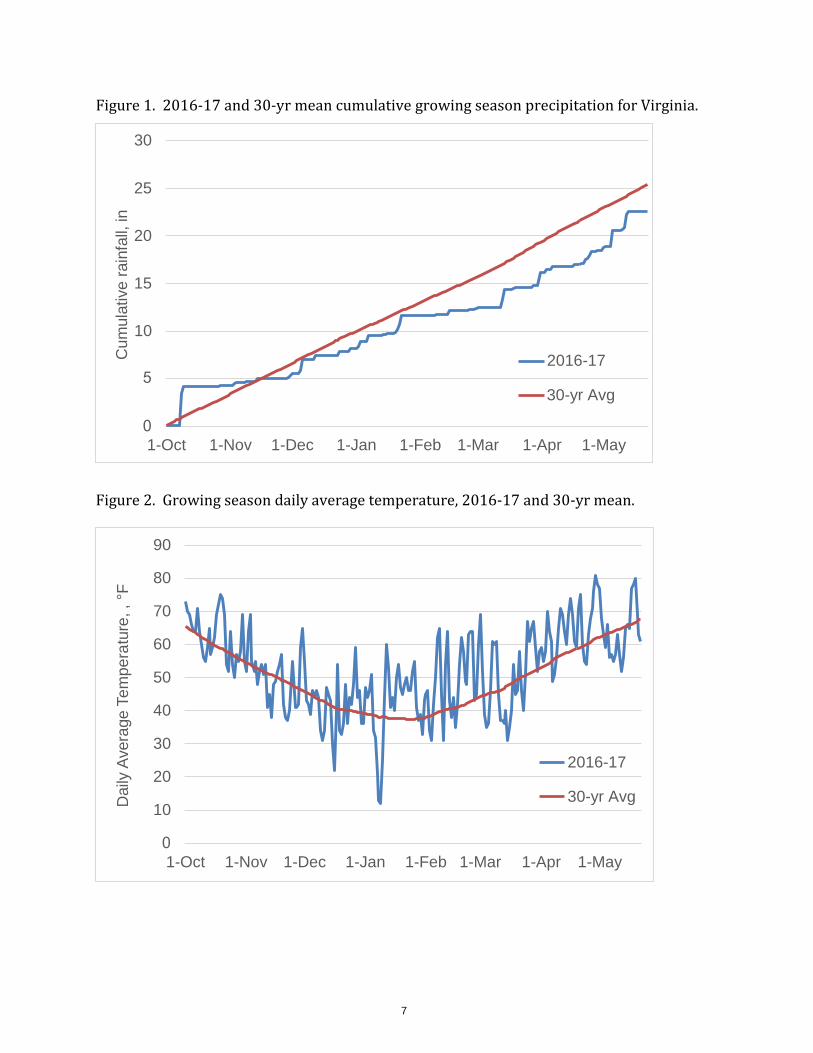
Statewide temperatures and rainfall in fall 2016 were generally favorable for wheat seeding after fields dried from the soaking from Hurricane Matthew. By mid-October, wheat planting reached 20% of intentions, compared with a five-year average of 25% by this date. Continued favorable weather allowed 41% and 72% of the wheat and barley crops, respectively, to be planted by October 3. By mid-November, planting progress was near the five-year average for all small grains reported with 53 and 60% of barley and wheat acres reported as good or excellent. Dry conditions persisted through late November resulting in a decline in the number of wheat and barley acres rated excellent, though this did allow successful late seeding in some areas. Rainfall in early December returned the total season precipitation to near normal, followed by mild and wet conditions through much of January. February was unseasonably warm with limited rainfall, resulting in soil moisture depletion. Barley and wheat rwere rated good or excellent on 46 and 68% of acres, respectively. March brought mostly mild temperatures with a freeze mid-month. Seventy-five percent of the winter wheat crop was rated good or excellent for the week ending March 26. Statewide rains were received in mid-March, but season total rainfall continued below normal. By the end of the third week of March, 33% of the wheat crop was reported as headed, up 14% from last year and 23% from the five-year average. Dry soil conditions continued through mid-April with temperatures above average through the last half of the month. At the end of April, 75% of the winter wheat crop was still rated good or excellent. Wet weather in May resulted in a decline in both wheat and barley with 65 and 62% rated good or excellent, respectively. By May 20, 94% of the wheat crop was headed compared with 90% last year. Twenty-two percent of the barley crop was harvested by June 4 up from 4% harvested in 2016. Wheat harvest was at 3%. By June 19, 69 and 51% of the barley and wheat for grain were harvested, both up significantly from 2016 and the 5-year average. Virginia farmers were expected to harvest an average wheat yield of 64 bushels per acre, up 11 bushels from 2016, but total production is expected to be 8.6 million bushels, down 7% from the previous year. The decline in total production is due to a decrease in harvested acres to a total of 135,000 acres.
7
Figure 1. 2016-17 and 30-yr mean cumulative growing season precipitation for Virginia.
Figure 2. Growing season daily average temperature, 2016-17 and 30-yr mean.
30
25
20
15
10
2016-17
30-yr Avg
1-Oct 1-Nov 1-Dec 1-Jan 1-Feb 1-Mar 1-Apr 1-May
90
80
70
60
50
40
30
20
10
1-Oct
2016-17 30-yr Avg
1-Nov 1-Dec 1-Jan 1-Feb 1-Mar 1-Apr 1-May
Cum
ulat
ive
rain
fall,
in
Dai
ly A
vera
ge T
empe
ratu
re, ,
°F

8
Section 1: Barley Varieties Note: At Painter in the 2017 harvest year, results were severely impacted by a potential outbreak of a new isolate of leaf rust. Therefore, yield and disease data were not included in the over-location and over-year analyses.
The Virginia Tech barley-breeding program is the largest and, until recently, was the only remaining public program in the eastern United States. Our program is significantly diverse with breeding efforts focused on development of superior, widely adapted, high-yielding winter barley cultivars and a major focus on incorporation of value-added traits geared toward development of new markets. However, if barley is to regain its historical position, it must be more competitive with other traditional crops (corn and wheat). Significant progress continues to be made in the development of high value winter barley cultivars. We have developed elite barley lines having the potential for use in multiple end-use markets. The development of barley cultivars for use in the production of feed, malt and food having desirable quality traits including, but not limited to, high starch, high or low protein, and beta-glucan depending on targeted end uses is an overall goal. Focus on improving yield potential, disease resistance and end use quality of barley will have several practical benefits to producers and end users. The ability to identify genetic variation between barley lines may help breeders improve yields of barley adapted to this region.
New barley lines derived from crosses made between superior barley breeding lines from our program with outstanding breeding lines from other programs are being developed and evaluated in the program. In the spring of 2016, we made over 300 crosses in the greenhouse comprised of superior malt barley parents from the Winter Malt Barley Trial (WMBT) and elite barley parents from our program. Last fall (2016), we planted F1
progeny (315) from 342 crosses made in 2016, and F2 progeny (209) from 426 crosses made in 2015. We also evaluated over 700 pure lines in replicated yield trials at multiple locations in Virginia in order to identify potential high yielding cultivars. We also evaluated 39 malt barley double haploid (DH) lines in replicated preliminary tests at Blacksburg and Warsaw, VA. In addition, we evaluated approximately 25 advance barley lines in replicated yield tests at locations in neighboring states (North Carolina, Kentucky, Ohio, and Pennsylvania).
As interest continues to grow in locally produced ingredients from the craft brewing industry in the mid-Atlantic and eastern U.S. finding malted barley is not easy for those located east of the Mississippi river. This has triggered significant demand for malt barley. We are trying to bridge this gap by evaluating malt barley cultivars developed by collaborators in the U.S and Europe while rapidly developing and testing our own malt barley experimental lines. Locally produced malting barley is good for Virginia’s economy and farmers can earn a $3 to $4 premium for growing malting barley. Virginia currently grows around 45,000 acres of feed barley annually which could be converted to the production of malting barley as well as fostering an expansion in total barley acreage. Winter grown malt barley is more sustainable since it is grown from October to June, providing farmers the added double crop opportunities with soybeans in the summer. According to the Brewers Association, Virginia’s 124 craft breweries currently produce over 274,000 barrels of craft beer annually and have an economic impact of over a million dollars.
Our main effort is breeding winter Malt barley cultivars that have superior malt quality and are well adapted to the mid- Atlantic and southeastern United States. We
9
have recently started developing double haploid malt barley lines in collaboration with Oregon State University. Results from these tests are encouraging since double haploids allow us to develop cultivars much faster than traditional methods. The DH lines are genetically pure, eliminating approximately 2-3 years of the total time required to develop a variety. Besides developing and testing our own experimental lines, we also collaborate with other breeding programs which allows us to evaluate cultivars developed by our collaborators across the country as well as cultivars from around the world, especially Europe. In the 2017-2018 season, we plan to start a regional mid-Atlantic Malt Barley Trial with neighboring states to facilitate collaborations and enhance cultivar development. We have a graduate student, Nick Meier, developing molecular markers for malting quality traits to help us select superior quality malting lines with more precision and eliminate costly testing expenses. Nick is also working on flavor analysis of commonly grown cultivars to determine how malt flavor is affected by genetics and environment.
We anticipate that interest in production of malt barley will continue to grow in this region and we plan to release cultivars to meet diverse market demands. Our future allotment of resources will continue to provide more resources to our winter malt barley as it continues to grow.
Virginia-grown barley typically yields in excess of 100 bushels per acre and fits well in many crop rotation systems. However, profitable barley production on nearly 50,000 acres in Virginia will require the revival of international market opportunities and/or improvement of domestic value-added opportunities.
Hulless Barley
Note: The seed that was used to plant the variety Dan this year was from a questionable source; the associated data has been omitted from the 2017 results.
Hulless barley tests were planted in seven- inch rows at Blackstone, Orange, Holland, and Painter. They were planted in six-inch rows at Warsaw and Blacksburg. The no-till site at Holland was planted at 66 seeds per square foot. All other locations were planted at 60 seeds per square foot. Yields from Holland in the 2017 harvest year were not included in the over-location or over-year analyses. Additionally, yield and disease data at the Painter location were not included in the over-location or over-year analyses due to potential outbreak of a new isolate of leaf rust that impacted yield and test weight in 2017.
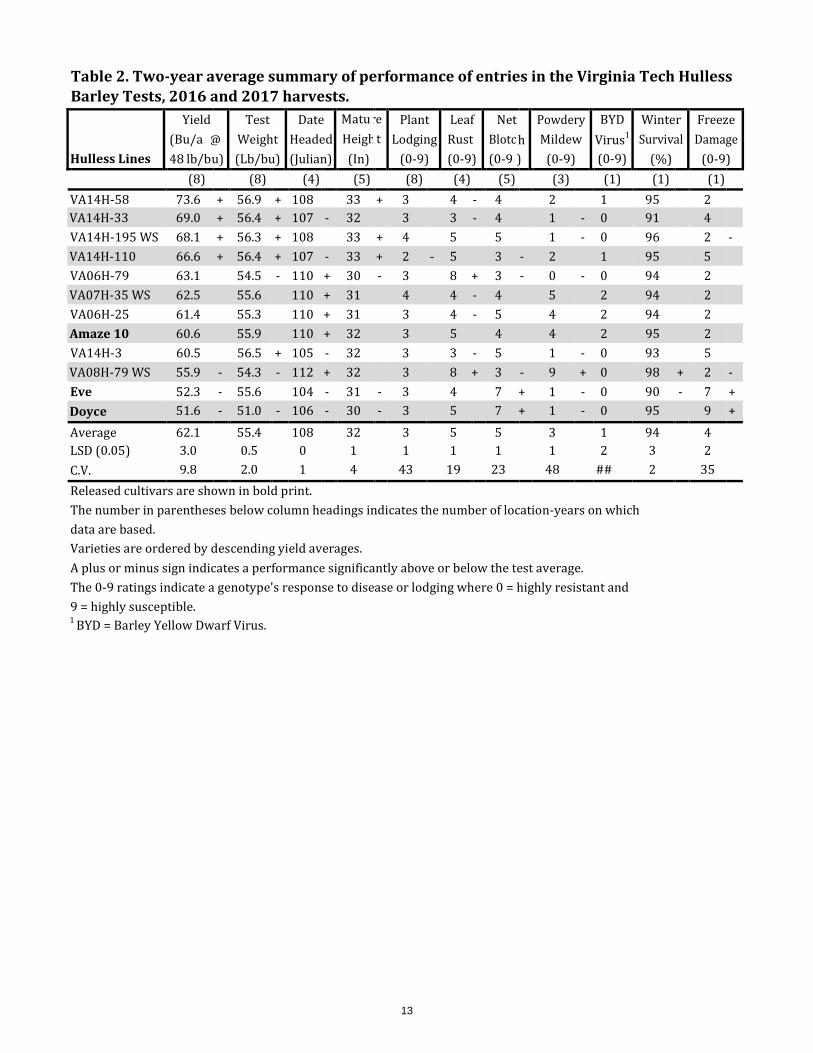
In the 2017 harvest year, grain yield for Doyce hulless barley in Virginia was 53 bushels per acre with test weight of 50.0 pounds per bushel. Average grain yield of Eve was 60 bushels per acre with test weight of 55.7 pounds per bushel. Amaze 10 had the highest average grain yield (62 bushels per acre) among released cultivars (Doyce and Eve). It produced a test weight of 55.2 pounds/bushel that was similar to Eve (55.7 pounds/bushel) and 5.2 pounds per bushel higher than Doyce (50.0 pounds/bushel). The experimental line VA14H-58 had the highest overall average grain yield (81 bushels per acre) that was 19 bushels per acre higher than that of Amaze 10 (62 bushels/acre), 21 bushels per acre higher than Eve, 31 bushels per acre higher than Doyce, and 13 bushels per acre more than the test average.
Hulled Barley
Hulled barley tests were planted in seven- inch rows at Blackstone, Orange, Holland, and Painter. They were planted in six-inch rows
10
at Warsaw and Blacksburg. The no-till site at Holland was planted at 48 seeds per square foot. All other locations were planted at 44 seeds per square foot. Yields from Holland in the 2017 harvest year were not included in the over-location or over-year analyses. Similarly, yields and disease data at Painter location also were not included in the over- location or over-year analyses due to an outbreak of a potential new leaf rust isolate.
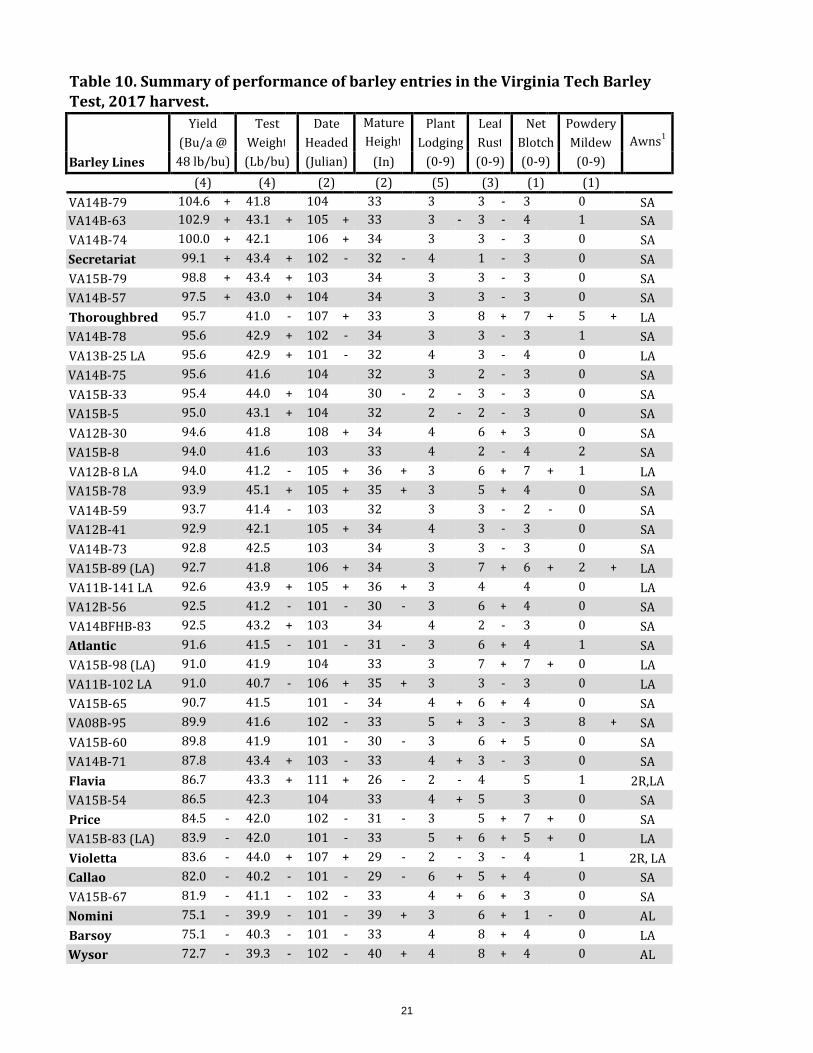
In the 2017 harvest year, the overall grain yield of Thoroughbred was 96 bushels per acre with an average test weight of 41.0 pounds per bushel compared to the mean yield of 91 bushels per acre and a test weight of 42.1 pounds per bushel for the mean of all cultivars tested. Average grain yield of Secretariat (99 bushels per acre) was 3 bushels per acre higher than Thoroughbred, 5 bushels per acre higher than Atlantic (92 bushels per acre), 15 bushels per acre higher than Price, 17 bushels per acre higher than Callao and 24 bushels per acre higher than Nomini. However, the experimental line VA14B-79 had the highest average overall grain yield (105 bushel per acre) that was 6 bushel per acre higher than Secretariat, 9 bushel per acre more than Thoroughbred and 14 bushel per acre higher than the overall test mean. In addition, two other experimental lines (VA14B-63 and VA14B- 74) ranked 2nd and 3rd respectively in average grain yield (103 and 100 bushels per acre) that were 3 to 4 bushels per acre lower than that of Secretariat and 1 to 2 bushels per acre higher than Thoroughbred.
11
Summary of barley management practices for the 2017 harvest season (All rates are given on a per acre basis.)
Blacksburg - Planted October 12, 2016. Pre-plant fertilizer was 30-40-60-8(S)-3(B). Site was sprayed with .75 oz. Harmony Extra SG® on November 15, 2016. Site was fertilized with 25 units UAN 30-0-0 on February 17, 2017 and with 50 units UAN 30-0-0 plus 0.75 oz Harmony Extra SG® on March 24, 2017. Harvest occurred June 7, 2017.
Blackstone - Planted October 18, 2016. Pre-plant fertilizer was 300 lb 10-10-10 on October 18, 2016. Site received 60 lb N + 0.5 oz. Harmony Extra XP® February 2, 2017. Site was fertilized with 60 lb. N using UAN on March 1, 2017. Mustang® Maxx was applied for aphid control. Harvest occurred May 31, 2017.
Painter - Planted October 20, 2016. Pre-plant fertilizer was 50 lb. N using 30% on October 19, 2016. Application of .75 oz. Harmony Extra SG® plus 8 oz NIS ¼% was done on February 8, 2017. Site was fertilized with 100 lb. N using 30% UAN March 25, 2017. Harvest occurred June 13, 2017.
Warsaw - Planted October 18, 2016. Pre-plant fertilizer was 30-70-60-5 applied October 17, 2016. Quelex™ was applied at .75 oz with surfactant at 1 qt/100 gal water on December 4, 2016. Site was fertilized using 12-0-0-1.5 at 25 lb on both December 10, 2016 and February 6, 2017. Site was also fertilized using 24-0-0-3 at 45 lb on March 12, 2017. Site was treated with 2 oz Tombstone® on April 28, 2017. Harvest occurred June 2, 2017.
Holland - Planted minimum-till October 19, 2016. Site was sprayed with 28 oz Roundup® October 12, 2016. Pre-plant fertilizer was 379 lb 9-15-31 on October 17, 2016. Site was fertilized with 24 gal 24-0-0-3 plus 1.5 pt Mn on February 28, 2017. Site was treated with 3 oz Tilt® on March 23, 2017. Harvest occurred June 9, 2017.
Orange - Planted October 6, 2016. Pre-plant fertilizer was 32-60-40 October 4, 2017. Sixty lb. N plus .6 oz. Harmony Extra SG® was applied February 21, 2017. Harvest occurred June 8-9, 2017.

12
Table 1. Summary of performance of entries in the Virginia Tech Hulless Barley Test, 2017 harvest. Yield Test Date Mature Plant Leaf Net Powdery (Bu/a @ Weight Headed Height Lodging Rust Blotch Mildew Hulless Lines 48 lb/bu) (Lb/bu) (Julian) (In) (0-9) (0-9) (0-9) (0-9)
(4) (4) (2) (3) (5) (3) (2) (1) VA14H-58 80.8 + 57.1 + 104 - 32 3 4 5 1 VA15H-11 77.2 + 56.0 105 32 3 3 - 4 - 2 VA14H-33 76.6 + 56.0 103 - 32 3 4 - 5 2 VA15H-12 76.1 + 56.7 + 105 32 3 3 - 5 2 VA15H-9 73.7 + 55.1 - 106 32 2 - 4 - 6 4 + VA15H-118 WS 73.4 + 57.1 + 106 + 33 + 3 - 5 5 2 VA15H-90 WS 73.2 + 57.6 + 106 33 3 4 - 6 2 VA15H-119 WS 72.2 56.5 + 106 + 33 + 3 4 - 6 1 VA15H-79 WS 71.7 54.5 - 103 - 32 3 4 - 5 1 VA15H-73 (2R) 71.0 56.4 + 107 + 33 + 2 - 5 6 1 VA15H-111 WS 69.8 56.1 106 32 3 4 - 7 + 1 VA15H-141 WS 68.7 56.5 + 106 31 3 6 5 1 VA15H-138 WS 68.7 56.3 + 105 32 4 5 5 1 VA14H-195 WS 68.2 55.7 104 - 33 5 + 5 5 1 VA14H-110 68.2 56.3 + 103 - 33 3 5 4 - 2 VA15H-116 WS 68.1 55.9 107 + 35 + 3 4 6 1 VA15H-85 WS 67.5 56.8 + 106 35 + 4 5 6 3 VA06H-79 67.2 54.4 - 106 + 31 - 3 8 + 4 - 1 VA15H-110 WS 66.6 55.9 106 + 32 3 4 7 + 2 VA07H-35 WS 66.5 55.3 106 + 31 4 5 5 3 VA15H-140 WS 65.7 55.7 106 31 - 4 5 5 2 VA15H-131 WS 65.7 55.4 106 32 3 5 5 1 VA15H-100 WS 65.3 56.0 106 + 32 3 7 + 5 2 VA15H-139 WS 65.2 56.2 105 32 4 + 5 5 1 VA06H-25 64.3 55.0 - 107 + 31 4 4 5 3 VA14H-3 63.3 - 56.7 + 101 - 31 2 - 3 - 5 1 Amaze 10 62.5 - 55.2 - 107 + 32 4 5 5 2 Eve 59.7 - 55.7 100 - 30 - 3 4 8 + 1 VA08H-79 WS 59.3 - 54.0 - 108 + 31 4 + 9 + 4 - 9 + Doyce 52.9 - 50.0 - 103 - 30 - 4 6 + 8 + 1 Average 68.3 55.7 105 32 3 5 5 2 LSD (0.05) 4.4 0.5 1 1 1 1 1 2 C.V. 9.3 1.4 1 4 33 19 17 102 Released cultivars are shown in bold print. The number in parentheses below column headings indicates the number of locations on which data are based. Varieties are ordered by descending yield averages. A plus or minus sign indicates a performance significantly above or below the test average. The 0-9 ratings indicate a genotype's response to disease or lodging where 0 = highly resistant and 9 = highly susceptible. Note: The seed that was used to plant Dan this year was from a questionable source; the associated data has been omitted from the 2017 results.
13
Table 2. Two-year average summary of performance of entries in the Virginia Tech Hulless Barley Tests, 2016 and 2017 harvests. Hulless Lines
Yield (Bu/a 48 lb/b
@ u)
Test Weight (Lb/bu)
Date Headed (Julian)
Matu Heigh (In)
re t
Plant Lodging
(0-9)
Leaf Rust (0-9)
Net Blotc (0-9
h )
Powdery Mildew
(0-9)
BYD Virus1
(0-9)
Winter Survival
(%)
Freeze Damage
(0-9) (8) (8) (4) (5) (8) (4) (5) (3) (1) (1) (1) VA14H-58 73.6 + 56.9 + 108 33 + 3 4 - 4 2 1 95 2 VA14H-33 69.0 + 56.4 + 107 - 32 3 3 - 4 1 - 0 91 4 VA14H-195 WS 68.1 + 56.3 + 108 33 + 4 5 5 1 - 0 96 2 - VA14H-110 66.6 + 56.4 + 107 - 33 + 2 - 5 3 - 2 1 95 5 VA06H-79 63.1 54.5 - 110 + 30 - 3 8 + 3 - 0 - 0 94 2 VA07H-35 WS 62.5 55.6 110 + 31 4 4 - 4 5 2 94 2 VA06H-25 61.4 55.3 110 + 31 3 4 - 5 4 2 94 2 Amaze 10 60.6 55.9 110 + 32 3 5 4 4 2 95 2 VA14H-3 60.5 56.5 + 105 - 32 3 3 - 5 1 - 0 93 5 VA08H-79 WS 55.9 - 54.3 - 112 + 32 3 8 + 3 - 9 + 0 98 + 2 - Eve 52.3 - 55.6 104 - 31 - 3 4 7 + 1 - 0 90 - 7 + Doyce 51.6 - 51.0 - 106 - 30 - 3 5 7 + 1 - 0 95 9 + Average 62.1 55.4 108 32 3 5 5 3 1 94 4 LSD (0.05) 3.0 0.5 0 1 1 1 1 1 2 3 2 C.V. 9.8 2.0 1 4 43 19 23 48 ## 2 35 Released cultivars are shown in bold print. The number in parentheses below column headings indicates the number of location-years on which data are based. Varieties are ordered by descending yield averages. A plus or minus sign indicates a performance significantly above or below the test average. The 0-9 ratings indicate a genotype's response to disease or lodging where 0 = highly resistant and 9 = highly susceptible. 1 BYD = Barley Yellow Dwarf Virus.

14
Table 3. Three-year average summary of performance of entries in the Virginia Tech Hulless Barley Tests, 2015, 2016, and 2017 harvests. Hulless Lines
Yield (Bu/a @
48 lb/bu)
Test Weight (Lb/bu)
Date Headed (Julian)
Matu Heigh (In)
re t
Plant Lodgin
(0-9)
g
Leaf Rust (0-9
)
Net Blotc (0-9
h )
Powdery Mildew
(0-9)
Winte Surviv
(%)
r al
(14) (14) (6) (8) (14) (5) (8) (6) (2) VA06H-25 70.8 + 56.3 + 113 + 33 + 4 4 - 3 3 94 VA07H-35 WS 70.3 + 56.3 + 113 + 33 + 4 + 4 - 3 4 + 94 VA06H-79 70.1 + 55.4 113 + 32 3 - 8 + 2 - 1 - 94 Amaze 10 68.3 56.6 + 113 + 33 + 4 5 - 3 4 95 Doyce 62.4 - 52.4 - 109 - 31 - 4 5 6 + 1 - 96 VA08H-79 WS 62.3 - 54.0 - 114 + 33 3 9 + 2 - 8 + 97 + Eve 62.0 - 55.9 + 106 - 31 - 3 - 5 - 5 + 1 - 92 - Average 66.6 55.3 111 32 4 6 4 3 95 LSD (0.05) 3.0 0.5 0 1 0 1 1 1 2 C.V. 11.7 2.5 1 5 37 15 34 41 2 Released cultivars are shown in bold print. The number in parentheses below column headings indicates the number of location-years on which data are based. Varieties are ordered by descending yield averages. A plus or minus sign indicates a performance significantly above or below the test average. The 0-9 ratings indicate a genotype's response to disease or lodging where 0 = highly resistant and 9 = highly susceptible.

15
Table 4. Summary of performance of entries in the Virginia Tech Hulless Barley Test, Southern Piedmont AREC, Blackstone, VA, 2017 harvest. Yield Test Plant Powdery (Bu/a @ Weight Lodging Mildew Hulless Lines 48 lb/bu) (Lb/bu) (0-9) (0-9) VA14H-33 77.2 + 56.9 + 4 2 VA15H-90 WS 75.3 58.0 + 4 2 VA15H-116 WS 74.1 55.8 5 1 VA14H-58 73.5 57.3 + 4 1 VA15H-73 (2R) 72.8 57.1 + 2 - 1 VA15H-119 WS 72.5 56.1 4 1 VA15H-141 WS 72.3 56.3 5 1 VA15H-118 WS 70.8 56.8 5 2 VA06H-79 70.3 55.2 5 1 VA15H-140 WS 70.2 55.2 6 + 2 VA15H-79 WS 70.1 55.6 4 1 VA15H-138 WS 69.5 56.1 6 1 VA14H-110 68.3 57.1 + 4 2 VA15H-9 68.3 56.1 3 - 4 + VA15H-11 68.2 56.0 4 2 VA15H-12 67.9 56.7 4 2 VA15H-110 WS 67.8 56.3 4 2 VA14H-195 WS 67.7 55.2 5 1 VA15H-100 WS 67.6 56.9 + 4 2 VA15H-111 WS 67.2 55.8 4 1 VA07H-35 WS 65.8 54.7 - 5 3 VA15H-131 WS 65.6 55.5 4 1 VA15H-139 WS 63.1 55.7 5 1 VA08H-79 WS 62.4 53.9 - 7 + 9 + VA15H-85 WS 60.7 56.4 7 + 3 VA14H-3 60.3 56.6 3 - 1 Amaze 10 57.7 55.2 4 2 Eve 55.4 - 56.4 4 1 Doyce 54.3 - 51.2 - 4 1 VA06H-25 52.2 - 54.0 - 4 3 Average 67.0 55.9 4 2 LSD (0.05) 9.7 1.0 1 2 C.V. 10.3 1.2 22 102 Released cultivars are shown in bold print. Varieties are ordered by descending yield averages. A plus or minus sign indicates a performance significantly above or below the test average. The 0-9 ratings indicate a genotype's response to disease or lodging where 0 = highly resistant and 9 = highly susceptible.

16
Table 5. Summary of performance of entries in the Virginia Tech Hulless Barley Test, Tidewater AREC, Holland, VA, 2017 harvest. Yield Test Plant Leaf (Bu/a @ Weight Lodging Rust Hulless Lines 48 lb/bu) (Lb/bu) (0-9) (0-9 ) VA15H-9 66.3 + 54.9 4 5 VA15H-116 WS 64.7 54.3 5 5 VA15H-73 (2R) 64.3 53.7 2 - 3 VA15H-110 WS 63.4 53.5 3 - 3 VA15H-12 61.0 53.6 4 3 VA15H-90 WS 60.5 53.3 4 4 VA14H-58 59.3 54.2 4 6 VA14H-110 58.1 54.9 3 6 VA15H-118 WS 56.9 54.7 4 4 VA15H-79 WS 56.7 52.5 4 4 VA15H-100 WS 56.5 54.8 4 7 VA06H-25 56.1 53.2 5 5 VA15H-119 WS 55.7 54.4 4 3 Amaze 10 55.1 53.7 5 5 VA08H-79 WS 54.8 52.7 4 9 + VA15H-138 WS 54.7 53.9 4 3 VA15H-140 WS 54.6 52.8 5 4 VA15H-139 WS 54.4 53.0 5 5 VA15H-111 WS 54.1 54.4 3 4 VA15H-11 54.0 54.5 5 4 VA14H-195 WS 53.6 53.5 5 5 VA15H-131 WS 53.2 53.6 4 5 VA15H-85 WS 53.0 55.0 4 4 Doyce 52.9 48.8 - 4 9 + VA15H-141 WS 52.4 53.2 4 6 VA14H-33 52.1 55.0 3 4 Eve 52.0 54.2 5 5 VA07H-35 WS 50.6 53.5 5 5 VA06H-79 49.1 52.1 - 4 7 VA14H-3 47.2 54.6 3 4 Average 55.9 53.7 4 5 LSD (0.05) 10.0 1.3 1 3 C.V. 12.2 1.7 20 27 Released cultivars are shown in bold print. Varieties are ordered by descending yield averages. A plus or minus sign indicates a performance significantly above or below the test average. The 0-9 ratings indicate a genotype's response to disease or lodging where 0 = highly resistant and 9 = highly susceptible.
17
Table 6. Summary of performance of entries in the Virginia Tech Hulless Barley Test, Eastern Virginia AREC, Warsaw, VA, 2017 harvest. Hulless Lines
3-yea Av. Yie (Bu/a
r ld )
2-year Av. Yield (Bu/a)
Yield (Bu/a @
48 lb/bu)
Tes Weig (Lb/b
t ht u)
Date Headed (Julian)
Mature Height
(In)
Plan Lodg
(0-9
t ing )
Lea Rus (0-9
f t )
Early Height 1
(In)
Early Height 2
(In) VA15H-118 WS --- --- 71.4 + 57.4 + 101 + 37 + 4 - 3 - 6 12 VA15H-11 --- --- 70.0 + 56.6 + 101 35 6 3 - 6 13 VA15H-12 --- --- 66.2 + 57.1 + 101 34 6 2 - 6 12 VA15H-119 WS --- --- 65.2 + 57.3 + 101 + 36 + 5 - 3 7 11 VA14H-58 --- 71.6 + 65.1 + 57.2 + 99 - 34 6 3 - 7 13 VA15H-9 --- --- 64.9 + 54.8 101 + 33 5 - 3 - 7 13 VA15H-79 WS --- --- 64.0 + 54.3 98 - 33 6 3 - 9 + 15 + VA15H-116 WS --- --- 63.0 + 55.7 101 + 37 + 6 4 6 12 VA15H-90 WS --- --- 62.0 57.8 + 101 + 34 5 3 5 - 10 - VA15H-73 (2R) --- --- 61.4 57.6 + 104 + 36 + 3 - 5 6 11 VA14H-33 --- 63.9 + 61.0 55.7 98 - 35 5 - 3 - 8 + 14 VA15H-111 WS --- --- 60.2 55.5 101 + 33 6 3 6 12 VA15H-131 WS --- --- 59.6 55.5 101 + 33 6 4 6 11 VA14H-110 --- 67.4 + 59.5 56.6 + 98 - 35 6 4 7 12 VA15H-85 WS --- --- 58.8 57.1 + 100 38 + 5 4 7 13 VA07H-35 WS 75.8 + 62.9 + 57.1 55.0 101 + 33 7 5 7 12 Amaze 10 73.7 + 61.3 55.4 54.2 102 + 34 7 + 5 8 12 VA06H-25 76.1 + 59.6 53.8 54.5 102 + 32 - 7 4 6 11 VA15H-110 WS --- --- 53.4 54.8 101 33 6 4 7 13 VA15H-141 WS --- --- 52.3 56.0 101 33 7 + 4 6 11 VA14H-3 --- 56.5 52.1 55.5 96 - 31 - 4 - 2 - 11 + 15 + VA15H-139 WS --- --- 51.6 55.3 100 33 7 4 5 - 11 - VA15H-138 WS --- --- 51.6 55.5 100 33 7 + 5 6 - 12 VA15H-100 WS --- --- 51.3 54.3 101 + 34 7 6 + 7 11 VA14H-195 WS --- 64.1 + 50.5 54.6 99 - 33 7 + 5 + 6 - 12 Eve 59.7 - 50.4 - 49.6 - 54.9 95 - 31 - 5 4 9 + 16 + VA15H-140 WS --- --- 49.6 - 54.8 101 33 7 + 4 6 - 11 - VA06H-79 66.2 51.3 - 39.8 - 52.6 - 102 + 32 - 7 + 8 + 8 + 13 Doyce 61.0 - 47.0 - 32.6 - 45.8 - 98 - 31 - 7 + 6 + 10 + 16 + VA08H-79 WS 52.3 - 38.3 - 32.2 - 52.0 - 104 + 32 - 7 + 9 + 5 - 9 - Average 66.4 57.9 56.2 55.2 100 34 6 4 7 12 LSD (0.05) 4.9 4.8 6.4 1.0 1 2 1 1 1 2 C.V. 8.9 8.3 8.1 1.3 1 3 10 17 10 10 Released cultivars are shown in bold print. Varieties are ordered by descending yield averages. A plus or minus sign indicates a performance significantly above or below the test average. The 0-9 ratings indicate a genotype's response to disease or lodging where 0 = highly resistant and 9 = highly susceptible.
18
Table 7. Summary of performance of entries in the Virginia Tech Hulless Barley Test, Eastern Shore AREC, Painter, VA, 2017 harvest. Yield Test Leaf (Bu/a @ Weight Rust Hulless Lines 48 lb/bu) (Lb/bu) (0-9) VA15H-119 WS 61.8 + 53.7 9 VA14H-58 60.4 + 54.0 8 VA15H-12 59.4 53.9 9 VA15H-9 59.2 51.8 8 Amaze 10 58.7 51.9 8 VA15H-90 WS 57.8 54.7 8 VA14H-33 56.6 51.9 8 - VA15H-11 56.4 55.0 + 8 VA14H-110 56.0 53.0 9 VA15H-79 WS 54.3 49.7 8 VA15H-118 WS 54.2 53.5 8 VA15H-131 WS 52.6 52.1 8 VA15H-139 WS 52.6 52.0 9 Eve 51.8 48.9 9 VA15H-140 WS 51.5 51.9 9 VA14H-3 49.8 51.1 9 VA15H-116 WS 49.0 52.0 9 VA14H-195 WS 47.0 50.9 9 VA15H-85 WS 46.8 52.8 9 VA15H-110 WS 46.6 51.9 9 VA15H-100 WS 45.6 47.3 8 VA06H-25 44.4 51.8 8 VA15H-138 WS 43.8 51.0 9 VA15H-111 WS 42.6 54.3 9 VA15H-73 (2R) 41.8 52.2 9 VA15H-141 WS 41.6 51.8 9 Doyce 39.1 38.1 - 9 VA07H-35 WS 38.2 50.3 8 VA06H-79 29.4 - 44.5 - 9 VA08H-79 WS 27.7 - 41.2 - 9 Average 49.2 51.0 8 LSD (0.05) 11.2 3.9 1 C.V. 15.6 5.4 6 Released cultivars are shown in bold print. Varieties are ordered by descending yield averages. A plus or minus sign indicates a performance significantly above or below the test average. The 0-9 ratings indicate a genotype's response to disease or lodging where 0 = highly resistant and 9 = highly susceptible. Note: this location was severely affected by stripe rust and leaf rust, reducing yields.
19
Table 8. Summary of performance of entries in the Virginia Tech Hulless Barley Test, Northern Piedmont Center, Orange, VA, 2017 harvest. Yield Test Mature Plant Net (Bu/a @ Weight Height Lodging Blotch Hulless Lines 48 lb/bu) (Lb/bu) (In) (0-9) (0-9) VA14H-58 83.1 + 56.5 28 0 3 - VA08H-79 WS 79.2 + 56.8 30 2 4 VA06H-79 75.2 55.1 26 - 0 3 - VA15H-9 74.6 53.4 - 30 1 4 VA15H-11 74.1 55.1 28 1 3 - VA14H-33 74.1 54.7 28 2 5 VA15H-138 WS 72.7 58.2 + 28 0 4 VA15H-111 WS 71.7 56.8 31 + 1 7 + VA15H-141 WS 70.9 58.2 + 28 1 4 VA15H-119 WS 69.9 56.7 28 1 6 VA15H-118 WS 69.8 57.9 + 28 0 4 VA15H-12 69.4 56.7 28 0 3 - VA15H-73 (2R) 68.8 56.5 28 0 6 + VA15H-85 WS 68.0 56.5 31 + 2 5 VA15H-140 WS 67.0 57.8 + 28 1 5 VA15H-90 WS 67.0 57.3 30 0 5 VA15H-100 WS 66.6 56.4 29 1 5 VA06H-25 66.3 56.4 27 2 4 - VA15H-139 WS 65.5 58.6 + 30 1 5 VA15H-110 WS 65.0 56.3 30 0 7 + VA14H-195 WS 63.1 57.8 + 29 3 + 4 VA15H-116 WS 61.5 56.7 31 + 0 6 VA14H-110 60.6 54.9 27 1 3 - Eve 60.6 54.9 28 2 8 + VA07H-35 WS 60.2 56.6 27 3 4 - VA15H-79 WS 60.2 52.0 - 29 3 5 VA15H-131 WS 58.5 55.3 27 2 4 Amaze 10 58.3 56.5 28 2 4 VA14H-3 56.4 56.4 29 1 2 - Doyce 48.4 - 48.5 - 27 2 8 + Average 66.9 56.0 28 1 5 LSD (0.05) 10.6 1.4 2 2 1 C.V. 11.2 1.7 5 122 17 Released cultivars are shown in bold print. Varieties are ordered by descending yield averages. A plus or minus sign indicates a performance significantly above or below the test average. The 0-9 ratings indicate a genotype's response to disease or lodging where 0 = highly resistant and 9 = highly susceptible.
20
Table 9. Summary of performance of entries in the Virginia Tech Hulless Barley Test, Kentland Farm, Blacksburg, VA, 2017 harvest. Hulless Lines
3-yea Av. Yie (Bu/a
r ld )
2-year Av. Yield (Bu/a)
Yield (Bu/a @
48 lb/bu)
Test Weig (Lb/b
ht u)
Date Headed (Julian)
Mature Height
(In)
Plant Lodging
(0-9)
Leaf Rust (0-9
)
Net Blotch (0-9)
VA14H-58 --- 84.5 + 101.3 + 57.3 + 109 36 2 5 7 VA15H-12 --- --- 100.8 + 56.2 110 36 1 4 - 7 VA15H-11 --- --- 95.8 + 56.3 110 35 1 4 - 6 VA14H-33 --- 81.0 + 94.3 + 56.8 + 109 - 34 0 5 5 VA15H-79 WS --- --- 92.7 + 56.0 108 - 34 0 5 5 VA14H-195 WS --- 83.4 + 91.3 55.3 109 - 36 3 + 6 6 VA15H-90 WS --- --- 88.6 57.1 + 110 35 3 4 7 VA07H-35 WS 79.6 + 68.3 88.3 55.0 - 112 + 35 1 5 6 VA15H-9 --- --- 87.0 56.0 110 34 0 4 - 8 + VA15H-138 WS --- --- 85.0 55.6 111 34 2 7 + 6 VA06H-25 78.7 + 69.1 84.7 55.0 112 + 35 1 5 6 VA14H-3 --- 76.7 + 84.6 58.3 + 106 - 34 1 4 - 8 + VA14H-110 --- 73.8 84.2 56.7 108 - 37 + 0 6 5 VA06H-79 78.7 + 74.6 83.6 54.8 - 111 35 1 8 + 5 - VA15H-85 WS --- --- 82.3 57.2 + 111 + 37 + 1 5 7 VA15H-118 WS --- --- 81.8 56.3 112 + 36 0 6 6 VA15H-119 WS --- --- 81.3 56.1 111 36 1 5 6 VA15H-73 (2R) --- --- 81.0 54.7 - 110 36 1 7 6 VA15H-139 WS --- --- 80.4 55.2 110 34 2 7 5 VA15H-110 WS --- --- 80.2 56.1 111 + 35 1 5 7 VA15H-111 WS --- --- 80.0 56.5 111 33 1 5 7 VA15H-141 WS --- --- 79.4 55.5 111 33 1 7 5 VA15H-131 WS --- --- 79.0 55.5 110 35 1 6 5 Amaze 10 75.6 65.2 - 78.6 54.8 - 112 + 34 0 6 5 Doyce 67.4 - 59.3 - 76.4 54.6 - 109 - 33 - 2 4 - 8 + VA15H-140 WS --- --- 76.2 55.0 - 111 32 - 1 7 5 VA15H-100 WS --- --- 75.9 56.6 111 35 0 8 + 5 VA15H-116 WS --- --- 73.8 - 55.4 112 + 36 1 5 6 Eve 68.9 - 60.5 - 73.1 - 56.6 105 - 32 - 1 5 9 + VA08H-79 WS 72.8 63.9 - 63.5 - 53.4 - 113 + 32 - 1 8 + 5 Average 74.5 71.7 83.5 55.8 110 35 1 5 6 LSD (0.05) 3.7 4.5 8.6 0.9 1 2 2 1 1 C.V. 5.9 6.2 7.3 1.1 1 4 156 18 16 Released cultivars are shown in bold print. Varieties are ordered by descending yield averages. A plus or minus sign indicates a performance significantly above or below the test average. The 0-9 ratings indicate a genotype's response to disease or lodging where 0 = highly resistant and 9 = highly susceptible.
21
Table 10. Summary of performance of barley entries in the Virginia Tech Barley Test, 2017 harvest. Yield Test Date Mature Plant Leaf Net Powdery (Bu/a @ Weight Headed Height Lodging Rust Blotch Mildew Awns1
Barley Lines 48 lb/bu) (Lb/bu) (Julian) (In) (0-9) (0-9) (0-9) (0-9) (4) (4) (2) (2) (5) (3) (1) (1) VA14B-79 104.6 + 41.8 104 33 3 3 - 3 0 SA VA14B-63 102.9 + 43.1 + 105 + 33 3 - 3 - 4 1 SA VA14B-74 100.0 + 42.1 106 + 34 3 3 - 3 0 SA Secretariat 99.1 + 43.4 + 102 - 32 - 4 1 - 3 0 SA VA15B-79 98.8 + 43.4 + 103 34 3 3 - 3 0 SA VA14B-57 97.5 + 43.0 + 104 34 3 3 - 3 0 SA Thoroughbred 95.7 41.0 - 107 + 33 3 8 + 7 + 5 + LA VA14B-78 95.6 42.9 + 102 - 34 3 3 - 3 1 SA VA13B-25 LA 95.6 42.9 + 101 - 32 4 3 - 4 0 LA VA14B-75 95.6 41.6 104 32 3 2 - 3 0 SA VA15B-33 95.4 44.0 + 104 30 - 2 - 3 - 3 0 SA VA15B-5 95.0 43.1 + 104 32 2 - 2 - 3 0 SA VA12B-30 94.6 41.8 108 + 34 4 6 + 3 0 SA VA15B-8 94.0 41.6 103 33 4 2 - 4 2 SA VA12B-8 LA 94.0 41.2 - 105 + 36 + 3 6 + 7 + 1 LA VA15B-78 93.9 45.1 + 105 + 35 + 3 5 + 4 0 SA VA14B-59 93.7 41.4 - 103 32 3 3 - 2 - 0 SA VA12B-41 92.9 42.1 105 + 34 4 3 - 3 0 SA VA14B-73 92.8 42.5 103 34 3 3 - 3 0 SA VA15B-89 (LA) 92.7 41.8 106 + 34 3 7 + 6 + 2 + LA VA11B-141 LA 92.6 43.9 + 105 + 36 + 3 4 4 0 LA VA12B-56 92.5 41.2 - 101 - 30 - 3 6 + 4 0 SA VA14BFHB-83 92.5 43.2 + 103 34 4 2 - 3 0 SA Atlantic 91.6 41.5 - 101 - 31 - 3 6 + 4 1 SA VA15B-98 (LA) 91.0 41.9 104 33 3 7 + 7 + 0 LA VA11B-102 LA 91.0 40.7 - 106 + 35 + 3 3 - 3 0 LA VA15B-65 90.7 41.5 101 - 34 4 + 6 + 4 0 SA VA08B-95 89.9 41.6 102 - 33 5 + 3 - 3 8 + SA VA15B-60 89.8 41.9 101 - 30 - 3 6 + 5 0 SA VA14B-71 87.8 43.4 + 103 - 33 4 + 3 - 3 0 SA Flavia 86.7 43.3 + 111 + 26 - 2 - 4 5 1 2R,LA VA15B-54 86.5 42.3 104 33 4 + 5 3 0 SA Price 84.5 - 42.0 102 - 31 - 3 5 + 7 + 0 SA VA15B-83 (LA) 83.9 - 42.0 101 - 33 5 + 6 + 5 + 0 LA Violetta 83.6 - 44.0 + 107 + 29 - 2 - 3 - 4 1 2R, LA Callao 82.0 - 40.2 - 101 - 29 - 6 + 5 + 4 0 SA VA15B-67 81.9 - 41.1 - 102 - 33 4 + 6 + 3 0 SA Nomini 75.1 - 39.9 - 101 - 39 + 3 6 + 1 - 0 AL Barsoy 75.1 - 40.3 - 101 - 33 4 8 + 4 0 LA Wysor 72.7 - 39.3 - 102 - 40 + 4 8 + 4 0 AL
22
Table 10. Summary of performance of barley entries in the Virginia Tech Barley Test, 2017 harvest. Barley Lines
Yield (Bu/a @
48 lb/bu)
Test Weight (Lb/bu)
Date Headed (Julian)
Matur Heigh
(In)
e t
Plant Lodging
(0-9)
Leaf Rus (0-9
t )
Net Blotc (0-9
h )
Powdery Mildew
(0-9)
Awns1
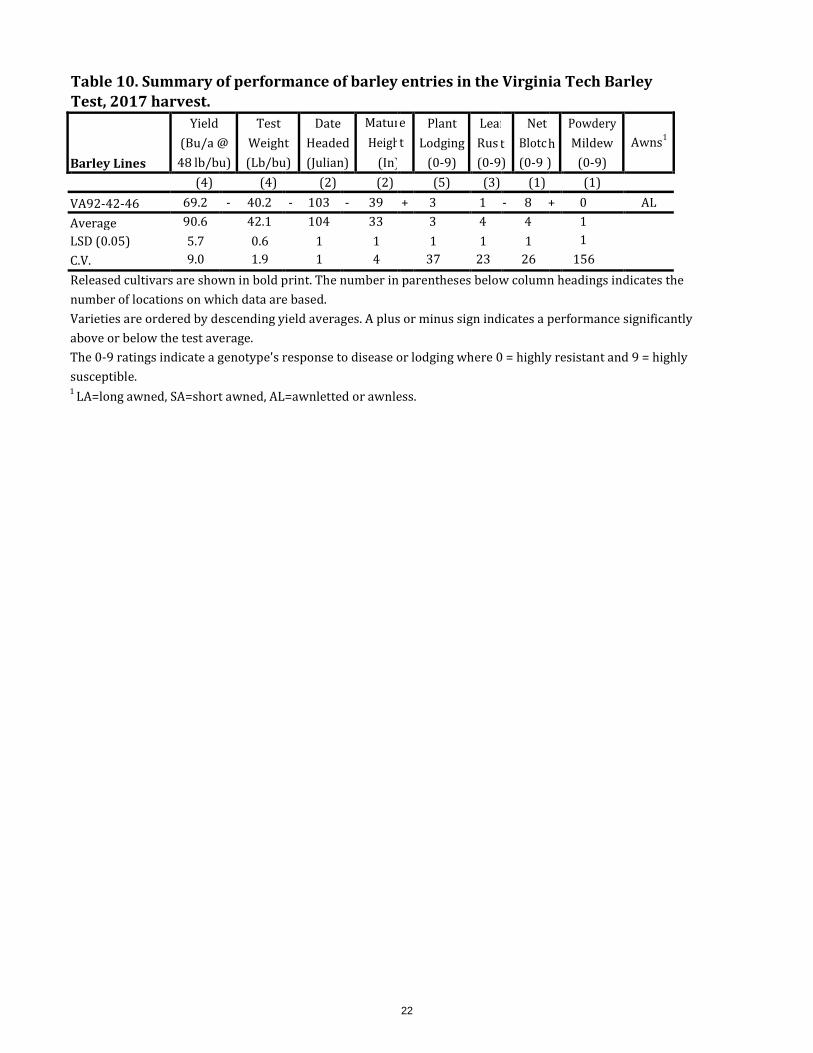
(4) (4) (2) (2) (5) (3) (1) (1) VA92-42-46 69.2 - 40.2 - 103 - 39 + 3 1 - 8 + 0 AL Average 90.6 42.1 104 33 3 4 4 1 LSD (0.05) 5.7 0.6 1 1 1 1 1 1 C.V. 9.0 1.9 1 4 37 23 26 156 Released cultivars are shown in bold print. The number in parentheses below column headings indicates the number of locations on which data are based. Varieties are ordered by descending yield averages. A plus or minus sign indicates a performance significantly above or below the test average. The 0-9 ratings indicate a genotype's response to disease or lodging where 0 = highly resistant and 9 = highly susceptible. 1 LA=long awned, SA=short awned, AL=awnletted or awnless.
23
Table 11. Two-year average summary of performance of hulled entries in the Virginia Tech Barley Tests, 2016 and 2017 harvests. Barley Lines
Yield (Bu/a 48 lb/b
@ u)
Test Weight (Lb/bu)
Date Headed (Julian)
Matur Heigh
(In)
e t
Plant Lodging
(0-9)
Leaf Rust (0-9)
Net Blotc (0-9
h )
Powdery Mildew
(0-9)
BYD Virus (0-9)
1 Winter Survival
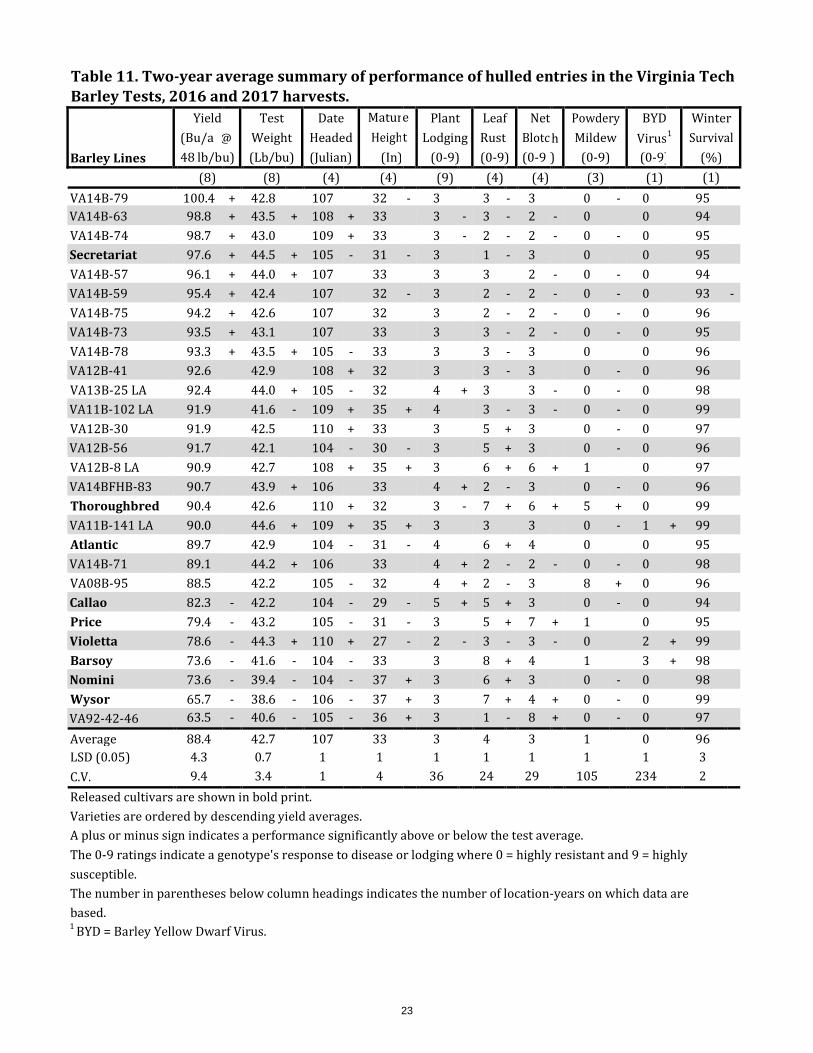
(%) (8) (8) (4) (4) (9) (4) (4) (3) (1) (1) VA14B-79 100.4 + 42.8 107 32 - 3 3 - 3 0 - 0 95 VA14B-63 98.8 + 43.5 + 108 + 33 3 - 3 - 2 - 0 0 94 VA14B-74 98.7 + 43.0 109 + 33 3 - 2 - 2 - 0 - 0 95 Secretariat 97.6 + 44.5 + 105 - 31 - 3 1 - 3 0 0 95 VA14B-57 96.1 + 44.0 + 107 33 3 3 2 - 0 - 0 94 VA14B-59 95.4 + 42.4 107 32 - 3 2 - 2 - 0 - 0 93 - VA14B-75 94.2 + 42.6 107 32 3 2 - 2 - 0 - 0 96 VA14B-73 93.5 + 43.1 107 33 3 3 - 2 - 0 - 0 95 VA14B-78 93.3 + 43.5 + 105 - 33 3 3 - 3 0 0 96 VA12B-41 92.6 42.9 108 + 32 3 3 - 3 0 - 0 96 VA13B-25 LA 92.4 44.0 + 105 - 32 4 + 3 3 - 0 - 0 98 VA11B-102 LA 91.9 41.6 - 109 + 35 + 4 3 - 3 - 0 - 0 99 VA12B-30 91.9 42.5 110 + 33 3 5 + 3 0 - 0 97 VA12B-56 91.7 42.1 104 - 30 - 3 5 + 3 0 - 0 96 VA12B-8 LA 90.9 42.7 108 + 35 + 3 6 + 6 + 1 0 97 VA14BFHB-83 90.7 43.9 + 106 33 4 + 2 - 3 0 - 0 96 Thoroughbred 90.4 42.6 110 + 32 3 - 7 + 6 + 5 + 0 99 VA11B-141 LA 90.0 44.6 + 109 + 35 + 3 3 3 0 - 1 + 99 Atlantic 89.7 42.9 104 - 31 - 4 6 + 4 0 0 95 VA14B-71 89.1 44.2 + 106 33 4 + 2 - 2 - 0 - 0 98 VA08B-95 88.5 42.2 105 - 32 4 + 2 - 3 8 + 0 96 Callao 82.3 - 42.2 104 - 29 - 5 + 5 + 3 0 - 0 94 Price 79.4 - 43.2 105 - 31 - 3 5 + 7 + 1 0 95 Violetta 78.6 - 44.3 + 110 + 27 - 2 - 3 - 3 - 0 2 + 99 Barsoy 73.6 - 41.6 - 104 - 33 3 8 + 4 1 3 + 98 Nomini 73.6 - 39.4 - 104 - 37 + 3 6 + 3 0 - 0 98 Wysor 65.7 - 38.6 - 106 - 37 + 3 7 + 4 + 0 - 0 99 VA92-42-46 63.5 - 40.6 - 105 - 36 + 3 1 - 8 + 0 - 0 97 Average 88.4 42.7 107 33 3 4 3 1 0 96 LSD (0.05) 4.3 0.7 1 1 1 1 1 1 1 3 C.V. 9.4 3.4 1 4 36 24 29 105 234 2 Released cultivars are shown in bold print. Varieties are ordered by descending yield averages. A plus or minus sign indicates a performance significantly above or below the test average. The 0-9 ratings indicate a genotype's response to disease or lodging where 0 = highly resistant and 9 = highly susceptible. The number in parentheses below column headings indicates the number of location-years on which data are based. 1 BYD = Barley Yellow Dwarf Virus.
24
Table 12. Three-year average summary of performance of hulled entries in the Virginia Tech Barley Tests, 2015, 2016, and 2017 harvests. Barley Lines
Yield (Bu/a @
48 lb/bu)
Test Weight (Lb/bu
)
Date Headed (Julian)
Mature Height
(In)
Plant Lodgin
(0-9)
g
Leaf Rust (0-9
)
Net Blotc (0-9
h )
Powdery Mildew
(0-9)
Winter Survival
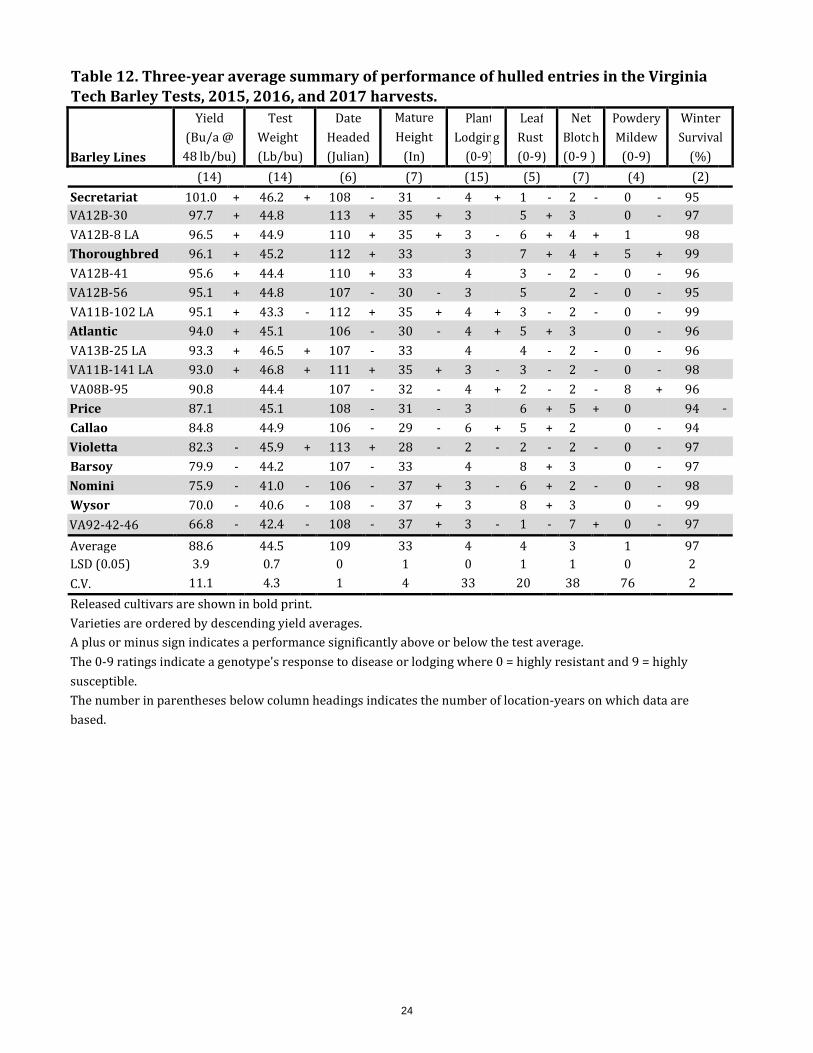
(%) (14) (14) (6) (7) (15) (5) (7) (4) (2) Secretariat 101.0 + 46.2 + 108 - 31 - 4 + 1 - 2 - 0 - 95 VA12B-30 97.7 + 44.8 113 + 35 + 3 5 + 3 0 - 97 VA12B-8 LA 96.5 + 44.9 110 + 35 + 3 - 6 + 4 + 1 98 Thoroughbred 96.1 + 45.2 112 + 33 3 7 + 4 + 5 + 99 VA12B-41 95.6 + 44.4 110 + 33 4 3 - 2 - 0 - 96 VA12B-56 95.1 + 44.8 107 - 30 - 3 5 2 - 0 - 95 VA11B-102 LA 95.1 + 43.3 - 112 + 35 + 4 + 3 - 2 - 0 - 99 Atlantic 94.0 + 45.1 106 - 30 - 4 + 5 + 3 0 - 96 VA13B-25 LA 93.3 + 46.5 + 107 - 33 4 4 - 2 - 0 - 96 VA11B-141 LA 93.0 + 46.8 + 111 + 35 + 3 - 3 - 2 - 0 - 98 VA08B-95 90.8 44.4 107 - 32 - 4 + 2 - 2 - 8 + 96 Price 87.1 45.1 108 - 31 - 3 6 + 5 + 0 94 - Callao 84.8 44.9 106 - 29 - 6 + 5 + 2 0 - 94 Violetta 82.3 - 45.9 + 113 + 28 - 2 - 2 - 2 - 0 - 97 Barsoy 79.9 - 44.2 107 - 33 4 8 + 3 0 - 97 Nomini 75.9 - 41.0 - 106 - 37 + 3 - 6 + 2 - 0 - 98 Wysor 70.0 - 40.6 - 108 - 37 + 3 8 + 3 0 - 99 VA92-42-46 66.8 - 42.4 - 108 - 37 + 3 - 1 - 7 + 0 - 97 Average 88.6 44.5 109 33 4 4 3 1 97 LSD (0.05) 3.9 0.7 0 1 0 1 1 0 2 C.V. 11.1 4.3 1 4 33 20 38 76 2 Released cultivars are shown in bold print. Varieties are ordered by descending yield averages. A plus or minus sign indicates a performance significantly above or below the test average. The 0-9 ratings indicate a genotype's response to disease or lodging where 0 = highly resistant and 9 = highly susceptible. The number in parentheses below column headings indicates the number of location-years on which data are based.
25
Table 13. Summary of performance of barley entries in the Virginia Tech Barley Test, Southern Piedmont AREC, Blackstone, VA, 2017 harvest. Yield Test Plant Powdery (Bu/a @ Weight Lodging Mildew Barley Lines 48 lb/bu) (Lb/bu) (0-9) (0-9) Thoroughbred 100.3 + 40.0 5 5 + VA14B-63 98.0 42.1 + 5 1 VA15B-78 97.7 43.7 + 7 0 VA14B-79 96.9 40.4 4 0 Secretariat 96.6 40.9 7 0 VA12B-56 94.4 39.9 6 0 VA15B-98 (LA) 94.3 40.8 5 0 VA14B-74 94.0 41.2 5 0 Flavia 93.4 42.2 + 5 1 VA15B-79 92.8 42.2 + 4 0 VA14B-57 92.5 41.1 5 0 VA15B-89 (LA) 92.3 41.4 5 2 + VA14B-75 91.9 40.2 5 0 VA12B-30 91.8 41.7 6 0 VA14B-78 91.4 42.1 + 5 1 VA15B-33 91.3 43.9 + 3 - 0 Atlantic 90.5 40.3 5 1 VA11B-141 LA 90.5 42.5 + 4 0 VA15B-5 90.3 41.7 3 - 0 VA12B-8 LA 89.8 40.2 5 1 VA15B-65 89.2 40.2 7 0 VA13B-25 LA 87.9 40.3 6 0 VA14B-59 86.7 40.4 4 0 VA14B-73 86.3 41.9 5 0 VA14BFHB-83 85.6 40.7 8 + 0 VA12B-41 85.0 40.6 7 0 Nomini 83.3 39.2 - 5 0 Barsoy 82.8 38.8 - 5 0 VA15B-67 82.3 40.5 6 0 Price 82.3 40.6 4 0 VA15B-60 81.6 41.8 5 0 Wysor 80.3 37.7 - 7 0 VA15B-54 79.9 40.4 8 + 0 VA11B-102 LA 79.6 38.5 - 6 0 VA15B-8 79.0 40.2 7 2 Violetta 77.5 42.1 + 4 1 VA14B-71 75.6 41.8 7 0 VA92-42-46 74.8 - 38.2 - 6 0 VA08B-95 74.7 - 39.8 8 + 8 + Callao 73.1 - 39.0 - 8 + 0 VA15B-83 (LA) 72.1 - 41.5 7 0
26
Table 13. Summary of performance of barley entries in the Virginia Tech Barley Test, Southern Piedmont AREC, Blackstone, VA, 2017 harvest.
Average 87.1 40.8 5 1 LSD (0.05) 11.8 1.2 2 1 C.V. 9.5 2.1 26 156 Released cultivars are shown in bold print. Varieties are ordered by descending yield averages. A plus or minus sign indicates a performance significantly above or below the test average. The 0-9 ratings indicate a genotype's response to disease or lodging where 0 = highly resistant and 9 = highly susceptible.
Barley Lines
Yield Test Plant Powdery (Bu/a @ Weight Lodging Mildew
48 lb/bu) (Lb/bu) (0-9) (0-9)
27
Table 14. Summary of performance of barley entries in the Virginia Tech Barley Test, planted no-till at the Tidewater AREC, Holland, VA, 2017 harvest. Yield Test Plant Leaf (Bu/a @ Weight Lodging Rust Barley Lines 48 lb/bu) (Lb/bu) (0-9) (0-9) Flavia 78.8 + 42.7 + 3 - 4 Thoroughbred 76.1 + 39.5 - 4 8 + VA12B-30 75.4 40.1 4 6 + VA14B-74 75.1 40.1 4 2 - VA12B-8 LA 74.4 40.1 4 6 + VA12B-56 73.6 40.5 4 6 + VA15B-89 (LA) 73.3 40.7 5 6 + VA14B-57 72.0 41.4 4 3 VA15B-78 71.7 42.7 + 4 3 VA08B-95 71.7 39.8 - 5 2 - VA14B-79 71.4 39.4 - 4 3 VA14B-63 71.0 41.5 4 2 - VA14BFHB-83 70.9 41.1 4 2 - VA15B-79 70.8 40.8 5 2 - Violetta 70.7 42.9 + 4 3 VA14B-73 70.5 40.6 4 2 - VA15B-8 70.3 40.2 4 2 - VA13B-25 LA 70.2 41.9 + 4 3 VA15B-60 70.1 41.1 3 - 7 + VA15B-67 70.1 40.4 5 5 VA15B-98 (LA) 70.0 40.9 4 7 + VA14B-78 70.0 41.3 4 3 - VA15B-54 69.9 42.2 + 4 5 Price 69.9 40.4 4 5 Atlantic 68.8 40.3 5 6 + VA14B-75 68.1 40.0 5 3 - VA14B-71 67.0 40.9 4 2 - VA15B-33 66.6 41.9 + 3 - 3 - VA15B-65 66.3 40.5 4 7 + VA14B-59 66.2 39.3 - 4 2 - Secretariat 66.0 41.3 5 1 - Callao 65.7 40.4 5 + 5 VA11B-102 LA 64.7 39.3 - 5 3 - VA12B-41 64.1 39.5 - 5 3 VA11B-141 LA 63.7 43.0 + 4 4 VA15B-5 62.2 41.6 + 4 2 - Barsoy 61.1 40.3 4 8 + Nomini 56.7 - 38.8 - 4 7 + Wysor 56.3 - 38.7 - 5 7 + VA15B-83 (LA) 54.6 - 42.5 + 5 7 + VA92-42-46 48.3 - 38.9 - 4 1 -
28
Table 14. Summary of performance of barley entries in the Virginia Tech Barley Test, planted no-till at the Tidewater AREC, Holland, VA, 2017 harvest.
Average 68.2 40.7 4 4 LSD (0.05) 7.9 0.8 1 1 C.V. 8.1 1.5 15 25 Released cultivars are shown in bold print. Varieties are ordered by descending yield averages. A plus or minus sign indicates a performance significantly above or below the test average. The 0-9 ratings indicate a genotype's response to disease or lodging where 0 = highly resistant and 9 = highly susceptible.
Barley Lines
Yield Test Plant Leaf (Bu/a @ Weight Lodging Rust
48 lb/bu) (Lb/bu) (0-9) (0-9)
29
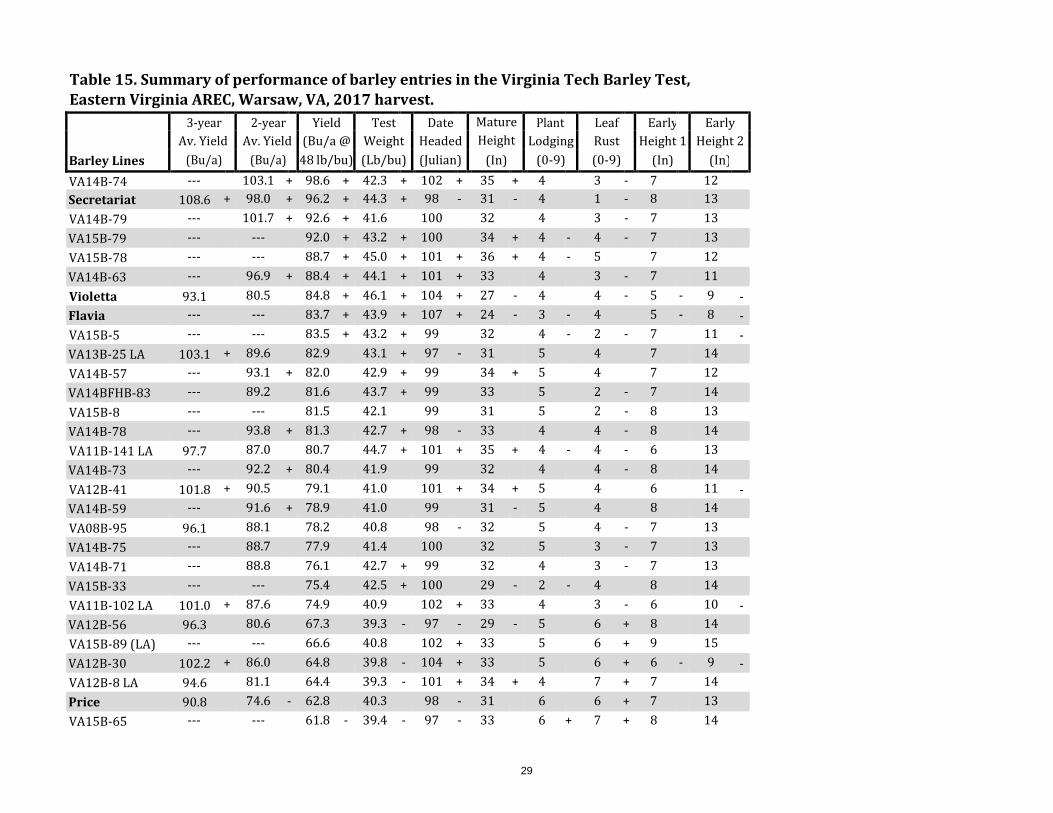
Table 15. Summary of performance of barley entries in the Virginia Tech Barley Test, Eastern Virginia AREC, Warsaw, VA, 2017 harvest. 3-year 2-year Yield Test Date Mature Plant Leaf Early Early Av. Yield Av. Yield (Bu/a @ Weight Headed Height Lodging Rust Height 1 Height 2 Barley Lines (Bu/a) (Bu/a) 48 lb/bu) (Lb/bu) (Julian) (In) (0-9) (0-9) (In) (In) VA14B-74 --- 103.1 + 98.6 + 42.3 + 102 + 35 + 4 3 - 7 12 Secretariat 108.6 + 98.0 + 96.2 + 44.3 + 98 - 31 - 4 1 - 8 13 VA14B-79 --- 101.7 + 92.6 + 41.6 100 32 4 3 - 7 13 VA15B-79 --- --- 92.0 + 43.2 + 100 34 + 4 - 4 - 7 13 VA15B-78 --- --- 88.7 + 45.0 + 101 + 36 + 4 - 5 7 12 VA14B-63 --- 96.9 + 88.4 + 44.1 + 101 + 33 4 3 - 7 11 Violetta 93.1 80.5 84.8 + 46.1 + 104 + 27 - 4 4 - 5 - 9 - Flavia --- --- 83.7 + 43.9 + 107 + 24 - 3 - 4 5 - 8 - VA15B-5 --- --- 83.5 + 43.2 + 99 32 4 - 2 - 7 11 - VA13B-25 LA 103.1 + 89.6 82.9 43.1 + 97 - 31 5 4 7 14 VA14B-57 --- 93.1 + 82.0 42.9 + 99 34 + 5 4 7 12 VA14BFHB-83 --- 89.2 81.6 43.7 + 99 33 5 2 - 7 14 VA15B-8 --- --- 81.5 42.1 99 31 5 2 - 8 13 VA14B-78 --- 93.8 + 81.3 42.7 + 98 - 33 4 4 - 8 14 VA11B-141 LA 97.7 87.0 80.7 44.7 + 101 + 35 + 4 - 4 - 6 13 VA14B-73 --- 92.2 + 80.4 41.9 99 32 4 4 - 8 14 VA12B-41 101.8 + 90.5 79.1 41.0 101 + 34 + 5 4 6 11 - VA14B-59 --- 91.6 + 78.9 41.0 99 31 - 5 4 8 14 VA08B-95 96.1 88.1 78.2 40.8 98 - 32 5 4 - 7 13 VA14B-75 --- 88.7 77.9 41.4 100 32 5 3 - 7 13 VA14B-71 --- 88.8 76.1 42.7 + 99 32 4 3 - 7 13 VA15B-33 --- --- 75.4 42.5 + 100 29 - 2 - 4 8 14 VA11B-102 LA 101.0 + 87.6 74.9 40.9 102 + 33 4 3 - 6 10 - VA12B-56 96.3 80.6 67.3 39.3 - 97 - 29 - 5 6 + 8 14 VA15B-89 (LA) --- --- 66.6 40.8 102 + 33 5 6 + 9 15 VA12B-30 102.2 + 86.0 64.8 39.8 - 104 + 33 5 6 + 6 - 9 - VA12B-8 LA 94.6 81.1 64.4 39.3 - 101 + 34 + 4 7 + 7 14 Price 90.8 74.6 - 62.8 40.3 98 - 31 6 6 + 7 13 VA15B-65 --- --- 61.8 - 39.4 - 97 - 33 6 + 7 + 8 14
30
Table 15. Summary of performance of barley entries in the Virginia Tech Barley Test, Eastern Virginia AREC, Warsaw, VA, 2017 harvest. Barley Lines
3-yea Av. Yie (Bu/a
r ld )
2-yea Av. Yie (Bu/a
r ld )
Yield (Bu/a @
48 lb/bu)
Test Weight (Lb/bu)
Date Headed (Julian)
Mature Height
(In)
Plant Lodging
(0-9)
Leaf Rust (0-9)
Early Height 1
(In)
Earl Heigh
(In)
y t 2
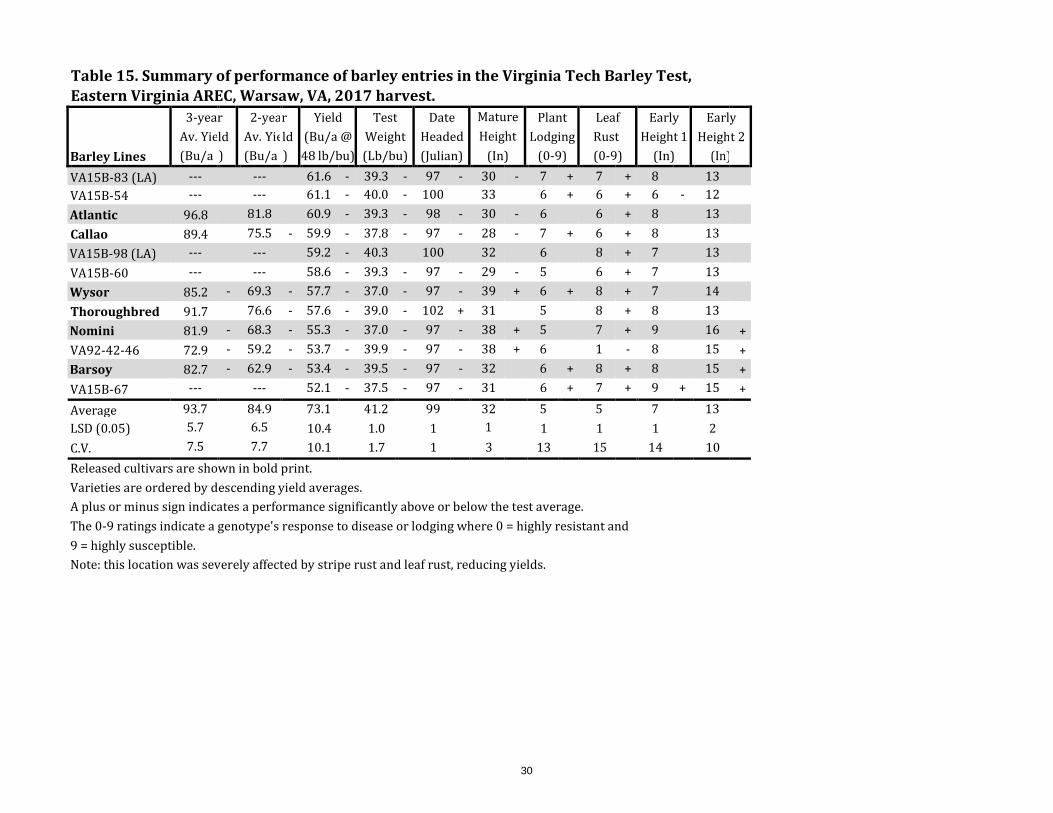
VA15B-83 (LA) --- --- 61.6 - 39.3 - 97 - 30 - 7 + 7 + 8 13 VA15B-54 --- --- 61.1 - 40.0 - 100 33 6 + 6 + 6 - 12 Atlantic 96.8 81.8 60.9 - 39.3 - 98 - 30 - 6 6 + 8 13 Callao 89.4 75.5 - 59.9 - 37.8 - 97 - 28 - 7 + 6 + 8 13 VA15B-98 (LA) --- --- 59.2 - 40.3 100 32 6 8 + 7 13 VA15B-60 --- --- 58.6 - 39.3 - 97 - 29 - 5 6 + 7 13 Wysor 85.2 - 69.3 - 57.7 - 37.0 - 97 - 39 + 6 + 8 + 7 14 Thoroughbred 91.7 76.6 - 57.6 - 39.0 - 102 + 31 5 8 + 8 13 Nomini 81.9 - 68.3 - 55.3 - 37.0 - 97 - 38 + 5 7 + 9 16 + VA92-42-46 72.9 - 59.2 - 53.7 - 39.9 - 97 - 38 + 6 1 - 8 15 + Barsoy 82.7 - 62.9 - 53.4 - 39.5 - 97 - 32 6 + 8 + 8 15 + VA15B-67 --- --- 52.1 - 37.5 - 97 - 31 6 + 7 + 9 + 15 + Average 93.7 84.9 73.1 41.2 99 32 5 5 7 13 LSD (0.05) 5.7 6.5 10.4 1.0 1 1 1 1 1 2 C.V. 7.5 7.7 10.1 1.7 1 3 13 15 14 10 Released cultivars are shown in bold print. Varieties are ordered by descending yield averages. A plus or minus sign indicates a performance significantly above or below the test average. The 0-9 ratings indicate a genotype's response to disease or lodging where 0 = highly resistant and 9 = highly susceptible. Note: this location was severely affected by stripe rust and leaf rust, reducing yields.

31
Table 16. Summary of performance of barley entries in the Virginia Tech Barley Test, Eastern Shore AREC, Painter, VA, 2017 harvest. Yield Test Lea f (Bu/a @ Weight Rust Barley Lines 48 lb/bu) (Lb/bu) (0-9) Violetta 80.1 + 40.6 + 6 - VA13B-25 LA 75.9 + 40.0 + 8 VA14B-78 71.3 39.0 + 8 VA11B-102 LA 70.8 36.7 6 - VA14B-71 70.7 38.4 + 8 VA14B-73 70.6 36.9 8 VA15B-78 70.3 41.0 + 8 VA11B-141 LA 70.0 40.9 + 6 - VA14B-74 69.9 37.2 8 VA14B-79 69.7 37.4 7 VA14B-63 69.5 37.7 8 VA15B-79 68.9 39.4 + 8 VA15B-8 68.6 38.1 8 VA14BFHB-83 66.4 39.9 + 4 - VA12B-56 65.3 35.9 9 + Flavia 64.6 39.0 + 7 - VA08B-95 64.4 37.3 7 - VA15B-5 64.1 40.6 + 5 - Atlantic 63.0 36.0 8 VA12B-8 LA 60.3 34.0 - 9 + VA14B-59 59.8 36.9 8 Secretariat 59.6 41.4 + 2 - Price 58.8 37.5 9 + VA14B-57 56.1 35.9 9 + VA14B-75 54.9 37.4 8 VA15B-89 (LA) 52.9 35.0 - 9 + VA12B-41 51.6 36.3 8 VA15B-67 51.0 33.5 - 9 + VA15B-83 (LA) 49.9 35.3 - 9 + VA15B-33 49.7 37.7 9 + VA15B-98 (LA) 48.3 34.2 - 9 + Callao 47.1 32.9 - 9 + Barsoy 45.9 33.3 - 9 + VA15B-60 45.8 34.4 - 9 + VA12B-30 44.9 34.7 - 9 + Thoroughbred 41.1 - 34.2 - 9 + VA15B-65 40.9 - 35.7 - 9 + VA15B-54 40.1 - 34.3 - 9 + VA92-42-46 --- --- 5 - Nomini --- --- 8 Wysor --- --- 9 +

32
Table 16. Summary of performance of barley entries in the Virginia Tech Barley Test, Eastern Shore AREC, Painter, VA, 2017 harvest.
Average 59.8 37.0 8 LSD (0.05) 15.1 1.3 1 C.V. 17.5 2.5 7 Released cultivars are shown in bold print. Varieties are ordered by descending yield averages. A plus or minus sign indicates a performance significantly above or below the test average. The 0-9 ratings indicate a genotype's response to disease or lodging where 0 = highly resistant and 9 = highly susceptible. Note: this location was severely affected by stripe rust and leaf rust, reducing yields. The awnless lines Wysor, Nomini, and VA92-42-46 were selectively grazed by deer.
Barley Lines
Yield Test Leaf (Bu/a @ Weight Rust
48 lb/bu) (Lb/bu) (0-9)
33
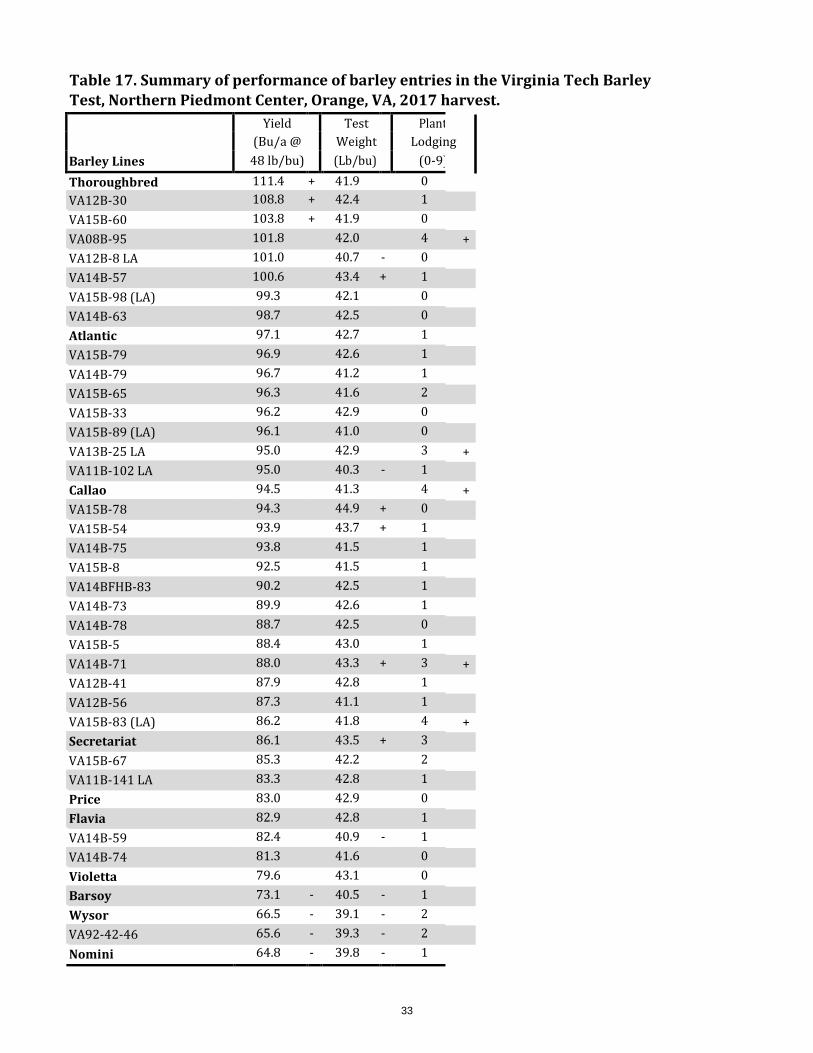
Table 17. Summary of performance of barley entries in the Virginia Tech Barley Test, Northern Piedmont Center, Orange, VA, 2017 harvest. Yield Test Plant (Bu/a @ Weight Lodging Barley Lines 48 lb/bu) (Lb/bu) (0-9) Thoroughbred 111.4 + 41.9 0 VA12B-30 108.8 + 42.4 1 VA15B-60 103.8 + 41.9 0 VA08B-95 101.8 42.0 4 + VA12B-8 LA 101.0 40.7 - 0 VA14B-57 100.6 43.4 + 1 VA15B-98 (LA) 99.3 42.1 0 VA14B-63 98.7 42.5 0 Atlantic 97.1 42.7 1 VA15B-79 96.9 42.6 1 VA14B-79 96.7 41.2 1 VA15B-65 96.3 41.6 2 VA15B-33 96.2 42.9 0 VA15B-89 (LA) 96.1 41.0 0 VA13B-25 LA 95.0 42.9 3 + VA11B-102 LA 95.0 40.3 - 1 Callao 94.5 41.3 4 + VA15B-78 94.3 44.9 + 0 VA15B-54 93.9 43.7 + 1 VA14B-75 93.8 41.5 1 VA15B-8 92.5 41.5 1 VA14BFHB-83 90.2 42.5 1 VA14B-73 89.9 42.6 1 VA14B-78 88.7 42.5 0 VA15B-5 88.4 43.0 1 VA14B-71 88.0 43.3 + 3 + VA12B-41 87.9 42.8 1 VA12B-56 87.3 41.1 1 VA15B-83 (LA) 86.2 41.8 4 + Secretariat 86.1 43.5 + 3 VA15B-67 85.3 42.2 2 VA11B-141 LA 83.3 42.8 1 Price 83.0 42.9 0 Flavia 82.9 42.8 1 VA14B-59 82.4 40.9 - 1 VA14B-74 81.3 41.6 0 Violetta 79.6 43.1 0 Barsoy 73.1 - 40.5 - 1 Wysor 66.5 - 39.1 - 2 VA92-42-46 65.6 - 39.3 - 2 Nomini 64.8 - 39.8 - 1
34
Table 17. Summary of performance of barley entries in the Virginia Tech Barley Test, Northern Piedmont Center, Orange, VA, 2017 harvest.
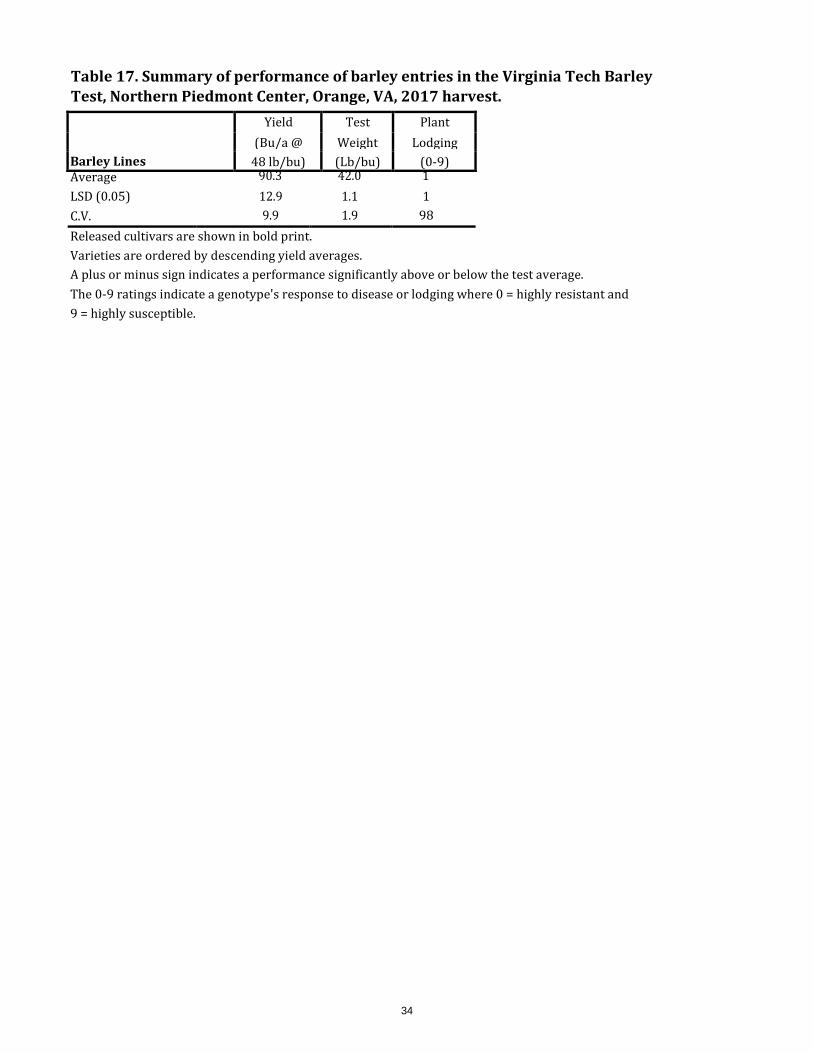
Average 90.3 42.0 1 LSD (0.05) 12.9 1.1 1 C.V. 9.9 1.9 98 Released cultivars are shown in bold print. Varieties are ordered by descending yield averages. A plus or minus sign indicates a performance significantly above or below the test average. The 0-9 ratings indicate a genotype's response to disease or lodging where 0 = highly resistant and 9 = highly susceptible.
Barley Lines
Yield Test Plant (Bu/a @ Weight Lodging
48 lb/bu) (Lb/bu) (0-9)

35
Table 18. Summary of performance of barley entries in the Virginia Tech Barley Test, Kentland Farm, Blacksburg,VA, 2017 harvest. 3-year 2-year Yield Test Date Mature Plant Leaf Net Av. Yield Av. Yield (Bu/a @ Weight Headed Height Lodging Rust Blotch Barley Lines (Bu/a) (Bu/a) 48 lb/bu) (Lb/bu) (Julian) (In) (0-9) (0-9) (0-9) VA14B-79 --- 122.6 + 132.2 + 43.8 108 33 1 3 3 VA14B-59 --- 122.1 + 126.7 + 43.4 108 33 0 2 - 2 - VA14B-63 --- 119.5 + 126.5 + 43.7 109 34 0 3 4 VA14B-74 --- 124.6 + 126.0 + 43.2 111 + 33 0 3 3 VA15B-8 --- --- 123.1 42.7 - 108 36 2 3 4 VA14B-78 --- 112.7 121.2 44.3 107 - 35 0 3 3 VA12B-8 LA 115.5 110.6 120.8 44.5 108 38 + 1 7 + 7 + VA12B-56 119.4 + 116.3 + 119.8 44.4 105 - 31 - 1 5 4 VA12B-41 117.6 + 112.9 119.6 43.9 109 + 33 1 3 3 VA15B-54 --- --- 119.4 45.8 + 108 34 2 4 3 VA15B-33 --- --- 118.5 47.0 + 108 31 - 0 4 3 VA14B-75 --- 117.0 + 118.2 43.4 108 33 2 2 - 3 VA15B-5 --- --- 118.0 44.6 108 33 0 2 - 3 Atlantic 115.9 109.1 118.0 43.6 105 - 32 - 1 6 + 4 Secretariat 124.5 + 116.5 + 117.7 44.8 107 - 33 2 2 - 3 VA13B-25 LA 118.9 + 118.0 + 116.8 45.3 105 - 33 0 3 4 VA15B-67 --- --- 116.8 45.3 106 - 34 2 6 + 3 VA15B-89 (LA) --- --- 115.9 44.1 111 + 35 0 8 + 6 + VA11B-141 LA 116.3 + 111.7 115.9 45.8 + 109 + 38 + 0 4 4 VA14B-57 --- 113.1 115.8 44.6 108 33 2 3 3 VA15B-65 --- --- 115.4 45.0 105 - 35 2 4 4 VA15B-60 --- --- 115.1 44.6 105 - 32 - 1 4 5 VA14B-73 --- 111.4 114.6 43.8 108 35 2 3 3 VA11B-102 LA 120.1 + 112.5 114.5 43.3 110 + 37 + 2 3 3 Thoroughbred 116.3 + 107.0 113.7 43.3 111 + 35 0 7 + 7 + VA15B-79 --- --- 113.3 45.6 + 107 33 0 3 3 VA12B-30 114.0 102.3 113.1 43.3 113 + 35 2 6 + 3 VA15B-83 (LA) --- --- 112.8 45.6 + 105 - 35 2 6 + 5 + VA14BFHB-83 --- 111.1 112.7 45.9 + 108 36 4 2 - 3 VA14B-71 --- 114.4 111.6 45.9 + 107 34 2 3 3 VA15B-98 (LA) --- --- 111.2 44.3 108 34 2 7 + 7 + Price 99.0 - 90.7 - 109.9 44.4 107 32 - 0 4 7 + VA08B-95 117.3 + 109.3 108.0 43.8 106 - 34 2 3 3 Callao 106.8 102.1 100.5 - 42.7 - 105 - 29 - 5 + 5 4 Nomini 103.4 - 97.2 - 97.2 - 43.7 105 - 40 + 0 5 1 - VA15B-78 --- --- 95.1 - 46.6 + 110 + 34 2 7 + 4 Violetta 95.6 - 90.8 - 91.0 - 44.4 109 + 31 - 0 2 - 4 Barsoy 91.6 - 86.7 - 90.9 - 42.4 - 106 - 34 3 8 + 4 Flavia --- --- 90.1 - 43.7 115 + 29 - 0 4 5 VA92-42-46 98.7 - 81.9 - 81.9 - 43.5 108 39 + 0 1 - 8 + Wysor 93.7 - 80.9 - 80.9 - 42.8 - 107 41 + 0 8 + 4
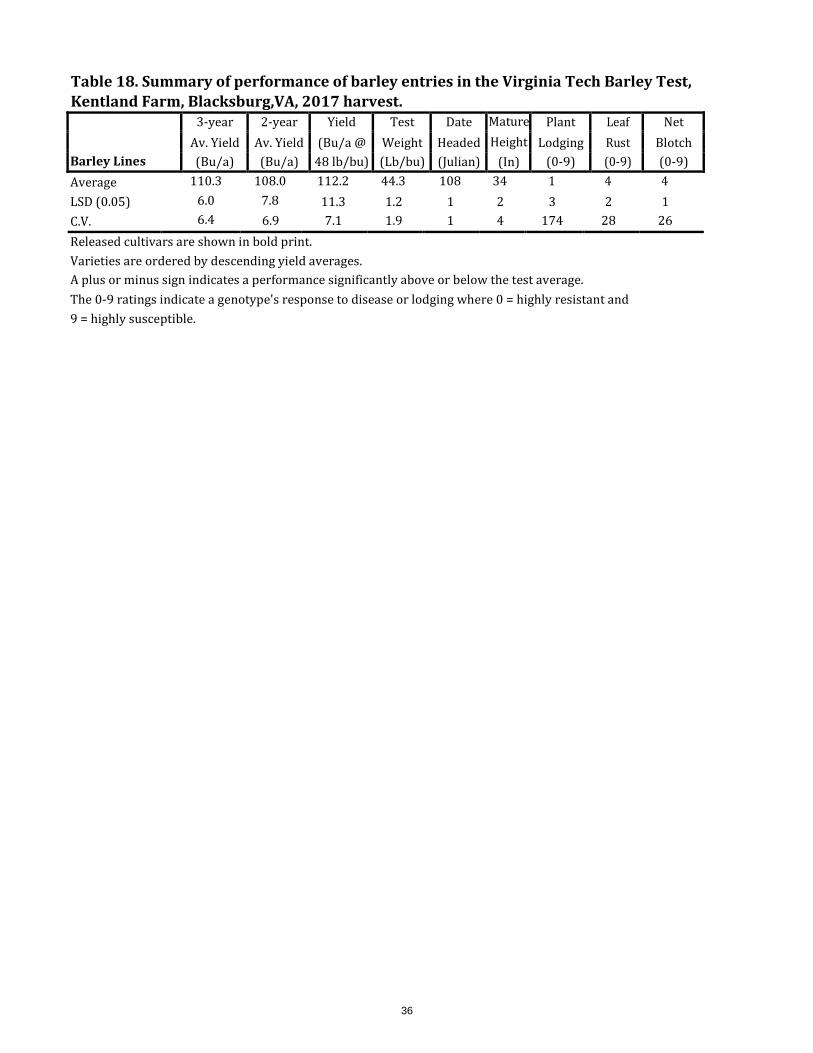
36
Table 18. Summary of performance of barley entries in the Virginia Tech Barley Test, Kentland Farm, Blacksburg,VA, 2017 harvest.
Average 110.3 108.0 112.2 44.3 108 34 1 4 4 LSD (0.05) 6.0 7.8 11.3 1.2 1 2 3 2 1 C.V. 6.4 6.9 7.1 1.9 1 4 174 28 26 Released cultivars are shown in bold print. Varieties are ordered by descending yield averages. A plus or minus sign indicates a performance significantly above or below the test average. The 0-9 ratings indicate a genotype's response to disease or lodging where 0 = highly resistant and 9 = highly susceptible.
Barley Lines
3-year 2-year Yield Test Date Mature Plant Leaf Net Av. Yield Av. Yield (Bu/a @ Weight Headed Height Lodging Rust Blotch (Bu/a) (Bu/a) 48 lb/bu) (Lb/bu) (Julian) (In) (0-9) (0-9) (0-9)
Section 2: Barley Scab Research
One of the primary research objectives of the Virginia Tech barley breeding program is to identify and develop cultivars possessing resistance to Fusarium head blight (FHB) or scab. Each year all barley and hulless barley entries in Virginia’s Official State Variety Trials are evaluated for FHB at the Virginia Crop Improvement Association (VCIA) test site in Mt. Holly, VA. Cultivars possessing complete resistance or immunity to FHB have not been identified and resistance levels in currently available cultivars vary from moderately resistant to highly susceptible.
A major goal of the breeding program is to identify and incorporate unique and complementary types of FHB resistance into cultivars to enhance the overall level of resistance. Incorporating multiple resistance genes having additive effects on FHB resistance into cultivars will enhance the overall level of resistance. Because the individual resistance genes are located on different barley chromosomes and each gene confers only partial resistance to FHB, identifying lines having multiple resistance genes is difficult using traditional breeding techniques. To overcome this limitation, our program will incorporate the available markers to help select FHB resistant cultivars.
In 2017, entries were inoculated by spreading scabby corn kernels (50g/4-rows) in plots at the booting stage. A moderately low level of FHB infection was obtained in 2017 as an unseasonably warm February was followed by a drastic cold spell during the inoculation period. Among 31 hulless lines and varieties tested in 2017, the FHB index ranged from 1.4 to 25 with FHB incidence ranging from 52% to 94% and FHB severity from 2% to 26% (Table 19). Thirteen lines and two varieties had FHB index values lower than the mean (<13.4) in 2017 (Table 19). One line, VA15H- 73 (2R) had FHB incidence, severity and index values significantly lower than the test mean.
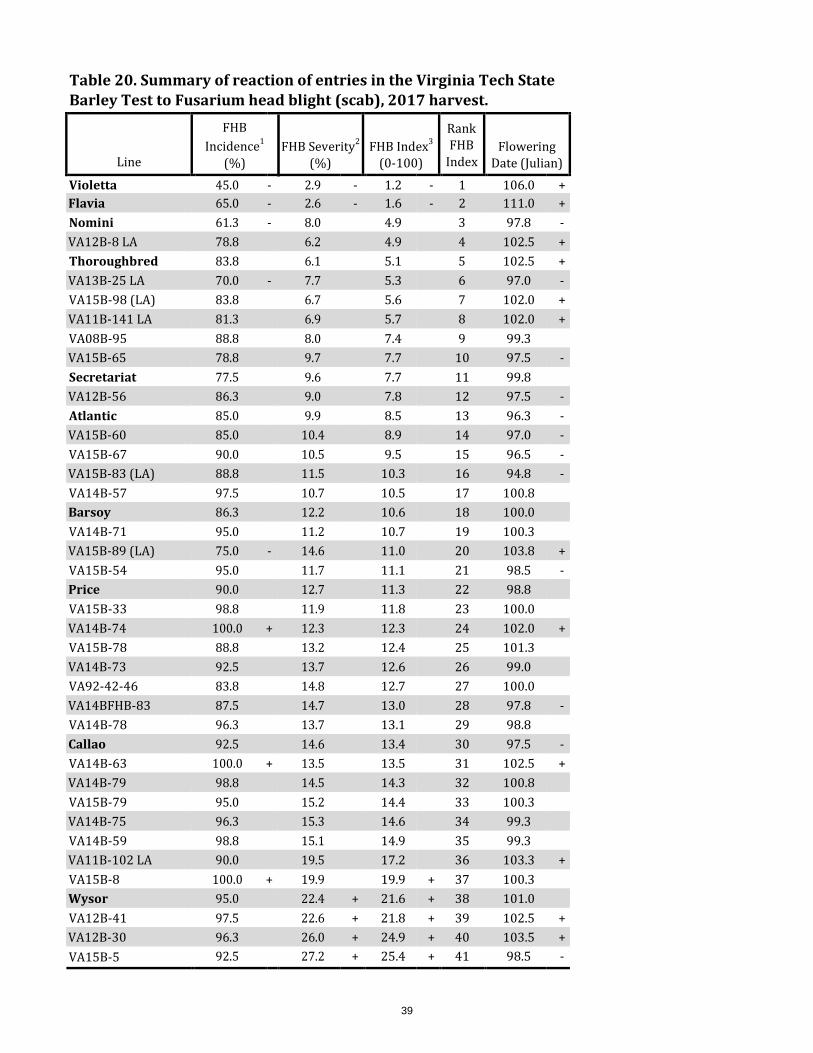
Among 41 barley lines and varieties tested in 2017, the FHB index varied from 1.2 to 25.4 with FHB incidence ranging from 45% to 100% and FHB Severity from 2% to 27% (Table 20). Fourteen lines and eight varieties had FHB index values lower than the mean (<11.5) in 2017 (Table 20). Two elite malt barley varieties, Violetta and Flavia, developed in Europe, are currently being recommended for production in the mid-Atlantic and the eastern United States. They both had FHB incidence, severity and index values significantly lower than the test mean.
37

38
Table 19. Summary of reaction of entries in the Virginia Tech State Hulless Barley Test to Fusarium head blight (scab), 2017 harvest.
Line
FHB Incidence1
(%)
FHB Severity2
(%)
FHB Index3
(0-100)
Rank FHB
Index
Flowering
Date (Julian) VA15H-73 (2R) 56.3 - 2.6 - 1.4 - 1 105.0 + Eve 61.3 - 8.5 - 5.0 - 2 95.5 - VA15H-12 52.5 - 13.8 7.3 3 104.0 + VA06H-25 67.5 12.3 8.3 4 104.5 + VA15H-85 WS 72.5 12.1 8.9 5 103.3 VA15H-118 WS 81.3 12.6 10.2 6 104.0 + VA15H-11 70.0 14.6 10.2 7 104.8 + VA08H-79 WS 73.8 13.8 10.2 8 106.5 + VA07H-35 WS 71.3 14.6 10.3 9 104.5 + VA15H-140 WS 81.3 12.8 10.6 10 103.0 VA14H-110 72.5 14.5 11.2 11 102.5 VA14H-195 WS 81.3 14.0 11.4 12 103.5 VA14H-33 72.5 15.8 11.6 13 97.3 - Amaze 10 81.3 15.4 12.7 14 103.8 VA15H-100 WS 85.0 15.0 12.7 15 104.3 + VA15H-9 72.5 19.3 13.9 16 104.3 + VA15H-116 WS 78.8 17.7 14.0 17 104.0 + VA15H-138 WS 75.0 18.4 14.1 18 102.0 VA14H-58 77.5 18.0 14.4 19 102.8 VA15H-119 WS 85.0 17.4 14.7 20 103.0 VA15H-131 WS 67.5 21.5 14.7 21 103.8 VA15H-110 WS 86.3 17.3 14.9 22 102.3 VA15H-90 WS 80.0 18.1 15.0 23 104.0 + VA15H-141 WS 88.8 17.1 15.3 24 102.8 VA15H-139 WS 87.5 17.9 16.4 25 104.0 + VA15H-111 WS 77.5 22.8 17.6 26 103.3 VA14H-3 86.3 20.8 18.2 27 97.0 - VA15H-79 WS 93.8 + 20.8 19.5 28 101.3 Doyce 88.8 21.8 19.8 29 97.3 - VA06H-79 90.0 26.9 + 25.2 + 30 103.5 Average 77.7 16.6 13.4 102.5 LSD (0.05) 14.3 7.5 7.2 1.4 C.V. 13.1 32.2 38.4 1.0 Released cultivars are shown in bold print. Varieties are ordered by ascending index averages. A plus or minus sign indicates a performance significantly above or below the average. Entries were planted in 2-row plots, 4 ft in length at Mt. Holly, VA and were inoculated at booting stage with scabby corn kernels (50g/4-rows). 1Scab Incidence (%): Percentage of infected spikes among 20 randomly selected spikes. 2Scab Severity (%): Percentage of infected spikelets among 20 infected spikes. 3Scab Index = Incidence X Severity/100; it is an overall indicator of scab resistance/susceptibility level.
39
Table 20. Summary of reaction of entries in the Virginia Tech State Barley Test to Fusarium head blight (scab), 2017 harvest.
Line
FHB Incidence1
(%)
FHB Severity2
(%)
FHB Index3
(0-100)
Rank FHB
Index
Flowering
Date (Julian) Violetta 45.0 - 2.9 - 1.2 - 1 106.0 + Flavia 65.0 - 2.6 - 1.6 - 2 111.0 + Nomini 61.3 - 8.0 4.9 3 97.8 - VA12B-8 LA 78.8 6.2 4.9 4 102.5 + Thoroughbred 83.8 6.1 5.1 5 102.5 + VA13B-25 LA 70.0 - 7.7 5.3 6 97.0 - VA15B-98 (LA) 83.8 6.7 5.6 7 102.0 + VA11B-141 LA 81.3 6.9 5.7 8 102.0 + VA08B-95 88.8 8.0 7.4 9 99.3 VA15B-65 78.8 9.7 7.7 10 97.5 - Secretariat 77.5 9.6 7.7 11 99.8 VA12B-56 86.3 9.0 7.8 12 97.5 - Atlantic 85.0 9.9 8.5 13 96.3 - VA15B-60 85.0 10.4 8.9 14 97.0 - VA15B-67 90.0 10.5 9.5 15 96.5 - VA15B-83 (LA) 88.8 11.5 10.3 16 94.8 - VA14B-57 97.5 10.7 10.5 17 100.8 Barsoy 86.3 12.2 10.6 18 100.0 VA14B-71 95.0 11.2 10.7 19 100.3 VA15B-89 (LA) 75.0 - 14.6 11.0 20 103.8 + VA15B-54 95.0 11.7 11.1 21 98.5 - Price 90.0 12.7 11.3 22 98.8 VA15B-33 98.8 11.9 11.8 23 100.0 VA14B-74 100.0 + 12.3 12.3 24 102.0 + VA15B-78 88.8 13.2 12.4 25 101.3 VA14B-73 92.5 13.7 12.6 26 99.0 VA92-42-46 83.8 14.8 12.7 27 100.0 VA14BFHB-83 87.5 14.7 13.0 28 97.8 - VA14B-78 96.3 13.7 13.1 29 98.8 Callao 92.5 14.6 13.4 30 97.5 - VA14B-63 100.0 + 13.5 13.5 31 102.5 + VA14B-79 98.8 14.5 14.3 32 100.8 VA15B-79 95.0 15.2 14.4 33 100.3 VA14B-75 96.3 15.3 14.6 34 99.3 VA14B-59 98.8 15.1 14.9 35 99.3 VA11B-102 LA 90.0 19.5 17.2 36 103.3 + VA15B-8 100.0 + 19.9 19.9 + 37 100.3 Wysor 95.0 22.4 + 21.6 + 38 101.0 VA12B-41 97.5 22.6 + 21.8 + 39 102.5 + VA12B-30 96.3 26.0 + 24.9 + 40 103.5 + VA15B-5 92.5 27.2 + 25.4 + 41 98.5 -

40
Table 20. Summary of reaction of entries in the Virginia Tech State Barley Test to Fusarium head blight (scab), 2017 harvest.
Line
FHB Incidence1
(%)
FHB Severity2
(%)
FHB Index3
(0-100)
Rank FHB
Index
Flowering
Date (Julian)
Average 87.5 12.7 11.5 100.2 LSD (0.05) 11.4 7.8 7.5 1.7 C.V. 9.3 43.8 46.5 1.2 Released cultivars are shown in bold print. Varieties are ordered by ascending index averages. A plus or minus sign indicates a performance significantly above or below the average. Entries were planted in 2-row plots, 4 ft in length at Mt. Holly, VA and were inoculated at booting stage with scabby corn kernels (50g/4-rows). 1Scab Incidence (%): Percentage of infected spikes among 20 randomly selected spikes. 2Scab Severity (%): Percentage of infected spikelets among 20 infected spikes. 3Scab Index = Incidence X Severity/100; it is an overall indicator of scab resistance/susceptibility level.
41
Section 4: Wheat Varieties
Wheat trials were planted in seven-inch rows at Blackstone, Orange, Holland, Painter, and Shenandoah Valley. They were planted in six-inch rows at Blacksburg and Warsaw. The no-till locations (Holland and Shenandoah Valley) were planted at 48 seeds per square foot. All other locations were planted at 44 seeds per square foot. The Shenandoah Valley location was abandoned early in the season due to poor planting conditions and variability in the stand.
Selecting the best wheat varieties is challenging but becomes easier with adequate information on performance over multiple environments. Past seasons across Virginia have provided the opportunity to evaluate day length sensitivity, spring freeze damage, glume blotch, scab (Fusarium head blight), and general plant health. Many newer wheat varieties and lines performed well in all environments tested.
The future for wheat varieties adapted to Virginia conditions is very positive. Dr. Carl Griffey, Virginia Tech's small grains breeder, has many lines starting with "VA" shown in the by- and over-location tables that are in the top-yielding group and that display good disease resistance.
The released varieties that yielded significantly higher than the statewide mean in 2017 in descending yield order were Croplan 8550, AgriMAXX 473, Armor Mayhem, #Bullet, Dyna- Gro 9701, Croplan SRW 9415, USG 3536, USG 3458, Croplan SRW 9606, AgriMAXX 415, MBX 14-S-210, Pioneer Brand 26R59, USG 3404, Croplan 8530, MAS #61, AgriMAXX 444, USG 3895, Hilliard, AgriMAXX 474, Pioneer Brand 26R41, Armor ARW1611, MBX 17-M- 245, Armor ARW1610, Pioneer Brand 26R10, Croplan 8415, Dyna-Gro 9600, and AgriMAXX 446. AgriMAXX 415 and Armor ARW1610 also had test weight that was significantly higher than the mean of all lines tested. Average yield of all lines tested in 2016-17 was 69.7 bushels per acre.
Croplan 8550 had the highest two-year average yield. Croplan 8550, Hilliard, MAS #61, #Bullet, Pioneer Brand 26R59, AgriMAXX 474, MBX 14-S-210, AgriMAXX 415, USG 3895, Croplan 8530, MAS #67, AgriMAXX 444 and Croplan 8415 all had grain yield significantly above the mean of the 2016 and 2017 harvests. Hilliard, AgriMAXX 415 and Croplan 8415 also had test weight that was significantly higher than the two-year mean of all lines tested. The two-year average grain yield over all locations and varieties was 61.3 bushels per acre.
Producers who grow large acreages of wheat should plant two or more varieties having significantly different maturity dates in order to ensure harvest of high quality grain having high test weight and no sprouting. In Virginia it is typical for sporadic or consistent rain showers to interrupt harvest. These wetting and drying cycles and subsequent delays and significantly reduce grain test weight and quality. Growers can circumvent this problem by planting varieties that differ significantly in maturity. Early maturing varieties often can be harvested first and prior to significant rain showers, and later maturing varieties harvested

42
subsequently will suffer less damage and losses in test weight and quality due to exposure to such a rain event.
Summary of wheat management practices for the 2017 harvest season (All rates are given on a per acre basis.)
Blacksburg - Planted October 12, 2016. Pre-plant fertilizer was 30-40-60-8(S)-3(B). Site was sprayed with .75 oz Harmony Extra SG® on November 15, 2016. Site was fertilized with 25 units UAN 30-0-0 on February 17, 2017 and with 60 units UAN 30-0-0 plus 0.75 oz Harmony Extra SG® on March 24, 2017. Harvest occurred June 21, 2017.
Blackstone - Planted October 18, 2016. Pre-plant fertilizer was 300 lb 10-10-10 on October 18, 2017. Site was top-dressed with 60 lb N and sprayed with .5 oz Harmony Extra SG® on February 2, 2017. Additionally, site was fertilized with 60 lb N using UAN on March 1, 2017. Site was sprayed with Mustang Max for aphid control. Harvest occurred June 22, 2017.
Warsaw - Planted October 19, 2016. Pre-plant lime was 1 ton October 15, 2016. Pre-plant fertilizer was 43-100-100-5 applied October 17, 2016. Quelex™ was applied at .75 oz with surfactant at 1 qt/100 gal water on December 4, 2016. Site was fertilized using 12-0-0-1.5 at 25 lb on both December 11, 2016 and February 6, 2017. Site was also fertilized using 24-0-0-3 at 60 lb on March 12, 2017. Site was treated with 2 oz Tombstone® on April 28, 2017. Harvest occurred June 11, 2017.
Painter - Planted October 20, 2016. Pre-plant fertilizer was 50 lb N on October 19, 2016. Site was treated with 4.75 oz Osprey, 1 qt 30% N and 8 oz NIS ¼ % on February 8, 2017. Additionally, site was treated with 0.75 oz Harmony Extra SG® and 8 oz NIS ¼ % on February 24, 2017. Site was fertilized with 120 lb N using 30% UAN on March 25, 2017. Harvest occurred June 14, 2017.
Holland - Planted minimum-till October 19, 2016. Site was sprayed with 28 oz Roundup® October 12, 2016. Pre-plant fertilizer was 379 lb 9-15-31 on October 17, 2016. Site was sprayed with 4.75 oz Osprey™ on February 6, 2017. Site was fertilized with 24 gal 24-0-0-3 plus 1.5 pt Mn plus 0.75 oz Harmony Extra SG® on February 28, 2017. Site was treated with 3 oz Tilt® plus 24 gal 24-0-0-3 on March 23, 2017. Harvest occurred June 26-27, 2017.
Orange - Planted October 6, 2016. Pre-plant fertilizer was 32-60-40 October 4, 2016. Sixty lb N plus 0.6 oz Harmony Extra SG® was applied February 21, 2017. Site was harvested June 21-22, 2017.
Shenandoah Valley - Planted on November 21, 2016. Pre-plant fertilizer was 1.5 ton broiler litter. Sixty lb N plus 0.7 oz Harmony Extra SG® was applied on February 7, 2017. Site was late-planted into very dry land and abandoned due to highly variable, poor stand.

43
Entries in 2016-17 Virginia Wheat Test, arranged by company. Company Line Seed Treatment reported by company AgriMAXX Wheat Company AgriMAXX 415 Vibrance™ Extreme, Cruiser® 5FS, Maxim 4FS 7167 Highbanks Road AgriMAXX 444 Vibrance™ Extreme, Cruiser® 5FS, Maxim 4FS Mascoutah, IL 62258 AgriMAXX 446 Vibrance™ Extreme, Cruiser® 5FS, Maxim 4FS AgriMAXX 463 Vibrance™ Extreme, Cruiser® 5FS, Maxim 4FS AgriMAXX 464 Vibrance™ Extreme, Cruiser® 5FS, Maxim 4FS AgriMAXX 473 Vibrance™ Extreme, Cruiser® 5FS, Maxim 4FS AgriMAXX 474 Vibrance™ Extreme, Cruiser® 5FS, Maxim 4FS Armor Seed, LLC Armor RIPTIDE Vibrance™ Extreme + Cruiser® 183 Pennsylvania Ave. Armor AMBUSH Vibrance™ Extreme + Cruiser® Waldenburg, AR 72475 Armor ARW1610 Vibrance™ Extreme + Cruiser® Armor NEMESIS Vibrance™ Extreme + Cruiser® Armor MAYHEM Vibrance™ Extreme + Cruiser® Crop Production Services Dyna-Gro 9223 Foothold® Virock™ w/ Awaken® ST 15277 Richmond-Tappahannock Hwy Dyna-Gro 9522 Foothold® Virock™ w/ Awaken® ST St Stephens Church, VA 23148 Dyna-Gro 9600 Foothold® Virock™ w/ Awaken® ST Dyna-Gro 9692 Foothold® Virock™ w/ Awaken® ST Dyna-Gro 9701 Foothold® Virock™ w/ Awaken® ST Dyna-Gro 9750 Foothold® Virock™ w/ Awaken® ST Dyna-Gro 9772 Foothold® Virock™ w/ Awaken® ST Dyna-Gro 9862 Foothold® Virock™ w/ Awaken® ST Shirley Foothold® Virock™ w/ Awaken® ST WX16722 Foothold® Virock™ w/ Awaken® ST Winfield CROPLAN 8415 Warden Cereals 1080 County Road F West, MS 5850 CROPLAN 8530 Warden Cereals Shoreview, MN 55126-2910 CROPLAN 8550 Warden Cereals CROPLAN SRW 9415 Warden Cereals CROPLAN SRW 9606 Warden Cereals Dupont Pioneer Pioneer Brand 26R10 Vibrance™ Extreme 425 Abbeydale Way Pioneer Brand 26R36 Vibrance™ Extreme Columbia, SC 29229 Pioneer Brand 26R41 Vibrance™ Extreme Pioneer Brand 26R53 Vibrance™ Extreme Pioneer Brand 26R59 Vibrance™ Extreme Pioneer XW15C Vibrance™ Extreme Eddie Mercer Agri-Services, Inc. MBX 14-S-210 Vibrance™ Extreme + Cruiser Maxx® 6900 Linganore Road MBX 16-B-203 Vibrance™ Extreme + Cruiser Maxx® Frederick, MD 21702 MBX 17-M-245 Vibrance™ Extreme + Cruiser Maxx® MBX 17-P-275 Vibrance™ Extreme + Cruiser Maxx® Erwin-Keith, Inc. #BOSS Vibrance™ Extreme 1529 Hwy 193 #Bullet Vibrance™ Extreme Wynne, AR 72396 #Turbo Vibrance™ Extreme #Warrior Vibrance™ Extreme PGX 14-5 Vibrance™ Extreme PGX 16-3 Vibrance™ Extreme Progeny 16-1 Vibrance™ Extreme
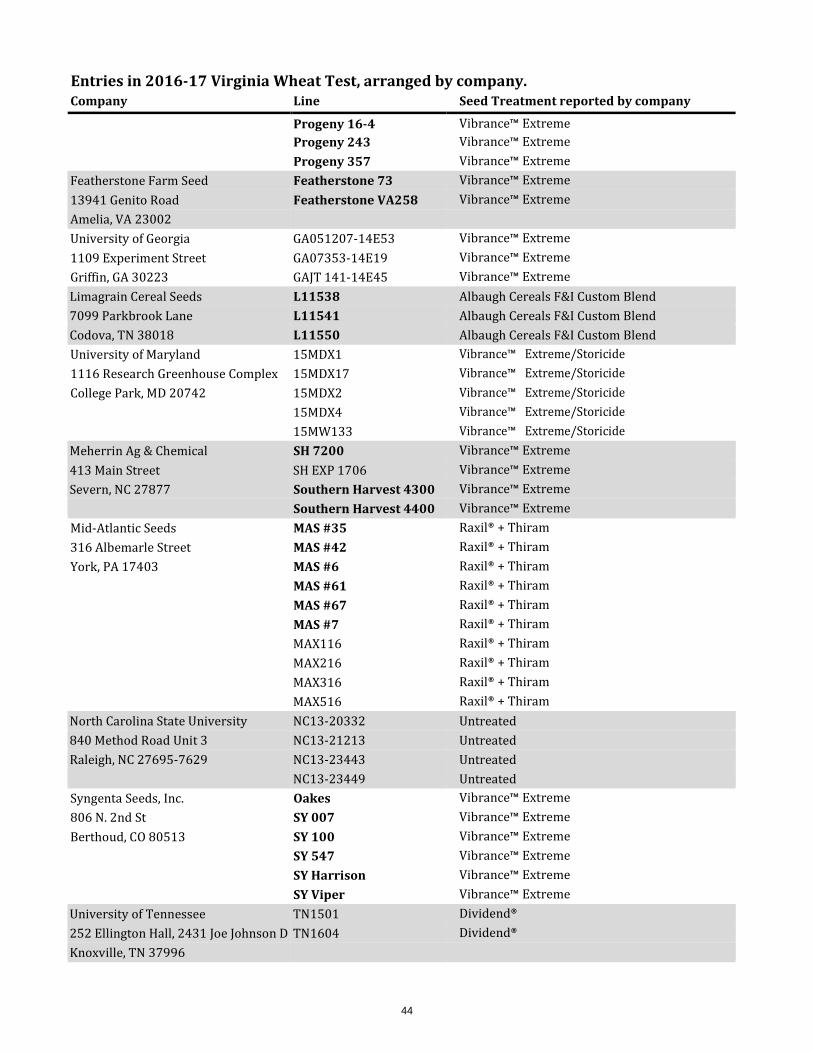
44
Entries in 2016-17 Virginia Wheat Test, arranged by company. Company Line Seed Treatment reported by company
Progeny 16-4 Vibrance™ Extreme Progeny 243 Vibrance™ Extreme Progeny 357 Vibrance™ Extreme Featherstone Farm Seed Featherstone 73 Vibrance™ Extreme 13941 Genito Road Featherstone VA258 Vibrance™ Extreme Amelia, VA 23002 University of Georgia GA051207-14E53 Vibrance™ Extreme 1109 Experiment Street GA07353-14E19 Vibrance™ Extreme Griffin, GA 30223 GAJT 141-14E45 Vibrance™ Extreme Limagrain Cereal Seeds L11538 Albaugh Cereals F&I Custom Blend 7099 Parkbrook Lane L11541 Albaugh Cereals F&I Custom Blend Codova, TN 38018 L11550 Albaugh Cereals F&I Custom Blend University of Maryland 15MDX1 Vibrance™ Extreme/Storicide 1116 Research Greenhouse Complex 15MDX17 Vibrance™ Extreme/Storicide College Park, MD 20742 15MDX2 Vibrance™ Extreme/Storicide 15MDX4 Vibrance™ Extreme/Storicide 15MW133 Vibrance™ Extreme/Storicide Meherrin Ag & Chemical SH 7200 Vibrance™ Extreme 413 Main Street SH EXP 1706 Vibrance™ Extreme Severn, NC 27877 Southern Harvest 4300 Vibrance™ Extreme Southern Harvest 4400 Vibrance™ Extreme Mid-Atlantic Seeds MAS #35 Raxil® + Thiram 316 Albemarle Street MAS #42 Raxil® + Thiram York, PA 17403 MAS #6 Raxil® + Thiram MAS #61 Raxil® + Thiram MAS #67 Raxil® + Thiram MAS #7 Raxil® + Thiram MAX116 Raxil® + Thiram MAX216 Raxil® + Thiram MAX316 Raxil® + Thiram MAX516 Raxil® + Thiram North Carolina State University NC13-20332 Untreated 840 Method Road Unit 3 NC13-21213 Untreated Raleigh, NC 27695-7629 NC13-23443 Untreated NC13-23449 Untreated Syngenta Seeds, Inc. Oakes Vibrance™ Extreme 806 N. 2nd St SY 007 Vibrance™ Extreme Berthoud, CO 80513 SY 100 Vibrance™ Extreme SY 547 Vibrance™ Extreme SY Harrison Vibrance™ Extreme SY Viper Vibrance™ Extreme University of Tennessee TN1501 Dividend® 252 Ellington Hall, 2431 Joe Johnson D TN1604 Dividend® Knoxville, TN 37996

45
Entries in 2016-17 Virginia Wheat Test, arranged by company. Company Line Seed Treatment reported by company
Texas A&M AgriLife Research TX EL2 Foothold® Extra 2600 South Neal Commerce, TX 75429 UniSouth Genetics, Inc. USG 3197 Vibrance™ Extreme + Cruiser Maxx® 3205-C HWY 46S USG 3228 Vibrance™ Extreme + Cruiser Maxx® Dickson, TN 37055 USG 3316 Vibrance™ Extreme + Cruiser Maxx® USG 3404 Vibrance™ Extreme + Cruiser Maxx® USG 3458 Vibrance™ Extreme + Cruiser Maxx® USG 3536 Vibrance™ Extreme + Cruiser Maxx® USG 3549 Vibrance™ Extreme + Cruiser Maxx® USG 3895 Vibrance™ Extreme + Cruiser Maxx® Virginia Tech and the Virginia DH11SRW061-16 Raxil®MD Pro + Gaucho Crop Improvement Association DH11SRW065-23 Raxil®MD Pro + Gaucho 9142 Atlee Station Road DH11SRW065-26 Raxil®MD Pro + Gaucho Mechanicsville, VA 23111 DH11SRW069-70 Raxil®MD Pro + Gaucho DH11SRW070-14 Raxil®MD Pro + Gaucho DH12SRW056-058 Raxil®MD Pro + Gaucho DH12SRW057-006 Raxil®MD Pro + Gaucho Hilliard Raxil®MD Pro + Gaucho Massey Raxil®MD Pro + Gaucho VA07MAS1-7047-1-1-4-2 Raxil®MD Pro + Gaucho VA07MAS3-7304-3-1-2-3 Raxil®MD Pro + Gaucho VA07MAS3-7304-3-2-4-2 Raxil®MD Pro + Gaucho VA08MAS1-188-6-4-1 Raxil®MD Pro + Gaucho VA09MAS1-12-5-1 Raxil®MD Pro + Gaucho VA09MAS1-12-5-1-1 Raxil®MD Pro + Gaucho VA09MAS1-12-5-1-3 Raxil®MD Pro + Gaucho VA09MAS1-12-8-4 Raxil®MD Pro + Gaucho VA09MAS2-131-6-2 Raxil®MD Pro + Gaucho VA09MAS2-131-6-2-4 Raxil®MD Pro + Gaucho VA09MAS3-34-2-1 Raxil®MD Pro + Gaucho VA09MAS6-122-7-1 Raxil®MD Pro + Gaucho VA09MAS6-122-7-1-1 Raxil®MD Pro + Gaucho VA09MAS6-122-7-1-4 Raxil®MD Pro + Gaucho VA09MAS8-34-5-2 Raxil®MD Pro + Gaucho VA11W-108PA Raxil®MD Pro + Gaucho VA11W-279 Raxil®MD Pro + Gaucho VA11W-313 Raxil®MD Pro + Gaucho VA12FHB-8 Raxil®MD Pro + Gaucho VA12W-248 Raxil®MD Pro + Gaucho VA12W-31 Raxil®MD Pro + Gaucho VA12W-68 Raxil®MD Pro + Gaucho VA12W-72 Raxil®MD Pro + Gaucho VA13W-174 Raxil®MD Pro + Gaucho
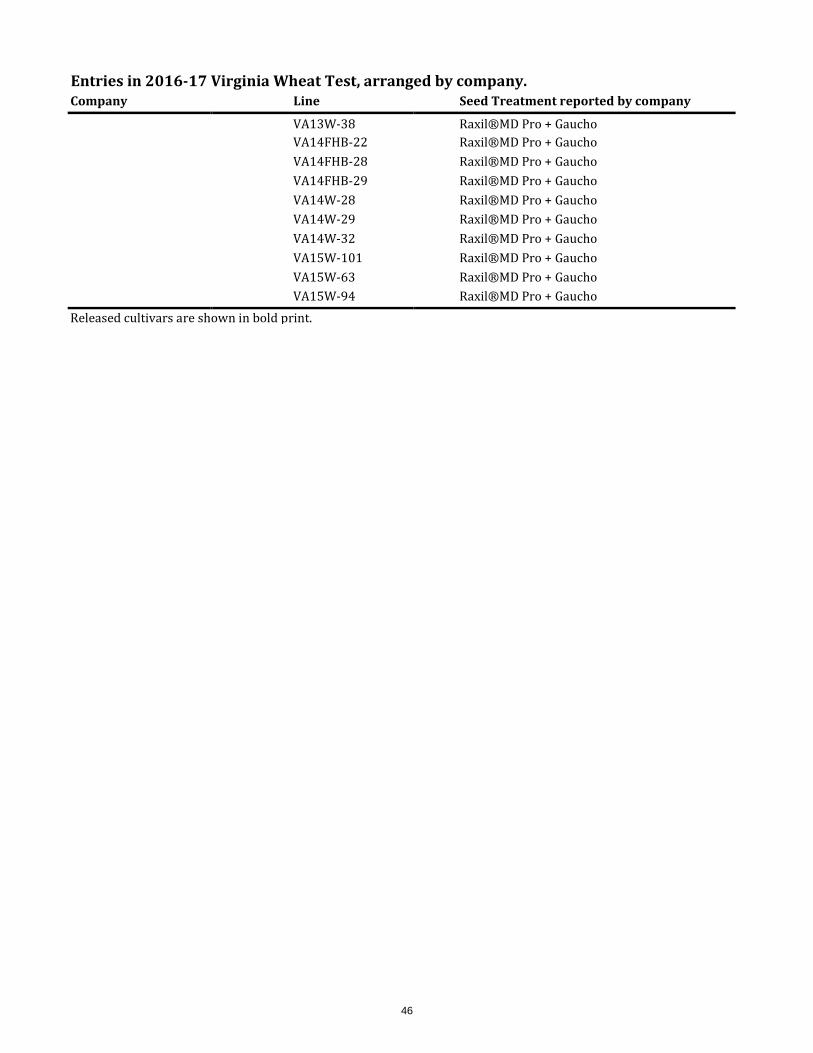
46
Entries in 2016-17 Virginia Wheat Test, arranged by company. Company Line Seed Treatment reported by company
VA13W-38 Raxil®MD Pro + Gaucho VA14FHB-22 Raxil®MD Pro + Gaucho VA14FHB-28 Raxil®MD Pro + Gaucho VA14FHB-29 Raxil®MD Pro + Gaucho VA14W-28 Raxil®MD Pro + Gaucho VA14W-29 Raxil®MD Pro + Gaucho VA14W-32 Raxil®MD Pro + Gaucho VA15W-101 Raxil®MD Pro + Gaucho VA15W-63 Raxil®MD Pro + Gaucho VA15W-94 Raxil®MD Pro + Gaucho Released cultivars are shown in bold print.
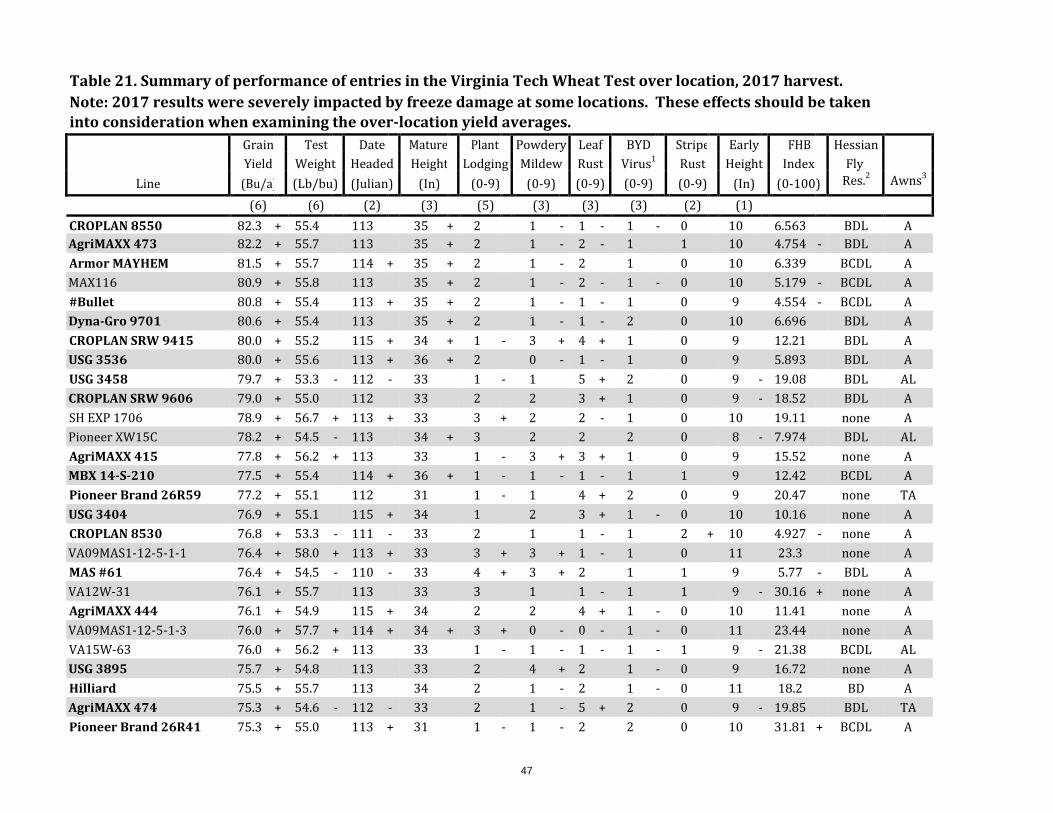
47
Table 21. Summary of performance of entries in the Virginia Tech Wheat Test over location, 2017 harvest. Note: 2017 results were severely impacted by freeze damage at some locations. These effects should be taken into consideration when examining the over-location yield averages. Grain Test Date Mature Plant Powdery Leaf BYD Stripe Early FHB Hessian Yield Weight Headed Height Lodging Mildew Rust Virus1
Rust Height Index Fly Line (Bu/a) (Lb/bu) (Julian) (In) (0-9) (0-9) (0-9) (0-9) (0-9) (In) (0-100) Res.2 Awns3
(6) (6) (2) (3) (5) (3) (3) (3) (2) (1) CROPLAN 8550 82.3 + 55.4 113 35 + 2 1 - 1 - 1 - 0 10 6.563 BDL A AgriMAXX 473 82.2 + 55.7 113 35 + 2 1 - 2 - 1 1 10 4.754 - BDL A Armor MAYHEM 81.5 + 55.7 114 + 35 + 2 1 - 2 1 0 10 6.339 BCDL A MAX116 80.9 + 55.8 113 35 + 2 1 - 2 - 1 - 0 10 5.179 - BCDL A #Bullet 80.8 + 55.4 113 + 35 + 2 1 - 1 - 1 0 9 4.554 - BCDL A Dyna-Gro 9701 80.6 + 55.4 113 35 + 2 1 - 1 - 2 0 10 6.696 BDL A CROPLAN SRW 9415 80.0 + 55.2 115 + 34 + 1 - 3 + 4 + 1 0 9 12.21 BDL A USG 3536 80.0 + 55.6 113 + 36 + 2 0 - 1 - 1 0 9 5.893 BDL A USG 3458 79.7 + 53.3 - 112 - 33 1 - 1 5 + 2 0 9 - 19.08 BDL AL CROPLAN SRW 9606 79.0 + 55.0 112 33 2 2 3 + 1 0 9 - 18.52 BDL A SH EXP 1706 78.9 + 56.7 + 113 + 33 3 + 2 2 - 1 0 10 19.11 none A Pioneer XW15C 78.2 + 54.5 - 113 34 + 3 2 2 2 0 8 - 7.974 BDL AL AgriMAXX 415 77.8 + 56.2 + 113 33 1 - 3 + 3 + 1 0 9 15.52 none A MBX 14-S-210 77.5 + 55.4 114 + 36 + 1 - 1 - 1 - 1 1 9 12.42 BCDL A Pioneer Brand 26R59 77.2 + 55.1 112 31 1 - 1 4 + 2 0 9 20.47 none TA USG 3404 76.9 + 55.1 115 + 34 1 2 3 + 1 - 0 10 10.16 none A CROPLAN 8530 76.8 + 53.3 - 111 - 33 2 1 1 - 1 2 + 10 4.927 - none A VA09MAS1-12-5-1-1 76.4 + 58.0 + 113 + 33 3 + 3 + 1 - 1 0 11 23.3 none A MAS #61 76.4 + 54.5 - 110 - 33 4 + 3 + 2 1 1 9 5.77 - BDL A VA12W-31 76.1 + 55.7 113 33 3 1 1 - 1 1 9 - 30.16 + none A AgriMAXX 444 76.1 + 54.9 115 + 34 2 2 4 + 1 - 0 10 11.41 none A VA09MAS1-12-5-1-3 76.0 + 57.7 + 114 + 34 + 3 + 0 - 0 - 1 - 0 11 23.44 none A VA15W-63 76.0 + 56.2 + 113 33 1 - 1 - 1 - 1 - 1 9 - 21.38 BCDL AL USG 3895 75.7 + 54.8 113 33 2 4 + 2 1 - 0 9 16.72 none A Hilliard 75.5 + 55.7 113 34 2 1 - 2 1 - 0 11 18.2 BD A AgriMAXX 474 75.3 + 54.6 - 112 - 33 2 1 - 5 + 2 0 9 - 19.85 BDL TA Pioneer Brand 26R41 75.3 + 55.0 113 + 31 1 - 1 - 2 2 0 10 31.81 + BCDL A
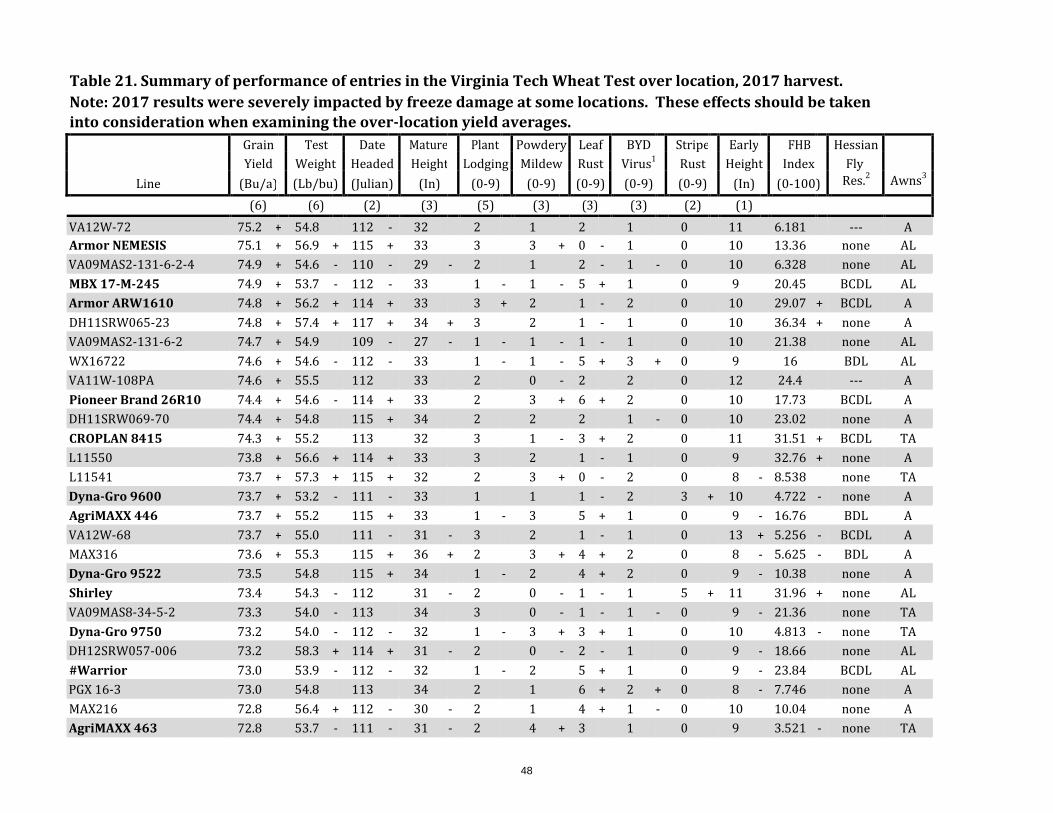
48
Table 21. Summary of performance of entries in the Virginia Tech Wheat Test over location, 2017 harvest. Note: 2017 results were severely impacted by freeze damage at some locations. These effects should be taken into consideration when examining the over-location yield averages. Grain Test Date Mature Plant Powdery Leaf BYD Stripe Early FHB Hessian Yield Weight Headed Height Lodging Mildew Rust Virus1
Rust Height Index Fly Line (Bu/a) (Lb/bu) (Julian) (In) (0-9) (0-9) (0-9) (0-9) (0-9) (In) (0-100) Res.2 Awns3
(6) (6) (2) (3) (5) (3) (3) (3) (2) (1) VA12W-72 75.2 + 54.8 112 - 32 2 1 2 1 0 11 6.181 --- A Armor NEMESIS 75.1 + 56.9 + 115 + 33 3 3 + 0 - 1 0 10 13.36 none AL VA09MAS2-131-6-2-4 74.9 + 54.6 - 110 - 29 - 2 1 2 - 1 - 0 10 6.328 none AL MBX 17-M-245 74.9 + 53.7 - 112 - 33 1 - 1 - 5 + 1 0 9 20.45 BCDL AL Armor ARW1610 74.8 + 56.2 + 114 + 33 3 + 2 1 - 2 0 10 29.07 + BCDL A DH11SRW065-23 74.8 + 57.4 + 117 + 34 + 3 2 1 - 1 0 10 36.34 + none A VA09MAS2-131-6-2 74.7 + 54.9 109 - 27 - 1 - 1 - 1 - 1 0 10 21.38 none AL WX16722 74.6 + 54.6 - 112 - 33 1 - 1 - 5 + 3 + 0 9 16 BDL AL VA11W-108PA 74.6 + 55.5 112 33 2 0 - 2 2 0 12 24.4 --- A Pioneer Brand 26R10 74.4 + 54.6 - 114 + 33 2 3 + 6 + 2 0 10 17.73 BCDL A DH11SRW069-70 74.4 + 54.8 115 + 34 2 2 2 1 - 0 10 23.02 none A CROPLAN 8415 74.3 + 55.2 113 32 3 1 - 3 + 2 0 11 31.51 + BCDL TA L11550 73.8 + 56.6 + 114 + 33 3 2 1 - 1 0 9 32.76 + none A L11541 73.7 + 57.3 + 115 + 32 2 3 + 0 - 2 0 8 - 8.538 none TA Dyna-Gro 9600 73.7 + 53.2 - 111 - 33 1 1 1 - 2 3 + 10 4.722 - none A AgriMAXX 446 73.7 + 55.2 115 + 33 1 - 3 5 + 1 0 9 - 16.76 BDL A VA12W-68 73.7 + 55.0 111 - 31 - 3 2 1 - 1 0 13 + 5.256 - BCDL A MAX316 73.6 + 55.3 115 + 36 + 2 3 + 4 + 2 0 8 - 5.625 - BDL A Dyna-Gro 9522 73.5 54.8 115 + 34 1 - 2 4 + 2 0 9 - 10.38 none A Shirley 73.4 54.3 - 112 31 - 2 0 - 1 - 1 5 + 11 31.96 + none AL VA09MAS8-34-5-2 73.3 54.0 - 113 34 3 0 - 1 - 1 - 0 9 - 21.36 none TA Dyna-Gro 9750 73.2 54.0 - 112 - 32 1 - 3 + 3 + 1 0 10 4.813 - none TA DH12SRW057-006 73.2 58.3 + 114 + 31 - 2 0 - 2 - 1 0 9 - 18.66 none AL #Warrior 73.0 53.9 - 112 - 32 1 - 2 5 + 1 0 9 - 23.84 BCDL AL PGX 16-3 73.0 54.8 113 34 2 1 6 + 2 + 0 8 - 7.746 none A MAX216 72.8 56.4 + 112 - 30 - 2 1 4 + 1 - 0 10 10.04 none A AgriMAXX 463 72.8 53.7 - 111 - 31 - 2 4 + 3 1 0 9 3.521 - none TA
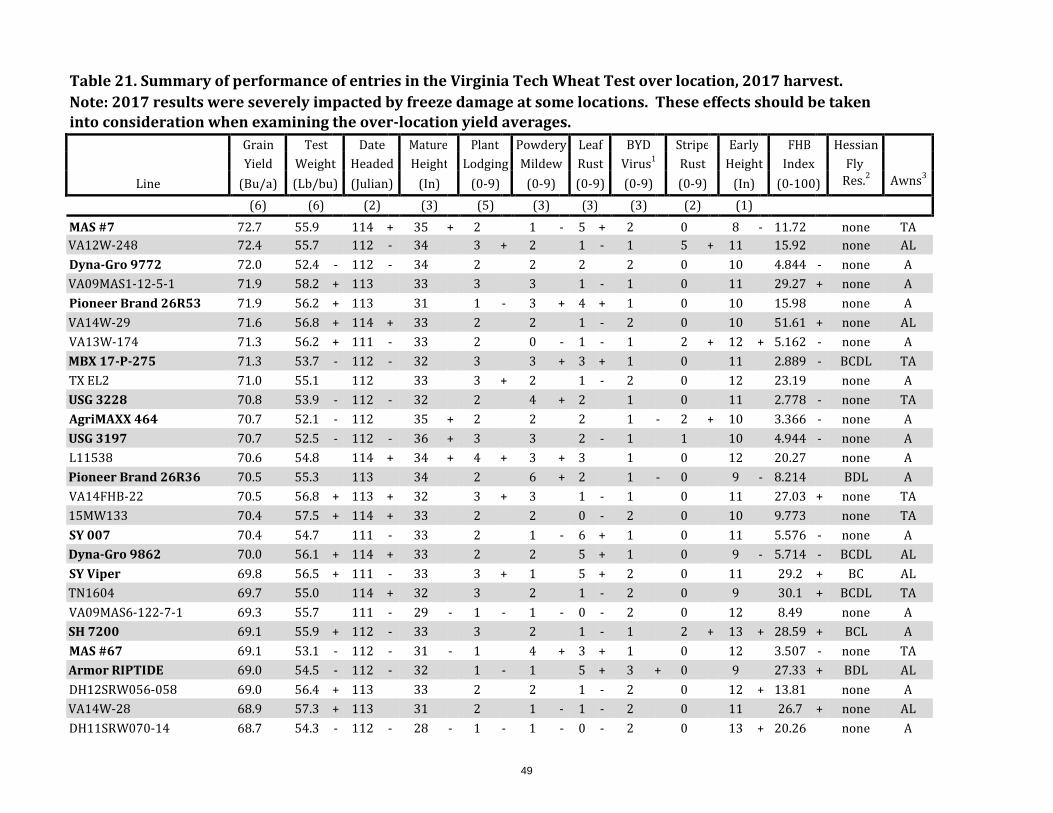
49
Table 21. Summary of performance of entries in the Virginia Tech Wheat Test over location, 2017 harvest. Note: 2017 results were severely impacted by freeze damage at some locations. These effects should be taken into consideration when examining the over-location yield averages. Grain Test Date Mature Plant Powdery Leaf BYD Stripe Early FHB Hessian Yield Weight Headed Height Lodging Mildew Rust Virus1
Rust Height Index Fly Line (Bu/a) (Lb/bu) (Julian) (In) (0-9) (0-9) (0-9) (0-9) (0-9) (In) (0-100) Res.2 Awns3
(6) (6) (2) (3) (5) (3) (3) (3) (2) (1) MAS #7 72.7 55.9 114 + 35 + 2 1 - 5 + 2 0 8 - 11.72 none TA VA12W-248 72.4 55.7 112 - 34 3 + 2 1 - 1 5 + 11 15.92 none AL Dyna-Gro 9772 72.0 52.4 - 112 - 34 2 2 2 2 0 10 4.844 - none A VA09MAS1-12-5-1 71.9 58.2 + 113 33 3 3 1 - 1 0 11 29.27 + none A Pioneer Brand 26R53 71.9 56.2 + 113 31 1 - 3 + 4 + 1 0 10 15.98 none A VA14W-29 71.6 56.8 + 114 + 33 2 2 1 - 2 0 10 51.61 + none AL VA13W-174 71.3 56.2 + 111 - 33 2 0 - 1 - 1 2 + 12 + 5.162 - none A MBX 17-P-275 71.3 53.7 - 112 - 32 3 3 + 3 + 1 0 11 2.889 - BCDL TA TX EL2 71.0 55.1 112 33 3 + 2 1 - 2 0 12 23.19 none A USG 3228 70.8 53.9 - 112 - 32 2 4 + 2 1 0 11 2.778 - none TA AgriMAXX 464 70.7 52.1 - 112 35 + 2 2 2 1 - 2 + 10 3.366 - none A USG 3197 70.7 52.5 - 112 - 36 + 3 3 2 - 1 1 10 4.944 - none A L11538 70.6 54.8 114 + 34 + 4 + 3 + 3 1 0 12 20.27 none A Pioneer Brand 26R36 70.5 55.3 113 34 2 6 + 2 1 - 0 9 - 8.214 BDL A VA14FHB-22 70.5 56.8 + 113 + 32 3 + 3 1 - 1 0 11 27.03 + none TA 15MW133 70.4 57.5 + 114 + 33 2 2 0 - 2 0 10 9.773 none TA SY 007 70.4 54.7 111 - 33 2 1 - 6 + 1 0 11 5.576 - none A Dyna-Gro 9862 70.0 56.1 + 114 + 33 2 2 5 + 1 0 9 - 5.714 - BCDL AL SY Viper 69.8 56.5 + 111 - 33 3 + 1 5 + 2 0 11 29.2 + BC AL TN1604 69.7 55.0 114 + 32 3 2 1 - 2 0 9 30.1 + BCDL TA VA09MAS6-122-7-1 69.3 55.7 111 - 29 - 1 - 1 - 0 - 2 0 12 8.49 none A SH 7200 69.1 55.9 + 112 - 33 3 2 1 - 1 2 + 13 + 28.59 + BCL A MAS #67 69.1 53.1 - 112 - 31 - 1 4 + 3 + 1 0 12 3.507 - none TA Armor RIPTIDE 69.0 54.5 - 112 - 32 1 - 1 5 + 3 + 0 9 27.33 + BDL AL DH12SRW056-058 69.0 56.4 + 113 33 2 2 1 - 2 0 12 + 13.81 none A VA14W-28 68.9 57.3 + 113 31 2 1 - 1 - 2 0 11 26.7 + none AL DH11SRW070-14 68.7 54.3 - 112 - 28 - 1 - 1 - 0 - 2 0 13 + 20.26 none A
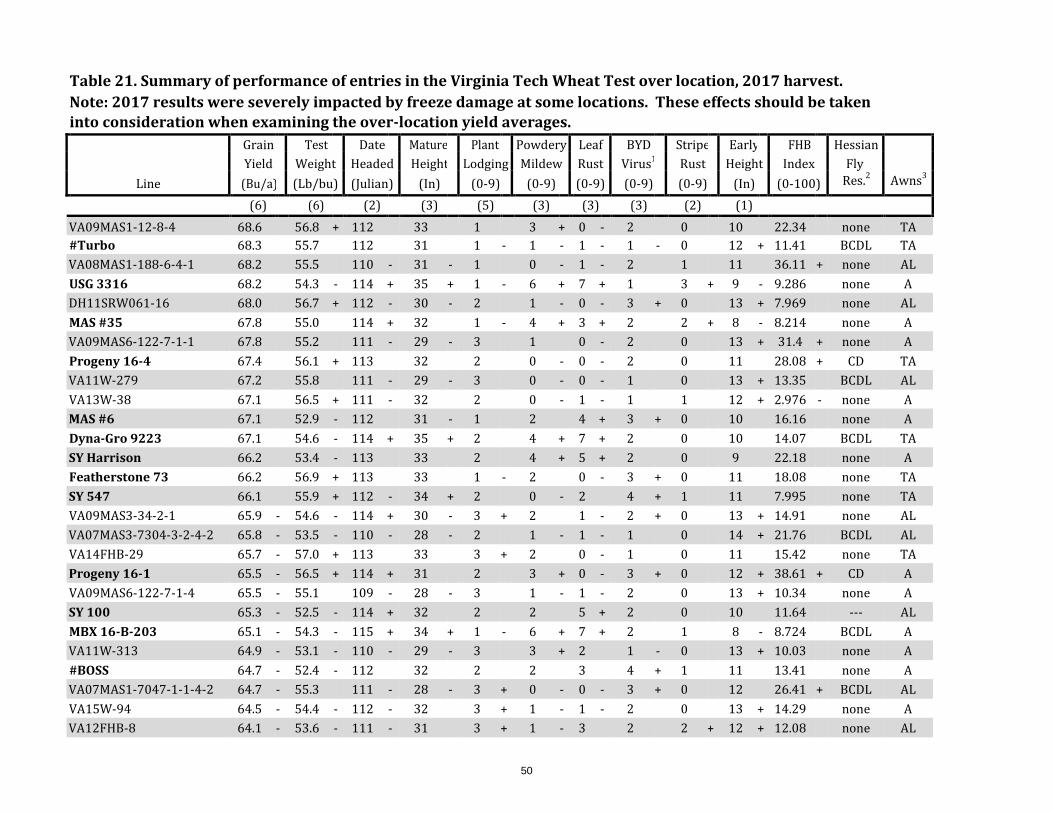
50
Table 21. Summary of performance of entries in the Virginia Tech Wheat Test over location, 2017 harvest. Note: 2017 results were severely impacted by freeze damage at some locations. These effects should be taken into consideration when examining the over-location yield averages. Grain Test Date Mature Plant Powdery Leaf BYD Stripe Early FHB Hessian Yield Weight Headed Height Lodging Mildew Rust Virus1
Rust Height Index Fly Line (Bu/a) (Lb/bu) (Julian) (In) (0-9) (0-9) (0-9) (0-9) (0-9) (In) (0-100) Res.2 Awns3
(6) (6) (2) (3) (5) (3) (3) (3) (2) (1) VA09MAS1-12-8-4 68.6 56.8 + 112 33 1 3 + 0 - 2 0 10 22.34 none TA #Turbo 68.3 55.7 112 31 1 - 1 - 1 - 1 - 0 12 + 11.41 BCDL TA VA08MAS1-188-6-4-1 68.2 55.5 110 - 31 - 1 0 - 1 - 2 1 11 36.11 + none AL USG 3316 68.2 54.3 - 114 + 35 + 1 - 6 + 7 + 1 3 + 9 - 9.286 none A DH11SRW061-16 68.0 56.7 + 112 - 30 - 2 1 - 0 - 3 + 0 13 + 7.969 none AL MAS #35 67.8 55.0 114 + 32 1 - 4 + 3 + 2 2 + 8 - 8.214 none A VA09MAS6-122-7-1-1 67.8 55.2 111 - 29 - 3 1 0 - 2 0 13 + 31.4 + none A Progeny 16-4 67.4 56.1 + 113 32 2 0 - 0 - 2 0 11 28.08 + CD TA VA11W-279 67.2 55.8 111 - 29 - 3 0 - 0 - 1 0 13 + 13.35 BCDL AL VA13W-38 67.1 56.5 + 111 - 32 2 0 - 1 - 1 1 12 + 2.976 - none A MAS #6 67.1 52.9 - 112 31 - 1 2 4 + 3 + 0 10 16.16 none A Dyna-Gro 9223 67.1 54.6 - 114 + 35 + 2 4 + 7 + 2 0 10 14.07 BCDL TA SY Harrison 66.2 53.4 - 113 33 2 4 + 5 + 2 0 9 22.18 none A Featherstone 73 66.2 56.9 + 113 33 1 - 2 0 - 3 + 0 11 18.08 none TA SY 547 66.1 55.9 + 112 - 34 + 2 0 - 2 4 + 1 11 7.995 none TA VA09MAS3-34-2-1 65.9 - 54.6 - 114 + 30 - 3 + 2 1 - 2 + 0 13 + 14.91 none AL VA07MAS3-7304-3-2-4-2 65.8 - 53.5 - 110 - 28 - 2 1 - 1 - 1 0 14 + 21.76 BCDL AL VA14FHB-29 65.7 - 57.0 + 113 33 3 + 2 0 - 1 0 11 15.42 none TA Progeny 16-1 65.5 - 56.5 + 114 + 31 2 3 + 0 - 3 + 0 12 + 38.61 + CD A VA09MAS6-122-7-1-4 65.5 - 55.1 109 - 28 - 3 1 - 1 - 2 0 13 + 10.34 none A SY 100 65.3 - 52.5 - 114 + 32 2 2 5 + 2 0 10 11.64 --- AL MBX 16-B-203 65.1 - 54.3 - 115 + 34 + 1 - 6 + 7 + 2 1 8 - 8.724 BCDL A VA11W-313 64.9 - 53.1 - 110 - 29 - 3 3 + 2 1 - 0 13 + 10.03 none A #BOSS 64.7 - 52.4 - 112 32 2 2 3 4 + 1 11 13.41 none A VA07MAS1-7047-1-1-4-2 64.7 - 55.3 111 - 28 - 3 + 0 - 0 - 3 + 0 12 26.41 + BCDL AL VA15W-94 64.5 - 54.4 - 112 - 32 3 + 1 - 1 - 2 0 13 + 14.29 none A VA12FHB-8 64.1 - 53.6 - 111 - 31 3 + 1 - 3 2 2 + 12 + 12.08 none AL
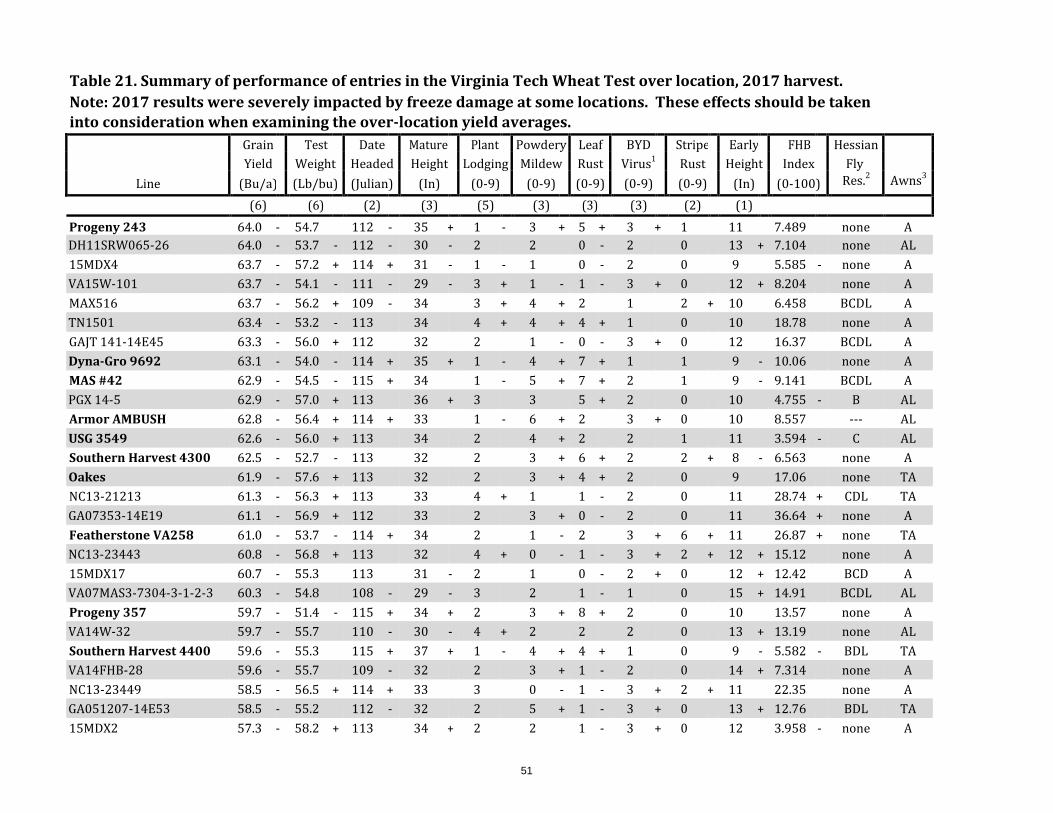
51
Table 21. Summary of performance of entries in the Virginia Tech Wheat Test over location, 2017 harvest. Note: 2017 results were severely impacted by freeze damage at some locations. These effects should be taken into consideration when examining the over-location yield averages. Grain Test Date Mature Plant Powdery Leaf BYD Stripe Early FHB Hessian Yield Weight Headed Height Lodging Mildew Rust Virus1
Rust Height Index Fly Line (Bu/a) (Lb/bu) (Julian) (In) (0-9) (0-9) (0-9) (0-9) (0-9) (In) (0-100) Res.2 Awns3
(6) (6) (2) (3) (5) (3) (3) (3) (2) (1) Progeny 243 64.0 - 54.7 112 - 35 + 1 - 3 + 5 + 3 + 1 11 7.489 none A DH11SRW065-26 64.0 - 53.7 - 112 - 30 - 2 2 0 - 2 0 13 + 7.104 none AL 15MDX4 63.7 - 57.2 + 114 + 31 - 1 - 1 0 - 2 0 9 5.585 - none A VA15W-101 63.7 - 54.1 - 111 - 29 - 3 + 1 - 1 - 3 + 0 12 + 8.204 none A MAX516 63.7 - 56.2 + 109 - 34 3 + 4 + 2 1 2 + 10 6.458 BCDL A TN1501 63.4 - 53.2 - 113 34 4 + 4 + 4 + 1 0 10 18.78 none A GAJT 141-14E45 63.3 - 56.0 + 112 32 2 1 - 0 - 3 + 0 12 16.37 BCDL A Dyna-Gro 9692 63.1 - 54.0 - 114 + 35 + 1 - 4 + 7 + 1 1 9 - 10.06 none A MAS #42 62.9 - 54.5 - 115 + 34 1 - 5 + 7 + 2 1 9 - 9.141 BCDL A PGX 14-5 62.9 - 57.0 + 113 36 + 3 3 5 + 2 0 10 4.755 - B AL Armor AMBUSH 62.8 - 56.4 + 114 + 33 1 - 6 + 2 3 + 0 10 8.557 --- AL USG 3549 62.6 - 56.0 + 113 34 2 4 + 2 2 1 11 3.594 - C AL Southern Harvest 4300 62.5 - 52.7 - 113 32 2 3 + 6 + 2 2 + 8 - 6.563 none A Oakes 61.9 - 57.6 + 113 32 2 3 + 4 + 2 0 9 17.06 none TA NC13-21213 61.3 - 56.3 + 113 33 4 + 1 1 - 2 0 11 28.74 + CDL TA GA07353-14E19 61.1 - 56.9 + 112 33 2 3 + 0 - 2 0 11 36.64 + none A Featherstone VA258 61.0 - 53.7 - 114 + 34 2 1 - 2 3 + 6 + 11 26.87 + none TA NC13-23443 60.8 - 56.8 + 113 32 4 + 0 - 1 - 3 + 2 + 12 + 15.12 none A 15MDX17 60.7 - 55.3 113 31 - 2 1 0 - 2 + 0 12 + 12.42 BCD A VA07MAS3-7304-3-1-2-3 60.3 - 54.8 108 - 29 - 3 2 1 - 1 0 15 + 14.91 BCDL AL Progeny 357 59.7 - 51.4 - 115 + 34 + 2 3 + 8 + 2 0 10 13.57 none A VA14W-32 59.7 - 55.7 110 - 30 - 4 + 2 2 2 0 13 + 13.19 none AL Southern Harvest 4400 59.6 - 55.3 115 + 37 + 1 - 4 + 4 + 1 0 9 - 5.582 - BDL TA VA14FHB-28 59.6 - 55.7 109 - 32 2 3 + 1 - 2 0 14 + 7.314 none A NC13-23449 58.5 - 56.5 + 114 + 33 3 0 - 1 - 3 + 2 + 11 22.35 none A GA051207-14E53 58.5 - 55.2 112 - 32 2 5 + 1 - 3 + 0 13 + 12.76 BDL TA 15MDX2 57.3 - 58.2 + 113 34 + 2 2 1 - 3 + 0 12 3.958 - none A
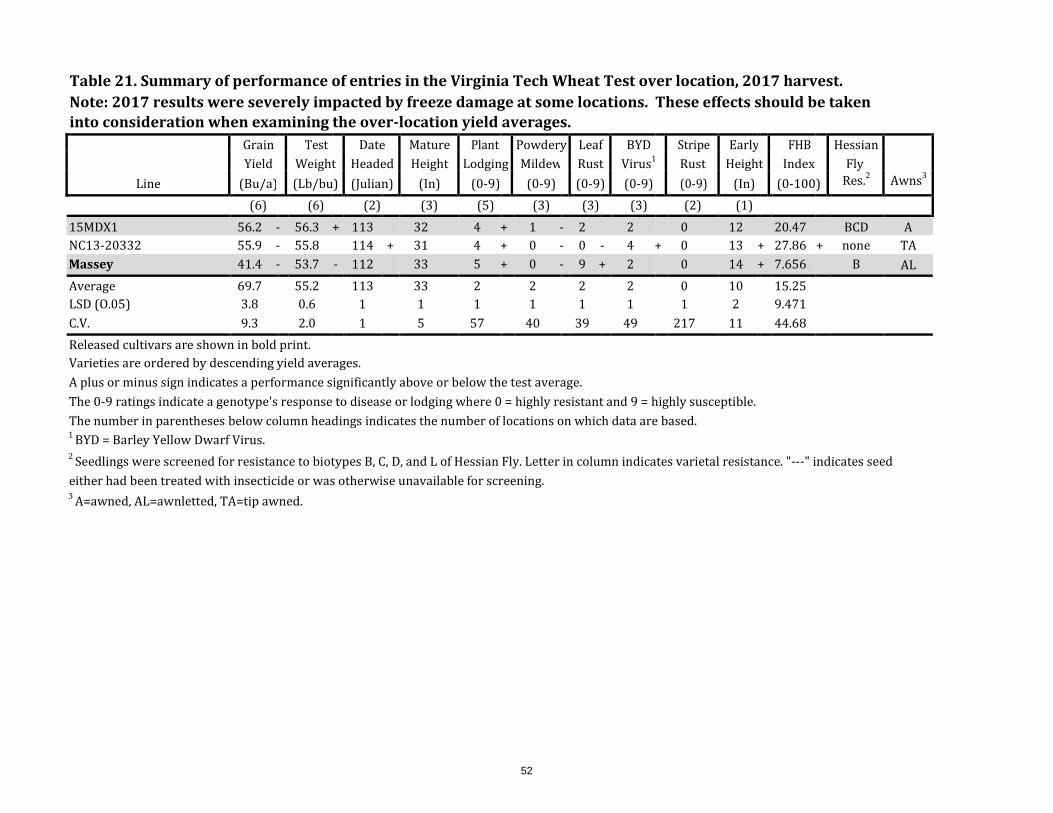
52
Table 21. Summary of performance of entries in the Virginia Tech Wheat Test over location, 2017 harvest. Note: 2017 results were severely impacted by freeze damage at some locations. These effects should be taken into consideration when examining the over-location yield averages. Grain Test Date Mature Plant Powdery Leaf BYD Stripe Early FHB Hessian Yield Weight Headed Height Lodging Mildew Rust Virus1
Rust Height Index Fly Line (Bu/a) (Lb/bu) (Julian) (In) (0-9) (0-9) (0-9) (0-9) (0-9) (In) (0-100) Res.2 Awns3
(6) (6) (2) (3) (5) (3) (3) (3) (2) (1) 15MDX1 56.2 - 56.3 + 113 32 4 + 1 - 2 2 0 12 20.47 BCD A NC13-20332 55.9 - 55.8 114 + 31 4 + 0 - 0 - 4 + 0 13 + 27.86 + none TA Massey 41.4 - 53.7 - 112 33 5 + 0 - 9 + 2 0 14 + 7.656 B AL Average 69.7 55.2 113 33 2 2 2 2 0 10 15.25 LSD (O.05) 3.8 0.6 1 1 1 1 1 1 1 2 9.471 C.V. 9.3 2.0 1 5 57 40 39 49 217 11 44.68 Released cultivars are shown in bold print. Varieties are ordered by descending yield averages. A plus or minus sign indicates a performance significantly above or below the test average. The 0-9 ratings indicate a genotype's response to disease or lodging where 0 = highly resistant and 9 = highly susceptible. The number in parentheses below column headings indicates the number of locations on which data are based. 1 BYD = Barley Yellow Dwarf Virus. 2 Seedlings were screened for resistance to biotypes B, C, D, and L of Hessian Fly. Letter in column indicates varietal resistance. "---" indicates seed either had been treated with insecticide or was otherwise unavailable for screening. 3 A=awned, AL=awnletted, TA=tip awned.
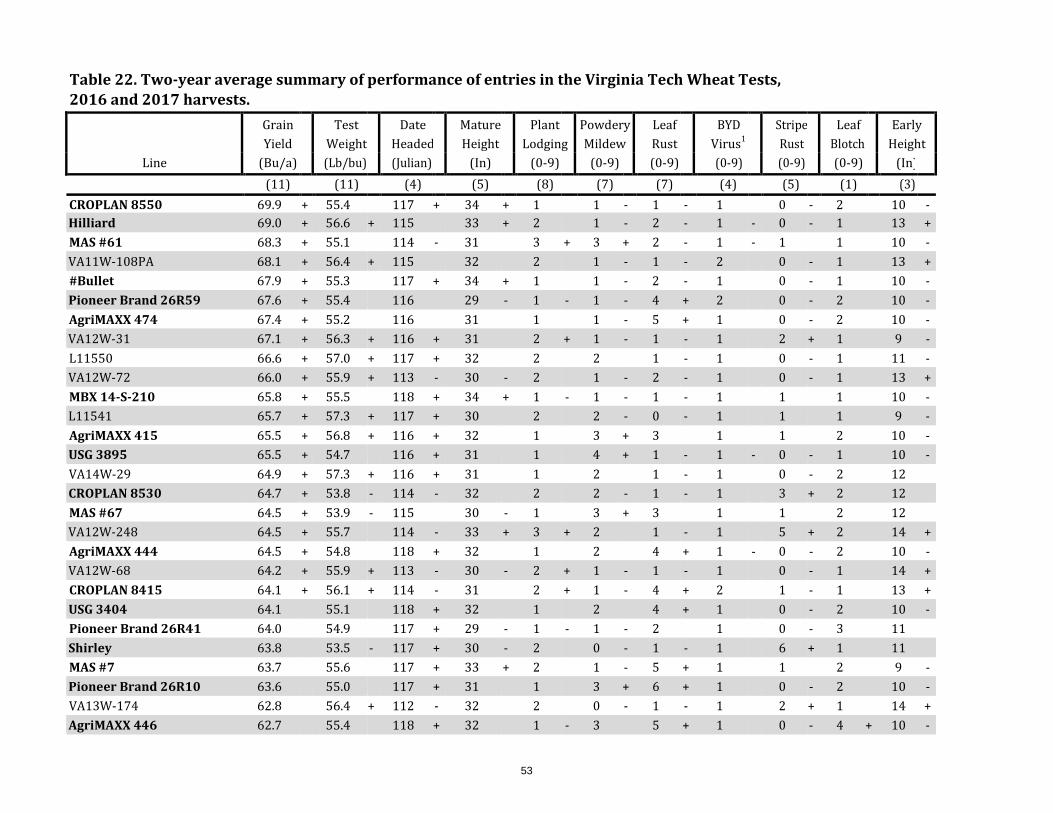
53
Table 22. Two-year average summary of performance of entries in the Virginia Tech Wheat Tests, 2016 and 2017 harvests. Grain Test Date Mature Plant Powdery Leaf BYD Stripe Leaf Early Yield Weight Headed Height Lodging Mildew Rust Virus1
Rust Blotch Height Line (Bu/a) (Lb/bu) (Julian) (In) (0-9) (0-9) (0-9) (0-9) (0-9) (0-9) (In)
(11) (11) (4) (5) (8) (7) (7) (4) (5) (1) (3) CROPLAN 8550 69.9 + 55.4 117 + 34 + 1 1 - 1 - 1 0 - 2 10 - Hilliard 69.0 + 56.6 + 115 33 + 2 1 - 2 - 1 - 0 - 1 13 + MAS #61 68.3 + 55.1 114 - 31 3 + 3 + 2 - 1 - 1 1 10 - VA11W-108PA 68.1 + 56.4 + 115 32 2 1 - 1 - 2 0 - 1 13 + #Bullet 67.9 + 55.3 117 + 34 + 1 1 - 2 - 1 0 - 1 10 - Pioneer Brand 26R59 67.6 + 55.4 116 29 - 1 - 1 - 4 + 2 0 - 2 10 - AgriMAXX 474 67.4 + 55.2 116 31 1 1 - 5 + 1 0 - 2 10 - VA12W-31 67.1 + 56.3 + 116 + 31 2 + 1 - 1 - 1 2 + 1 9 - L11550 66.6 + 57.0 + 117 + 32 2 2 1 - 1 0 - 1 11 - VA12W-72 66.0 + 55.9 + 113 - 30 - 2 1 - 2 - 1 0 - 1 13 + MBX 14-S-210 65.8 + 55.5 118 + 34 + 1 - 1 - 1 - 1 1 1 10 - L11541 65.7 + 57.3 + 117 + 30 2 2 - 0 - 1 1 1 9 - AgriMAXX 415 65.5 + 56.8 + 116 + 32 1 3 + 3 1 1 2 10 - USG 3895 65.5 + 54.7 116 + 31 1 4 + 1 - 1 - 0 - 1 10 - VA14W-29 64.9 + 57.3 + 116 + 31 1 2 1 - 1 0 - 2 12 CROPLAN 8530 64.7 + 53.8 - 114 - 32 2 2 - 1 - 1 3 + 2 12 MAS #67 64.5 + 53.9 - 115 30 - 1 3 + 3 1 1 2 12 VA12W-248 64.5 + 55.7 114 - 33 + 3 + 2 1 - 1 5 + 2 14 + AgriMAXX 444 64.5 + 54.8 118 + 32 1 2 4 + 1 - 0 - 2 10 - VA12W-68 64.2 + 55.9 + 113 - 30 - 2 + 1 - 1 - 1 0 - 1 14 + CROPLAN 8415 64.1 + 56.1 + 114 - 31 2 + 1 - 4 + 2 1 - 1 13 + USG 3404 64.1 55.1 118 + 32 1 2 4 + 1 0 - 2 10 - Pioneer Brand 26R41 64.0 54.9 117 + 29 - 1 - 1 - 2 1 0 - 3 11 Shirley 63.8 53.5 - 117 + 30 - 2 0 - 1 - 1 6 + 1 11 MAS #7 63.7 55.6 117 + 33 + 2 1 - 5 + 1 1 2 9 - Pioneer Brand 26R10 63.6 55.0 117 + 31 1 3 + 6 + 1 0 - 2 10 - VA13W-174 62.8 56.4 + 112 - 32 2 0 - 1 - 1 2 + 1 14 + AgriMAXX 446 62.7 55.4 118 + 32 1 - 3 5 + 1 0 - 4 + 10 -

54
Table 22. Two-year average summary of performance of entries in the Virginia Tech Wheat Tests, 2016 and 2017 harvests. Grain Test Date Mature Plant Powdery Leaf BYD Stripe Leaf Early Yield Weight Headed Height Lodging Mildew Rust Virus1
Rust Blotch Height Line (Bu/a) (Lb/bu) (Julian) (In) (0-9) (0-9) (0-9) (0-9) (0-9) (0-9) (In)
(11) (11) (4) (5) (8) (7) (7) (4) (5) (1) (3) USG 3197 62.6 53.2 - 116 34 + 2 + 2 2 - 1 - 2 1 11 Dyna-Gro 9522 62.3 54.9 118 + 32 1 - 2 4 + 1 0 - 3 + 10 - MAS #35 62.3 55.5 117 + 31 1 3 + 2 1 3 + 1 9 - SY Viper 62.1 56.8 + 114 - 33 + 3 + 2 - 5 + 1 0 - 1 13 + DH11SRW070-14 62.0 54.4 - 113 - 27 - 1 - 1 - 1 - 1 1 - 1 14 + Pioneer Brand 26R53 61.9 56.7 + 116 + 30 - 1 - 3 + 4 + 1 0 - 2 11 - VA09MAS1-12-8-4 61.5 57.3 + 115 32 1 4 + 0 - 2 0 - 1 11 Dyna-Gro 9600 61.5 53.5 - 114 - 32 1 1 - 1 - 2 3 + 2 13 + VA09MAS6-122-7-1 61.4 56.6 + 114 - 27 - 1 - 1 - 1 - 1 0 - 1 12 MAS #6 61.3 53.6 - 115 30 - 1 2 3 2 + 1 2 11 VA08MAS1-188-6-4-1 61.0 56.0 + 114 - 30 - 1 0 - 1 - 2 1 1 12 VA11W-279 60.8 56.6 + 112 - 28 - 2 + 0 - 0 - 1 1 - 1 14 + Dyna-Gro 9772 60.7 53.1 - 115 32 2 2 2 1 2 + 1 12 SY 547 60.7 55.9 + 115 33 + 2 + 0 - 2 - 3 + 2 1 13 + AgriMAXX 464 60.6 52.9 - 115 33 + 2 3 2 - 1 - 2 + 1 11 Featherstone 73 60.4 57.1 + 115 31 1 2 0 - 2 + 0 - 1 13 + VA13W-38 60.0 57.0 + 111 - 30 - 2 0 - 1 - 1 2 1 15 + VA12FHB-8 59.8 54.1 - 113 - 30 - 3 + 1 - 2 - 1 3 + 1 14 + SH 7200 59.7 56.3 + 112 - 32 2 + 2 1 - 1 3 + 1 15 + SY 007 58.9 55.1 113 - 31 2 1 - 6 + 1 1 2 13 + VA11W-313 58.6 54.1 - 111 - 28 - 3 + 2 2 - 1 0 - 1 15 + Pioneer Brand 26R36 58.5 - 55.8 + 117 + 32 2 5 + 2 1 0 - 3 9 - Dyna-Gro 9223 57.8 - 54.0 - 117 + 33 + 2 4 + 7 + 2 1 - 4 + 11 Featherstone VA258 57.1 - 54.2 - 116 + 33 + 2 + 1 - 2 - 2 + 7 + 1 12 MAS #42 56.9 - 54.4 - 117 + 33 + 1 - 5 + 7 + 1 2 + 2 11 - Southern Harvest 4300 56.8 - 53.1 - 117 + 31 2 3 + 5 + 2 4 + 2 9 - SY Harrison 56.3 - 53.9 - 116 + 31 1 4 + 5 + 2 1 - 3 + 10 - USG 3316 56.1 - 54.2 - 117 + 33 + 1 - 5 + 7 + 1 4 + 3 10 -

55
Table 22. Two-year average summary of performance of entries in the Virginia Tech Wheat Tests, 2016 and 2017 harvests.
Line
Grain Yield (Bu/a)
Test Weight (Lb/bu)
Date Headed (Julian)
Mature Height
(In)
Plant Lodging
(0-9)
Powdery Mildew
(0-9)
Leaf Rust (0-9)
BYD Virus1
(0-9)
Stripe Rust (0-9)
Leaf Blotch (0-9)
Early Height
(In)
(11) (11) (4) (5) (8) (7) (7) (4) (5) (1) (3)
MBX 16-B-203 55.4 - 54.0 - 118 + 33 + 1 - 6 + 7 + 2 3 + 3 + 9 - Oakes 54.6 - 58.0 + 116 31 2 + 4 + 4 + 2 2 2 12 VA07MAS3-7304-3-1-2-3 54.5 - 55.4 109 - 27 - 3 + 2 1 - 2 + 1 1 17 + Progeny 243 54.1 - 54.7 115 33 + 1 - 4 + 4 + 2 + 1 3 + 12 VA14FHB-28 53.7 - 56.0 + 110 - 30 - 2 2 1 - 1 1 2 16 + Dyna-Gro 9692 52.6 - 53.8 - 117 + 33 + 1 - 5 + 7 + 1 2 4 + 10 - Southern Harvest 4400 51.2 - 54.8 118 + 34 + 1 4 + 4 + 1 0 - 2 9 - Progeny 357 50.8 - 51.9 - 117 + 32 2 3 + 7 + 2 + 1 3 + 11 Massey 41.3 - 55.1 113 - 32 5 + 1 - 8 + 2 + 2 1 17 + Average 61.3 55.2 115 31 2 2 3 1 1 2 12 LSD (O.05) 2.8 0.5 1 1 0 1 1 1 1 1 1 C.V. 10.6 2.3 1 5 59 40 38 53 84 36 10 Released cultivars are shown in bold print. Varieties are ordered by descending yield averages. A plus or minus sign indicates a performance significantly above or below the test average. The 0-9 ratings indicate a genotype's response to disease or lodging where 0 = highly resistant and 9 = highly susceptible. The number in parentheses below column headings indicates the number of location-years on which data are based. 1 BYD = Barley Yellow Dwarf Virus.
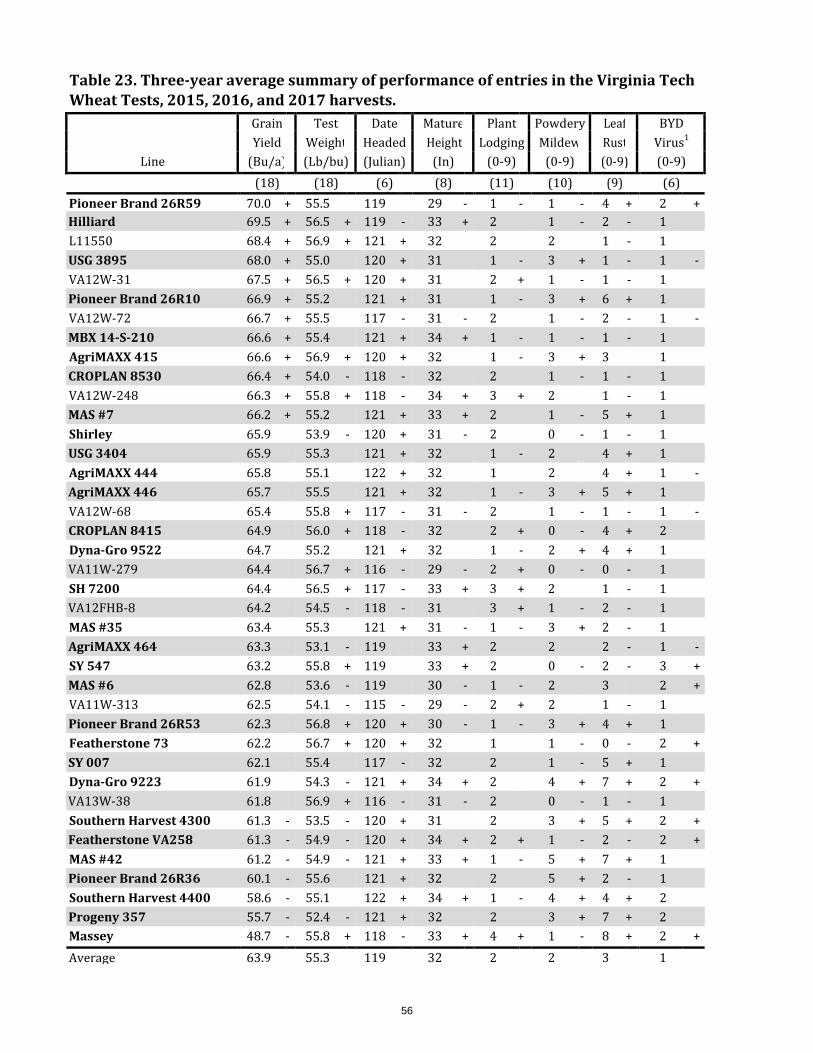
56
Table 23. Three-year average summary of performance of entries in the Virginia Tech Wheat Tests, 2015, 2016, and 2017 harvests. Grain Test Date Mature Plant Powdery Leaf BYD Yield Weight Headed Height Lodging Mildew Rust Virus1
Line (Bu/a) (Lb/bu) (Julian) (In) (0-9) (0-9) (0-9 ) (0-9)
(18) (18) (6) (8) (11) (10) (9) (6) Pioneer Brand 26R59 70.0 + 55.5 119 29 - 1 - 1 - 4 + 2 + Hilliard 69.5 + 56.5 + 119 - 33 + 2 1 - 2 - 1 L11550 68.4 + 56.9 + 121 + 32 2 2 1 - 1 USG 3895 68.0 + 55.0 120 + 31 1 - 3 + 1 - 1 - VA12W-31 67.5 + 56.5 + 120 + 31 2 + 1 - 1 - 1 Pioneer Brand 26R10 66.9 + 55.2 121 + 31 1 - 3 + 6 + 1 VA12W-72 66.7 + 55.5 117 - 31 - 2 1 - 2 - 1 - MBX 14-S-210 66.6 + 55.4 121 + 34 + 1 - 1 - 1 - 1 AgriMAXX 415 66.6 + 56.9 + 120 + 32 1 - 3 + 3 1 CROPLAN 8530 66.4 + 54.0 - 118 - 32 2 1 - 1 - 1 VA12W-248 66.3 + 55.8 + 118 - 34 + 3 + 2 1 - 1 MAS #7 66.2 + 55.2 121 + 33 + 2 1 - 5 + 1 Shirley 65.9 53.9 - 120 + 31 - 2 0 - 1 - 1 USG 3404 65.9 55.3 121 + 32 1 - 2 4 + 1 AgriMAXX 444 65.8 55.1 122 + 32 1 2 4 + 1 - AgriMAXX 446 65.7 55.5 121 + 32 1 - 3 + 5 + 1 VA12W-68 65.4 55.8 + 117 - 31 - 2 1 - 1 - 1 - CROPLAN 8415 64.9 56.0 + 118 - 32 2 + 0 - 4 + 2 Dyna-Gro 9522 64.7 55.2 121 + 32 1 - 2 + 4 + 1 VA11W-279 64.4 56.7 + 116 - 29 - 2 + 0 - 0 - 1 SH 7200 64.4 56.5 + 117 - 33 + 3 + 2 1 - 1 VA12FHB-8 64.2 54.5 - 118 - 31 3 + 1 - 2 - 1 MAS #35 63.4 55.3 121 + 31 - 1 - 3 + 2 - 1 AgriMAXX 464 63.3 53.1 - 119 33 + 2 2 2 - 1 - SY 547 63.2 55.8 + 119 33 + 2 0 - 2 - 3 + MAS #6 62.8 53.6 - 119 30 - 1 - 2 3 2 + VA11W-313 62.5 54.1 - 115 - 29 - 2 + 2 1 - 1 Pioneer Brand 26R53 62.3 56.8 + 120 + 30 - 1 - 3 + 4 + 1 Featherstone 73 62.2 56.7 + 120 + 32 1 1 - 0 - 2 + SY 007 62.1 55.4 117 - 32 2 1 - 5 + 1 Dyna-Gro 9223 61.9 54.3 - 121 + 34 + 2 4 + 7 + 2 + VA13W-38 61.8 56.9 + 116 - 31 - 2 0 - 1 - 1 Southern Harvest 4300 61.3 - 53.5 - 120 + 31 2 3 + 5 + 2 + Featherstone VA258 61.3 - 54.9 - 120 + 34 + 2 + 1 - 2 - 2 + MAS #42 61.2 - 54.9 - 121 + 33 + 1 - 5 + 7 + 1 Pioneer Brand 26R36 60.1 - 55.6 121 + 32 2 5 + 2 - 1 Southern Harvest 4400 58.6 - 55.1 122 + 34 + 1 - 4 + 4 + 2 Progeny 357 55.7 - 52.4 - 121 + 32 2 3 + 7 + 2 Massey 48.7 - 55.8 + 118 - 33 + 4 + 1 - 8 + 2 + Average 63.9 55.3 119 32 2 2 3 1
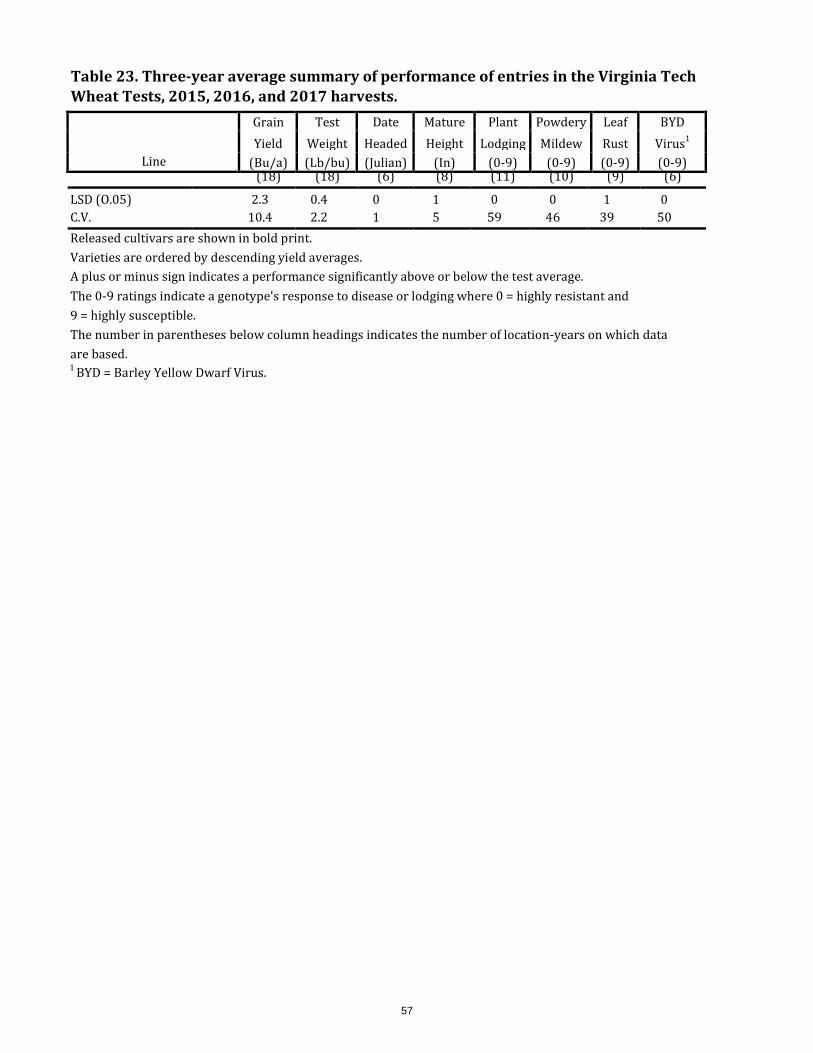
57
Table 23. Three-year average summary of performance of entries in the Virginia Tech Wheat Tests, 2015, 2016, and 2017 harvests.
(18) (18) (6) (8) (11) (10) (9) (6)
LSD (O.05) 2.3 0.4 0 1 0 0 1 0 C.V. 10.4 2.2 1 5 59 46 39 50 Released cultivars are shown in bold print. Varieties are ordered by descending yield averages. A plus or minus sign indicates a performance significantly above or below the test average. The 0-9 ratings indicate a genotype's response to disease or lodging where 0 = highly resistant and 9 = highly susceptible. The number in parentheses below column headings indicates the number of location-years on which data are based. 1 BYD = Barley Yellow Dwarf Virus.
Line
Grain Test Date Mature Plant Powdery Leaf BYD Yield Weight Headed Height Lodging Mildew Rust Virus1
(Bu/a) (Lb/bu) (Julian) (In) (0-9) (0-9) (0-9) (0-9)
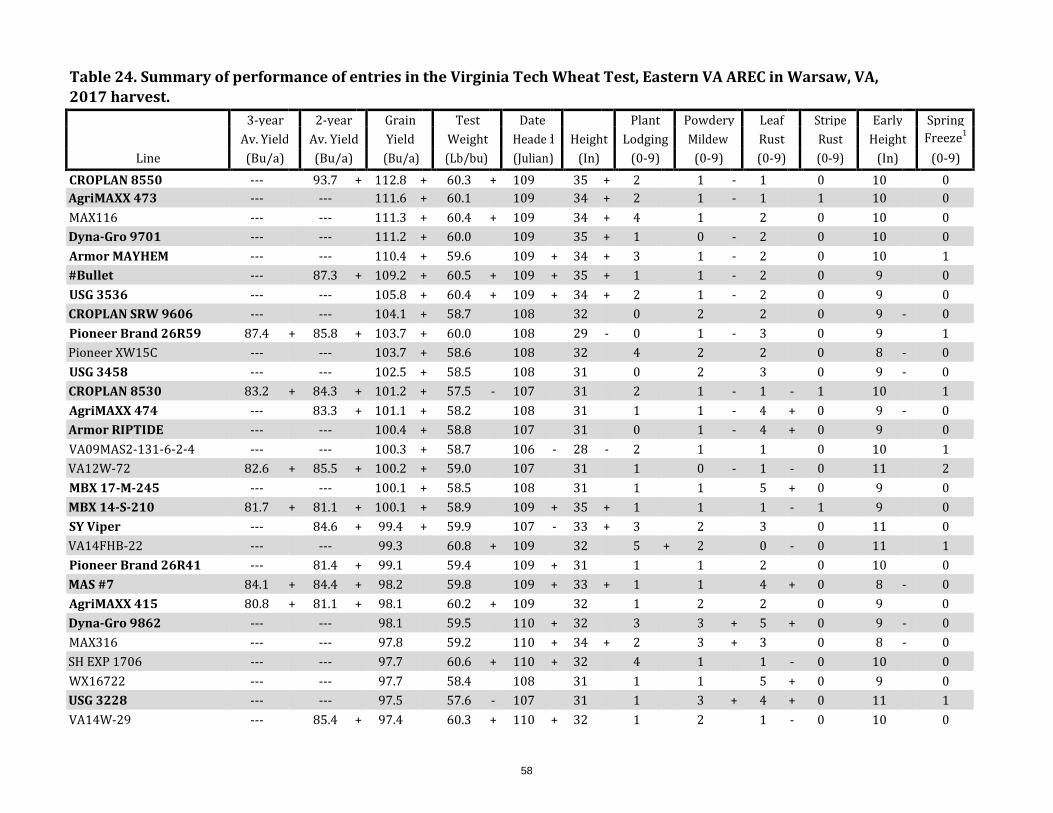
58
Table 24. Summary of performance of entries in the Virginia Tech Wheat Test, Eastern VA AREC in Warsaw, VA, 2017 harvest. 3-year 2-year Grain Test Date Plant Powdery Leaf Stripe Early Spring Av. Yield Av. Yield Yield Weight Heade d Height Lodging Mildew Rust Rust Height Freeze1
Line (Bu/a) (Bu/a) (Bu/a) (Lb/bu) (Julian ) (In) (0-9) (0-9) (0-9) (0-9) (In) (0-9) CROPLAN 8550 --- 93.7 + 112.8 + 60.3 + 109 35 + 2 1 - 1 0 10 0 AgriMAXX 473 --- --- 111.6 + 60.1 109 34 + 2 1 - 1 1 10 0 MAX116 --- --- 111.3 + 60.4 + 109 34 + 4 1 2 0 10 0 Dyna-Gro 9701 --- --- 111.2 + 60.0 109 35 + 1 0 - 2 0 10 0 Armor MAYHEM --- --- 110.4 + 59.6 109 + 34 + 3 1 - 2 0 10 1 #Bullet --- 87.3 + 109.2 + 60.5 + 109 + 35 + 1 1 - 2 0 9 0 USG 3536 --- --- 105.8 + 60.4 + 109 + 34 + 2 1 - 2 0 9 0 CROPLAN SRW 9606 --- --- 104.1 + 58.7 108 32 0 2 2 0 9 - 0 Pioneer Brand 26R59 87.4 + 85.8 + 103.7 + 60.0 108 29 - 0 1 - 3 0 9 1 Pioneer XW15C --- --- 103.7 + 58.6 108 32 4 2 2 0 8 - 0 USG 3458 --- --- 102.5 + 58.5 108 31 0 2 3 0 9 - 0 CROPLAN 8530 83.2 + 84.3 + 101.2 + 57.5 - 107 31 2 1 - 1 - 1 10 1 AgriMAXX 474 --- 83.3 + 101.1 + 58.2 108 31 1 1 - 4 + 0 9 - 0 Armor RIPTIDE --- --- 100.4 + 58.8 107 31 0 1 - 4 + 0 9 0 VA09MAS2-131-6-2-4 --- --- 100.3 + 58.7 106 - 28 - 2 1 1 0 10 1 VA12W-72 82.6 + 85.5 + 100.2 + 59.0 107 31 1 0 - 1 - 0 11 2 MBX 17-M-245 --- --- 100.1 + 58.5 108 31 1 1 5 + 0 9 0 MBX 14-S-210 81.7 + 81.1 + 100.1 + 58.9 109 + 35 + 1 1 1 - 1 9 0 SY Viper --- 84.6 + 99.4 + 59.9 107 - 33 + 3 2 3 0 11 0 VA14FHB-22 --- --- 99.3 60.8 + 109 32 5 + 2 0 - 0 11 1 Pioneer Brand 26R41 --- 81.4 + 99.1 59.4 109 + 31 1 1 2 0 10 0 MAS #7 84.1 + 84.4 + 98.2 59.8 109 + 33 + 1 1 4 + 0 8 - 0 AgriMAXX 415 80.8 + 81.1 + 98.1 60.2 + 109 32 1 2 2 0 9 0 Dyna-Gro 9862 --- --- 98.1 59.5 110 + 32 3 3 + 5 + 0 9 - 0 MAX316 --- --- 97.8 59.2 110 + 34 + 2 3 + 3 0 8 - 0 SH EXP 1706 --- --- 97.7 60.6 + 110 + 32 4 1 1 - 0 10 0 WX16722 --- --- 97.7 58.4 108 31 1 1 5 + 0 9 0 USG 3228 --- --- 97.5 57.6 - 107 31 1 3 + 4 + 0 11 1 VA14W-29 --- 85.4 + 97.4 60.3 + 110 + 32 1 2 1 - 0 10 0
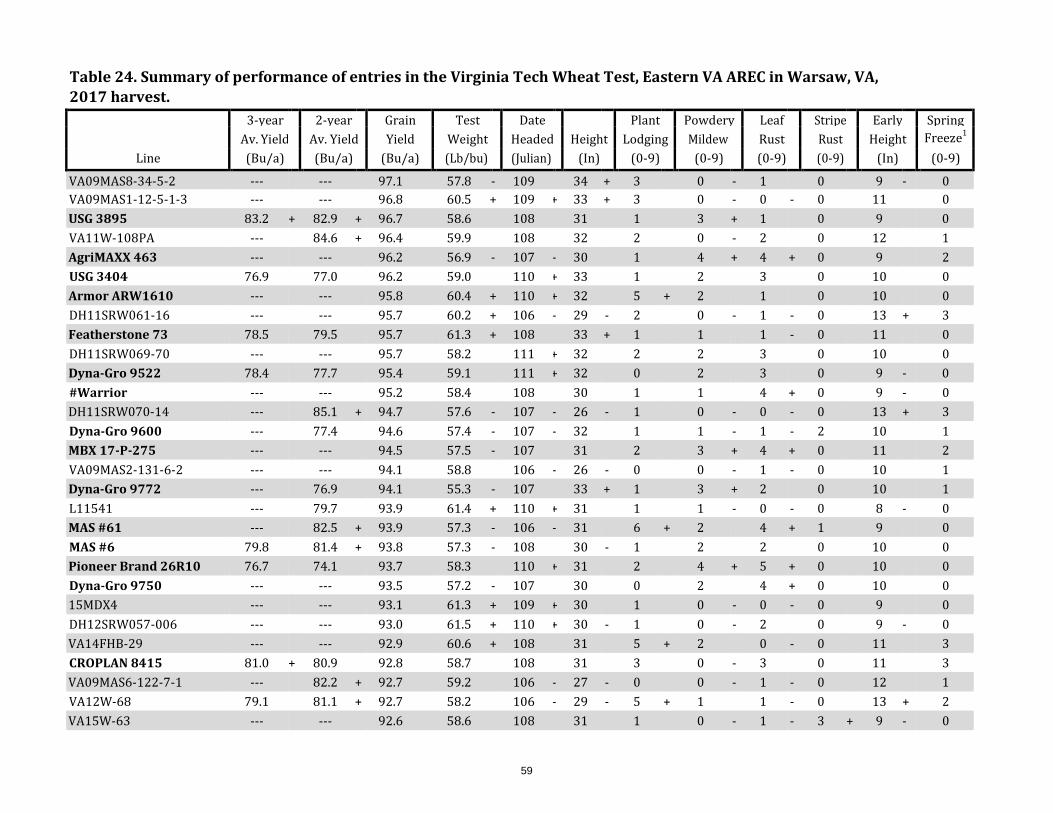
59
Table 24. Summary of performance of entries in the Virginia Tech Wheat Test, Eastern VA AREC in Warsaw, VA, 2017 harvest. 3-year 2-year Grain Test Date Plant Powdery Leaf Stripe Early Spring Av. Yield Av. Yield Yield Weight Headed Height Lodging Mildew Rust Rust Height Freeze1
Line (Bu/a) (Bu/a) (Bu/a) (Lb/bu) (Julian) (In) (0-9) (0-9) (0-9) (0-9) (In) (0-9)
VA09MAS8-34-5-2 --- --- 97.1 57.8 - 109 34 + 3 0 - 1 0 9 - 0 VA09MAS1-12-5-1-3 --- --- 96.8 60.5 + 109 + 33 + 3 0 - 0 - 0 11 0 USG 3895 83.2 + 82.9 + 96.7 58.6 108 31 1 3 + 1 0 9 0 VA11W-108PA --- 84.6 + 96.4 59.9 108 32 2 0 - 2 0 12 1 AgriMAXX 463 --- --- 96.2 56.9 - 107 - 30 1 4 + 4 + 0 9 2 USG 3404 76.9 77.0 96.2 59.0 110 + 33 1 2 3 0 10 0 Armor ARW1610 --- --- 95.8 60.4 + 110 + 32 5 + 2 1 0 10 0 DH11SRW061-16 --- --- 95.7 60.2 + 106 - 29 - 2 0 - 1 - 0 13 + 3 Featherstone 73 78.5 79.5 95.7 61.3 + 108 33 + 1 1 1 - 0 11 0 DH11SRW069-70 --- --- 95.7 58.2 111 + 32 2 2 3 0 10 0 Dyna-Gro 9522 78.4 77.7 95.4 59.1 111 + 32 0 2 3 0 9 - 0 #Warrior --- --- 95.2 58.4 108 30 1 1 4 + 0 9 - 0 DH11SRW070-14 --- 85.1 + 94.7 57.6 - 107 - 26 - 1 0 - 0 - 0 13 + 3 Dyna-Gro 9600 --- 77.4 94.6 57.4 - 107 - 32 1 1 - 1 - 2 10 1 MBX 17-P-275 --- --- 94.5 57.5 - 107 31 2 3 + 4 + 0 11 2 VA09MAS2-131-6-2 --- --- 94.1 58.8 106 - 26 - 0 0 - 1 - 0 10 1 Dyna-Gro 9772 --- 76.9 94.1 55.3 - 107 33 + 1 3 + 2 0 10 1 L11541 --- 79.7 93.9 61.4 + 110 + 31 1 1 - 0 - 0 8 - 0 MAS #61 --- 82.5 + 93.9 57.3 - 106 - 31 6 + 2 4 + 1 9 0 MAS #6 79.8 81.4 + 93.8 57.3 - 108 30 - 1 2 2 0 10 0 Pioneer Brand 26R10 76.7 74.1 93.7 58.3 110 + 31 2 4 + 5 + 0 10 0 Dyna-Gro 9750 --- --- 93.5 57.2 - 107 30 0 2 4 + 0 10 0 15MDX4 --- --- 93.1 61.3 + 109 + 30 1 0 - 0 - 0 9 0 DH12SRW057-006 --- --- 93.0 61.5 + 110 + 30 - 1 0 - 2 0 9 - 0 VA14FHB-29 --- --- 92.9 60.6 + 108 31 5 + 2 0 - 0 11 3 CROPLAN 8415 81.0 + 80.9 92.8 58.7 108 31 3 0 - 3 0 11 3 VA09MAS6-122-7-1 --- 82.2 + 92.7 59.2 106 - 27 - 0 0 - 1 - 0 12 1 VA12W-68 79.1 81.1 + 92.7 58.2 106 - 29 - 5 + 1 1 - 0 13 + 2 VA15W-63 --- --- 92.6 58.6 108 31 1 0 - 1 - 3 + 9 - 0
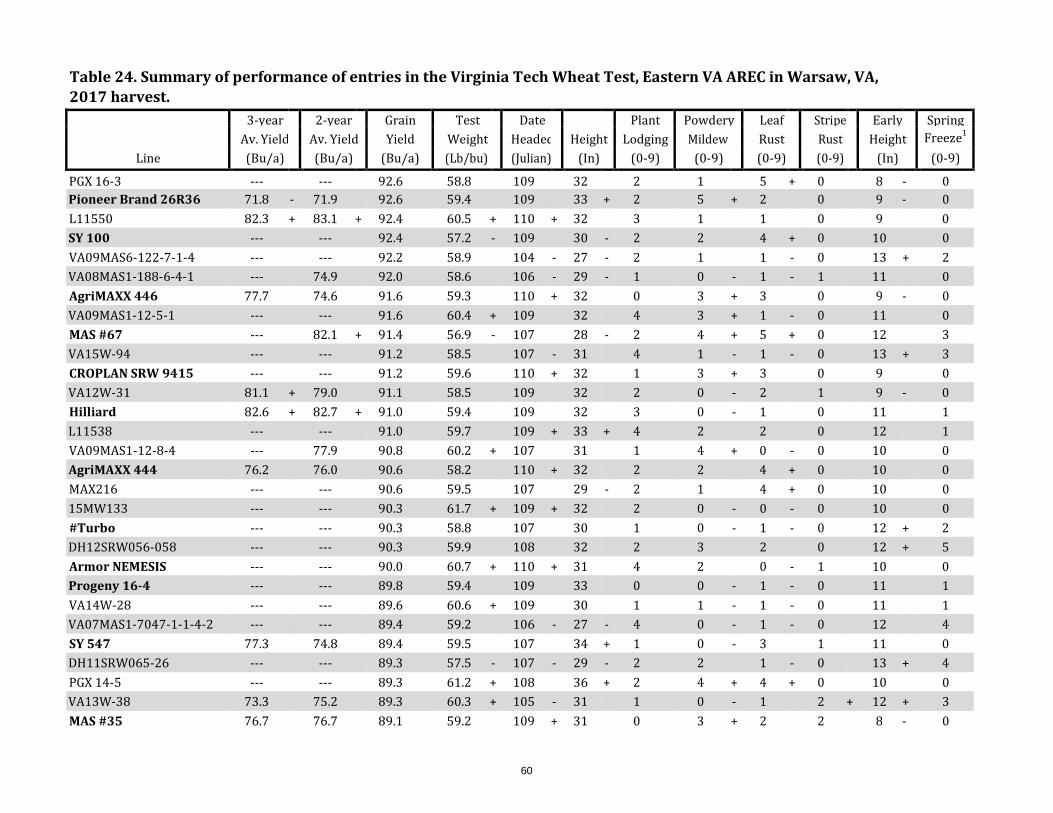
60
Table 24. Summary of performance of entries in the Virginia Tech Wheat Test, Eastern VA AREC in Warsaw, VA, 2017 harvest. 3-year 2-year Grain Test Date Plant Powdery Leaf Stripe Early Spring Av. Yield Av. Yield Yield Weight Headed Height Lodging Mildew Rust Rust Height Freeze1
Line (Bu/a) (Bu/a) (Bu/a) (Lb/bu) (Julian) (In) (0-9) (0-9) (0-9) (0-9) (In) (0-9)
PGX 16-3 --- --- 92.6 58.8 109 32 2 1 5 + 0 8 - 0 Pioneer Brand 26R36 71.8 - 71.9 92.6 59.4 109 33 + 2 5 + 2 0 9 - 0 L11550 82.3 + 83.1 + 92.4 60.5 + 110 + 32 3 1 1 0 9 0 SY 100 --- --- 92.4 57.2 - 109 30 - 2 2 4 + 0 10 0 VA09MAS6-122-7-1-4 --- --- 92.2 58.9 104 - 27 - 2 1 1 - 0 13 + 2 VA08MAS1-188-6-4-1 --- 74.9 92.0 58.6 106 - 29 - 1 0 - 1 - 1 11 0 AgriMAXX 446 77.7 74.6 91.6 59.3 110 + 32 0 3 + 3 0 9 - 0 VA09MAS1-12-5-1 --- --- 91.6 60.4 + 109 32 4 3 + 1 - 0 11 0 MAS #67 --- 82.1 + 91.4 56.9 - 107 28 - 2 4 + 5 + 0 12 3 VA15W-94 --- --- 91.2 58.5 107 - 31 4 1 - 1 - 0 13 + 3 CROPLAN SRW 9415 --- --- 91.2 59.6 110 + 32 1 3 + 3 0 9 0 VA12W-31 81.1 + 79.0 91.1 58.5 109 32 2 0 - 2 1 9 - 0 Hilliard 82.6 + 82.7 + 91.0 59.4 109 32 3 0 - 1 0 11 1 L11538 --- --- 91.0 59.7 109 + 33 + 4 2 2 0 12 1 VA09MAS1-12-8-4 --- 77.9 90.8 60.2 + 107 31 1 4 + 0 - 0 10 0 AgriMAXX 444 76.2 76.0 90.6 58.2 110 + 32 2 2 4 + 0 10 0 MAX216 --- --- 90.6 59.5 107 29 - 2 1 4 + 0 10 0 15MW133 --- --- 90.3 61.7 + 109 + 32 2 0 - 0 - 0 10 0 #Turbo --- --- 90.3 58.8 107 30 1 0 - 1 - 0 12 + 2 DH12SRW056-058 --- --- 90.3 59.9 108 32 2 3 2 0 12 + 5 Armor NEMESIS --- --- 90.0 60.7 + 110 + 31 4 2 0 - 1 10 0 Progeny 16-4 --- --- 89.8 59.4 109 33 0 0 - 1 - 0 11 1 VA14W-28 --- --- 89.6 60.6 + 109 30 1 1 - 1 - 0 11 1 VA07MAS1-7047-1-1-4-2 --- --- 89.4 59.2 106 - 27 - 4 0 - 1 - 0 12 4 SY 547 77.3 74.8 89.4 59.5 107 34 + 1 0 - 3 1 11 0 DH11SRW065-26 --- --- 89.3 57.5 - 107 - 29 - 2 2 1 - 0 13 + 4 PGX 14-5 --- --- 89.3 61.2 + 108 36 + 2 4 + 4 + 0 10 0 VA13W-38 73.3 75.2 89.3 60.3 + 105 - 31 1 0 - 1 2 + 12 + 3 MAS #35 76.7 76.7 89.1 59.2 109 + 31 0 3 + 2 2 8 - 0
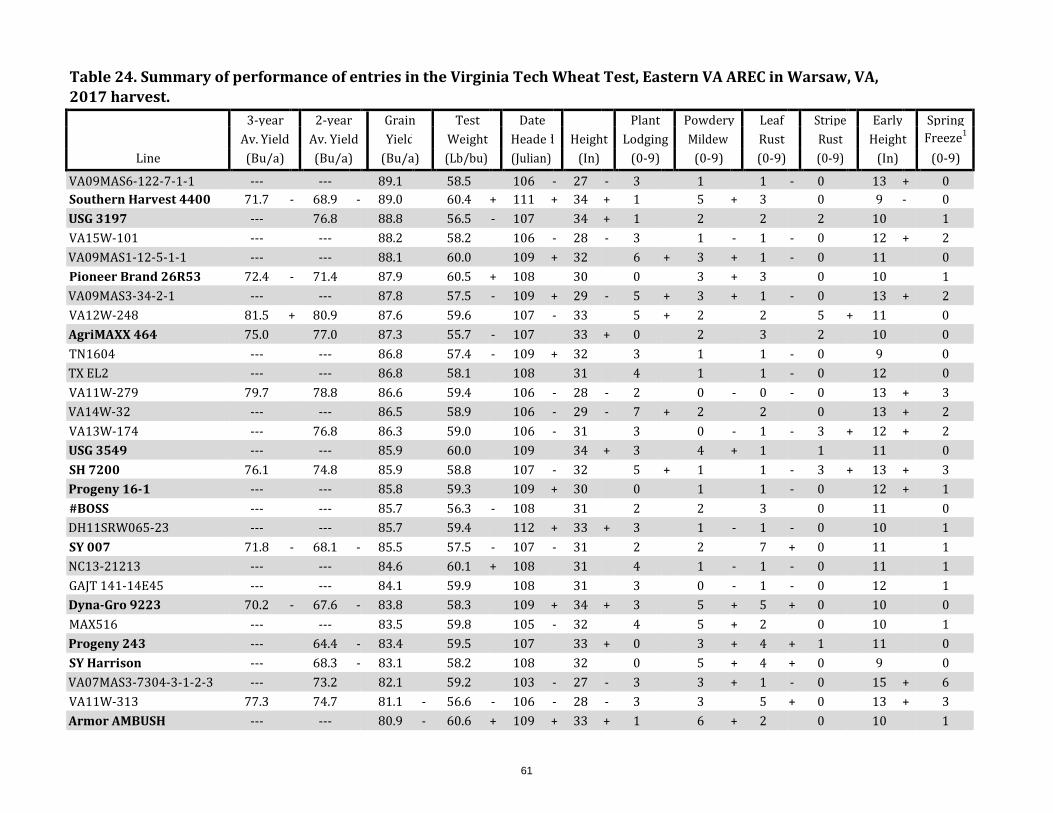
61
Table 24. Summary of performance of entries in the Virginia Tech Wheat Test, Eastern VA AREC in Warsaw, VA, 2017 harvest. 3-year 2-year Grain Test Date Plant Powdery Leaf Stripe Early Spring Av. Yield Av. Yield Yield Weight Heade d Height Lodging Mildew Rust Rust Height Freeze1
Line (Bu/a) (Bu/a) (Bu/a) (Lb/bu) (Julian) (In) (0-9) (0-9) (0-9) (0-9) (In) (0-9)
VA09MAS6-122-7-1-1 --- --- 89.1 58.5 106 - 27 - 3 1 1 - 0 13 + 0 Southern Harvest 4400 71.7 - 68.9 - 89.0 60.4 + 111 + 34 + 1 5 + 3 0 9 - 0 USG 3197 --- 76.8 88.8 56.5 - 107 34 + 1 2 2 2 10 1 VA15W-101 --- --- 88.2 58.2 106 - 28 - 3 1 - 1 - 0 12 + 2 VA09MAS1-12-5-1-1 --- --- 88.1 60.0 109 + 32 6 + 3 + 1 - 0 11 0 Pioneer Brand 26R53 72.4 - 71.4 87.9 60.5 + 108 30 0 3 + 3 0 10 1 VA09MAS3-34-2-1 --- --- 87.8 57.5 - 109 + 29 - 5 + 3 + 1 - 0 13 + 2 VA12W-248 81.5 + 80.9 87.6 59.6 107 - 33 5 + 2 2 5 + 11 0 AgriMAXX 464 75.0 77.0 87.3 55.7 - 107 33 + 0 2 3 2 10 0 TN1604 --- --- 86.8 57.4 - 109 + 32 3 1 1 - 0 9 0 TX EL2 --- --- 86.8 58.1 108 31 4 1 1 - 0 12 0 VA11W-279 79.7 78.8 86.6 59.4 106 - 28 - 2 0 - 0 - 0 13 + 3 VA14W-32 --- --- 86.5 58.9 106 - 29 - 7 + 2 2 0 13 + 2 VA13W-174 --- 76.8 86.3 59.0 106 - 31 3 0 - 1 - 3 + 12 + 2 USG 3549 --- --- 85.9 60.0 109 34 + 3 4 + 1 1 11 0 SH 7200 76.1 74.8 85.9 58.8 107 - 32 5 + 1 1 - 3 + 13 + 3 Progeny 16-1 --- --- 85.8 59.3 109 + 30 0 1 1 - 0 12 + 1 #BOSS --- --- 85.7 56.3 - 108 31 2 2 3 0 11 0 DH11SRW065-23 --- --- 85.7 59.4 112 + 33 + 3 1 - 1 - 0 10 1 SY 007 71.8 - 68.1 - 85.5 57.5 - 107 - 31 2 2 7 + 0 11 1 NC13-21213 --- --- 84.6 60.1 + 108 31 4 1 - 1 - 0 11 1 GAJT 141-14E45 --- --- 84.1 59.9 108 31 3 0 - 1 - 0 12 1 Dyna-Gro 9223 70.2 - 67.6 - 83.8 58.3 109 + 34 + 3 5 + 5 + 0 10 0 MAX516 --- --- 83.5 59.8 105 - 32 4 5 + 2 0 10 1 Progeny 243 --- 64.4 - 83.4 59.5 107 33 + 0 3 + 4 + 1 11 0 SY Harrison --- 68.3 - 83.1 58.2 108 32 0 5 + 4 + 0 9 0 VA07MAS3-7304-3-1-2-3 --- 73.2 82.1 59.2 103 - 27 - 3 3 + 1 - 0 15 + 6 VA11W-313 77.3 74.7 81.1 - 56.6 - 106 - 28 - 3 3 5 + 0 13 + 3 Armor AMBUSH --- --- 80.9 - 60.6 + 109 + 33 + 1 6 + 2 0 10 1

62
Table 24. Summary of performance of entries in the Virginia Tech Wheat Test, Eastern VA AREC in Warsaw, VA, 2017 harvest.
Line
3-yea Av. Yiel (Bu/a
r d
)
2-yea Av. Yie (Bu/a
r ld )
Grain Yield (Bu/a)
Test Weight (Lb/bu)
Date Headed (Julian)
Height
(In)
Plan Lodg
(0-9
t ng )
Powdery Mildew
(0-9)
Lea Rus (0-9
f t )
Strip Rus (0-9
e t )
Early Height
(In)
Spring Freeze1
(0-9) NC13-20332 --- --- 80.6 - 59.3 108 31 6 + 0 - 1 - 0 13 + 1 15MDX17 --- --- 79.9 - 58.9 107 31 1 1 - 1 - 0 12 + 1 Shirley 75.0 69.6 - 79.7 - 56.4 - 108 30 2 0 - 2 5 + 11 0 VA07MAS3-7304-3-2-4-2 --- --- 79.4 - 57.2 - 105 - 26 - 1 0 - 1 0 14 + 4 NC13-23443 --- --- 79.4 - 60.0 109 32 6 + 0 - 1 2 + 12 + 1 Oakes --- 64.7 - 78.6 - 61.4 + 108 31 2 3 + 3 0 9 1 TN1501 --- --- 78.5 - 56.2 - 108 31 5 + 5 + 3 0 10 0 VA14FHB-28 --- 72.4 77.7 - 58.9 105 - 30 3 4 + 1 0 14 + 5 GA051207-14E53 --- --- 76.7 - 57.4 - 107 - 31 3 6 + 1 - 0 13 + 4 15MDX2 --- --- 76.1 - 60.8 + 108 33 + 3 1 2 0 12 3 NC13-23449 --- --- 75.7 - 60.2 + 109 + 33 3 0 - 1 - 3 + 11 0 GA07353-14E19 --- --- 75.6 - 59.3 107 31 3 4 + 1 - 0 11 2 15MDX1 --- --- 74.9 - 59.9 108 32 5 + 0 - 2 0 12 1 Dyna-Gro 9692 --- 58.6 - 74.8 - 57.8 109 + 34 + 0 6 + 6 + 2 + 9 - 0 Southern Harvest 4300 70.3 - 65.5 - 74.4 - 56.3 - 109 + 31 1 3 + 5 + 3 + 8 - 0 VA12FHB-8 76.2 72.6 74.4 - 56.5 - 106 - 30 5 + 1 - 3 3 + 12 + 5 Featherstone VA258 72.7 69.2 - 73.5 - 56.4 - 109 34 + 4 1 - 2 7 + 11 1 USG 3316 --- 58.2 - 71.8 - 57.3 - 109 + 33 + 1 6 + 6 + 3 + 9 - 0 Progeny 357 60.2 - 57.9 - 69.8 - 57.0 - 110 + 32 3 4 + 8 + 0 10 0 MAS #42 66.4 - 61.3 - 66.7 - 57.6 - 110 + 33 + 0 6 + 7 + 2 9 - 0 MBX 16-B-203 --- 56.6 - 65.8 - 58.0 110 + 33 + 0 7 + 7 + 2 8 - 0 Massey 55.1 - 48.9 - 45.2 - 55.8 - 107 - 30 8 + 0 - 9 + 0 14 + 4 Average 76.5 75.8 90.3 58.9 108 31 2 2 2 0 10 1 LSD (O.05) 3.9 5.2 9.0 1.2 1 1 2 1 1 2 2 --- C.V. 6.1 6.7 6.1 1.4 1 3 82 39 38 257 11 --- Released cultivars are shown in bold print. Varieties are ordered by descending yield averages. A plus or minus sign indicates a performance significantly above or below the test average. The 0-9 ratings indicate a genotype's response to disease or lodging where 0 = highly resistant and 9 = highly susceptible. 1 Injury caused by spring freeze.
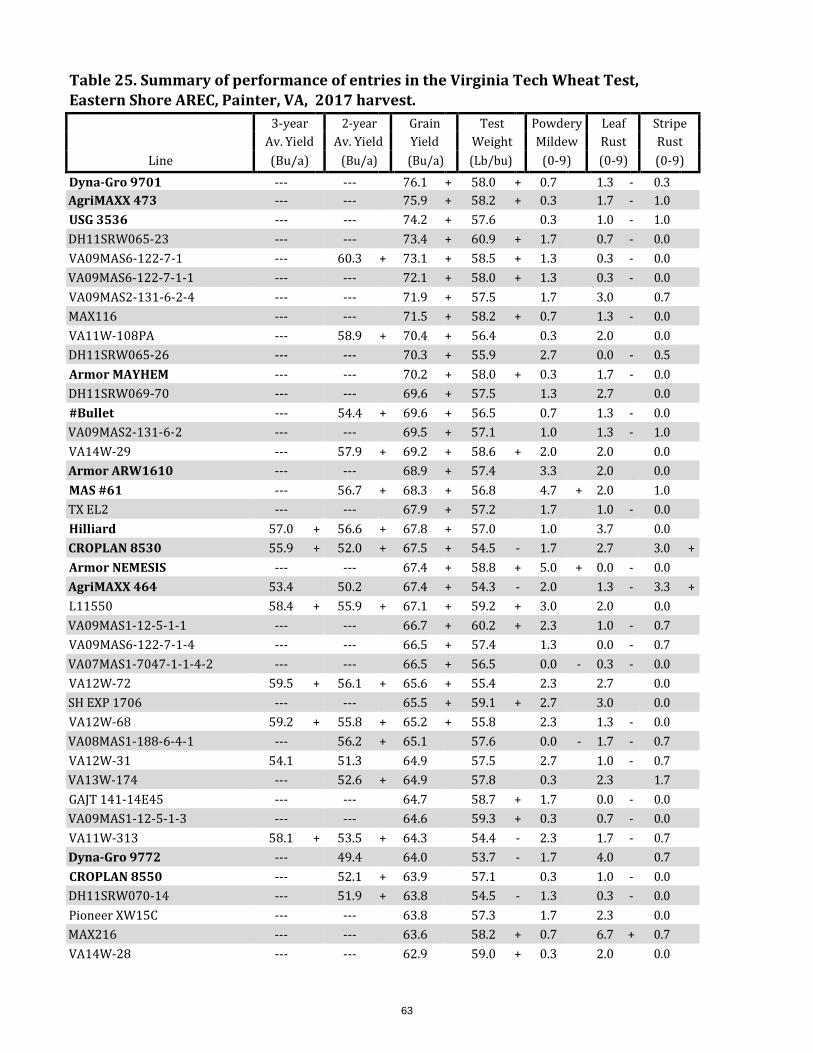
63
Table 25. Summary of performance of entries in the Virginia Tech Wheat Test, Eastern Shore AREC, Painter, VA, 2017 harvest. 3-year 2-year Grain Test Powdery Leaf Stripe Av. Yield Av. Yield Yield Weight Mildew Rust Rust
Line (Bu/a) (Bu/a) (Bu/a) (Lb/bu) (0-9) (0-9) (0-9) Dyna-Gro 9701 --- --- 76.1 + 58.0 + 0.7 1.3 - 0.3 AgriMAXX 473 --- --- 75.9 + 58.2 + 0.3 1.7 - 1.0 USG 3536 --- --- 74.2 + 57.6 0.3 1.0 - 1.0 DH11SRW065-23 --- --- 73.4 + 60.9 + 1.7 0.7 - 0.0 VA09MAS6-122-7-1 --- 60.3 + 73.1 + 58.5 + 1.3 0.3 - 0.0 VA09MAS6-122-7-1-1 --- --- 72.1 + 58.0 + 1.3 0.3 - 0.0 VA09MAS2-131-6-2-4 --- --- 71.9 + 57.5 1.7 3.0 0.7 MAX116 --- --- 71.5 + 58.2 + 0.7 1.3 - 0.0 VA11W-108PA --- 58.9 + 70.4 + 56.4 0.3 2.0 0.0 DH11SRW065-26 --- --- 70.3 + 55.9 2.7 0.0 - 0.5 Armor MAYHEM --- --- 70.2 + 58.0 + 0.3 1.7 - 0.0 DH11SRW069-70 --- --- 69.6 + 57.5 1.3 2.7 0.0 #Bullet --- 54.4 + 69.6 + 56.5 0.7 1.3 - 0.0 VA09MAS2-131-6-2 --- --- 69.5 + 57.1 1.0 1.3 - 1.0 VA14W-29 --- 57.9 + 69.2 + 58.6 + 2.0 2.0 0.0 Armor ARW1610 --- --- 68.9 + 57.4 3.3 2.0 0.0 MAS #61 --- 56.7 + 68.3 + 56.8 4.7 + 2.0 1.0 TX EL2 --- --- 67.9 + 57.2 1.7 1.0 - 0.0 Hilliard 57.0 + 56.6 + 67.8 + 57.0 1.0 3.7 0.0 CROPLAN 8530 55.9 + 52.0 + 67.5 + 54.5 - 1.7 2.7 3.0 + Armor NEMESIS --- --- 67.4 + 58.8 + 5.0 + 0.0 - 0.0 AgriMAXX 464 53.4 50.2 67.4 + 54.3 - 2.0 1.3 - 3.3 + L11550 58.4 + 55.9 + 67.1 + 59.2 + 3.0 2.0 0.0 VA09MAS1-12-5-1-1 --- --- 66.7 + 60.2 + 2.3 1.0 - 0.7 VA09MAS6-122-7-1-4 --- --- 66.5 + 57.4 1.3 0.0 - 0.7 VA07MAS1-7047-1-1-4-2 --- --- 66.5 + 56.5 0.0 - 0.3 - 0.0 VA12W-72 59.5 + 56.1 + 65.6 + 55.4 2.3 2.7 0.0 SH EXP 1706 --- --- 65.5 + 59.1 + 2.7 3.0 0.0 VA12W-68 59.2 + 55.8 + 65.2 + 55.8 2.3 1.3 - 0.0 VA08MAS1-188-6-4-1 --- 56.2 + 65.1 57.6 0.0 - 1.7 - 0.7 VA12W-31 54.1 51.3 64.9 57.5 2.7 1.0 - 0.7 VA13W-174 --- 52.6 + 64.9 57.8 0.3 2.3 1.7 GAJT 141-14E45 --- --- 64.7 58.7 + 1.7 0.0 - 0.0 VA09MAS1-12-5-1-3 --- --- 64.6 59.3 + 0.3 0.7 - 0.0 VA11W-313 58.1 + 53.5 + 64.3 54.4 - 2.3 1.7 - 0.7 Dyna-Gro 9772 --- 49.4 64.0 53.7 - 1.7 4.0 0.7 CROPLAN 8550 --- 52.1 + 63.9 57.1 0.3 1.0 - 0.0 DH11SRW070-14 --- 51.9 + 63.8 54.5 - 1.3 0.3 - 0.0 Pioneer XW15C --- --- 63.8 57.3 1.7 2.3 0.0 MAX216 --- --- 63.6 58.2 + 0.7 6.7 + 0.7 VA14W-28 --- --- 62.9 59.0 + 0.3 2.0 0.0
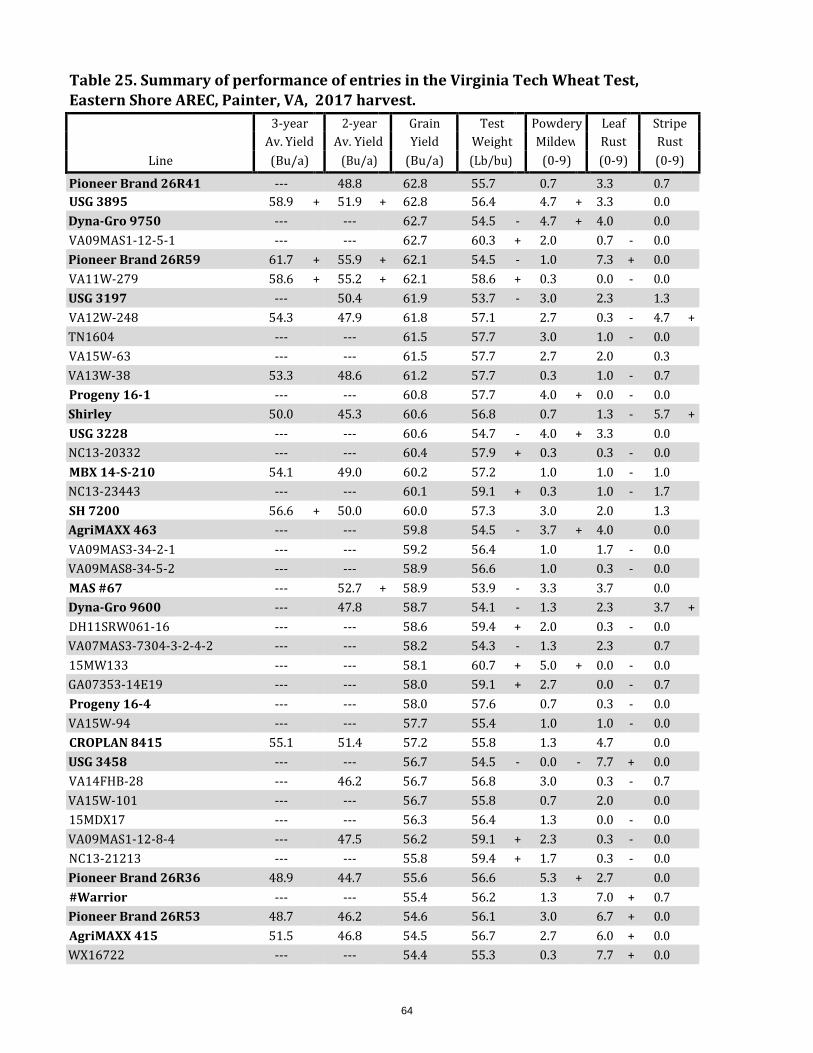
64
Table 25. Summary of performance of entries in the Virginia Tech Wheat Test, Eastern Shore AREC, Painter, VA, 2017 harvest. 3-year 2-year Grain Test Powdery Leaf Stripe Av. Yield Av. Yield Yield Weight Mildew Rust Rust
Line (Bu/a) (Bu/a) (Bu/a) (Lb/bu) (0-9) (0-9) (0-9)
Pioneer Brand 26R41 --- 48.8 62.8 55.7 0.7 3.3 0.7 USG 3895 58.9 + 51.9 + 62.8 56.4 4.7 + 3.3 0.0 Dyna-Gro 9750 --- --- 62.7 54.5 - 4.7 + 4.0 0.0 VA09MAS1-12-5-1 --- --- 62.7 60.3 + 2.0 0.7 - 0.0 Pioneer Brand 26R59 61.7 + 55.9 + 62.1 54.5 - 1.0 7.3 + 0.0 VA11W-279 58.6 + 55.2 + 62.1 58.6 + 0.3 0.0 - 0.0 USG 3197 --- 50.4 61.9 53.7 - 3.0 2.3 1.3 VA12W-248 54.3 47.9 61.8 57.1 2.7 0.3 - 4.7 + TN1604 --- --- 61.5 57.7 3.0 1.0 - 0.0 VA15W-63 --- --- 61.5 57.7 2.7 2.0 0.3 VA13W-38 53.3 48.6 61.2 57.7 0.3 1.0 - 0.7 Progeny 16-1 --- --- 60.8 57.7 4.0 + 0.0 - 0.0 Shirley 50.0 45.3 60.6 56.8 0.7 1.3 - 5.7 + USG 3228 --- --- 60.6 54.7 - 4.0 + 3.3 0.0 NC13-20332 --- --- 60.4 57.9 + 0.3 0.3 - 0.0 MBX 14-S-210 54.1 49.0 60.2 57.2 1.0 1.0 - 1.0 NC13-23443 --- --- 60.1 59.1 + 0.3 1.0 - 1.7 SH 7200 56.6 + 50.0 60.0 57.3 3.0 2.0 1.3 AgriMAXX 463 --- --- 59.8 54.5 - 3.7 + 4.0 0.0 VA09MAS3-34-2-1 --- --- 59.2 56.4 1.0 1.7 - 0.0 VA09MAS8-34-5-2 --- --- 58.9 56.6 1.0 0.3 - 0.0 MAS #67 --- 52.7 + 58.9 53.9 - 3.3 3.7 0.0 Dyna-Gro 9600 --- 47.8 58.7 54.1 - 1.3 2.3 3.7 + DH11SRW061-16 --- --- 58.6 59.4 + 2.0 0.3 - 0.0 VA07MAS3-7304-3-2-4-2 --- --- 58.2 54.3 - 1.3 2.3 0.7 15MW133 --- --- 58.1 60.7 + 5.0 + 0.0 - 0.0 GA07353-14E19 --- --- 58.0 59.1 + 2.7 0.0 - 0.7 Progeny 16-4 --- --- 58.0 57.6 0.7 0.3 - 0.0 VA15W-94 --- --- 57.7 55.4 1.0 1.0 - 0.0 CROPLAN 8415 55.1 51.4 57.2 55.8 1.3 4.7 0.0 USG 3458 --- --- 56.7 54.5 - 0.0 - 7.7 + 0.0 VA14FHB-28 --- 46.2 56.7 56.8 3.0 0.3 - 0.7 VA15W-101 --- --- 56.7 55.8 0.7 2.0 0.0 15MDX17 --- --- 56.3 56.4 1.3 0.0 - 0.0 VA09MAS1-12-8-4 --- 47.5 56.2 59.1 + 2.3 0.3 - 0.0 NC13-21213 --- --- 55.8 59.4 + 1.7 0.3 - 0.0 Pioneer Brand 26R36 48.9 44.7 55.6 56.6 5.3 + 2.7 0.0 #Warrior --- --- 55.4 56.2 1.3 7.0 + 0.7 Pioneer Brand 26R53 48.7 46.2 54.6 56.1 3.0 6.7 + 0.0 AgriMAXX 415 51.5 46.8 54.5 56.7 2.7 6.0 + 0.0 WX16722 --- --- 54.4 55.3 0.3 7.7 + 0.0
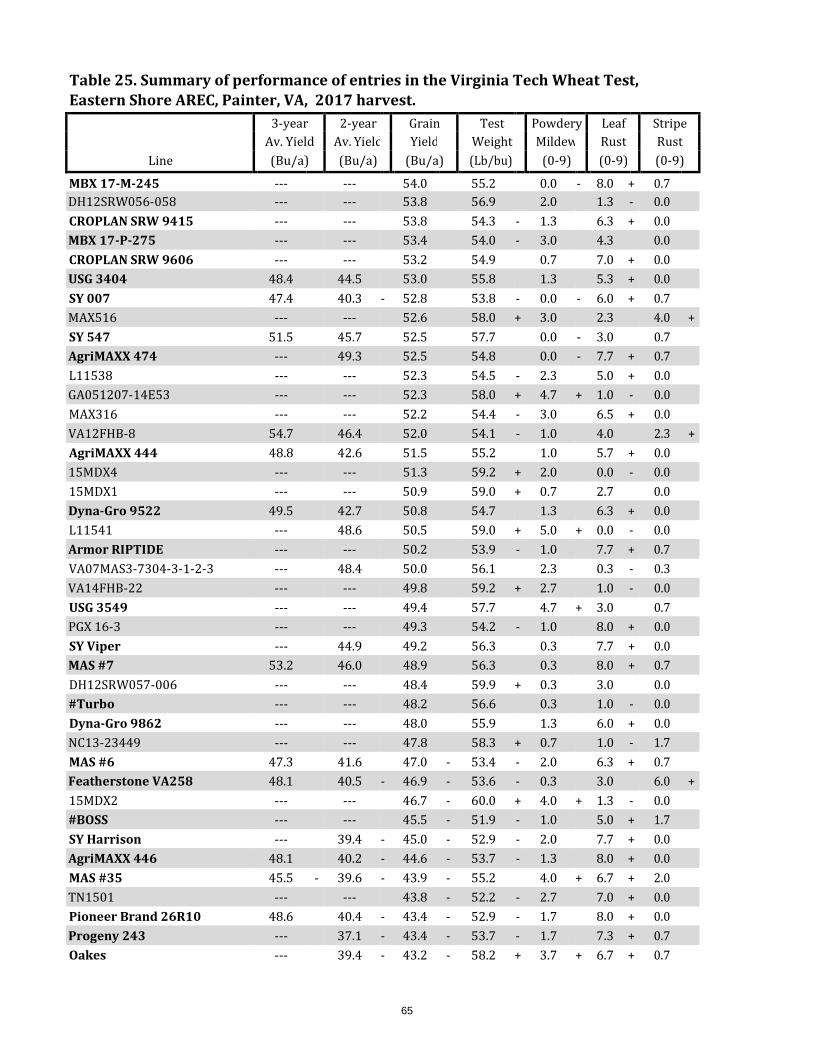
65
Table 25. Summary of performance of entries in the Virginia Tech Wheat Test, Eastern Shore AREC, Painter, VA, 2017 harvest. 3-year 2-year Grain Test Powdery Leaf Stripe Av. Yield Av. Yield Yield Weight Mildew Rust Rust
Line (Bu/a) (Bu/a) (Bu/a) (Lb/bu) (0-9) (0-9) (0-9)
MBX 17-M-245 --- --- 54.0 55.2 0.0 - 8.0 + 0.7 DH12SRW056-058 --- --- 53.8 56.9 2.0 1.3 - 0.0 CROPLAN SRW 9415 --- --- 53.8 54.3 - 1.3 6.3 + 0.0 MBX 17-P-275 --- --- 53.4 54.0 - 3.0 4.3 0.0 CROPLAN SRW 9606 --- --- 53.2 54.9 0.7 7.0 + 0.0 USG 3404 48.4 44.5 53.0 55.8 1.3 5.3 + 0.0 SY 007 47.4 40.3 - 52.8 53.8 - 0.0 - 6.0 + 0.7 MAX516 --- --- 52.6 58.0 + 3.0 2.3 4.0 + SY 547 51.5 45.7 52.5 57.7 0.0 - 3.0 0.7 AgriMAXX 474 --- 49.3 52.5 54.8 0.0 - 7.7 + 0.7 L11538 --- --- 52.3 54.5 - 2.3 5.0 + 0.0 GA051207-14E53 --- --- 52.3 58.0 + 4.7 + 1.0 - 0.0 MAX316 --- --- 52.2 54.4 - 3.0 6.5 + 0.0 VA12FHB-8 54.7 46.4 52.0 54.1 - 1.0 4.0 2.3 + AgriMAXX 444 48.8 42.6 51.5 55.2 1.0 5.7 + 0.0 15MDX4 --- --- 51.3 59.2 + 2.0 0.0 - 0.0 15MDX1 --- --- 50.9 59.0 + 0.7 2.7 0.0 Dyna-Gro 9522 49.5 42.7 50.8 54.7 1.3 6.3 + 0.0 L11541 --- 48.6 50.5 59.0 + 5.0 + 0.0 - 0.0 Armor RIPTIDE --- --- 50.2 53.9 - 1.0 7.7 + 0.7 VA07MAS3-7304-3-1-2-3 --- 48.4 50.0 56.1 2.3 0.3 - 0.3 VA14FHB-22 --- --- 49.8 59.2 + 2.7 1.0 - 0.0 USG 3549 --- --- 49.4 57.7 4.7 + 3.0 0.7 PGX 16-3 --- --- 49.3 54.2 - 1.0 8.0 + 0.0 SY Viper --- 44.9 49.2 56.3 0.3 7.7 + 0.0 MAS #7 53.2 46.0 48.9 56.3 0.3 8.0 + 0.7 DH12SRW057-006 --- --- 48.4 59.9 + 0.3 3.0 0.0 #Turbo --- --- 48.2 56.6 0.3 1.0 - 0.0 Dyna-Gro 9862 --- --- 48.0 55.9 1.3 6.0 + 0.0 NC13-23449 --- --- 47.8 58.3 + 0.7 1.0 - 1.7 MAS #6 47.3 41.6 47.0 - 53.4 - 2.0 6.3 + 0.7 Featherstone VA258 48.1 40.5 - 46.9 - 53.6 - 0.3 3.0 6.0 + 15MDX2 --- --- 46.7 - 60.0 + 4.0 + 1.3 - 0.0 #BOSS --- --- 45.5 - 51.9 - 1.0 5.0 + 1.7 SY Harrison --- 39.4 - 45.0 - 52.9 - 2.0 7.7 + 0.0 AgriMAXX 446 48.1 40.2 - 44.6 - 53.7 - 1.3 8.0 + 0.0 MAS #35 45.5 - 39.6 - 43.9 - 55.2 4.0 + 6.7 + 2.0 TN1501 --- --- 43.8 - 52.2 - 2.7 7.0 + 0.0 Pioneer Brand 26R10 48.6 40.4 - 43.4 - 52.9 - 1.7 8.0 + 0.0 Progeny 243 --- 37.1 - 43.4 - 53.7 - 1.7 7.3 + 0.7 Oakes --- 39.4 - 43.2 - 58.2 + 3.7 + 6.7 + 0.7

66
Table 25. Summary of performance of entries in the Virginia Tech Wheat Test, Eastern Shore AREC, Painter, VA, 2017 harvest.
Line
3-yea Av. Yiel (Bu/a
r d
)
2-yea Av. Yie (Bu/a
r ld )
Grain Yield (Bu/a)
Test Weight (Lb/bu)
Powdery Mildew
(0-9)
Leaf Rust (0-9)
Stripe Rust (0-9)
VA14FHB-29 --- --- 43.0 - 59.9 + 3.0 0.0 - 0.0 Dyna-Gro 9223 44.3 - 35.9 - 41.6 - 52.6 - 2.0 8.0 + 0.0 PGX 14-5 --- --- 41.0 - 57.2 1.3 7.3 + 0.0 Featherstone 73 45.0 - 39.9 - 40.8 - 59.1 + 2.0 0.0 - 0.0 VA14W-32 --- --- 39.7 - 56.5 2.0 4.0 0.0 Southern Harvest 4400 42.5 - 33.4 - 38.5 - 52.2 - 1.3 6.7 + 0.7 Southern Harvest 4300 40.9 - 33.8 - 38.2 - 50.2 - 1.7 8.0 + 1.3 USG 3316 --- 30.9 - 37.4 - 52.4 - 4.3 + 7.3 + 3.0 + Armor AMBUSH --- --- 36.0 - 58.7 + 6.7 + 2.7 0.7 MBX 16-B-203 --- 32.0 - 35.8 - 51.5 - 4.7 + 7.7 + 0.0 SY 100 --- --- 32.1 - 50.2 - 1.3 8.3 + 0.3 MAS #42 39.8 - 29.8 - 30.9 - 52.8 - 3.3 7.7 + 0.0 Dyna-Gro 9692 --- 27.4 - 29.4 - 50.5 - 1.3 8.7 + 1.0 Massey 37.4 - 28.1 - 25.2 - 53.6 - 0.0 - 9.0 + 0.0 Progeny 357 32.9 - 22.5 - 22.5 - 46.7 - 1.0 9.0 + 0.0 Average 50.8 46.1 56.3 56.3 1.8 3.3 0.5 LSD (O.05) 4.9 5.4 8.9 1.6 1.6 1.4 1.5 C.V. 11.9 11.9 11.1 1.9 52.2 26.7 170.8 Released cultivars are shown in bold print. Varieties are ordered by descending yield averages. A plus or minus sign indicates a performance significantly above or below the test average. The 0-9 ratings indicate a genotype's response to disease or lodging where 0 = highly resistant and 9 = highly susceptible. Note: this location was severely affected by stripe rust and leaf rust, reducing yields.

67
Table 26. Summary of performance of entries in the Virginia Tech Wheat Test, Southern Piedmont AREC, Blackstone, VA, 2017 harvest. Grain Test Plant Powder y BYD Yield Weight Lodging Mildew Virus1
Line (Bu/a) (Lb/bu) (0-9) (0-9) (0-9) MBX 17-M-245 76.5 + 55.0 3 2 1 #Warrior 73.3 + 54.9 3 3 1 AgriMAXX 474 72.7 + 54.7 3 2 2 VA09MAS1-12-5-1-3 71.9 + 57.4 + 4 0 - 1 CROPLAN SRW 9415 71.7 + 54.5 3 4 + 1 USG 3458 70.4 + 55.1 3 2 1 Armor NEMESIS 69.7 + 56.0 + 3 1 2 VA09MAS1-12-5-1-1 69.4 + 56.1 + 5 + 3 1 SH EXP 1706 69.1 + 55.7 + 4 2 1 L11541 68.9 + 56.7 + 3 3 3 + AgriMAXX 446 68.5 + 55.0 3 3 1 CROPLAN SRW 9606 68.3 + 54.1 4 3 1 Pioneer XW15C 68.0 + 54.7 5 + 2 3 + DH11SRW065-23 67.6 + 56.1 + 3 3 1 MAS #7 67.0 + 55.0 3 1 2 MBX 14-S-210 66.9 + 54.3 2 - 1 - 1 Shirley 66.9 + 53.9 3 0 - 1 PGX 16-3 66.7 + 55.0 3 1 2 MAX316 66.6 + 54.5 3 2 1 AgriMAXX 444 66.5 + 54.6 3 3 1 Pioneer Brand 26R59 66.1 54.2 3 2 3 + SY 007 65.8 53.7 4 2 1 MAS #61 65.2 53.2 - 5 + 3 + 1 PGX 14-5 65.0 56.6 + 3 3 1 SY Viper 64.8 56.0 + 4 2 1 AgriMAXX 415 64.7 54.8 3 3 + 1 CROPLAN 8415 64.7 54.9 4 0 - 2 CROPLAN 8550 64.7 53.7 2 - 1 - 1 L11550 64.3 55.0 4 2 1 Dyna-Gro 9862 64.2 55.1 3 2 1 Hilliard 64.1 54.6 3 1 - 1 15MW133 64.0 56.3 + 3 2 3 + VA11W-108PA 63.9 53.9 3 1 - 2 Pioneer Brand 26R10 63.8 54.5 3 4 + 1 USG 3404 63.8 54.9 3 2 1 Pioneer Brand 26R53 63.7 55.1 3 3 + 1 VA15W-63 63.7 56.0 + 2 - 1 - 1 VA09MAS2-131-6-2-4 63.5 53.4 - 3 1 1 WX16722 63.4 54.5 3 2 3 + AgriMAXX 473 63.4 53.8 3 1 - 1

68
Table 26. Summary of performance of entries in the Virginia Tech Wheat Test, Southern Piedmont AREC, Blackstone, VA, 2017 harvest. Grain Test Plant Powdery BYD Yield Weight Lodging Mildew Virus1
Line (Bu/a) (Lb/bu) (0-9) (0-9) (0-9)
#Bullet 63.4 53.6 3 1 - 1 Dyna-Gro 9701 63.3 52.7 - 2 - 1 - 3 VA13W-174 63.1 55.4 + 3 0 - 1 USG 3316 63.1 54.0 3 6 + 1 VA12W-31 63.1 54.9 4 1 - 1 MAX116 63.0 53.8 3 1 1 MAS #35 62.9 54.1 2 - 5 + 2 MBX 16-B-203 62.9 54.0 3 7 + 1 Armor ARW1610 62.6 55.3 + 3 2 2 DH12SRW057-006 62.6 57.4 + 3 0 - 1 Armor MAYHEM 62.2 54.2 2 - 1 - 1 VA14W-29 61.9 55.6 + 3 3 2 CROPLAN 8530 61.7 53.0 - 3 2 1 Oakes 61.6 56.7 + 4 4 + 1 Armor RIPTIDE 61.5 54.4 2 - 2 4 + Southern Harvest 4300 61.2 53.7 4 3 + 2 Dyna-Gro 9522 60.6 54.7 3 3 2 VA12W-248 60.6 55.4 + 4 2 1 Dyna-Gro 9600 60.1 52.5 - 4 2 2 L11538 60.1 53.5 5 + 4 + 1 MAX216 60.1 55.3 + 4 2 1 SH 7200 60.0 55.0 4 2 2 DH11SRW069-70 60.0 54.1 4 2 1 Dyna-Gro 9750 60.0 52.8 - 3 4 + 1 VA11W-279 60.0 55.5 + 4 0 - 1 AgriMAXX 464 59.9 50.7 - 4 3 1 MAS #42 59.7 54.2 3 6 + 1 MAX516 59.6 55.5 + 4 3 + 1 AgriMAXX 463 59.5 52.3 - 3 4 + 1 TN1604 59.4 54.1 3 3 3 + USG 3197 58.9 50.5 - 4 2 1 Progeny 357 58.9 52.4 - 4 5 + 3 USG 3895 58.8 53.8 3 4 + 1 MAS #67 58.8 52.3 - 3 4 + 1 TX EL2 58.5 54.2 5 + 3 1 #Turbo 58.4 54.3 2 - 2 1 USG 3228 58.2 52.6 - 3 4 + 1 DH11SRW070-14 58.2 54.0 2 - 0 - 1 Pioneer Brand 26R41 58.1 53.1 - 2 - 1 - 1 Southern Harvest 4400 58.0 54.1 2 - 5 + 3
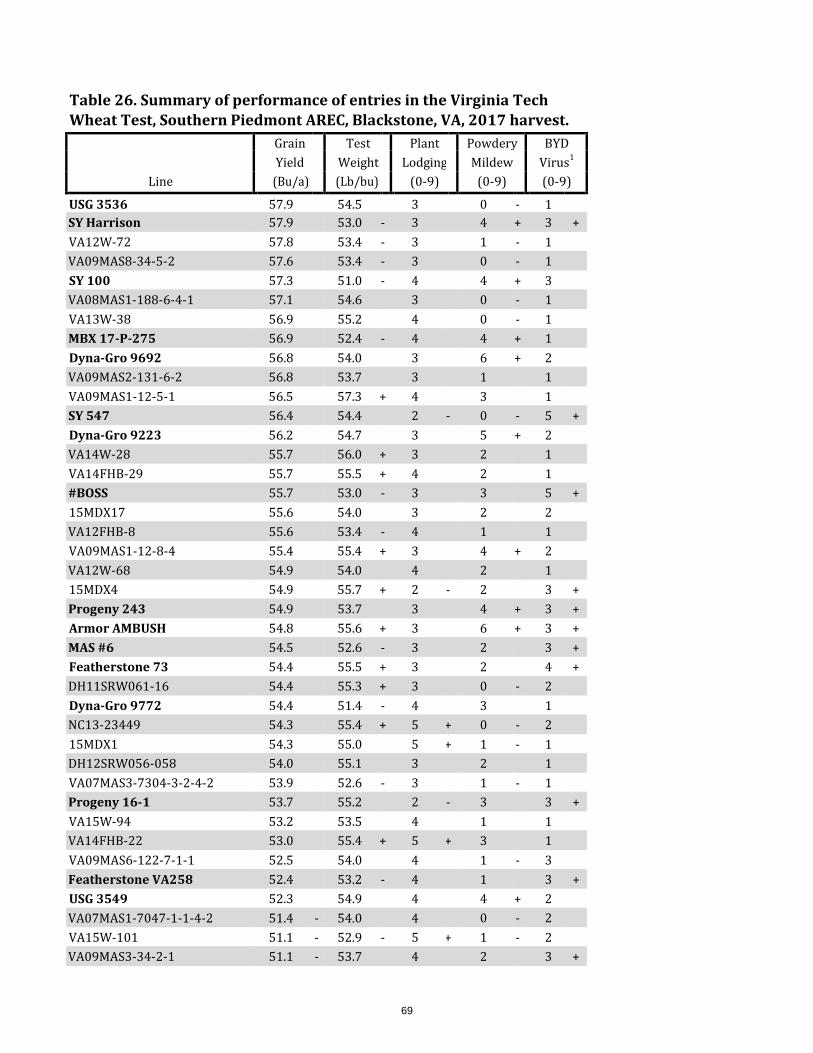
69
Table 26. Summary of performance of entries in the Virginia Tech Wheat Test, Southern Piedmont AREC, Blackstone, VA, 2017 harvest. Grain Test Plant Powdery BYD Yield Weight Lodging Mildew Virus1
Line (Bu/a) (Lb/bu) (0-9) (0-9) (0-9)
USG 3536 57.9 54.5 3 0 - 1 SY Harrison 57.9 53.0 - 3 4 + 3 + VA12W-72 57.8 53.4 - 3 1 - 1 VA09MAS8-34-5-2 57.6 53.4 - 3 0 - 1 SY 100 57.3 51.0 - 4 4 + 3 VA08MAS1-188-6-4-1 57.1 54.6 3 0 - 1 VA13W-38 56.9 55.2 4 0 - 1 MBX 17-P-275 56.9 52.4 - 4 4 + 1 Dyna-Gro 9692 56.8 54.0 3 6 + 2 VA09MAS2-131-6-2 56.8 53.7 3 1 1 VA09MAS1-12-5-1 56.5 57.3 + 4 3 1 SY 547 56.4 54.4 2 - 0 - 5 + Dyna-Gro 9223 56.2 54.7 3 5 + 2 VA14W-28 55.7 56.0 + 3 2 1 VA14FHB-29 55.7 55.5 + 4 2 1 #BOSS 55.7 53.0 - 3 3 5 + 15MDX17 55.6 54.0 3 2 2 VA12FHB-8 55.6 53.4 - 4 1 1 VA09MAS1-12-8-4 55.4 55.4 + 3 4 + 2 VA12W-68 54.9 54.0 4 2 1 15MDX4 54.9 55.7 + 2 - 2 3 + Progeny 243 54.9 53.7 3 4 + 3 + Armor AMBUSH 54.8 55.6 + 3 6 + 3 + MAS #6 54.5 52.6 - 3 2 3 + Featherstone 73 54.4 55.5 + 3 2 4 + DH11SRW061-16 54.4 55.3 + 3 0 - 2 Dyna-Gro 9772 54.4 51.4 - 4 3 1 NC13-23449 54.3 55.4 + 5 + 0 - 2 15MDX1 54.3 55.0 5 + 1 - 1 DH12SRW056-058 54.0 55.1 3 2 1 VA07MAS3-7304-3-2-4-2 53.9 52.6 - 3 1 - 1 Progeny 16-1 53.7 55.2 2 - 3 3 + VA15W-94 53.2 53.5 4 1 1 VA14FHB-22 53.0 55.4 + 5 + 3 1 VA09MAS6-122-7-1-1 52.5 54.0 4 1 - 3 Featherstone VA258 52.4 53.2 - 4 1 3 + USG 3549 52.3 54.9 4 4 + 2 VA07MAS1-7047-1-1-4-2 51.4 - 54.0 4 0 - 2 VA15W-101 51.1 - 52.9 - 5 + 1 - 2 VA09MAS3-34-2-1 51.1 - 53.7 4 2 3 +
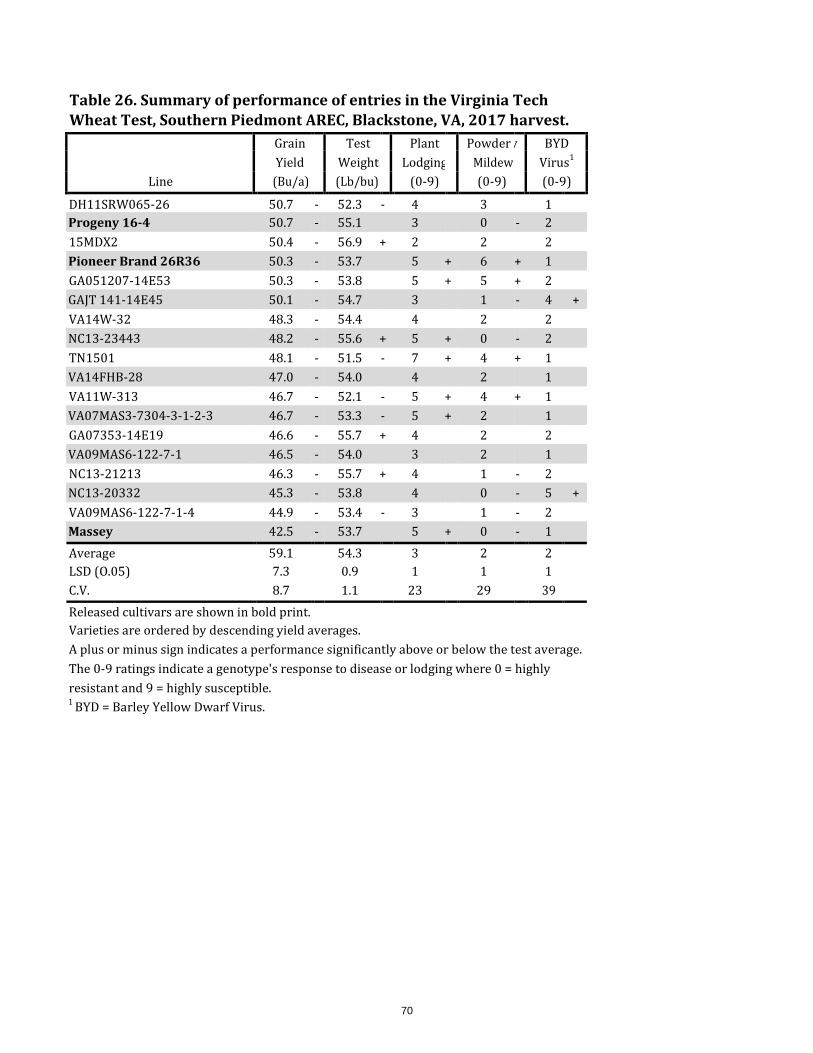
70
Table 26. Summary of performance of entries in the Virginia Tech Wheat Test, Southern Piedmont AREC, Blackstone, VA, 2017 harvest. Grain Test Plant Powder y BYD Yield Weight Lodging Mildew Virus1
Line (Bu/a) (Lb/bu) (0-9) (0-9) (0-9)
DH11SRW065-26 50.7 - 52.3 - 4 3 1 Progeny 16-4 50.7 - 55.1 3 0 - 2 15MDX2 50.4 - 56.9 + 2 2 2 Pioneer Brand 26R36 50.3 - 53.7 5 + 6 + 1 GA051207-14E53 50.3 - 53.8 5 + 5 + 2 GAJT 141-14E45 50.1 - 54.7 3 1 - 4 + VA14W-32 48.3 - 54.4 4 2 2 NC13-23443 48.2 - 55.6 + 5 + 0 - 2 TN1501 48.1 - 51.5 - 7 + 4 + 1 VA14FHB-28 47.0 - 54.0 4 2 1 VA11W-313 46.7 - 52.1 - 5 + 4 + 1 VA07MAS3-7304-3-1-2-3 46.7 - 53.3 - 5 + 2 1 GA07353-14E19 46.6 - 55.7 + 4 2 2 VA09MAS6-122-7-1 46.5 - 54.0 3 2 1 NC13-21213 46.3 - 55.7 + 4 1 - 2 NC13-20332 45.3 - 53.8 4 0 - 5 + VA09MAS6-122-7-1-4 44.9 - 53.4 - 3 1 - 2 Massey 42.5 - 53.7 5 + 0 - 1 Average 59.1 54.3 3 2 2 LSD (O.05) 7.3 0.9 1 1 1 C.V. 8.7 1.1 23 29 39 Released cultivars are shown in bold print. Varieties are ordered by descending yield averages. A plus or minus sign indicates a performance significantly above or below the test average. The 0-9 ratings indicate a genotype's response to disease or lodging where 0 = highly resistant and 9 = highly susceptible. 1 BYD = Barley Yellow Dwarf Virus.

71
Table 27. Summary of performance of entries in the Virginia Tech Wheat Test, Northern Piedmont Center, Orange, VA, 2017 harvest. Test Plant BYD Yield Weight Height Lodging Virus1
Line (Bu/a) (Lb/bu) (In) (0-9) (0-9) CROPLAN SRW 9415 109.7 + 53.6 34 0 3 USG 3404 106.6 + 53.1 34 0 1 CROPLAN SRW 9606 105.0 + 53.3 33 1 1 USG 3458 104.2 + 53.4 33 0 4 Pioneer Brand 26R36 104.1 + 54.2 32 0 1 USG 3316 103.1 + 54.4 34 0 2 AgriMAXX 415 102.2 + 54.8 32 0 2 VA09MAS1-12-5-1-1 101.5 + 57.3 + 32 0 2 CROPLAN 8550 100.8 + 53.7 34 1 1 SH EXP 1706 100.3 + 55.3 32 0 1 AgriMAXX 474 98.5 + 52.7 - 32 1 2 AgriMAXX 444 98.5 + 53.0 34 1 1 MAS #42 98.5 + 55.2 33 0 3 USG 3895 98.2 + 54.2 34 1 1 MBX 17-M-245 98.2 + 52.6 - 33 0 2 L11538 98.0 54.6 35 0 1 USG 3536 97.6 53.9 37 + 0 2 TN1501 96.6 53.1 33 1 2 VA12W-31 96.1 54.5 32 1 2 VA12W-68 95.8 54.3 32 0 1 MAX116 95.5 54.6 34 0 1 VA12W-248 94.9 54.2 33 0 2 Pioneer Brand 26R10 94.7 53.2 32 1 3 #Bullet 94.6 54.3 34 0 2 MBX 16-B-203 94.5 54.2 35 0 3 WX16722 94.5 52.3 - 33 1 4 + DH12SRW057-006 94.2 56.0 + 31 1 1 AgriMAXX 463 94.0 53.2 30 0 2 VA09MAS1-12-5-1 93.7 57.0 + 34 0 1 Dyna-Gro 9750 93.7 53.8 33 0 2 AgriMAXX 446 93.7 54.1 32 0 2 MAS #61 93.6 52.5 - 33 0 2 SY 007 93.5 54.6 33 0 2 VA09MAS1-12-5-1-3 93.5 56.4 + 33 0 1 VA09MAS8-34-5-2 92.4 51.9 - 33 1 1 AgriMAXX 473 92.2 53.9 34 0 2 VA12W-72 91.9 54.3 32 1 1 Armor MAYHEM 91.6 54.0 35 1 2 #Warrior 91.6 52.7 - 31 0 3 Dyna-Gro 9701 91.5 53.8 34 0 2 Dyna-Gro 9692 91.0 53.6 36 + 0 2
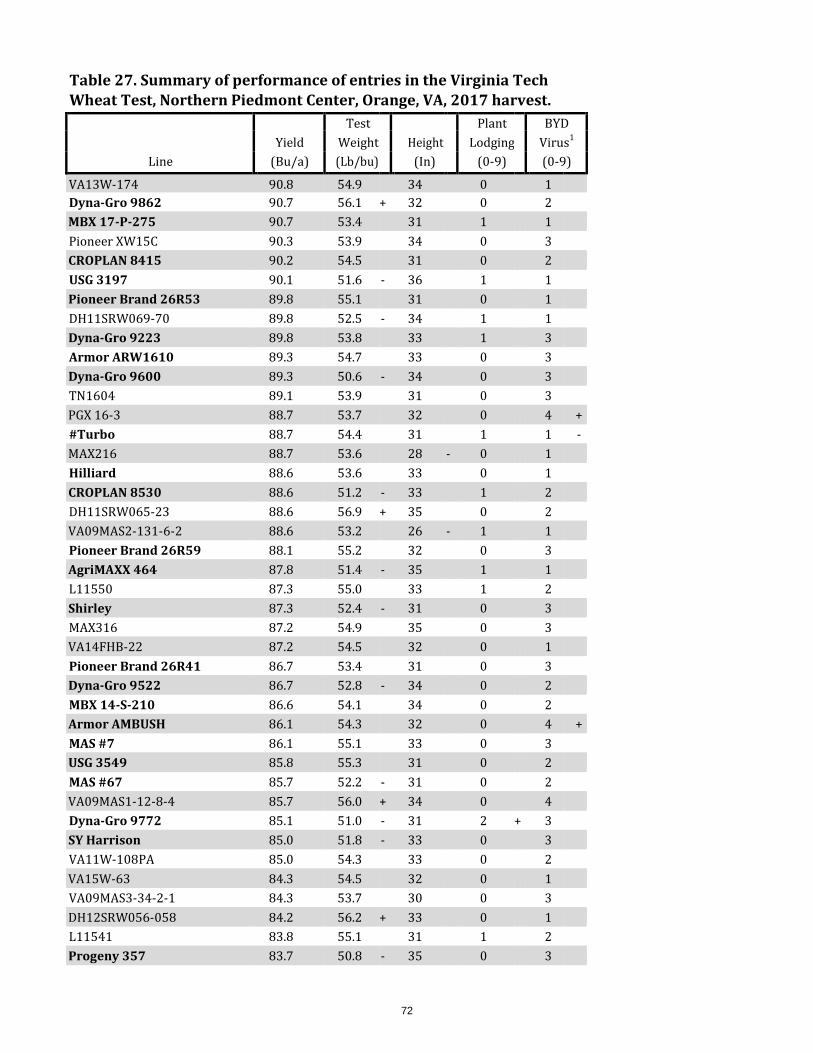
72
Table 27. Summary of performance of entries in the Virginia Tech Wheat Test, Northern Piedmont Center, Orange, VA, 2017 harvest. Test Plant BYD Yield Weight Height Lodging Virus1
Line (Bu/a) (Lb/bu) (In) (0-9) (0-9)
VA13W-174 90.8 54.9 34 0 1 Dyna-Gro 9862 90.7 56.1 + 32 0 2 MBX 17-P-275 90.7 53.4 31 1 1 Pioneer XW15C 90.3 53.9 34 0 3 CROPLAN 8415 90.2 54.5 31 0 2 USG 3197 90.1 51.6 - 36 1 1 Pioneer Brand 26R53 89.8 55.1 31 0 1 DH11SRW069-70 89.8 52.5 - 34 1 1 Dyna-Gro 9223 89.8 53.8 33 1 3 Armor ARW1610 89.3 54.7 33 0 3 Dyna-Gro 9600 89.3 50.6 - 34 0 3 TN1604 89.1 53.9 31 0 3 PGX 16-3 88.7 53.7 32 0 4 + #Turbo 88.7 54.4 31 1 1 - MAX216 88.7 53.6 28 - 0 1 Hilliard 88.6 53.6 33 0 1 CROPLAN 8530 88.6 51.2 - 33 1 2 DH11SRW065-23 88.6 56.9 + 35 0 2 VA09MAS2-131-6-2 88.6 53.2 26 - 1 1 Pioneer Brand 26R59 88.1 55.2 32 0 3 AgriMAXX 464 87.8 51.4 - 35 1 1 L11550 87.3 55.0 33 1 2 Shirley 87.3 52.4 - 31 0 3 MAX316 87.2 54.9 35 0 3 VA14FHB-22 87.2 54.5 32 0 1 Pioneer Brand 26R41 86.7 53.4 31 0 3 Dyna-Gro 9522 86.7 52.8 - 34 0 2 MBX 14-S-210 86.6 54.1 34 0 2 Armor AMBUSH 86.1 54.3 32 0 4 + MAS #7 86.1 55.1 33 0 3 USG 3549 85.8 55.3 31 0 2 MAS #67 85.7 52.2 - 31 0 2 VA09MAS1-12-8-4 85.7 56.0 + 34 0 4 Dyna-Gro 9772 85.1 51.0 - 31 2 + 3 SY Harrison 85.0 51.8 - 33 0 3 VA11W-108PA 85.0 54.3 33 0 2 VA15W-63 84.3 54.5 32 0 1 VA09MAS3-34-2-1 84.3 53.7 30 0 3 DH12SRW056-058 84.2 56.2 + 33 0 1 L11541 83.8 55.1 31 1 2 Progeny 357 83.7 50.8 - 35 0 3
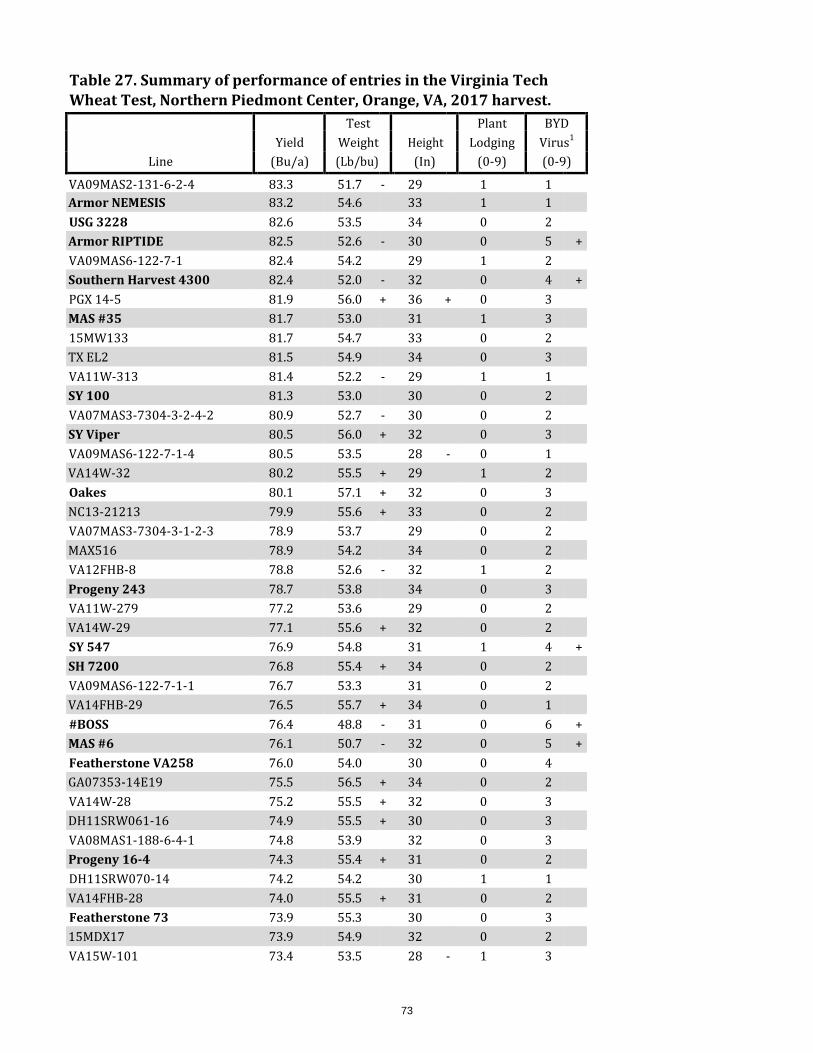
73
Table 27. Summary of performance of entries in the Virginia Tech Wheat Test, Northern Piedmont Center, Orange, VA, 2017 harvest. Test Plant BYD Yield Weight Height Lodging Virus1
Line (Bu/a) (Lb/bu) (In) (0-9) (0-9)
VA09MAS2-131-6-2-4 83.3 51.7 - 29 1 1 Armor NEMESIS 83.2 54.6 33 1 1 USG 3228 82.6 53.5 34 0 2 Armor RIPTIDE 82.5 52.6 - 30 0 5 + VA09MAS6-122-7-1 82.4 54.2 29 1 2 Southern Harvest 4300 82.4 52.0 - 32 0 4 + PGX 14-5 81.9 56.0 + 36 + 0 3 MAS #35 81.7 53.0 31 1 3 15MW133 81.7 54.7 33 0 2 TX EL2 81.5 54.9 34 0 3 VA11W-313 81.4 52.2 - 29 1 1 SY 100 81.3 53.0 30 0 2 VA07MAS3-7304-3-2-4-2 80.9 52.7 - 30 0 2 SY Viper 80.5 56.0 + 32 0 3 VA09MAS6-122-7-1-4 80.5 53.5 28 - 0 1 VA14W-32 80.2 55.5 + 29 1 2 Oakes 80.1 57.1 + 32 0 3 NC13-21213 79.9 55.6 + 33 0 2 VA07MAS3-7304-3-1-2-3 78.9 53.7 29 0 2 MAX516 78.9 54.2 34 0 2 VA12FHB-8 78.8 52.6 - 32 1 2 Progeny 243 78.7 53.8 34 0 3 VA11W-279 77.2 53.6 29 0 2 VA14W-29 77.1 55.6 + 32 0 2 SY 547 76.9 54.8 31 1 4 + SH 7200 76.8 55.4 + 34 0 2 VA09MAS6-122-7-1-1 76.7 53.3 31 0 2 VA14FHB-29 76.5 55.7 + 34 0 1 #BOSS 76.4 48.8 - 31 0 6 + MAS #6 76.1 50.7 - 32 0 5 + Featherstone VA258 76.0 54.0 30 0 4 GA07353-14E19 75.5 56.5 + 34 0 2 VA14W-28 75.2 55.5 + 32 0 3 DH11SRW061-16 74.9 55.5 + 30 0 3 VA08MAS1-188-6-4-1 74.8 53.9 32 0 3 Progeny 16-4 74.3 55.4 + 31 0 2 DH11SRW070-14 74.2 54.2 30 1 1 VA14FHB-28 74.0 55.5 + 31 0 2 Featherstone 73 73.9 55.3 30 0 3 15MDX17 73.9 54.9 32 0 2 VA15W-101 73.4 53.5 28 - 1 3
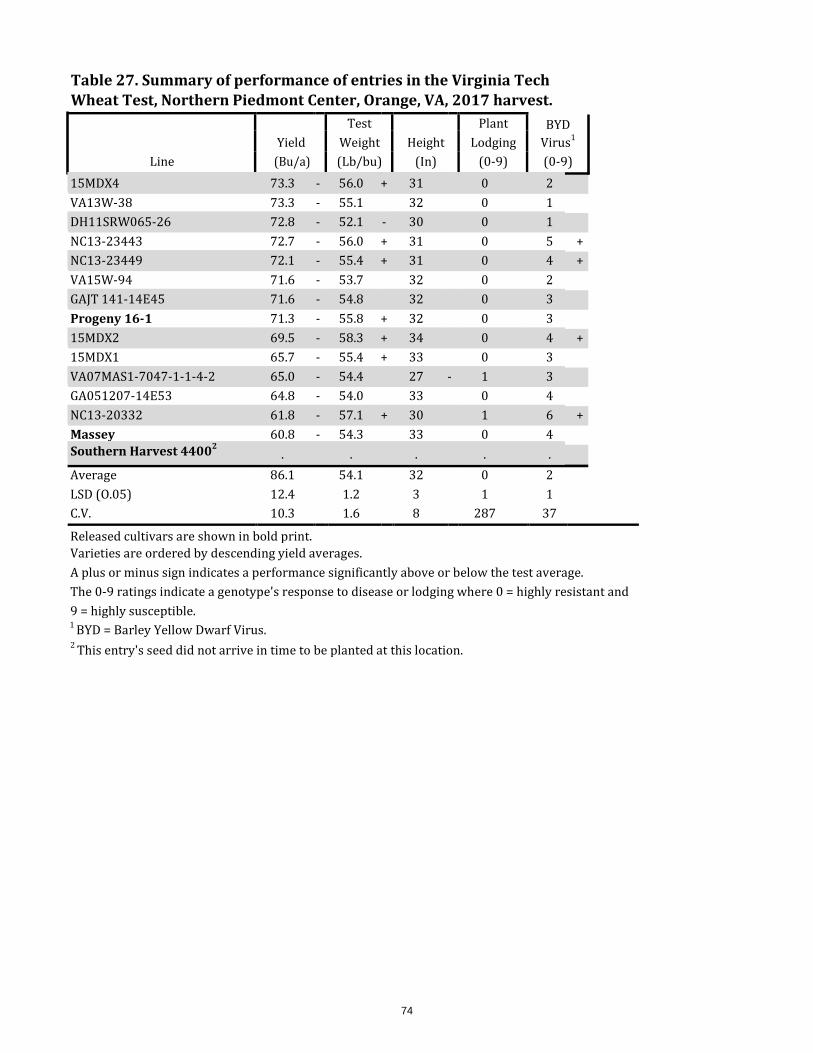
74
Table 27. Summary of performance of entries in the Virginia Tech Wheat Test, Northern Piedmont Center, Orange, VA, 2017 harvest. Test Plant BYD Yield Weight Height Lodging Virus1
Line (Bu/a) (Lb/bu) (In) (0-9) (0-9) 15MDX4 73.3 - 56.0 + 31 0 2 VA13W-38 73.3 - 55.1 32 0 1 DH11SRW065-26 72.8 - 52.1 - 30 0 1 NC13-23443 72.7 - 56.0 + 31 0 5 + NC13-23449 72.1 - 55.4 + 31 0 4 + VA15W-94 71.6 - 53.7 32 0 2 GAJT 141-14E45 71.6 - 54.8 32 0 3 Progeny 16-1 71.3 - 55.8 + 32 0 3 15MDX2 69.5 - 58.3 + 34 0 4 + 15MDX1 65.7 - 55.4 + 33 0 3 VA07MAS1-7047-1-1-4-2 65.0 - 54.4 27 - 1 3 GA051207-14E53 64.8 - 54.0 33 0 4 NC13-20332 61.8 - 57.1 + 30 1 6 + Massey 60.8 - 54.3 33 0 4 Southern Harvest 44002
. . . . . Average 86.1 54.1 32 0 2 LSD (O.05) 12.4 1.2 3 1 1 C.V. 10.3 1.6 8 287 37 Released cultivars are shown in bold print. Varieties are ordered by descending yield averages. A plus or minus sign indicates a performance significantly above or below the test average. The 0-9 ratings indicate a genotype's response to disease or lodging where 0 = highly resistant and 9 = highly susceptible. 1 BYD = Barley Yellow Dwarf Virus. 2 This entry's seed did not arrive in time to be planted at this location.

75
Table 28. Summary of performance of entries in the Virginia Tech Wheat Test, Kentland farm, Blacksburg, VA, 2017 harvest. 3-year 2-year Grain Test Date Mature Plant Leaf Av. Yield Av. Yield Yield Weight Headed Height Lodging Rust
Line (Bu/a) (Bu/a) (Bu/a) (Lb/bu) (Julian) (In) (0-9) (0-9) VA15W-63 --- --- 105.7 + 57.1 + 117 35 0 0 - DH12SRW057-006 --- --- 103.0 + 59.5 + 118 32 - 0 0 - CROPLAN 8550 --- 94.7 + 101.5 + 56.1 118 37 + 1 1 Armor MAYHEM --- --- 101.4 + 56.3 + 118 36 + 1 2 USG 3458 --- --- 101.0 + 55.2 116 - 36 + 2 5 + Pioneer XW15C --- --- 99.9 + 55.9 117 37 + 2 1 #Bullet --- 88.5 + 99.8 + 55.9 118 37 + 0 1 MBX 17-M-245 --- --- 99.1 + 54.9 116 - 36 0 4 + AgriMAXX 474 --- 89.3 + 98.3 + 54.7 116 - 36 2 4 + CROPLAN 8530 91.1 + 92.4 + 97.7 + 52.9 - 116 - 36 1 1 AgriMAXX 473 --- --- 97.6 + 55.8 118 36 + 0 2 Shirley 94.6 + 95.1 + 97.2 + 53.9 - 117 32 - 2 0 - MAX116 --- --- 97.1 + 55.6 118 38 + 0 2 #Warrior --- --- 96.8 + 54.8 116 - 35 0 4 + VA12W-31 93.9 + 92.4 + 96.8 + 55.9 117 35 3 1 MBX 14-S-210 93.9 + 94.3 + 95.7 + 55.8 119 + 39 + 0 1 L11541 --- 87.5 95.7 + 57.1 + 119 + 33 1 0 - MAS #7 88.3 87.5 95.3 + 56.7 + 119 + 37 + 3 4 + VA09MAS8-34-5-2 --- --- 94.8 + 53.8 - 117 35 4 1 Armor NEMESIS --- --- 94.4 + 56.9 + 119 + 34 2 0 - Dyna-Gro 9701 --- --- 94.1 + 56.0 118 37 + 2 2 MAS #67 --- 91.4 + 94.1 + 55.1 116 - 34 1 2 WX16722 --- --- 94.0 + 54.3 116 - 35 0 4 + CROPLAN 8415 83.8 81.2 93.1 + 55.2 118 34 2 3 AgriMAXX 415 87.3 88.3 + 92.9 + 57.2 + 117 37 + 1 2 USG 3536 --- --- 92.8 + 55.5 118 37 + 1 1 MAX216 --- --- 92.4 + 57.2 + 116 - 32 - 3 3 CROPLAN SRW 9415 --- --- 92.4 + 55.6 119 + 37 + 0 3 + Pioneer Brand 26R59 85.4 83.5 92.0 + 54.3 117 33 0 3 + CROPLAN SRW 9606 --- --- 91.9 + 56.1 116 - 35 3 2 Pioneer Brand 26R10 91.5 + 86.4 91.7 + 55.5 119 + 35 1 4 + Pioneer Brand 26R41 --- 87.4 91.2 + 55.7 118 32 - 1 1 Hilliard 93.7 + 94.5 + 90.8 + 56.3 + 117 36 2 1 DH11SRW069-70 --- --- 90.8 + 54.6 119 + 35 1 1 Dyna-Gro 9750 --- --- 90.6 + 55.2 116 - 33 0 2 USG 3228 --- --- 90.4 + 55.2 117 32 - 1 1 Armor RIPTIDE --- --- 90.2 54.2 116 - 35 1 3 VA09MAS2-131-6-2 --- --- 89.8 54.4 112 - 28 - 0 0 - Dyna-Gro 9600 --- 87.5 89.7 53.6 - 116 - 35 0 0 - MAS #61 --- 92.8 + 89.6 54.3 115 - 35 3 1 #Turbo --- --- 89.3 56.7 + 117 33 0 0 -
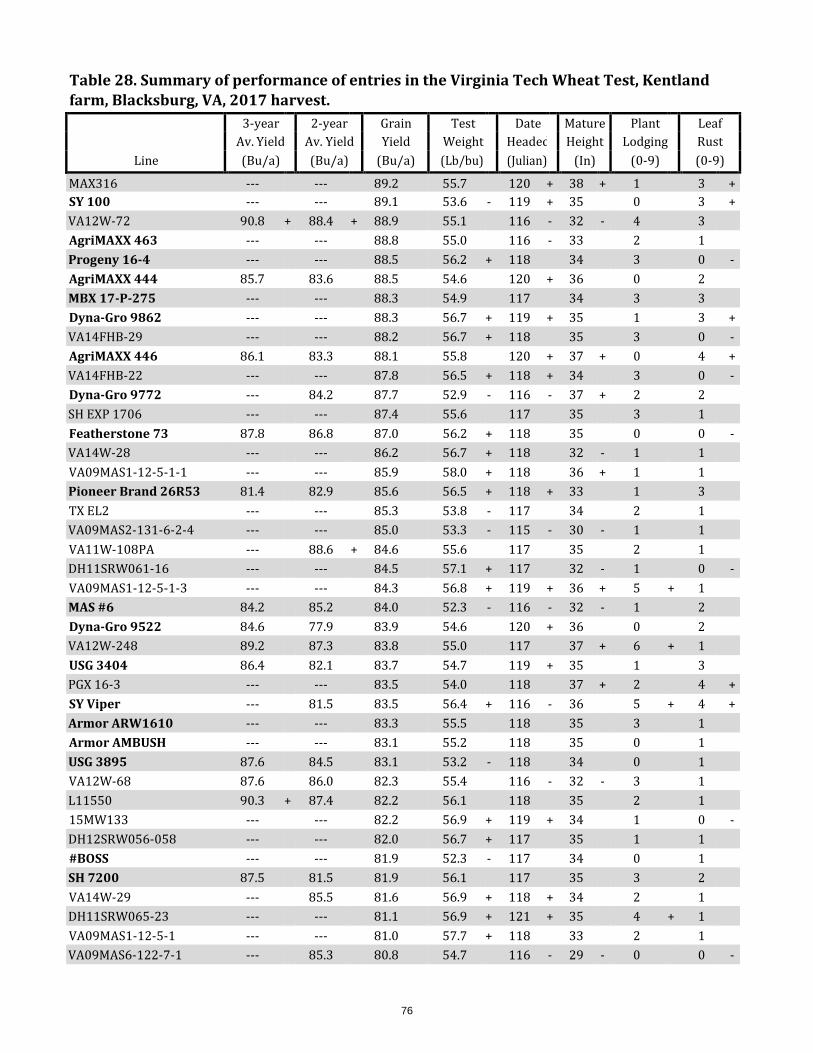
76
Table 28. Summary of performance of entries in the Virginia Tech Wheat Test, Kentland farm, Blacksburg, VA, 2017 harvest. 3-year 2-year Grain Test Date Mature Plant Leaf Av. Yield Av. Yield Yield Weight Headed Height Lodging Rust
Line (Bu/a) (Bu/a) (Bu/a) (Lb/bu) (Julian) (In) (0-9) (0-9)
MAX316 --- --- 89.2 55.7 120 + 38 + 1 3 + SY 100 --- --- 89.1 53.6 - 119 + 35 0 3 + VA12W-72 90.8 + 88.4 + 88.9 55.1 116 - 32 - 4 3 AgriMAXX 463 --- --- 88.8 55.0 116 - 33 2 1 Progeny 16-4 --- --- 88.5 56.2 + 118 34 3 0 - AgriMAXX 444 85.7 83.6 88.5 54.6 120 + 36 0 2 MBX 17-P-275 --- --- 88.3 54.9 117 34 3 3 Dyna-Gro 9862 --- --- 88.3 56.7 + 119 + 35 1 3 + VA14FHB-29 --- --- 88.2 56.7 + 118 35 3 0 - AgriMAXX 446 86.1 83.3 88.1 55.8 120 + 37 + 0 4 + VA14FHB-22 --- --- 87.8 56.5 + 118 + 34 3 0 - Dyna-Gro 9772 --- 84.2 87.7 52.9 - 116 - 37 + 2 2 SH EXP 1706 --- --- 87.4 55.6 117 35 3 1 Featherstone 73 87.8 86.8 87.0 56.2 + 118 35 0 0 - VA14W-28 --- --- 86.2 56.7 + 118 32 - 1 1 VA09MAS1-12-5-1-1 --- --- 85.9 58.0 + 118 36 + 1 1 Pioneer Brand 26R53 81.4 82.9 85.6 56.5 + 118 + 33 1 3 TX EL2 --- --- 85.3 53.8 - 117 34 2 1 VA09MAS2-131-6-2-4 --- --- 85.0 53.3 - 115 - 30 - 1 1 VA11W-108PA --- 88.6 + 84.6 55.6 117 35 2 1 DH11SRW061-16 --- --- 84.5 57.1 + 117 32 - 1 0 - VA09MAS1-12-5-1-3 --- --- 84.3 56.8 + 119 + 36 + 5 + 1 MAS #6 84.2 85.2 84.0 52.3 - 116 - 32 - 1 2 Dyna-Gro 9522 84.6 77.9 83.9 54.6 120 + 36 0 2 VA12W-248 89.2 87.3 83.8 55.0 117 37 + 6 + 1 USG 3404 86.4 82.1 83.7 54.7 119 + 35 1 3 PGX 16-3 --- --- 83.5 54.0 118 37 + 2 4 + SY Viper --- 81.5 83.5 56.4 + 116 - 36 5 + 4 + Armor ARW1610 --- --- 83.3 55.5 118 35 3 1 Armor AMBUSH --- --- 83.1 55.2 118 35 0 1 USG 3895 87.6 84.5 83.1 53.2 - 118 34 0 1 VA12W-68 87.6 86.0 82.3 55.4 116 - 32 - 3 1 L11550 90.3 + 87.4 82.2 56.1 118 35 2 1 15MW133 --- --- 82.2 56.9 + 119 + 34 1 0 - DH12SRW056-058 --- --- 82.0 56.7 + 117 35 1 1 #BOSS --- --- 81.9 52.3 - 117 34 0 1 SH 7200 87.5 81.5 81.9 56.1 117 35 3 2 VA14W-29 --- 85.5 81.6 56.9 + 118 + 34 2 1 DH11SRW065-23 --- --- 81.1 56.9 + 121 + 35 4 + 1 VA09MAS1-12-5-1 --- --- 81.0 57.7 + 118 33 2 1 VA09MAS6-122-7-1 --- 85.3 80.8 54.7 116 - 29 - 0 0 -
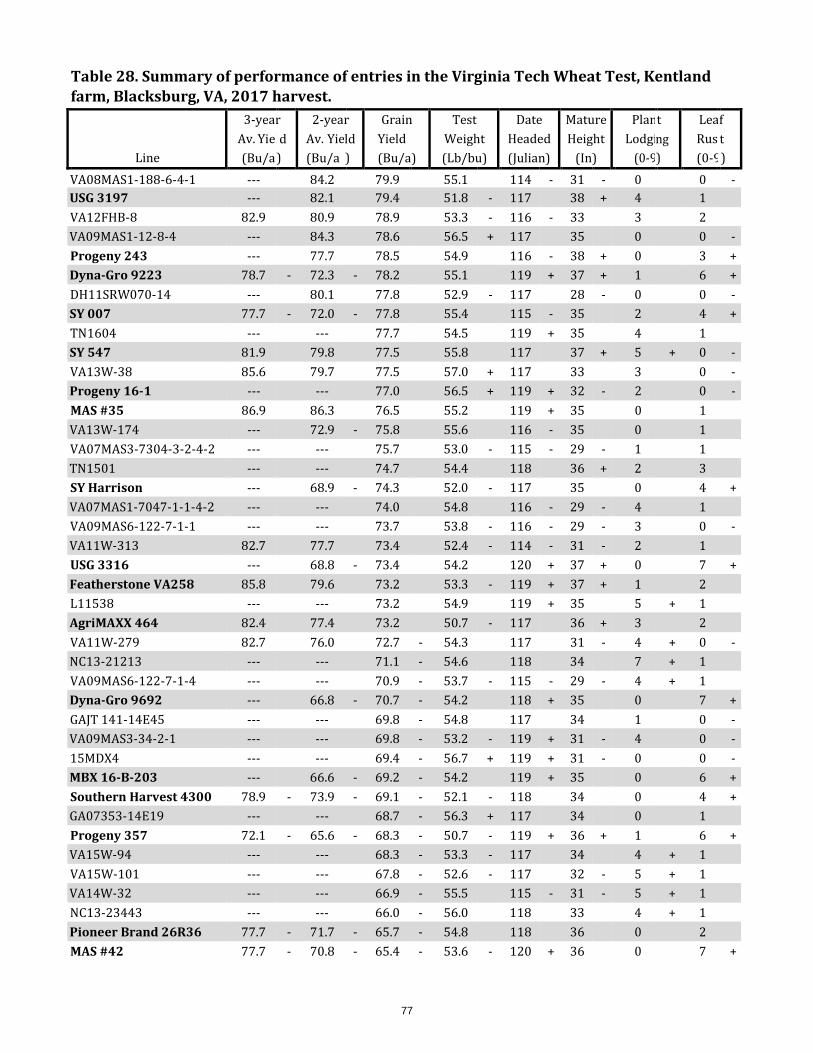
77
Table 28. Summary of performance of entries in the Virginia Tech Wheat Test, Kentland farm, Blacksburg, VA, 2017 harvest.
Line
3-yea Av. Yiel (Bu/a
r d
)
2-yea Av. Yie (Bu/a
r ld )
Grain Yield (Bu/a)
Test Weight (Lb/bu)
Date Headed (Julian)
Mature Height
(In)
Plan Lodgi
(0-9
t ng )
Lea Rus (0-9
f t )
VA08MAS1-188-6-4-1 --- 84.2 79.9 55.1 114 - 31 - 0 0 - USG 3197 --- 82.1 79.4 51.8 - 117 38 + 4 1 VA12FHB-8 82.9 80.9 78.9 53.3 - 116 - 33 3 2 VA09MAS1-12-8-4 --- 84.3 78.6 56.5 + 117 35 0 0 - Progeny 243 --- 77.7 78.5 54.9 116 - 38 + 0 3 + Dyna-Gro 9223 78.7 - 72.3 - 78.2 55.1 119 + 37 + 1 6 + DH11SRW070-14 --- 80.1 77.8 52.9 - 117 28 - 0 0 - SY 007 77.7 - 72.0 - 77.8 55.4 115 - 35 2 4 + TN1604 --- --- 77.7 54.5 119 + 35 4 1 SY 547 81.9 79.8 77.5 55.8 117 37 + 5 + 0 - VA13W-38 85.6 79.7 77.5 57.0 + 117 33 3 0 - Progeny 16-1 --- --- 77.0 56.5 + 119 + 32 - 2 0 - MAS #35 86.9 86.3 76.5 55.2 119 + 35 0 1 VA13W-174 --- 72.9 - 75.8 55.6 116 - 35 0 1 VA07MAS3-7304-3-2-4-2 --- --- 75.7 53.0 - 115 - 29 - 1 1 TN1501 --- --- 74.7 54.4 118 36 + 2 3 SY Harrison --- 68.9 - 74.3 52.0 - 117 35 0 4 + VA07MAS1-7047-1-1-4-2 --- --- 74.0 54.8 116 - 29 - 4 1 VA09MAS6-122-7-1-1 --- --- 73.7 53.8 - 116 - 29 - 3 0 - VA11W-313 82.7 77.7 73.4 52.4 - 114 - 31 - 2 1 USG 3316 --- 68.8 - 73.4 54.2 120 + 37 + 0 7 + Featherstone VA258 85.8 79.6 73.2 53.3 - 119 + 37 + 1 2 L11538 --- --- 73.2 54.9 119 + 35 5 + 1 AgriMAXX 464 82.4 77.4 73.2 50.7 - 117 36 + 3 2 VA11W-279 82.7 76.0 72.7 - 54.3 117 31 - 4 + 0 - NC13-21213 --- --- 71.1 - 54.6 118 34 7 + 1 VA09MAS6-122-7-1-4 --- --- 70.9 - 53.7 - 115 - 29 - 4 + 1 Dyna-Gro 9692 --- 66.8 - 70.7 - 54.2 118 + 35 0 7 + GAJT 141-14E45 --- --- 69.8 - 54.8 117 34 1 0 - VA09MAS3-34-2-1 --- --- 69.8 - 53.2 - 119 + 31 - 4 0 - 15MDX4 --- --- 69.4 - 56.7 + 119 + 31 - 0 0 - MBX 16-B-203 --- 66.6 - 69.2 - 54.2 119 + 35 0 6 + Southern Harvest 4300 78.9 - 73.9 - 69.1 - 52.1 - 118 34 0 4 + GA07353-14E19 --- --- 68.7 - 56.3 + 117 34 0 1 Progeny 357 72.1 - 65.6 - 68.3 - 50.7 - 119 + 36 + 1 6 + VA15W-94 --- --- 68.3 - 53.3 - 117 34 4 + 1 VA15W-101 --- --- 67.8 - 52.6 - 117 32 - 5 + 1 VA14W-32 --- --- 66.9 - 55.5 115 - 31 - 5 + 1 NC13-23443 --- --- 66.0 - 56.0 118 33 4 + 1 Pioneer Brand 26R36 77.7 - 71.7 - 65.7 - 54.8 118 36 0 2 MAS #42 77.7 - 70.8 - 65.4 - 53.6 - 120 + 36 0 7 +
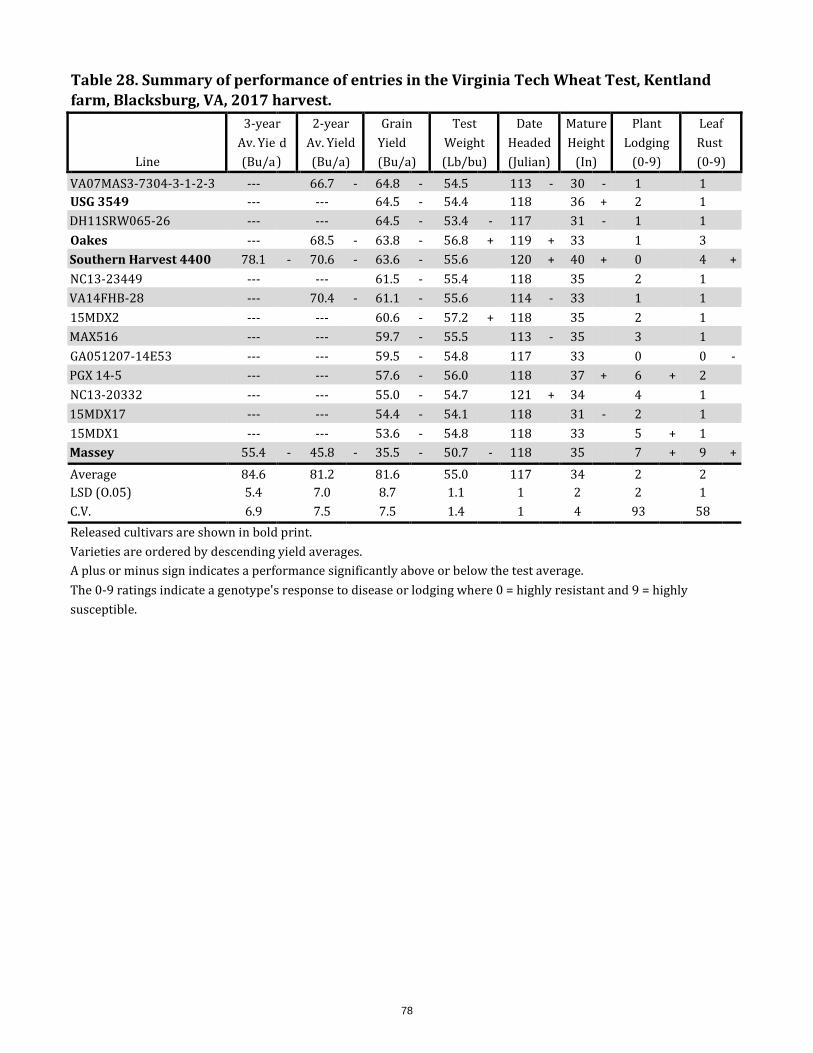
78
Table 28. Summary of performance of entries in the Virginia Tech Wheat Test, Kentland farm, Blacksburg, VA, 2017 harvest.
Line
3-yea Av. Yiel (Bu/a
r d
)
2-year Av. Yield (Bu/a)
Grain Yield (Bu/a)
Test Weight (Lb/bu)
Date Headed (Julian)
Mature Height
(In)
Plant Lodging
(0-9)
Leaf Rust (0-9)
VA07MAS3-7304-3-1-2-3 --- 66.7 - 64.8 - 54.5 113 - 30 - 1 1 USG 3549 --- --- 64.5 - 54.4 118 36 + 2 1 DH11SRW065-26 --- --- 64.5 - 53.4 - 117 31 - 1 1 Oakes --- 68.5 - 63.8 - 56.8 + 119 + 33 1 3 Southern Harvest 4400 78.1 - 70.6 - 63.6 - 55.6 120 + 40 + 0 4 + NC13-23449 --- --- 61.5 - 55.4 118 35 2 1 VA14FHB-28 --- 70.4 - 61.1 - 55.6 114 - 33 1 1 15MDX2 --- --- 60.6 - 57.2 + 118 35 2 1 MAX516 --- --- 59.7 - 55.5 113 - 35 3 1 GA051207-14E53 --- --- 59.5 - 54.8 117 33 0 0 - PGX 14-5 --- --- 57.6 - 56.0 118 37 + 6 + 2 NC13-20332 --- --- 55.0 - 54.7 121 + 34 4 1 15MDX17 --- --- 54.4 - 54.1 118 31 - 2 1 15MDX1 --- --- 53.6 - 54.8 118 33 5 + 1 Massey 55.4 - 45.8 - 35.5 - 50.7 - 118 35 7 + 9 + Average 84.6 81.2 81.6 55.0 117 34 2 2 LSD (O.05) 5.4 7.0 8.7 1.1 1 2 2 1 C.V. 6.9 7.5 7.5 1.4 1 4 93 58 Released cultivars are shown in bold print. Varieties are ordered by descending yield averages. A plus or minus sign indicates a performance significantly above or below the test average. The 0-9 ratings indicate a genotype's response to disease or lodging where 0 = highly resistant and 9 = highly susceptible.

79
Table 29. Summary of performance of entries in the Virginia Tech Wheat Test, planted No-Till at Tidewater AREC, Holland, VA, 2017 harvest. 3-year 2-year Grain Test Plant BYD Av. Yield Av. Yield Yield Weight Lodging Virus1
Line (Bu/a) (Bu/a) (Bu/a) (Lb/bu) (0-9) (0-9) Dyna-Gro 9522 55.7 55.3 63.4 + 53.2 3 1 MBX 16-B-203 --- 55.2 62.1 + 53.8 2 1 CROPLAN SRW 9415 --- --- 61.1 + 53.6 2 0 AgriMAXX 444 56.0 54.1 61.0 + 53.9 2 0 USG 3316 --- 51.1 60.3 + 53.5 2 - 0 Pioneer Brand 26R10 53.9 49.9 59.0 + 53.2 2 1 USG 3404 54.2 50.8 57.9 + 53.2 3 1 PGX 16-3 --- --- 56.9 + 53.0 4 1 MAS #42 56.7 52.9 56.4 + 53.7 3 1 AgriMAXX 446 55.0 51.5 55.8 + 53.4 2 - 1 Dyna-Gro 9692 --- 46.6 55.8 + 54.0 3 0 MBX 14-S-210 51.3 52.7 55.6 + 52.3 3 1 Progeny 357 52.4 47.6 54.9 + 50.9 2 1 Pioneer Brand 26R36 52.0 49.9 54.8 + 53.4 4 1 USG 3895 55.2 54.5 54.4 + 52.9 3 1 AgriMAXX 415 54.4 53.0 54.2 + 53.7 2 0 Pioneer Brand 26R41 --- 55.6 54.0 + 52.6 3 0 Armor MAYHEM --- --- 53.9 52.0 3 1 SH EXP 1706 --- --- 53.5 53.8 4 1 DH11SRW065-23 --- --- 53.2 54.5 3 1 SY Harrison --- 49.1 53.1 52.6 4 1 MAS #35 53.8 52.0 52.9 53.3 3 1 Dyna-Gro 9223 53.7 47.9 52.8 52.9 4 1 AgriMAXX 473 --- --- 52.7 52.2 4 1 Southern Harvest 4400 50.6 45.7 51.7 52.5 3 1 USG 3536 --- --- 51.5 52.0 3 0 CROPLAN SRW 9606 --- --- 51.4 52.7 4 1 Pioneer Brand 26R59 59.3 + 55.2 51.2 52.6 4 1 Pioneer Brand 26R53 49.4 49.9 50.8 54.2 3 1 Hilliard 54.2 52.8 50.5 53.3 3 1 VA12W-68 51.9 53.4 50.4 52.1 3 1 SH 7200 57.0 50.9 50.2 53.2 3 1 CROPLAN 8550 --- 51.2 50.1 51.9 2 - 1 Dyna-Gro 9600 --- 51.0 49.9 51.2 3 1 DH12SRW056-058 --- --- 49.8 53.4 2 - 3 + VA09MAS2-131-6-2 --- --- 49.7 52.4 3 2 L11541 --- 48.9 49.7 54.8 3 0 L11550 54.8 53.2 49.6 53.8 4 1 Southern Harvest 4300 52.7 50.9 49.3 52.0 5 1 AgriMAXX 464 54.6 51.3 48.8 50.2 4 0 L11538 --- --- 48.8 51.5 4 1
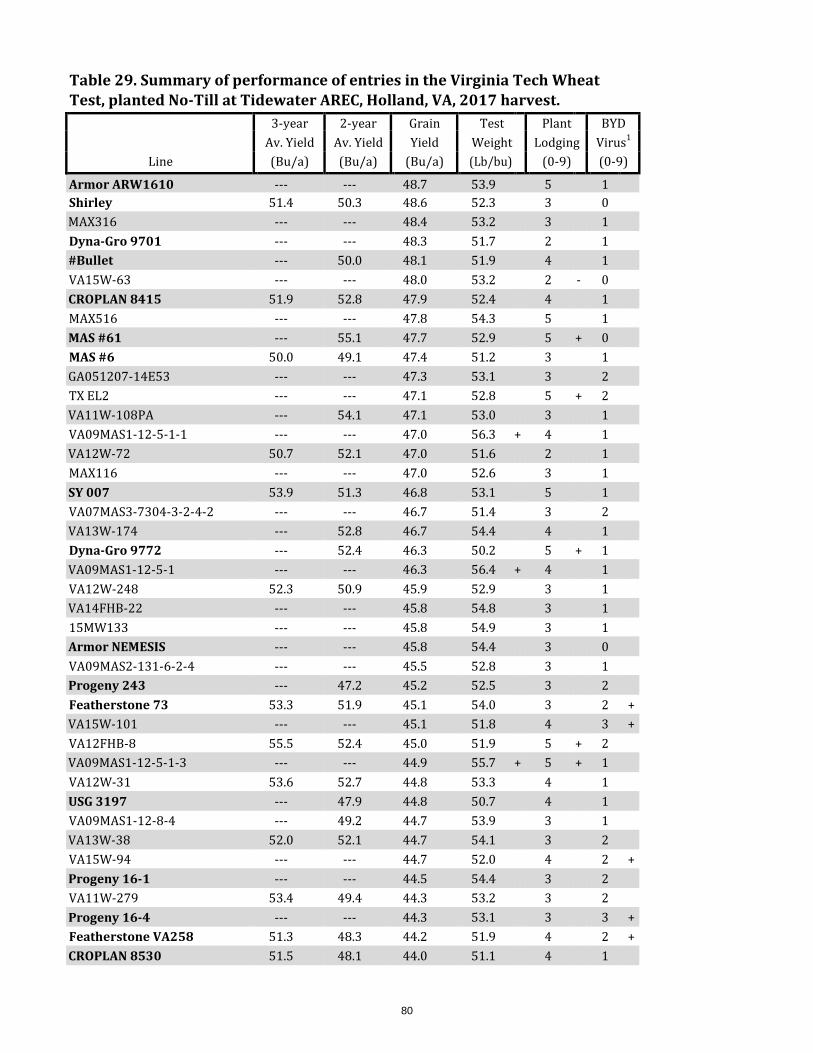
80
Table 29. Summary of performance of entries in the Virginia Tech Wheat Test, planted No-Till at Tidewater AREC, Holland, VA, 2017 harvest. 3-year 2-year Grain Test Plant BYD Av. Yield Av. Yield Yield Weight Lodging Virus1
Line (Bu/a) (Bu/a) (Bu/a) (Lb/bu) (0-9) (0-9)
Armor ARW1610 --- --- 48.7 53.9 5 1 Shirley 51.4 50.3 48.6 52.3 3 0 MAX316 --- --- 48.4 53.2 3 1 Dyna-Gro 9701 --- --- 48.3 51.7 2 1 #Bullet --- 50.0 48.1 51.9 4 1 VA15W-63 --- --- 48.0 53.2 2 - 0 CROPLAN 8415 51.9 52.8 47.9 52.4 4 1 MAX516 --- --- 47.8 54.3 5 1 MAS #61 --- 55.1 47.7 52.9 5 + 0 MAS #6 50.0 49.1 47.4 51.2 3 1 GA051207-14E53 --- --- 47.3 53.1 3 2 TX EL2 --- --- 47.1 52.8 5 + 2 VA11W-108PA --- 54.1 47.1 53.0 3 1 VA09MAS1-12-5-1-1 --- --- 47.0 56.3 + 4 1 VA12W-72 50.7 52.1 47.0 51.6 2 1 MAX116 --- --- 47.0 52.6 3 1 SY 007 53.9 51.3 46.8 53.1 5 1 VA07MAS3-7304-3-2-4-2 --- --- 46.7 51.4 3 2 VA13W-174 --- 52.8 46.7 54.4 4 1 Dyna-Gro 9772 --- 52.4 46.3 50.2 5 + 1 VA09MAS1-12-5-1 --- --- 46.3 56.4 + 4 1 VA12W-248 52.3 50.9 45.9 52.9 3 1 VA14FHB-22 --- --- 45.8 54.8 3 1 15MW133 --- --- 45.8 54.9 3 1 Armor NEMESIS --- --- 45.8 54.4 3 0 VA09MAS2-131-6-2-4 --- --- 45.5 52.8 3 1 Progeny 243 --- 47.2 45.2 52.5 3 2 Featherstone 73 53.3 51.9 45.1 54.0 3 2 + VA15W-101 --- --- 45.1 51.8 4 3 + VA12FHB-8 55.5 52.4 45.0 51.9 5 + 2 VA09MAS1-12-5-1-3 --- --- 44.9 55.7 + 5 + 1 VA12W-31 53.6 52.7 44.8 53.3 4 1 USG 3197 --- 47.9 44.8 50.7 4 1 VA09MAS1-12-8-4 --- 49.2 44.7 53.9 3 1 VA13W-38 52.0 52.1 44.7 54.1 3 2 VA15W-94 --- --- 44.7 52.0 4 2 + Progeny 16-1 --- --- 44.5 54.4 3 2 VA11W-279 53.4 49.4 44.3 53.2 3 2 Progeny 16-4 --- --- 44.3 53.1 3 3 + Featherstone VA258 51.3 48.3 44.2 51.9 4 2 + CROPLAN 8530 51.5 48.1 44.0 51.1 4 1
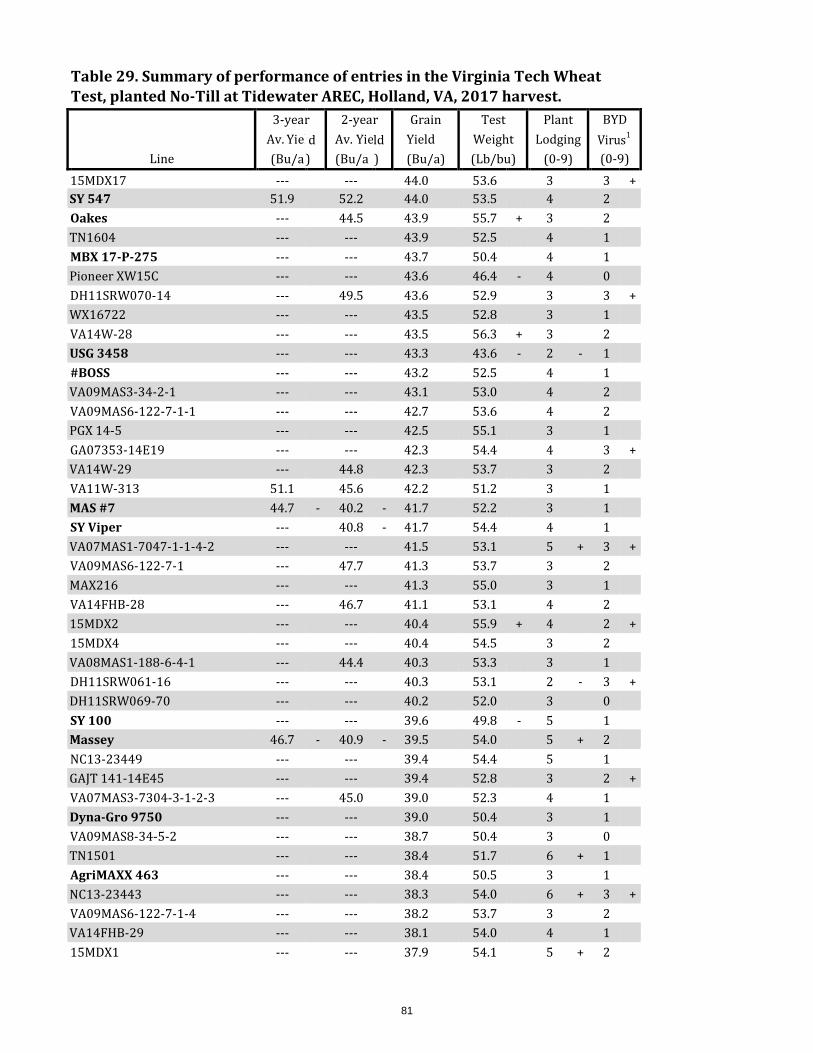
81
Table 29. Summary of performance of entries in the Virginia Tech Wheat Test, planted No-Till at Tidewater AREC, Holland, VA, 2017 harvest.
Line
3-yea Av. Yiel (Bu/a
r d
)
2-yea Av. Yie (Bu/a
r ld )
Grain Yield (Bu/a)
Test Weight (Lb/bu)
Plant Lodging
(0-9)
BYD Virus1
(0-9) 15MDX17 --- --- 44.0 53.6 3 3 + SY 547 51.9 52.2 44.0 53.5 4 2 Oakes --- 44.5 43.9 55.7 + 3 2 TN1604 --- --- 43.9 52.5 4 1 MBX 17-P-275 --- --- 43.7 50.4 4 1 Pioneer XW15C --- --- 43.6 46.4 - 4 0 DH11SRW070-14 --- 49.5 43.6 52.9 3 3 + WX16722 --- --- 43.5 52.8 3 1 VA14W-28 --- --- 43.5 56.3 + 3 2 USG 3458 --- --- 43.3 43.6 - 2 - 1 #BOSS --- --- 43.2 52.5 4 1 VA09MAS3-34-2-1 --- --- 43.1 53.0 4 2 VA09MAS6-122-7-1-1 --- --- 42.7 53.6 4 2 PGX 14-5 --- --- 42.5 55.1 3 1 GA07353-14E19 --- --- 42.3 54.4 4 3 + VA14W-29 --- 44.8 42.3 53.7 3 2 VA11W-313 51.1 45.6 42.2 51.2 3 1 MAS #7 44.7 - 40.2 - 41.7 52.2 3 1 SY Viper --- 40.8 - 41.7 54.4 4 1 VA07MAS1-7047-1-1-4-2 --- --- 41.5 53.1 5 + 3 + VA09MAS6-122-7-1 --- 47.7 41.3 53.7 3 2 MAX216 --- --- 41.3 55.0 3 1 VA14FHB-28 --- 46.7 41.1 53.1 4 2 15MDX2 --- --- 40.4 55.9 + 4 2 + 15MDX4 --- --- 40.4 54.5 3 2 VA08MAS1-188-6-4-1 --- 44.4 40.3 53.3 3 1 DH11SRW061-16 --- --- 40.3 53.1 2 - 3 + DH11SRW069-70 --- --- 40.2 52.0 3 0 SY 100 --- --- 39.6 49.8 - 5 1 Massey 46.7 - 40.9 - 39.5 54.0 5 + 2 NC13-23449 --- --- 39.4 54.4 5 1 GAJT 141-14E45 --- --- 39.4 52.8 3 2 + VA07MAS3-7304-3-1-2-3 --- 45.0 39.0 52.3 4 1 Dyna-Gro 9750 --- --- 39.0 50.4 3 1 VA09MAS8-34-5-2 --- --- 38.7 50.4 3 0 TN1501 --- --- 38.4 51.7 6 + 1 AgriMAXX 463 --- --- 38.4 50.5 3 1 NC13-23443 --- --- 38.3 54.0 6 + 3 + VA09MAS6-122-7-1-4 --- --- 38.2 53.7 3 2 VA14FHB-29 --- --- 38.1 54.0 4 1 15MDX1 --- --- 37.9 54.1 5 + 2
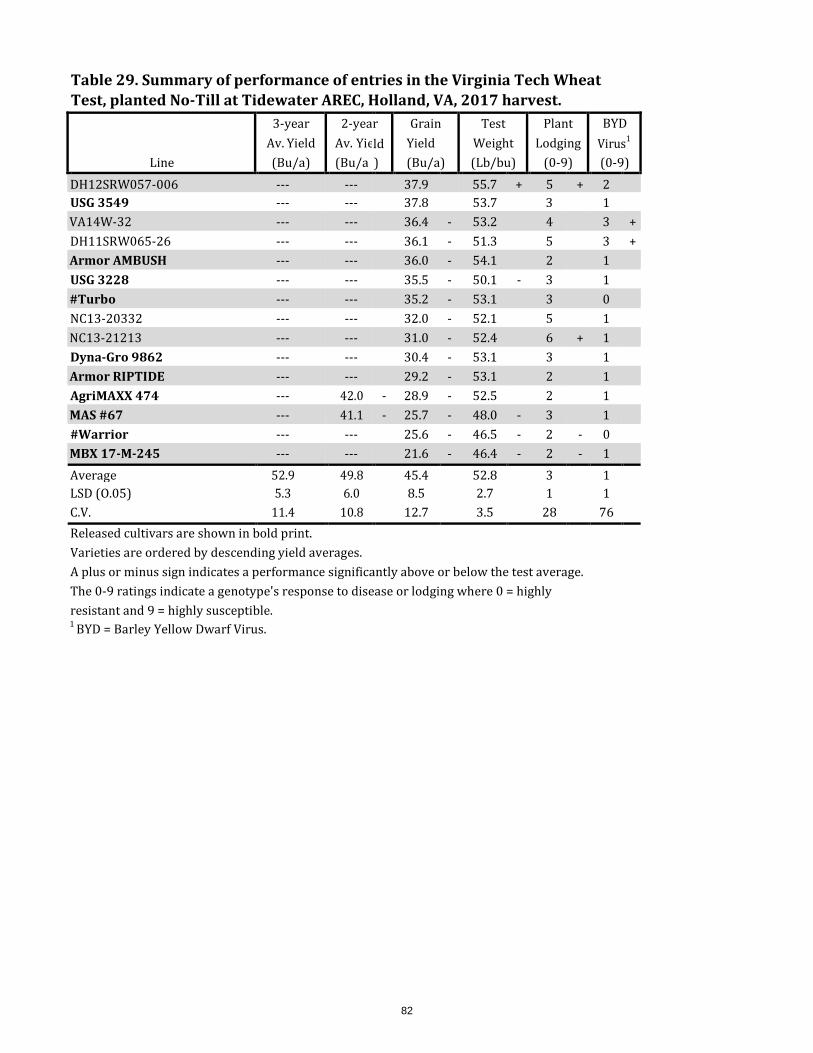
82
Table 29. Summary of performance of entries in the Virginia Tech Wheat Test, planted No-Till at Tidewater AREC, Holland, VA, 2017 harvest.
Line
3-year Av. Yield (Bu/a)
2-yea Av. Yie (Bu/a
r ld )
Grain Yield (Bu/a)
Test Weight (Lb/bu)
Plant Lodging
(0-9)
BYD Virus1
(0-9) DH12SRW057-006 --- --- 37.9 55.7 + 5 + 2 USG 3549 --- --- 37.8 53.7 3 1 VA14W-32 --- --- 36.4 - 53.2 4 3 + DH11SRW065-26 --- --- 36.1 - 51.3 5 3 + Armor AMBUSH --- --- 36.0 - 54.1 2 1 USG 3228 --- --- 35.5 - 50.1 - 3 1 #Turbo --- --- 35.2 - 53.1 3 0 NC13-20332 --- --- 32.0 - 52.1 5 1 NC13-21213 --- --- 31.0 - 52.4 6 + 1 Dyna-Gro 9862 --- --- 30.4 - 53.1 3 1 Armor RIPTIDE --- --- 29.2 - 53.1 2 1 AgriMAXX 474 --- 42.0 - 28.9 - 52.5 2 1 MAS #67 --- 41.1 - 25.7 - 48.0 - 3 1 #Warrior --- --- 25.6 - 46.5 - 2 - 0 MBX 17-M-245 --- --- 21.6 - 46.4 - 2 - 1 Average 52.9 49.8 45.4 52.8 3 1 LSD (O.05) 5.3 6.0 8.5 2.7 1 1 C.V. 11.4 10.8 12.7 3.5 28 76 Released cultivars are shown in bold print. Varieties are ordered by descending yield averages. A plus or minus sign indicates a performance significantly above or below the test average. The 0-9 ratings indicate a genotype's response to disease or lodging where 0 = highly resistant and 9 = highly susceptible. 1 BYD = Barley Yellow Dwarf Virus.
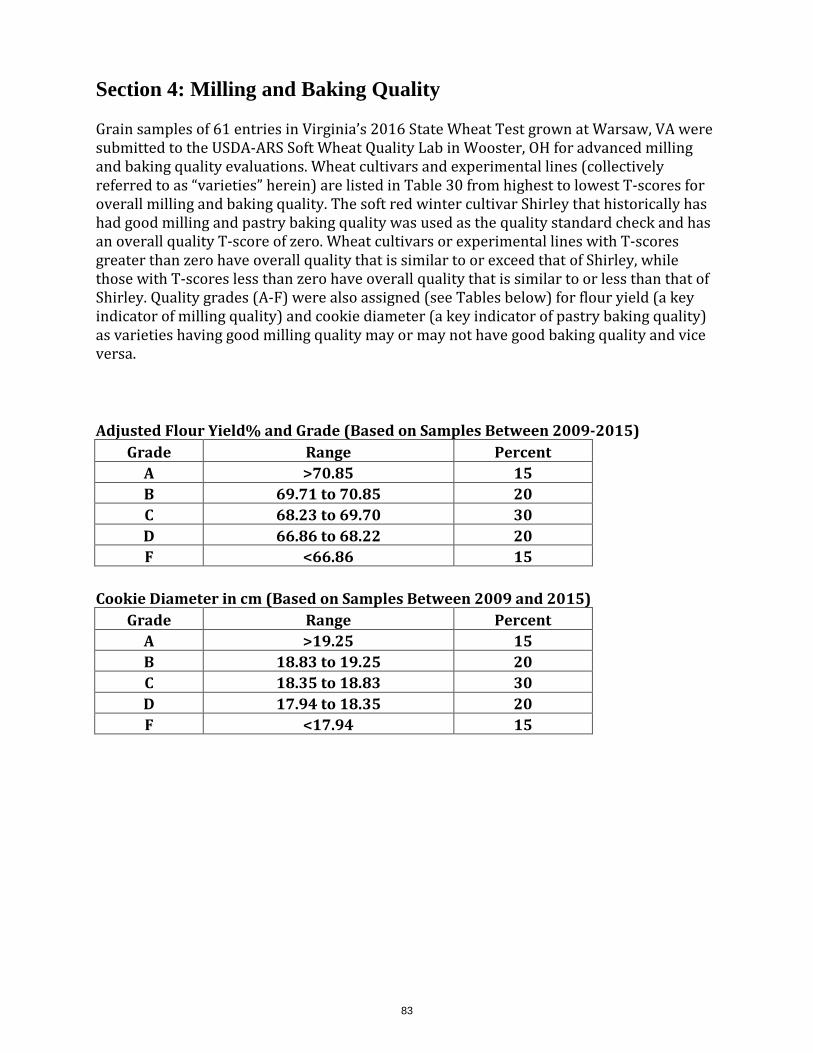
83
Section 4: Milling and Baking Quality
Grain samples of 61 entries in Virginia’s 2016 State Wheat Test grown at Warsaw, VA were submitted to the USDA-ARS Soft Wheat Quality Lab in Wooster, OH for advanced milling and baking quality evaluations. Wheat cultivars and experimental lines (collectively referred to as “varieties” herein) are listed in Table 30 from highest to lowest T-scores for overall milling and baking quality. The soft red winter cultivar Shirley that historically has had good milling and pastry baking quality was used as the quality standard check and has an overall quality T-score of zero. Wheat cultivars or experimental lines with T-scores greater than zero have overall quality that is similar to or exceed that of Shirley, while those with T-scores less than zero have overall quality that is similar to or less than that of Shirley. Quality grades (A-F) were also assigned (see Tables below) for flour yield (a key indicator of milling quality) and cookie diameter (a key indicator of pastry baking quality) as varieties having good milling quality may or may not have good baking quality and vice versa.
Adjusted Flour Yield% and Grade (Based on Samples Between 2009-2015) Grade Range Percent
A >70.85 15 B 69.71 to 70.85 20 C 68.23 to 69.70 30 D 66.86 to 68.22 20 F <66.86 15
Cookie Diameter in cm (Based on Samples Between 2009 and 2015)
Grade Range Percent A >19.25 15 B 18.83 to 19.25 20 C 18.35 to 18.83 30 D 17.94 to 18.35 20 F <17.94 15
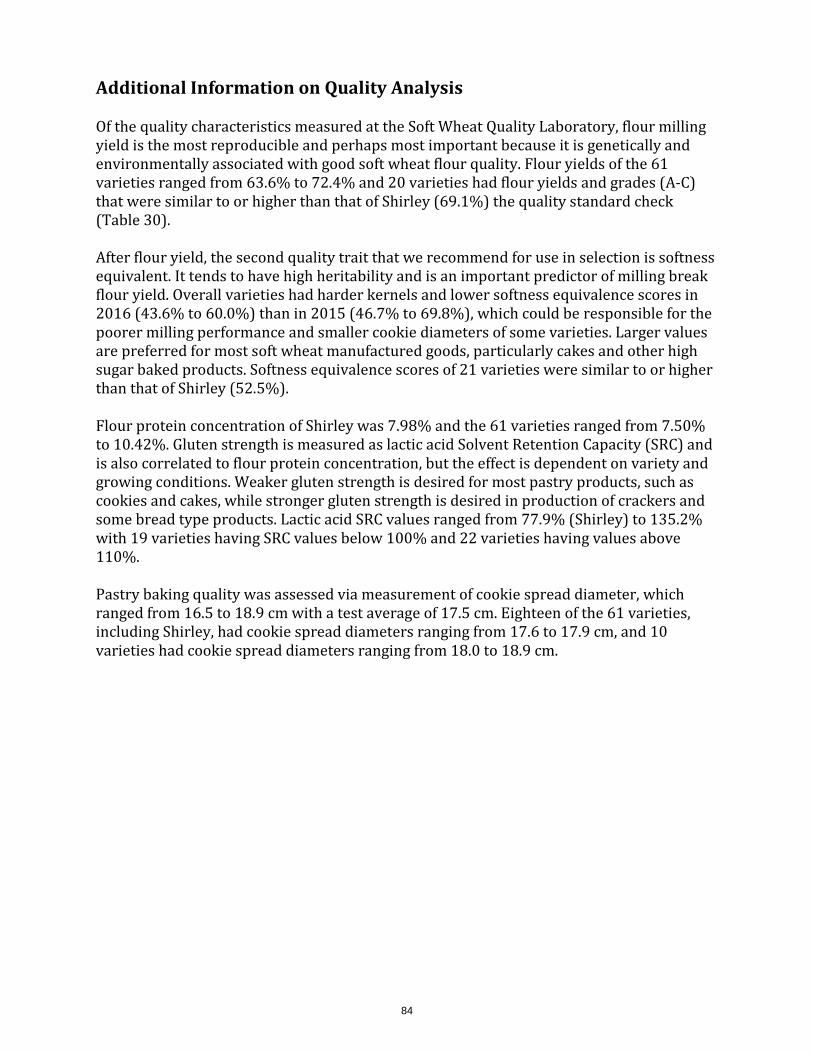
84
Additional Information on Quality Analysis
Of the quality characteristics measured at the Soft Wheat Quality Laboratory, flour milling yield is the most reproducible and perhaps most important because it is genetically and environmentally associated with good soft wheat flour quality. Flour yields of the 61 varieties ranged from 63.6% to 72.4% and 20 varieties had flour yields and grades (A-C) that were similar to or higher than that of Shirley (69.1%) the quality standard check (Table 30).
After flour yield, the second quality trait that we recommend for use in selection is softness equivalent. It tends to have high heritability and is an important predictor of milling break flour yield. Overall varieties had harder kernels and lower softness equivalence scores in 2016 (43.6% to 60.0%) than in 2015 (46.7% to 69.8%), which could be responsible for the poorer milling performance and smaller cookie diameters of some varieties. Larger values are preferred for most soft wheat manufactured goods, particularly cakes and other high sugar baked products. Softness equivalence scores of 21 varieties were similar to or higher than that of Shirley (52.5%).
Flour protein concentration of Shirley was 7.98% and the 61 varieties ranged from 7.50% to 10.42%. Gluten strength is measured as lactic acid Solvent Retention Capacity (SRC) and is also correlated to flour protein concentration, but the effect is dependent on variety and growing conditions. Weaker gluten strength is desired for most pastry products, such as cookies and cakes, while stronger gluten strength is desired in production of crackers and some bread type products. Lactic acid SRC values ranged from 77.9% (Shirley) to 135.2% with 19 varieties having SRC values below 100% and 22 varieties having values above 110%.
Pastry baking quality was assessed via measurement of cookie spread diameter, which ranged from 16.5 to 18.9 cm with a test average of 17.5 cm. Eighteen of the 61 varieties, including Shirley, had cookie spread diameters ranging from 17.6 to 17.9 cm, and 10 varieties had cookie spread diameters ranging from 18.0 to 18.9 cm.
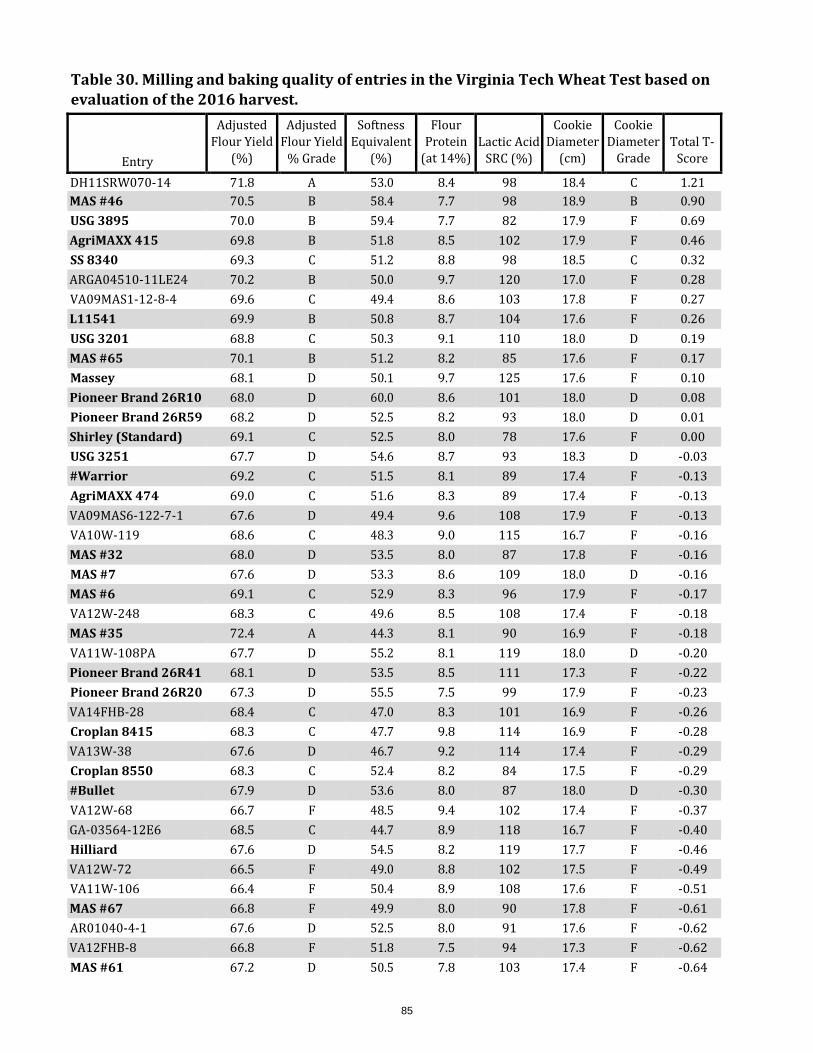
85
Table 30. Milling and baking quality of entries in the Virginia Tech Wheat Test based on evaluation of the 2016 harvest.
Entry
Adjusted Flour Yield
(%)
Adjusted Flour Yield
% Grade
Softness Equivalent
(%)
Flour Protein
(at 14%)
Lactic Acid
SRC (%)
Cookie Diameter
(cm)
Cookie Diameter
Grade
Total T-
Score
DH11SRW070-14 71.8 A 53.0 8.4 98 18.4 C 1.21 MAS #46 70.5 B 58.4 7.7 98 18.9 B 0.90 USG 3895 70.0 B 59.4 7.7 82 17.9 F 0.69 AgriMAXX 415 69.8 B 51.8 8.5 102 17.9 F 0.46 SS 8340 69.3 C 51.2 8.8 98 18.5 C 0.32 ARGA04510-11LE24 70.2 B 50.0 9.7 120 17.0 F 0.28 VA09MAS1-12-8-4 69.6 C 49.4 8.6 103 17.8 F 0.27 L11541 69.9 B 50.8 8.7 104 17.6 F 0.26 USG 3201 68.8 C 50.3 9.1 110 18.0 D 0.19 MAS #65 70.1 B 51.2 8.2 85 17.6 F 0.17 Massey 68.1 D 50.1 9.7 125 17.6 F 0.10 Pioneer Brand 26R10 68.0 D 60.0 8.6 101 18.0 D 0.08 Pioneer Brand 26R59 68.2 D 52.5 8.2 93 18.0 D 0.01 Shirley (Standard) 69.1 C 52.5 8.0 78 17.6 F 0.00 USG 3251 67.7 D 54.6 8.7 93 18.3 D -0.03 #Warrior 69.2 C 51.5 8.1 89 17.4 F -0.13 AgriMAXX 474 69.0 C 51.6 8.3 89 17.4 F -0.13 VA09MAS6-122-7-1 67.6 D 49.4 9.6 108 17.9 F -0.13 VA10W-119 68.6 C 48.3 9.0 115 16.7 F -0.16 MAS #32 68.0 D 53.5 8.0 87 17.8 F -0.16 MAS #7 67.6 D 53.3 8.6 109 18.0 D -0.16 MAS #6 69.1 C 52.9 8.3 96 17.9 F -0.17 VA12W-248 68.3 C 49.6 8.5 108 17.4 F -0.18 MAS #35 72.4 A 44.3 8.1 90 16.9 F -0.18 VA11W-108PA 67.7 D 55.2 8.1 119 18.0 D -0.20 Pioneer Brand 26R41 68.1 D 53.5 8.5 111 17.3 F -0.22 Pioneer Brand 26R20 67.3 D 55.5 7.5 99 17.9 F -0.23 VA14FHB-28 68.4 C 47.0 8.3 101 16.9 F -0.26 Croplan 8415 68.3 C 47.7 9.8 114 16.9 F -0.28 VA13W-38 67.6 D 46.7 9.2 114 17.4 F -0.29 Croplan 8550 68.3 C 52.4 8.2 84 17.5 F -0.29 #Bullet 67.9 D 53.6 8.0 87 18.0 D -0.30 VA12W-68 66.7 F 48.5 9.4 102 17.4 F -0.37 GA-03564-12E6 68.5 C 44.7 8.9 118 16.7 F -0.40 Hilliard 67.6 D 54.5 8.2 119 17.7 F -0.46 VA12W-72 66.5 F 49.0 8.8 102 17.5 F -0.49 VA11W-106 66.4 F 50.4 8.9 108 17.6 F -0.51 MAS #67 66.8 F 49.9 8.0 90 17.8 F -0.61 AR01040-4-1 67.6 D 52.5 8.0 91 17.6 F -0.62 VA12FHB-8 66.8 F 51.8 7.5 94 17.3 F -0.62 MAS #61 67.2 D 50.5 7.8 103 17.4 F -0.64
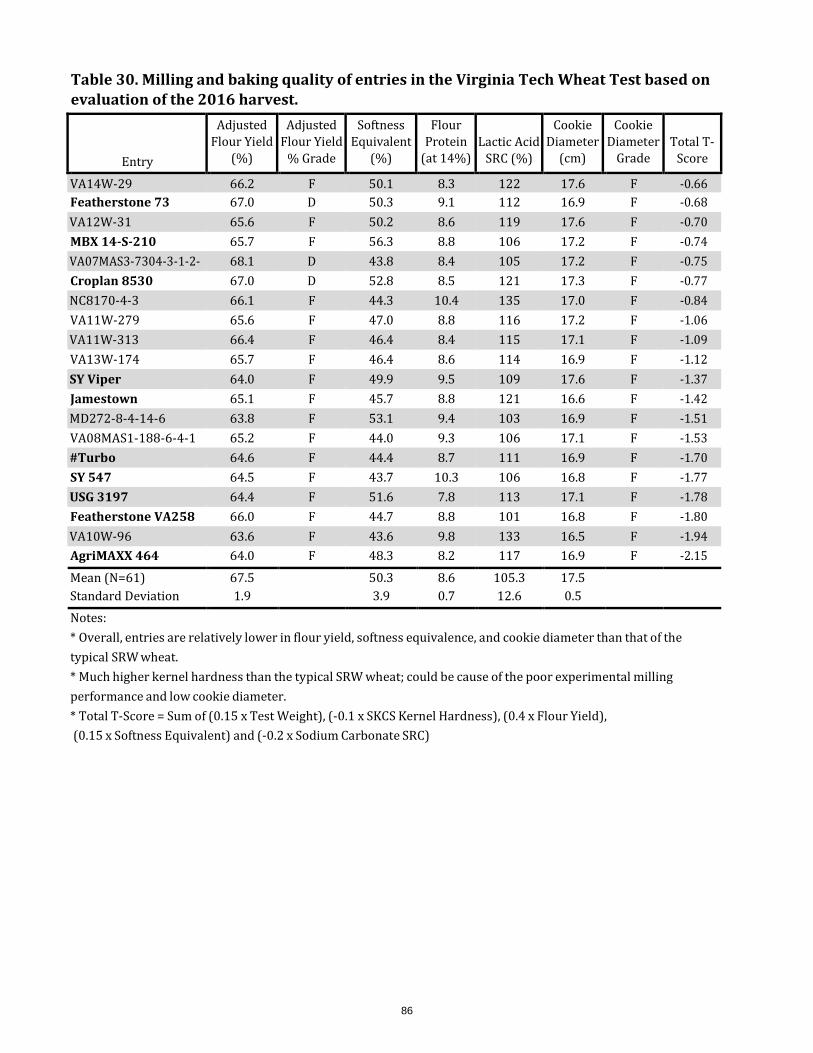
86
Table 30. Milling and baking quality of entries in the Virginia Tech Wheat Test based on evaluation of the 2016 harvest.
Entry
Adjusted Flour Yield
(%)
Adjusted Flour Yield
% Grade
Softness Equivalent
(%)
Flour Protein
(at 14%)
Lactic Acid
SRC (%)
Cookie Diameter
(cm)
Cookie Diameter
Grade
Total T-
Score
VA14W-29 66.2 F 50.1 8.3 122 17.6 F -0.66 Featherstone 73 67.0 D 50.3 9.1 112 16.9 F -0.68 VA12W-31 65.6 F 50.2 8.6 119 17.6 F -0.70 MBX 14-S-210 65.7 F 56.3 8.8 106 17.2 F -0.74 VA07MAS3-7304-3-1-2- 68.1 D 43.8 8.4 105 17.2 F -0.75 Croplan 8530 67.0 D 52.8 8.5 121 17.3 F -0.77 NC8170-4-3 66.1 F 44.3 10.4 135 17.0 F -0.84 VA11W-279 65.6 F 47.0 8.8 116 17.2 F -1.06 VA11W-313 66.4 F 46.4 8.4 115 17.1 F -1.09 VA13W-174 65.7 F 46.4 8.6 114 16.9 F -1.12 SY Viper 64.0 F 49.9 9.5 109 17.6 F -1.37 Jamestown 65.1 F 45.7 8.8 121 16.6 F -1.42 MD272-8-4-14-6 63.8 F 53.1 9.4 103 16.9 F -1.51 VA08MAS1-188-6-4-1 65.2 F 44.0 9.3 106 17.1 F -1.53 #Turbo 64.6 F 44.4 8.7 111 16.9 F -1.70 SY 547 64.5 F 43.7 10.3 106 16.8 F -1.77 USG 3197 64.4 F 51.6 7.8 113 17.1 F -1.78 Featherstone VA258 66.0 F 44.7 8.8 101 16.8 F -1.80 VA10W-96 63.6 F 43.6 9.8 133 16.5 F -1.94 AgriMAXX 464 64.0 F 48.3 8.2 117 16.9 F -2.15 Mean (N=61) 67.5 50.3 8.6 105.3 17.5 Standard Deviation 1.9 3.9 0.7 12.6 0.5 Notes: * Overall, entries are relatively lower in flour yield, softness equivalence, and cookie diameter than that of the typical SRW wheat. * Much higher kernel hardness than the typical SRW wheat; could be cause of the poor experimental milling performance and low cookie diameter. * Total T-Score = Sum of (0.15 x Test Weight), (-0.1 x SKCS Kernel Hardness), (0.4 x Flour Yield), (0.15 x Softness Equivalent) and (-0.2 x Sodium Carbonate SRC)
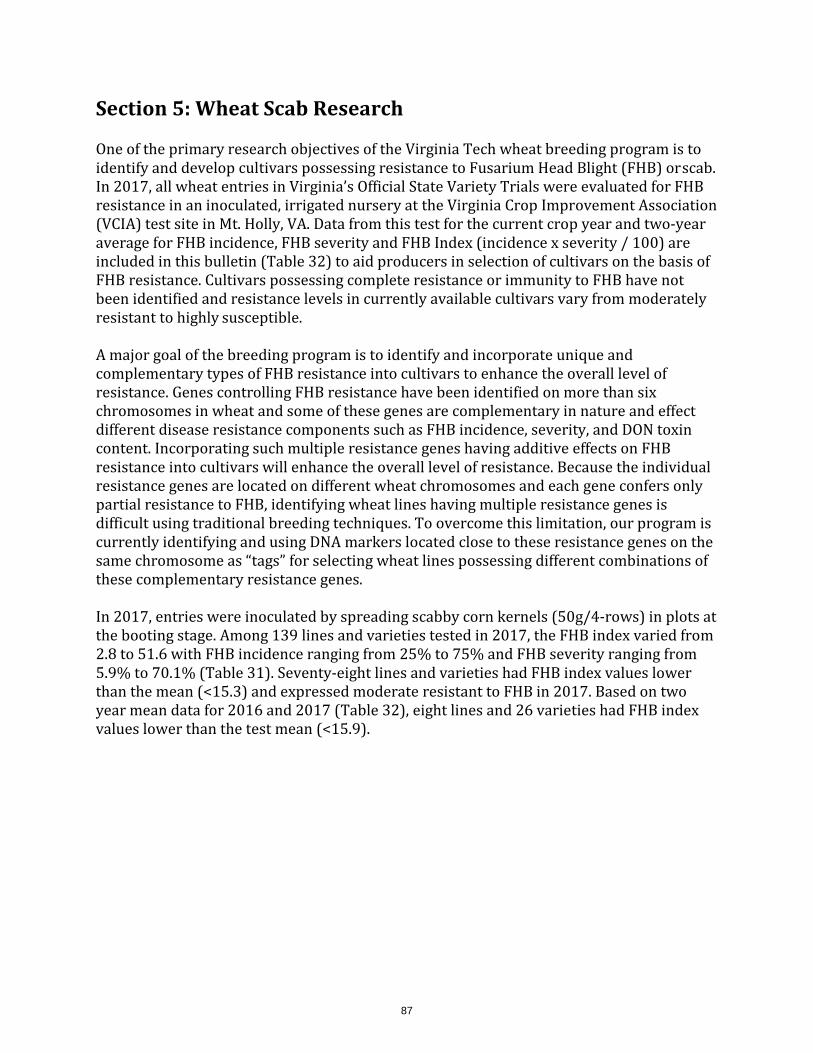
Section 5: Wheat Scab Research
One of the primary research objectives of the Virginia Tech wheat breeding program is to identify and develop cultivars possessing resistance to Fusarium Head Blight (FHB) or scab. In 2017, all wheat entries in Virginia’s Official State Variety Trials were evaluated for FHB resistance in an inoculated, irrigated nursery at the Virginia Crop Improvement Association (VCIA) test site in Mt. Holly, VA. Data from this test for the current crop year and two-year average for FHB incidence, FHB severity and FHB Index (incidence x severity / 100) are included in this bulletin (Table 32) to aid producers in selection of cultivars on the basis of FHB resistance. Cultivars possessing complete resistance or immunity to FHB have not been identified and resistance levels in currently available cultivars vary from moderately resistant to highly susceptible.
A major goal of the breeding program is to identify and incorporate unique and complementary types of FHB resistance into cultivars to enhance the overall level of resistance. Genes controlling FHB resistance have been identified on more than six chromosomes in wheat and some of these genes are complementary in nature and effect different disease resistance components such as FHB incidence, severity, and DON toxin content. Incorporating such multiple resistance genes having additive effects on FHB resistance into cultivars will enhance the overall level of resistance. Because the individual resistance genes are located on different wheat chromosomes and each gene confers only partial resistance to FHB, identifying wheat lines having multiple resistance genes is difficult using traditional breeding techniques. To overcome this limitation, our program is currently identifying and using DNA markers located close to these resistance genes on the same chromosome as “tags” for selecting wheat lines possessing different combinations of these complementary resistance genes.
In 2017, entries were inoculated by spreading scabby corn kernels (50g/4-rows) in plots at the booting stage. Among 139 lines and varieties tested in 2017, the FHB index varied from 2.8 to 51.6 with FHB incidence ranging from 25% to 75% and FHB severity ranging from 5.9% to 70.1% (Table 31). Seventy-eight lines and varieties had FHB index values lower than the mean (<15.3) and expressed moderate resistant to FHB in 2017. Based on two year mean data for 2016 and 2017 (Table 32), eight lines and 26 varieties had FHB index values lower than the test mean (<15.9).
87
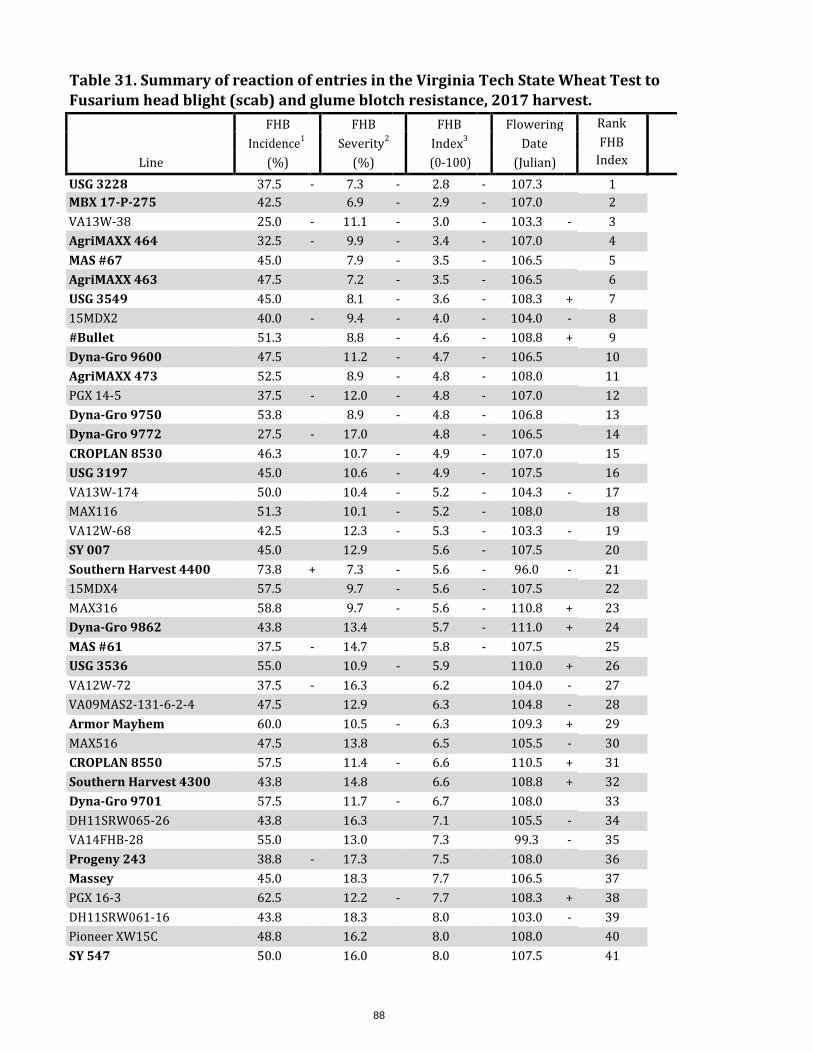
88
Table 31. Summary of reaction of entries in the Virginia Tech State Wheat Test to Fusarium head blight (scab) and glume blotch resistance, 2017 harvest. FHB FHB FHB Flowering Rank Incidence1
Severity2 Index3
Date FHB Line (%) (%) (0-100) (Julian) Index
USG 3228 37.5 - 7.3 - 2.8 - 107.3 1 MBX 17-P-275 42.5 6.9 - 2.9 - 107.0 2 VA13W-38 25.0 - 11.1 - 3.0 - 103.3 - 3 AgriMAXX 464 32.5 - 9.9 - 3.4 - 107.0 4 MAS #67 45.0 7.9 - 3.5 - 106.5 5 AgriMAXX 463 47.5 7.2 - 3.5 - 106.5 6 USG 3549 45.0 8.1 - 3.6 - 108.3 + 7 15MDX2 40.0 - 9.4 - 4.0 - 104.0 - 8 #Bullet 51.3 8.8 - 4.6 - 108.8 + 9 Dyna-Gro 9600 47.5 11.2 - 4.7 - 106.5 10 AgriMAXX 473 52.5 8.9 - 4.8 - 108.0 11 PGX 14-5 37.5 - 12.0 - 4.8 - 107.0 12 Dyna-Gro 9750 53.8 8.9 - 4.8 - 106.8 13 Dyna-Gro 9772 27.5 - 17.0 4.8 - 106.5 14 CROPLAN 8530 46.3 10.7 - 4.9 - 107.0 15 USG 3197 45.0 10.6 - 4.9 - 107.5 16 VA13W-174 50.0 10.4 - 5.2 - 104.3 - 17 MAX116 51.3 10.1 - 5.2 - 108.0 18 VA12W-68 42.5 12.3 - 5.3 - 103.3 - 19 SY 007 45.0 12.9 5.6 - 107.5 20 Southern Harvest 4400 73.8 + 7.3 - 5.6 - 96.0 - 21 15MDX4 57.5 9.7 - 5.6 - 107.5 22 MAX316 58.8 9.7 - 5.6 - 110.8 + 23 Dyna-Gro 9862 43.8 13.4 5.7 - 111.0 + 24 MAS #61 37.5 - 14.7 5.8 - 107.5 25 USG 3536 55.0 10.9 - 5.9 110.0 + 26 VA12W-72 37.5 - 16.3 6.2 104.0 - 27 VA09MAS2-131-6-2-4 47.5 12.9 6.3 104.8 - 28 Armor Mayhem 60.0 10.5 - 6.3 109.3 + 29 MAX516 47.5 13.8 6.5 105.5 - 30 CROPLAN 8550 57.5 11.4 - 6.6 110.5 + 31 Southern Harvest 4300 43.8 14.8 6.6 108.8 + 32 Dyna-Gro 9701 57.5 11.7 - 6.7 108.0 33 DH11SRW065-26 43.8 16.3 7.1 105.5 - 34 VA14FHB-28 55.0 13.0 7.3 99.3 - 35 Progeny 243 38.8 - 17.3 7.5 108.0 36 Massey 45.0 18.3 7.7 106.5 37 PGX 16-3 62.5 12.2 - 7.7 108.3 + 38 DH11SRW061-16 43.8 18.3 8.0 103.0 - 39 Pioneer XW15C 48.8 16.2 8.0 108.0 40 SY 547 50.0 16.0 8.0 107.5 41
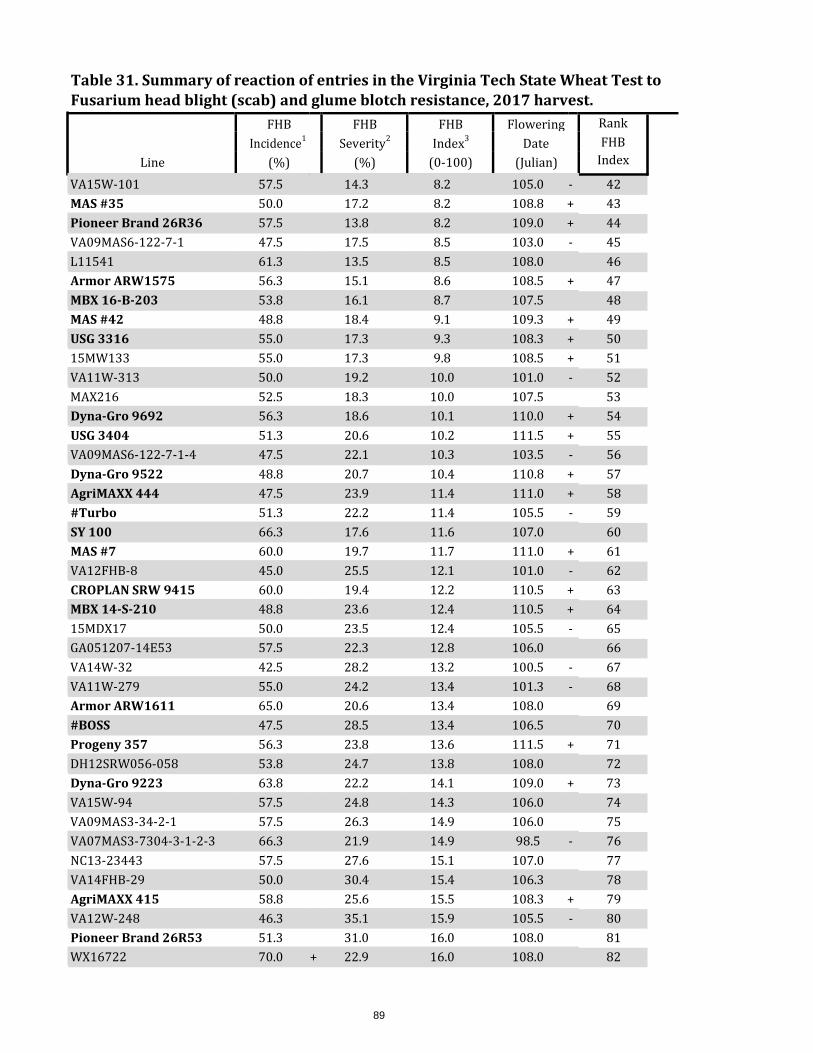
89
Table 31. Summary of reaction of entries in the Virginia Tech State Wheat Test to Fusarium head blight (scab) and glume blotch resistance, 2017 harvest. FHB FHB FHB Flowering Rank Incidence1
Severity2 Index3
Date FHB Line (%) (%) (0-100) (Julian) Index
VA15W-101 57.5 14.3 8.2 105.0 - 42 MAS #35 50.0 17.2 8.2 108.8 + 43 Pioneer Brand 26R36 57.5 13.8 8.2 109.0 + 44 VA09MAS6-122-7-1 47.5 17.5 8.5 103.0 - 45 L11541 61.3 13.5 8.5 108.0 46 Armor ARW1575 56.3 15.1 8.6 108.5 + 47 MBX 16-B-203 53.8 16.1 8.7 107.5 48 MAS #42 48.8 18.4 9.1 109.3 + 49 USG 3316 55.0 17.3 9.3 108.3 + 50 15MW133 55.0 17.3 9.8 108.5 + 51 VA11W-313 50.0 19.2 10.0 101.0 - 52 MAX216 52.5 18.3 10.0 107.5 53 Dyna-Gro 9692 56.3 18.6 10.1 110.0 + 54 USG 3404 51.3 20.6 10.2 111.5 + 55 VA09MAS6-122-7-1-4 47.5 22.1 10.3 103.5 - 56 Dyna-Gro 9522 48.8 20.7 10.4 110.8 + 57 AgriMAXX 444 47.5 23.9 11.4 111.0 + 58 #Turbo 51.3 22.2 11.4 105.5 - 59 SY 100 66.3 17.6 11.6 107.0 60 MAS #7 60.0 19.7 11.7 111.0 + 61 VA12FHB-8 45.0 25.5 12.1 101.0 - 62 CROPLAN SRW 9415 60.0 19.4 12.2 110.5 + 63 MBX 14-S-210 48.8 23.6 12.4 110.5 + 64 15MDX17 50.0 23.5 12.4 105.5 - 65 GA051207-14E53 57.5 22.3 12.8 106.0 66 VA14W-32 42.5 28.2 13.2 100.5 - 67 VA11W-279 55.0 24.2 13.4 101.3 - 68 Armor ARW1611 65.0 20.6 13.4 108.0 69 #BOSS 47.5 28.5 13.4 106.5 70 Progeny 357 56.3 23.8 13.6 111.5 + 71 DH12SRW056-058 53.8 24.7 13.8 108.0 72 Dyna-Gro 9223 63.8 22.2 14.1 109.0 + 73 VA15W-94 57.5 24.8 14.3 106.0 74 VA09MAS3-34-2-1 57.5 26.3 14.9 106.0 75 VA07MAS3-7304-3-1-2-3 66.3 21.9 14.9 98.5 - 76 NC13-23443 57.5 27.6 15.1 107.0 77 VA14FHB-29 50.0 30.4 15.4 106.3 78 AgriMAXX 415 58.8 25.6 15.5 108.3 + 79 VA12W-248 46.3 35.1 15.9 105.5 - 80 Pioneer Brand 26R53 51.3 31.0 16.0 108.0 81 WX16722 70.0 + 22.9 16.0 108.0 82
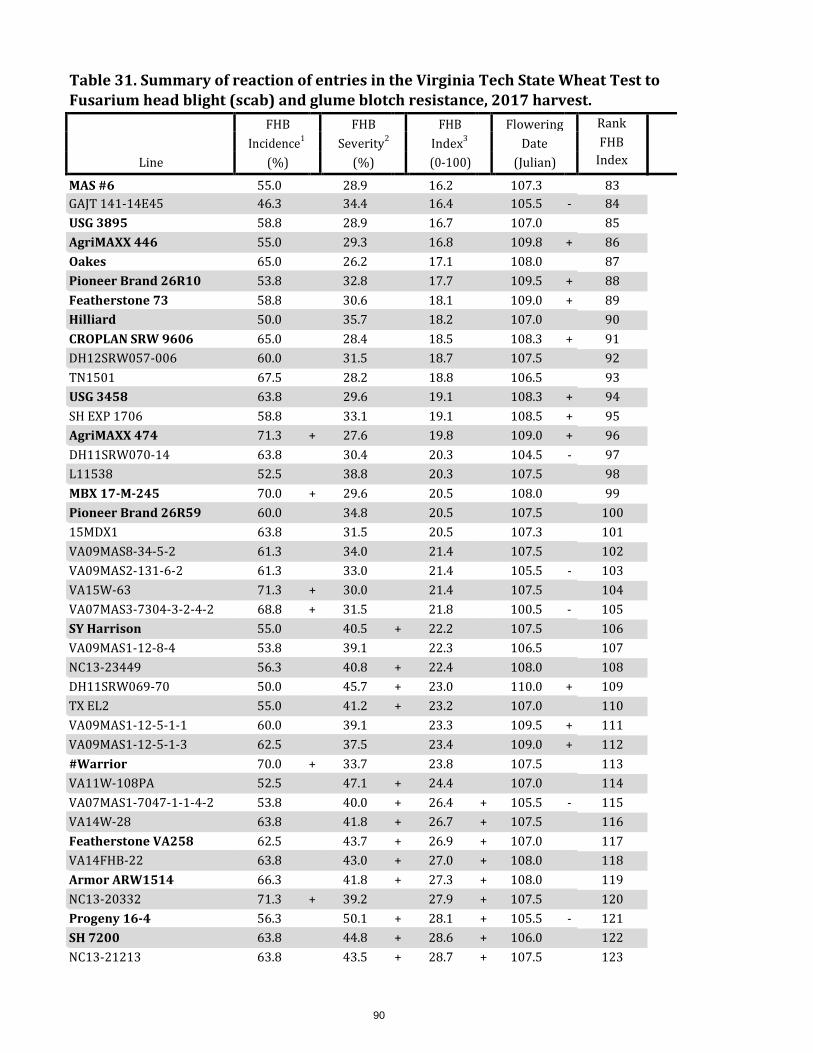
90
Table 31. Summary of reaction of entries in the Virginia Tech State Wheat Test to Fusarium head blight (scab) and glume blotch resistance, 2017 harvest. FHB FHB FHB Flowering Rank Incidence1
Severity2 Index3
Date FHB Line (%) (%) (0-100) (Julian) Index
MAS #6 55.0 28.9 16.2 107.3 83 GAJT 141-14E45 46.3 34.4 16.4 105.5 - 84 USG 3895 58.8 28.9 16.7 107.0 85 AgriMAXX 446 55.0 29.3 16.8 109.8 + 86 Oakes 65.0 26.2 17.1 108.0 87 Pioneer Brand 26R10 53.8 32.8 17.7 109.5 + 88 Featherstone 73 58.8 30.6 18.1 109.0 + 89 Hilliard 50.0 35.7 18.2 107.0 90 CROPLAN SRW 9606 65.0 28.4 18.5 108.3 + 91 DH12SRW057-006 60.0 31.5 18.7 107.5 92 TN1501 67.5 28.2 18.8 106.5 93 USG 3458 63.8 29.6 19.1 108.3 + 94 SH EXP 1706 58.8 33.1 19.1 108.5 + 95 AgriMAXX 474 71.3 + 27.6 19.8 109.0 + 96 DH11SRW070-14 63.8 30.4 20.3 104.5 - 97 L11538 52.5 38.8 20.3 107.5 98 MBX 17-M-245 70.0 + 29.6 20.5 108.0 99 Pioneer Brand 26R59 60.0 34.8 20.5 107.5 100 15MDX1 63.8 31.5 20.5 107.3 101 VA09MAS8-34-5-2 61.3 34.0 21.4 107.5 102 VA09MAS2-131-6-2 61.3 33.0 21.4 105.5 - 103 VA15W-63 71.3 + 30.0 21.4 107.5 104 VA07MAS3-7304-3-2-4-2 68.8 + 31.5 21.8 100.5 - 105 SY Harrison 55.0 40.5 + 22.2 107.5 106 VA09MAS1-12-8-4 53.8 39.1 22.3 106.5 107 NC13-23449 56.3 40.8 + 22.4 108.0 108 DH11SRW069-70 50.0 45.7 + 23.0 110.0 + 109 TX EL2 55.0 41.2 + 23.2 107.0 110 VA09MAS1-12-5-1-1 60.0 39.1 23.3 109.5 + 111 VA09MAS1-12-5-1-3 62.5 37.5 23.4 109.0 + 112 #Warrior 70.0 + 33.7 23.8 107.5 113 VA11W-108PA 52.5 47.1 + 24.4 107.0 114 VA07MAS1-7047-1-1-4-2 53.8 40.0 + 26.4 + 105.5 - 115 VA14W-28 63.8 41.8 + 26.7 + 107.5 116 Featherstone VA258 62.5 43.7 + 26.9 + 107.0 117 VA14FHB-22 63.8 43.0 + 27.0 + 108.0 118 Armor ARW1514 66.3 41.8 + 27.3 + 108.0 119 NC13-20332 71.3 + 39.2 27.9 + 107.5 120 Progeny 16-4 56.3 50.1 + 28.1 + 105.5 - 121 SH 7200 63.8 44.8 + 28.6 + 106.0 122 NC13-21213 63.8 43.5 + 28.7 + 107.5 123

91
Table 31. Summary of reaction of entries in the Virginia Tech State Wheat Test to Fusarium head blight (scab) and glume blotch resistance, 2017 harvest. FHB FHB FHB Flowering Rank Incidence1
Severity2 Index3
Date FHB Line (%) (%) (0-100) (Julian) Index
Armor ARW1610 68.8 + 40.6 + 29.1 + 109.5 + 124 SY Viper 51.3 57.0 + 29.2 + 106.8 125 VA09MAS1-12-5-1 62.5 46.9 + 29.3 + 107.5 126 TN1604 75.0 + 40.2 + 30.1 + 108.0 127 VA12W-31 73.8 + 41.1 + 30.2 + 107.5 128 VA09MAS6-122-7-1-1 67.5 45.9 + 31.4 + 106.0 129 CROPLAN 8415 66.3 44.8 + 31.5 + 107.0 130 Pioneer Brand 26R41 61.3 51.6 + 31.8 + 109.0 + 131 Shirley 61.3 52.8 + 32.0 + 107.5 132 L11550 66.3 49.1 + 32.8 + 108.0 133 VA08MAS1-188-6-4-1 68.8 + 52.8 + 36.1 + 106.0 134 DH11SRW065-23 65.0 56.2 + 36.3 + 109.0 + 135 GA07353-14E19 65.0 56.8 + 36.6 + 106.3 136 Progeny 16-1 66.3 57.4 + 38.6 + 107.5 137 VA14W-29 73.8 + 70.1 + 51.6 + 107.5 138 Average 55.3 26.1 15.3 106.9 LSD (O.05) 13.4 13.6 9.5 1.2 C.V. 17.4 37.5 44.7 0.8 Released cultivars are shown in bold print. Varieties are ordered by ascending index averages. A plus or minus sign indicates a performance significantly above or below the average. Entries were planted in 2-row plots, 4 ft in length at Mt. Holly, VA and were inoculated at booting stage with scabby corn kernels (50g/4-rows). 1Scab Incidence (%): Percentage of infected spikes among 20 randomly selected spikes. 2Scab Severity (%): Percentage of infected spikelets among 20 infected spikes. 3Scab Index = Incidence X Severity/100; it is an overall indicator of scab resistance/susceptibility level.
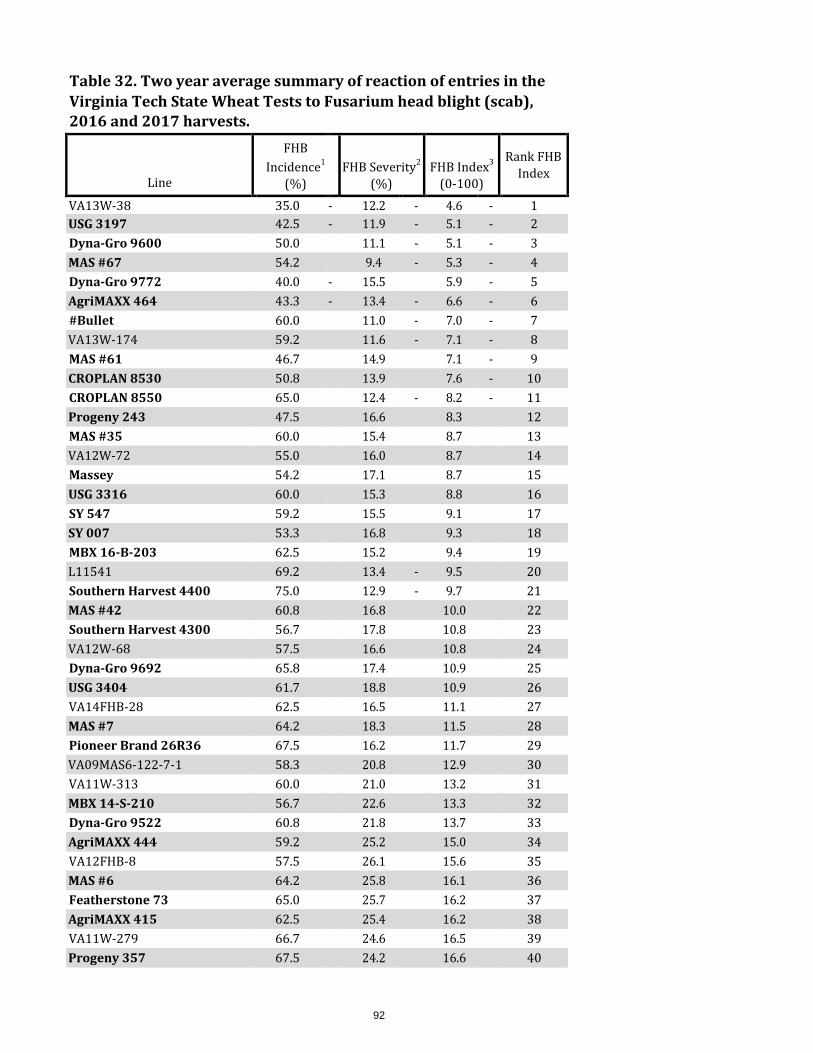
92
Table 32. Two year average summary of reaction of entries in the Virginia Tech State Wheat Tests to Fusarium head blight (scab), 2016 and 2017 harvests.
Line
FHB Incidence1
(%)
FHB Severity2
(%)
FHB Index3
(0-100)
Rank FHB Index
VA13W-38 35.0 - 12.2 - 4.6 - 1 USG 3197 42.5 - 11.9 - 5.1 - 2 Dyna-Gro 9600 50.0 11.1 - 5.1 - 3 MAS #67 54.2 9.4 - 5.3 - 4 Dyna-Gro 9772 40.0 - 15.5 5.9 - 5 AgriMAXX 464 43.3 - 13.4 - 6.6 - 6 #Bullet 60.0 11.0 - 7.0 - 7 VA13W-174 59.2 11.6 - 7.1 - 8 MAS #61 46.7 14.9 7.1 - 9 CROPLAN 8530 50.8 13.9 7.6 - 10 CROPLAN 8550 65.0 12.4 - 8.2 - 11 Progeny 243 47.5 16.6 8.3 12 MAS #35 60.0 15.4 8.7 13 VA12W-72 55.0 16.0 8.7 14 Massey 54.2 17.1 8.7 15 USG 3316 60.0 15.3 8.8 16 SY 547 59.2 15.5 9.1 17 SY 007 53.3 16.8 9.3 18 MBX 16-B-203 62.5 15.2 9.4 19 L11541 69.2 13.4 - 9.5 20 Southern Harvest 4400 75.0 12.9 - 9.7 21 MAS #42 60.8 16.8 10.0 22 Southern Harvest 4300 56.7 17.8 10.8 23 VA12W-68 57.5 16.6 10.8 24 Dyna-Gro 9692 65.8 17.4 10.9 25 USG 3404 61.7 18.8 10.9 26 VA14FHB-28 62.5 16.5 11.1 27 MAS #7 64.2 18.3 11.5 28 Pioneer Brand 26R36 67.5 16.2 11.7 29 VA09MAS6-122-7-1 58.3 20.8 12.9 30 VA11W-313 60.0 21.0 13.2 31 MBX 14-S-210 56.7 22.6 13.3 32 Dyna-Gro 9522 60.8 21.8 13.7 33 AgriMAXX 444 59.2 25.2 15.0 34 VA12FHB-8 57.5 26.1 15.6 35 MAS #6 64.2 25.8 16.1 36 Featherstone 73 65.0 25.7 16.2 37 AgriMAXX 415 62.5 25.4 16.2 38 VA11W-279 66.7 24.6 16.5 39 Progeny 357 67.5 24.2 16.6 40
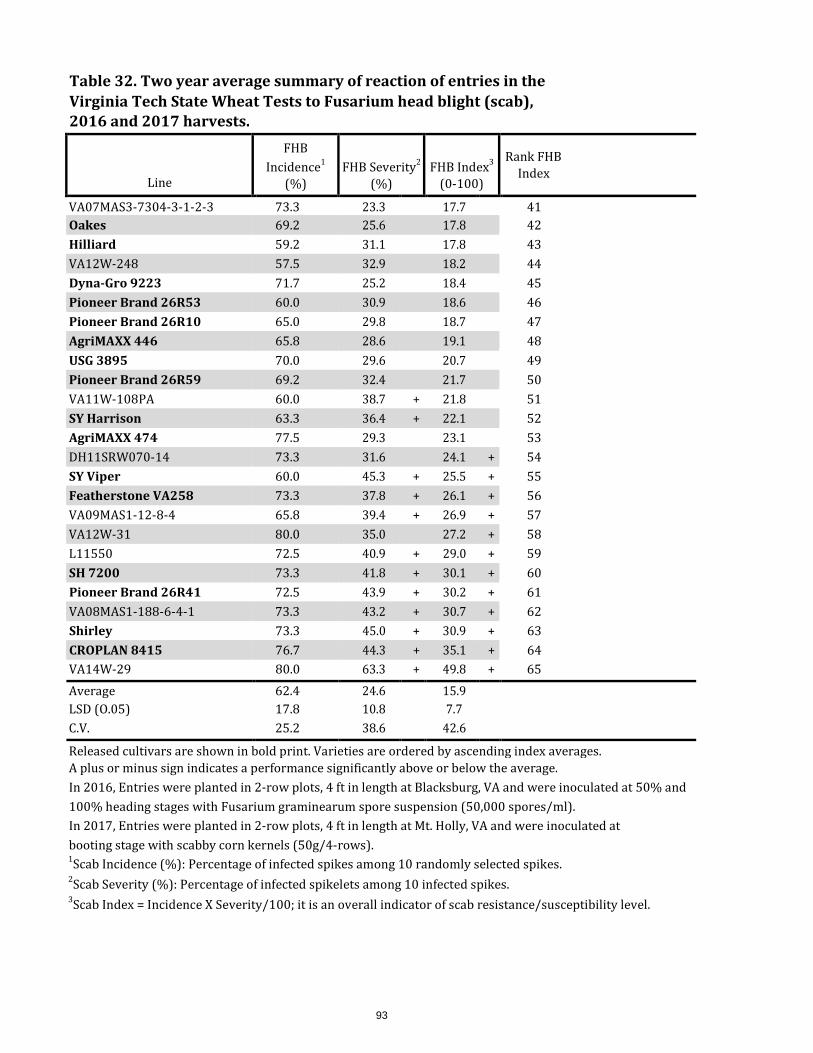
93
Table 32. Two year average summary of reaction of entries in the Virginia Tech State Wheat Tests to Fusarium head blight (scab), 2016 and 2017 harvests.
Line
FHB Incidence1
(%)
FHB Severity2
(%)
FHB Index3
(0-100)
Rank FHB Index
VA07MAS3-7304-3-1-2-3 73.3 23.3 17.7 41 Oakes 69.2 25.6 17.8 42 Hilliard 59.2 31.1 17.8 43 VA12W-248 57.5 32.9 18.2 44 Dyna-Gro 9223 71.7 25.2 18.4 45 Pioneer Brand 26R53 60.0 30.9 18.6 46 Pioneer Brand 26R10 65.0 29.8 18.7 47 AgriMAXX 446 65.8 28.6 19.1 48 USG 3895 70.0 29.6 20.7 49 Pioneer Brand 26R59 69.2 32.4 21.7 50 VA11W-108PA 60.0 38.7 + 21.8 51 SY Harrison 63.3 36.4 + 22.1 52 AgriMAXX 474 77.5 29.3 23.1 53 DH11SRW070-14 73.3 31.6 24.1 + 54 SY Viper 60.0 45.3 + 25.5 + 55 Featherstone VA258 73.3 37.8 + 26.1 + 56 VA09MAS1-12-8-4 65.8 39.4 + 26.9 + 57 VA12W-31 80.0 35.0 27.2 + 58 L11550 72.5 40.9 + 29.0 + 59 SH 7200 73.3 41.8 + 30.1 + 60 Pioneer Brand 26R41 72.5 43.9 + 30.2 + 61 VA08MAS1-188-6-4-1 73.3 43.2 + 30.7 + 62 Shirley 73.3 45.0 + 30.9 + 63 CROPLAN 8415 76.7 44.3 + 35.1 + 64 VA14W-29 80.0 63.3 + 49.8 + 65 Average 62.4 24.6 15.9 LSD (O.05) 17.8 10.8 7.7 C.V. 25.2 38.6 42.6 Released cultivars are shown in bold print. Varieties are ordered by ascending index averages. A plus or minus sign indicates a performance significantly above or below the average. In 2016, Entries were planted in 2-row plots, 4 ft in length at Blacksburg, VA and were inoculated at 50% and 100% heading stages with Fusarium graminearum spore suspension (50,000 spores/ml). In 2017, Entries were planted in 2-row plots, 4 ft in length at Mt. Holly, VA and were inoculated at booting stage with scabby corn kernels (50g/4-rows). 1Scab Incidence (%): Percentage of infected spikes among 10 randomly selected spikes. 2Scab Severity (%): Percentage of infected spikelets among 10 infected spikes. 3Scab Index = Incidence X Severity/100; it is an overall indicator of scab resistance/susceptibility level.