Small Capitalization Value Equity Managementretirement.ladwp.com/AgendaItems/Agenda - 20101013 Item...
46
World-ex US Value Equity Management October 13, 2010 P R E S E N T S D. Kirk Henry, CFA Senior Portfolio Manager (617) 722-7051 John D. Havens Senior Relationship Manager (617) 722-7031 Los Angeles Water and Power Employees’ Retirement Plan
Transcript of Small Capitalization Value Equity Managementretirement.ladwp.com/AgendaItems/Agenda - 20101013 Item...

World-ex US ValueEquity ManagementOctober 13, 2010
P R E S E N T S
D. Kirk Henry, CFASenior Portfolio Manager(617) 722-7051
John D. HavensSenior Relationship Manager(617) 722-7031
Los Angeles Water and Power Employees’ Retirement Plan

LADWP10/13/10
2
Table of Contents
Section A: Company Overview 3
Section B: Investment Process and Discipline 11
Section C: Market Overview 18
Section D: Performance Review 22
Section E: Country Weights and Portfolio Structure 35
Section F: Portfolio Holdings, Fees, Disclosures & Exhibits 38

LADWP10/13/10
3
Company Overview

LADWP10/13/10
The Boston Company Asset Management, LLC
4
Total Assets Under Management: $32.5 billion
Boston Safe Deposit Company incorporated in 1867, The Boston Company Asset Management, LLC established 1970
A fundamental research approach to global equity management
– 85 investment professionals
– 7 investment teams
– 16 core research analysts
Consistent stock selection methodology
US Equity Non-US Equity
Large Cap $8.2 billion Large Cap $5.7 billion
Mid Cap $3.1 billion Small Cap $74.4 million
Small Mid Cap $1.9 billion Emerging Markets $8.2 billion
Small Cap $4.3 billion
Balanced $83.4 million
Sector Strategies $460.1 million
Global Equity Absolute Return
Large Cap $176.9 million Market Neutral $132.2 million*
Small Cap $40.4 million Micro Cap Absolute $194.2 million
Absolute Return Growth $4.5 million
Absolute Return Opportunistic $8.6 million
Company Overview as of June 30, 2010
*As of August 31, 2010 approximately $37 million of the Market Neutral assets have been placed in administration in the UK and are currently unavailable.Includes assets managed by investment personnel of The Boston Company Asset Management, LLC acting in their capacity as officers of affiliated entities. No investment strategy or risk management technique can guarantee returns or eliminate risk in any market environment.
525

LADWP10/13/10
5
American Airlines, Inc.American Beacon AdvisorsBaker Hughes IncorporatedBarnes Group, Inc.Care First, Inc.CIBCCitizens Financial Group, Inc.Continental Airlines, Inc.Eastern Connecticut Health Network, Inc.Ericsson, Inc.General Conference Corp. of Seventh-Day AdventistsGoodrich CorporationIntermountain HealthcareMAFCO Holdings, Inc.Motorola, Inc.PacifiCorp, Inc.Public Service Enterprise Group, IncorporatedScripps HealthThe Bank of NY Mellon (Mellon Pension Services)The Lubrizol CorporationTorstar CorporationVerizon Investment Management CorporationWaste Management, Inc.
TBCAM representative client list consists of clients invested in separately managed and commingled accounts through an affiliate.The client list represents a cross section of clients by type, product and geographic region. The client list was not determined based uponperformance-based criteria. It is not known whether the listed clients approve or disapprove of the adviser or the advisory services provided.
American Honda FoundationCare First, Inc.College of the Holy CrossCommonFundMichigan State UniversitySociety of Jesus of New EnglandThe College of William & Mary FoundationThe Jewish Federation of Metropolitan DetroitThe Lubrizol CorporationUniversity of Alabama Health ServicesUniversity of the RedlandsVillanova University
California Public Employees’ Retirement SystemCity of Boston Retirement SystemCity of Brockton Retirement BoardCity of Clearwater FirefightersCity of Delray BeachCity of Miramar Police & FireCity of New Bedford Retirement BoardCity of North Miami Retirement SystemCity of Phoenix Employees Retirement SystemCity of Sarasota Police OfficersCity of Taunton Retirement BoardFireman's Annuity & Benefit Fund of ChicagoLos Angeles City Employees' Retirement SystemMassachusetts Water Resources Authority Mississippi Healthcare Trust FundMississippi Prepaid College TuitionMississippi Public EmployeesNorfolk County Retirement BoardNorwood Retirement SystemPennsylvania Public Schools Retirement System Plymouth County Retirement SystemSan Jose Retirement System - Police and FireSt. Louis PoliceSt. Paul's Teacher's Retirement FundSt. Petersburg Fireman's Pension FundTeachers’ Retirement System of the State of IllinoisTown of Fairfield Retirement SystemVirginia Retirement System
Taft-HartleyActors Equity AssociationConnecticut CarpentersGraphic Arts IndustryNational Electric Benefit FundRhode Island Laborers
The Boston Company Asset Management, LLC: Representative Client List
Corporate PublicEndowments/Foundations

LADWP10/13/10
Richard K. Watson, Jr.Executive Vice President &
Head of Distribution
Product Development & Management
Relationship Management
Marketing & Communications
Distribution Support
The Boston Company Asset Management, LLCOrganizational Chart
David H. Cameron, CFAChairman, President & Chief Executive Officer
Joseph P. GennacoExecutive Vice President &
Chief Operating Officer
John Truschel, CFAExecutive Vice President &Chief Investment Officer
Portfolio Teams
Quantitative Research
Core Research
Global Equity Trading Administration
OperationsCompliance
Finance
Portfolio Strategy
Investment Systems & Data
Portfolio Implementation
6

LADWP10/13/10
Equity TeamsOrganizational Chart
John Truschel, CFAExecutive Vice President & Chief Investment Officer
Portfolio Team Strategy Team Members
Joseph M. Corrado, CFA US Small Cap & Small Mid Cap Value 6
David A. Daglio, CFA US Small & Mid Cap Opportunistic 8
Brian C. Ferguson US Large Cap Value 5
Sean P. Fitzgibbon, CFA Global Core & Market Neutral 12
D. Kirk Henry, CFA Non-US Value 17
Elizabeth Slover US Large Cap Growth 16
B. Randall Watts, Jr. CFA US Micro Cap, Small Cap & Small Mid Cap Growth 8
Shared Resources Strategy Team Members
Elizabeth Slover Core Research 16
Martin D. Stephan, CFA Quantitative Research 6
William Adams and George Saffaye Portfolio Strategy 6
David L. Brooks Trading 8
7

LADWP10/13/10
8
EAFE Value Equity: Investment Team
*Includes tenure at The Bank of New York Mellon Corporation affiliates.
Research and ManagementIndustry
ExperienceYears at Firm* Title Region/Sector Coverage
D. Kirk Henry, CFABA, Stanford University;MBA, University of Chicago
29 16 Senior Managing Director, Senior Portfolio Manager, Director of International Value Equity
Europe, Asia ex-Japan
Clifford A. Smith, CFABS, Pennsylvania State University;MS, Princeton University;MBA, Carnegie Mellon University
15 15 Senior Managing Director, Senior Portfolio Manager Japan, Australia, US
William C. Jurik, CFABS & MBA, Carnegie Mellon University 16 16 Managing Director, Senior Portfolio Manager Europe, US/Global Financials
Andrea M. Clark, CFABS & MBA, Suffolk University 24 11 Director, Senior International Research Analyst Europe, US
William J. AdamsBA, Boston CollegeMBA, University of Maryland
15 5 Director, Portfolio Strategist
Carolyn M. Kedersha, CFA, CPABA, George Washington University; MBA, Rutgers University
29 22 Managing Director, Senior Portfolio Manager Emerging Small Cap, Latin America
C. Warren SkillmanBA, Boston College;MSc, London Business School
17 5 Managing Director, Senior Portfolio Manager Latin America, EMEA, Emerging Asia
Parameswari Roychoudhury, CFABSc, St. Xavier’s College, Kolkata, India;MA, Tufts University
19 19 Director, Senior International Research Analyst Europe, India
Alain L. Chinca, CFABS, Université de Nice; MS, Université de Paris IX;MBA, Babson Graduate School of Business
19 10 Director, Senior Quantitative Analyst
Michelle Y. Chan, CFA BA, University of Hong Kong;MS, Purdue University
19 9 Director, Senior International Research Analyst Asia ex-Japan
Takamune Fujikawa, CFABS, NYU Stern School of Business 16 2 Director, Senior International Research Analyst Japan

LADWP10/13/10
9 *Includes tenure at The Bank of New York Mellon Corporation affiliates.
Research and ManagementIndustry
ExperienceYears at Firm* Title Region/Sector Coverage
Frank J. Goguen, CFABS, Boston College;MBA, Bentley College
15 15 Director, Senior International Research Analyst Japan, Europe, Australia/Global Pharmaceuticals
Ranjit RajamaniB.Com., Loyola College, Madras, India;M.Com., Loyola College, Madras, India;MBA, University of Texas
15 3 Director, Senior International Research Analyst Emerging Asia, Europe/Global Materials & Industrials
Derek M. ThiemeBA, Assumption College;MBA, FW Olin Graduate School
12 10 Director, Senior International Research Analyst Emerging Asia, EMEA
Anthony J. Ryan, CFABSc, University of Sheffield, UK;MSc, Imperial College, London;MBA, Boston College
8 5 Director, Senior International Research Analyst Canada/Global Energy & Technology
Thomas D. Grant, CFABA, Williams College;MBA, MIT Sloan School of Management
10 4 Vice President, International Research Analyst EMEA, Emerging Small Cap
Lawrence R. Curran, JR.BA, Middlebury College 9 9 Vice President, International Research Analyst Latin America, Japan
TradingDavid L. Brooks 19 12 Managing Director, Head of Trading
Cecelia L. Mead 18 6 Vice President, Senior Trader
Elisabeth P. Thayer 13 13 Vice President, Trader
Christopher Dorin 9 2 Vice President, Trader
Ian Johnston, CFA 9 7 Senior Associate, Portfolio Coordinator
EAFE Value Equity: Investment Team continued

LADWP10/13/10
10
Key Contacts
D. Kirk Henry, CFADirector of Non-US Value EquityBNY Mellon Center, Suite 024-0146201 Washington St.Boston, MA 02108-4408(617) [email protected]
Clifford A. Smith, CFAPortfolio ManagementBNY Mellon Center, Suite 024-0146201 Washington St.Boston, MA 02108-4408(617) [email protected]
William C. Jurik, CFAPortfolio ManagementBNY Mellon Center, Suite 024-0146201 Washington St.Boston, MA 02108-4408(617) [email protected]
William J. AdamsPortfolio StrategistBNY Mellon Center, Suite 024-0146201 Washington St.Boston, MA 02108-4408(617) [email protected]
David H. Cameron, CFAPresident & Chief Executive OfficerBNY Mellon Center, Suite 024-0146201 Washington St.Boston, MA 02108-4408(617) [email protected]
John Truschel, CFAChief Investment OfficerBNY Mellon Center, Suite 024-0146201 Washington St.Boston, MA 02108-4408(617) [email protected]
John D. HavensSenior Relationship ManagerBNY Mellon Center, Suite 024-0146201 Washington St.Boston, MA 02108-4408(617) [email protected]
Portfolio Management Relationship ManagementExecutive Management
LADWP10/13/10
11
Investment Process and Discipline

LADWP10/13/10
EAFE Value Equity: Investment Philosophy
12 No investment strategy or risk management technique can guarantee returns or eliminate risk in any market environment.
Risk AwareResearch-DrivenValue-Oriented
We believe successful non-US investing is achieved through a program that is:
We combine traditional measures of value with business momentum
We seek to avoid thevalue trap
We verify our quantitative analysis with bottom-up fundamental security analysis
Preservation of capitalis the key to long-term performance

LADWP10/13/10
How We Select Stocks
13
We buy stocks that exhibit:
Good value characteristics
Strong business fundamentals
Positive business momentum
No investment strategy or risk management technique can guarantee returns or eliminate risk in any market environment.
ValueHow much are we paying?
Prime Candidates
BusinessMomentumIs business getting better?
FundamentalsHow sound is the business?

LADWP10/13/10
Sell Decision
14
We sell stocks that violate any one of the circles:
Full valuation
Deterioration of business health
Negative business momentum
No investment strategy or risk management technique can guarantee returns or eliminate risk in any market environment.
ValueHas the company met its price target?
Business MomentumIs business getting worse?
FundamentalsAre fundamentals deteriorating?
LADWP10/13/10
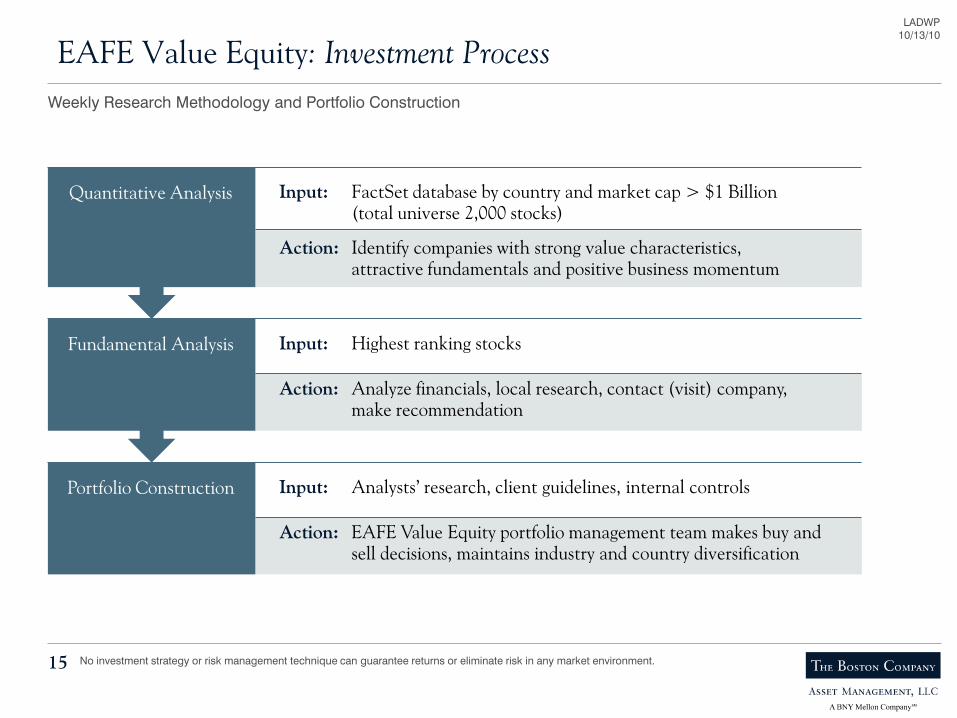
EAFE Value Equity: Investment Process
15
Portfolio Construction
Quantitative Analysis
Input: Highest ranking stocks
Action: Analyze financials, local research, contact (visit) company, make recommendation
Input: Analysts’ research, client guidelines, internal controls
Action: EAFE Value Equity portfolio management team makes buy and sell decisions, maintains industry and country diversification
Fundamental Analysis
Weekly Research Methodology and Portfolio Construction
No investment strategy or risk management technique can guarantee returns or eliminate risk in any market environment.
Input: FactSet database by country and market cap > $1 Billion(total universe 2,000 stocks)
Action: Identify companies with strong value characteristics,attractive fundamentals and positive business momentum

LADWP10/13/10
EAFE Value Equity: Investment Guidelines
16 No investment strategy or risk management technique can guarantee returns or eliminate risk in any market environment.
Risk Controls
Country Diversification Guidelines monitor the country weights Normally, invested in a minimum of 15 countries
Sector Diversification Reviewed by country and total portfolio Generally, a maximum of 10 percentage points above index economic
sector weight
Emerging Markets Exposure None
Normally 100–150 Holdings Reduces stock specific risk
Maximum Investmentin One Stock 5 percent at market at time of purchase
Cash Seek to be fully invested; cash is typically below 5 percent
LADWP10/13/10
17
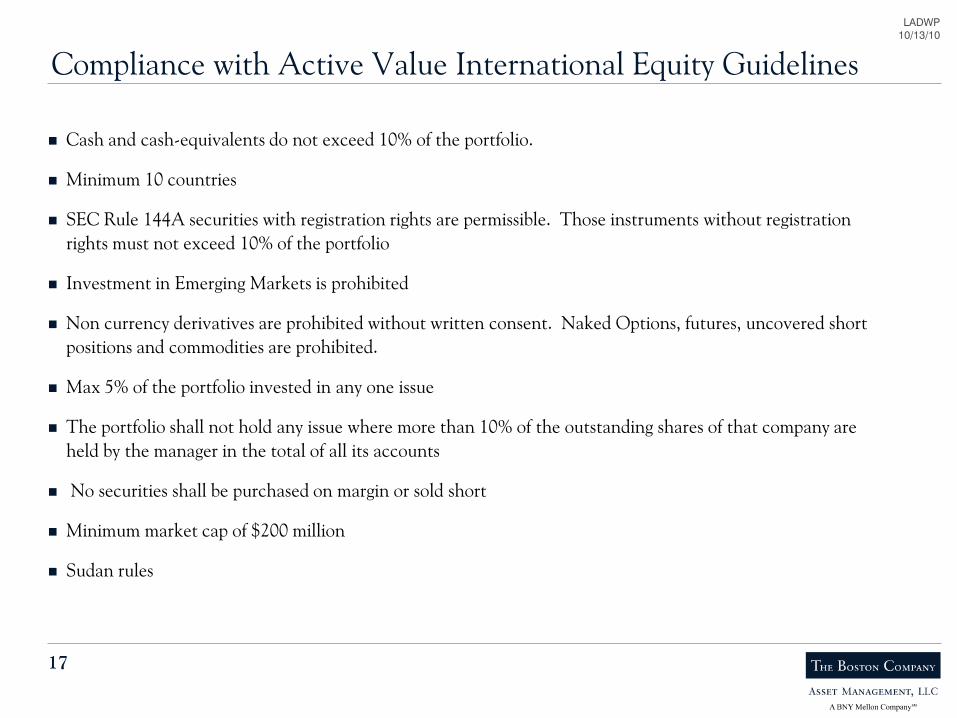
Compliance with Active Value International Equity Guidelines
Cash and cash-equivalents do not exceed 10% of the portfolio.
Minimum 10 countries
SEC Rule 144A securities with registration rights are permissible. Those instruments without registration rights must not exceed 10% of the portfolio
Investment in Emerging Markets is prohibited
Non currency derivatives are prohibited without written consent. Naked Options, futures, uncovered short positions and commodities are prohibited.
Max 5% of the portfolio invested in any one issue
The portfolio shall not hold any issue where more than 10% of the outstanding shares of that company are held by the manager in the total of all its accounts
No securities shall be purchased on margin or sold short
Minimum market cap of $200 million
Sudan rules

LADWP10/13/10
18
Market Overview

LADWP10/13/10
19
2010 Non-US Markets – Investment Environment International markets kicked off the year with some volatility, delivering an admirable return in the first quarter that was dampened
by weaker European currencies. Greece's sovereign debt troubles and a downgrade to Portuguese government bonds caused the euro to slide relative to the US dollar. That said, local performance reacted solidly to a wide range of positive indicators. The European Central Bank announced continued easing of collateral standards to support Greece, which ultimately benefited from further EU and IMF support. The German Ifo survey of business confidence registered 98.1, its highest level since June 2008. In addition, Japan staged the beginnings of a bear market rally. A surge in exports has supported a more optimistic growth forecast and the Bank of Japan (BOJ) resumed quantitative easing to keep pressure off the yen. Most markets were helped by the US Federal Reserve's congressional testimony, which outlined intentions to keep rates low for the foreseeable future. On a sector level, defensive industries in Consumer Staples and Telecommunication Services delivered strong performance, but Technology, long viewed as discretionary, was the top performer. The sector has demonstrated consistent resiliency due to inventory rebuilding and a desire among companies to increase productivity through technology investment. While the markets behaved with some trepidation at the beginning of the second quarter, fears dissipated following more encouraging data that the economy was beginning to turn the corner from recession to recovery. In fact, the global equity market rally that began in early March and continued into May was one of the strongest rebounds since the Great Depression era, with much of the rally centering on higher beta stocks with operational orfinancial leverage.
After a strong rally from early February through mid-April, developed-market equities corrected rather sharply during the secondquarter as a result of a combination of concerns surrounding Europe and China. Europe's ongoing debt problem weighed heavily oninternational equity markets during the period, while US dollar-based losses were compounded by weak currencies, except in Japanwhere the yen rose against the US dollar. The risk trade remained dormant due to several factors, including Europe's tenuous financial situation, tension in the Middle East and Korea, the Gulf of Mexico oil disaster, and weak US job creation. The euro traded at a four-year low against the US dollar, as the Continent's fiscal status remains fragile. Germany introduced a 10-month ban on naked short-selling, as European and US governments made progress in instituting regulations that would limit hedge fund and banking activity. Financial stocks were down on the news. The UK declined on BP's rising risk profile, a pullback in metal stocks, and fragmented election results. Japan also corrected substantially and lost yet another prime minister, who resigned after reneging on a promise to close the US marine base at Okinawa.
No investment strategy or risk management technique can guarantee returns or eliminate risk in any market environment.

LADWP10/13/10
20
2010 Non-US Markets – Investment Environment – cont. International markets rebounded in July 2010 following the European bank stress test, which measured resiliency to a sharp recession
or sovereign debt shock. The banks own sizeable levels of government debt issued by highly geared Greece and Spain. By many accounts, the tests were not severe enough and the surprisingly favorable results misleading. Nevertheless, with only seven banks in imminent need of capital totaling €3.5 billion, investors moved to take long positions in the sector. In addition, the Basel 3 rules on bank capital requirements were softened, adding further support to the sector. The rally also came on the heels of a very week second quarter that brought valuations down to more reasonable levels. A weaker US dollar complemented base currency performance and also helped lift commodity stocks during the period.
Despite a series of M&A announcements during the month of August, developed-market equities pulled back after a short-term rebound in July as a result of renewed fears of a global double-dip recession following weak housing, consumption and industrialproduction figures from the US. In Europe, while Germany managed to post exceptional year-over-year GDP growth driven by their export industries and aided by the weaker euro, peripheral Eurozone countries such as Ireland, Spain and Portugal experienced widening bond spreads versus German bunds. Higher sovereign financing costs may exacerbate the difficulties these countries face during a period of austerity measures. Meanwhile, Japan's surging currency, now trading at its highest level versus the US dollar in nearly two decades, has arrested Japan's fledgling recovery. While the BOJ has hinted they may intervene in currency markets if the yen continues rising at this pace, the market doesn't believe they have the available firepower to make a meaningful dent in thetrend. Until the Fed indicates unwillingness for further quantitative easing measures, the US dollar could remain under pressure.
No investment strategy or risk management technique can guarantee returns or eliminate risk in any market environment.

LADWP10/13/10
21
Portfolio Review/Investment Outlook The World ex-US Value portfolio underperformed its benchmark, the MSCI World ex US Index, during the year-to-date- period
ended August 31, 2010. The Fund returned -8.9% during the period versus -6.5% for the benchmark.
The portfolio was adversely affected by stock selection in several sectors, including Energy, Healthcare, Consumer Discretionary, and Materials. At the same time, the Fund benefited from strong stock selection in Consumer Staples, and a slight underweightposition in the Information Technology. On a country basis, holdings in the United Kingdom, Australia, Canada, and Spain detracted most from results, while stock selection in Japan provided a significant boost to relative returns.
We remain cautious on international equities in the near term. Developed markets, particularly UK, US, and peripheral Europeare still in the midst of deleveraging. Their economies remain fragile, and many are not dominant exporters that could benefit from the healthier dynamics playing out in emerging markets. After the European banks enjoyed a sharp rally in July from depressed levels, investors once again turned their attention to the ongoing risks associated with a global slowdown, austerity measures and the ability of the European banking system to weather another recession. Spreads for peripheral European sovereign bonds have widened once more versus German bunds, calling into question the ability for Europe to service its debt levels in a low or no growth environment. We remain more defensively positioned, with recent additions in healthcare and utilities, where we have increased German exposure. Domestic demand plays in Japan remain undervalued and out of favor. We are monitoring the Japanese real estate sector and have bought a package delivery company. Longer term, the pace of economicand earnings growth across developed countries is expected to be slower than initial post-recession estimates. This scenario should favor companies with defensive market positions, stable top line growth, and reasonable valuations.
No investment strategy or risk management technique can guarantee returns or eliminate risk in any market environment.

LADWP10/13/10
22
Performance Review

LADWP10/13/10
23
Explanation of Mandate
Investment Management Style & Investment Process
Investment Objective
Mandate Size & Account Type
The Boston Company’s World ex-US Value Equity Management mandate is an active strategy which is value orientated in style.
The strategy seeks to add value through stock selection. Stocks are selected based upon research done by our in-house investment professionals. Our research focus is on bottom up fundamental analysis.
We seek stocks with compelling combination of: Valuation, Fundamentals and Business Momentum.
Our goal is to exceed the return on the MSCI World ex-US IMI over a full market cycle
LADWP is invested in our World ex-US Value Equity Management strategy in two separately managed accounts, one for the Retirement Fund and the other for the Retiree Health Benefits Fund.
As of August 31, 2010 total World ex-US Value assets managed for LADWP were $347,399,162.
As of August 31, 2010 total assets managed for the World ex-US Value Equity Management strategy across all Clients were $1.4B.
No investment strategy or risk management technique can guarantee returns or eliminate risk in any market environment.

LADWP10/13/10
24
Investment Objective
The Boston Company Asset Management, LLC’s investment objective for the Los Angeles Water & Power Employees’ Retirement Plan World ex-US Value portfolio is to outperform the MSCI World ex-US IMI over a full market cycle.
No investment strategy or risk management technique can guarantee returns or eliminate risk in any market environment.

LADWP10/13/10
25
Investment Performance – Employees’ Retirement PlanAs of August 31, 2010
Returns for periods greater than one year are annualized.Past performance is not a guarantee for future performance.The information shown above is supplemental to a fully compliant GIPS presentation that can be found at the end of this book along with other important disclosures.
-15.0
-10.0
-5.0
0.0
5.0
10.0
15.0
20.0
Three Months YTD One Year Three Years Five YearsSince Inception (3/7/05)
Total Portfolio(Gross of fees) 1.04 -8.91 -3.49 -7.82 1.59 1.25
Total Portfolio(Net of fees) 0.94 -9.15 -3.88 -8.20 1.19 0.91
MSCI World ex-US IMI (Net) 4.48 -6.53 -0.36 -9.84 1.63 1.86
Percent
Current Portfolio
Market Value:
$290,323,916
Market Value
At Inception:
$270,000,000
LADWP10/13/10
26
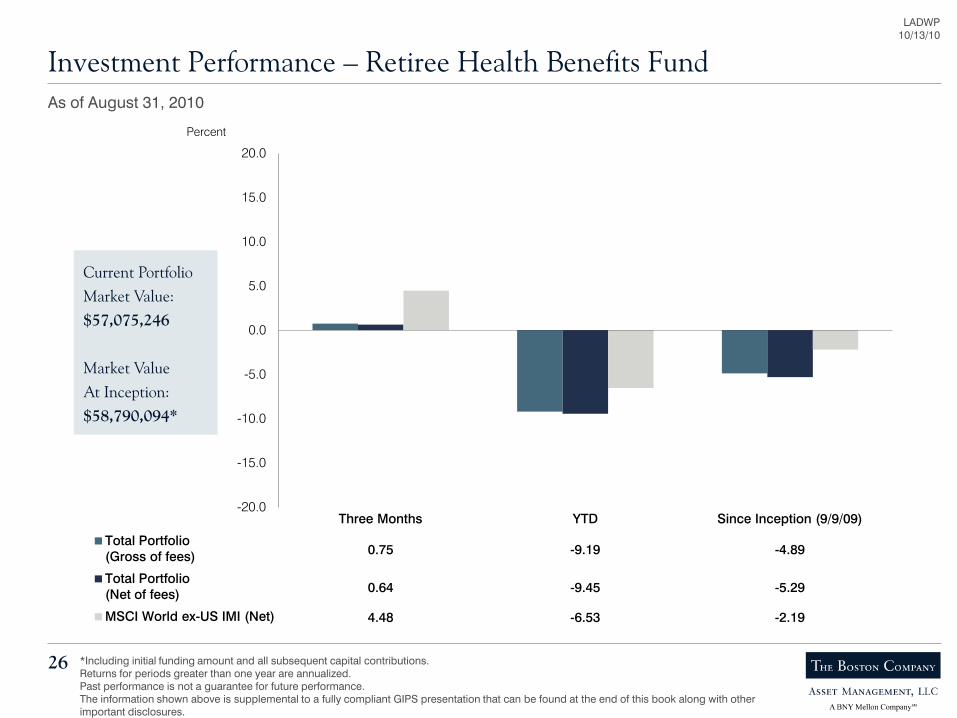
Investment Performance – Retiree Health Benefits FundAs of August 31, 2010
*Including initial funding amount and all subsequent capital contributions.Returns for periods greater than one year are annualized.Past performance is not a guarantee for future performance.The information shown above is supplemental to a fully compliant GIPS presentation that can be found at the end of this book along with other important disclosures.
-20.0
-15.0
-10.0
-5.0
0.0
5.0
10.0
15.0
20.0
Three Months YTD Since Inception (9/9/09)
Total Portfolio(Gross of fees) 0.75 -9.19 -4.89
Total Portfolio(Net of fees) 0.64 -9.45 -5.29
MSCI World ex-US IMI (Net) 4.48 -6.53 -2.19
Percent
Current Portfolio
Market Value:
$57,075,246
Market Value
At Inception:
$58,790,094*
LADWP10/13/10
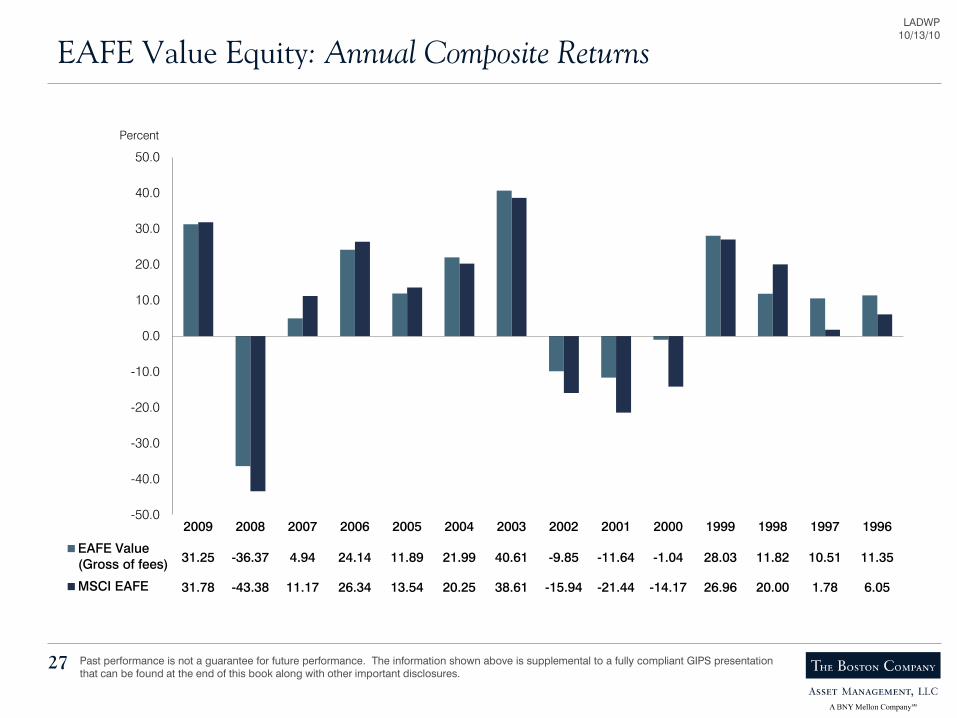
EAFE Value Equity: Annual Composite Returns
27 Past performance is not a guarantee for future performance. The information shown above is supplemental to a fully compliant GIPS presentationthat can be found at the end of this book along with other important disclosures.
-50.0
-40.0
-30.0
-20.0
-10.0
0.0
10.0
20.0
30.0
40.0
50.0
2009 2008 2007 2006 2005 2004 2003 2002 2001 2000 1999 1998 1997 1996
EAFE Value(Gross of fees) 31.25 -36.37 4.94 24.14 11.89 21.99 40.61 -9.85 -11.64 -1.04 28.03 11.82 10.51 11.35
MSCI EAFE 31.78 -43.38 11.17 26.34 13.54 20.25 38.61 -15.94 -21.44 -14.17 26.96 20.00 1.78 6.05
Percent

LADWP10/13/10
Country Attribution
28
Australia 4.6% -2.8% -0.3% 7.5% 7.8% 0.4% -2.9% -10.6% -0.7% -0.3% -0.7% 0.3% -0.7%Austria 0.0 0.0 0.0 0.4 -11.1 0.0 -0.4 11.1 0.0 0.0 0.0 0.0 0.0Belgium 0.0 0.0 0.0 0.9 1.2 0.0 -0.9 -1.2 0.0 0.0 0.0 0.0 0.0Canada 7.7 6.1 0.4 9.8 15.2 1.4 -2.0 -9.1 -1.0 -0.2 -0.8 0.2 -0.8Denmark 0.0 0.0 0.0 0.9 5.7 0.0 -0.9 -5.7 0.0 0.0 0.0 0.0 0.0Finland 2.6 -28.8 -0.7 1.1 -7.8 -0.1 1.5 -20.9 -0.6 0.0 -0.2 -0.3 -0.6France 12.4 -10.9 -1.1 8.5 -10.2 -0.7 3.8 -0.7 -0.4 -0.3 -0.1 0.0 -0.4Germany 7.0 -5.4 -0.1 6.9 -4.3 -0.2 0.1 -1.1 0.2 0.0 -0.1 0.0 0.0Greece 0.3 -30.4 -0.1 0.5 -45.7 -0.2 -0.1 15.4 0.1 0.0 0.1 0.0 0.1Hong Kong 2.5 18.5 0.3 2.2 17.4 0.3 0.3 1.1 0.0 0.1 0.0 0.0 0.1Ireland 0.0 0.0 0.0 0.3 -28.8 -0.1 -0.3 28.8 0.1 0.1 0.0 0.0 0.1Israel 0.1 -10.7 0.0 0.2 -2.4 0.0 -0.1 -8.3 0.0 0.1 0.0 0.0 0.1Italy 3.0 -34.5 -1.1 2.9 -19.6 -0.5 0.2 -14.9 -0.6 0.0 -0.5 -0.1 -0.6Japan 23.4 -6.1 -1.9 20.3 -5.9 -1.9 3.0 -0.1 0.0 0.0 -0.1 0.0 -0.1Luxembourg 0.0 0.0 0.0 0.5 -1.4 0.0 -0.5 1.4 0.0 0.0 0.0 0.0 0.0Netherlands 0.6 -14.9 -0.1 2.4 -1.6 0.0 -1.8 -13.3 0.0 0.0 -0.2 0.2 0.0New Zealand 0.0 0.0 0.0 0.1 -1.1 0.0 -0.1 1.1 0.0 0.0 0.0 0.0 0.0Norway 0.3 -31.8 -0.1 0.9 10.7 0.1 -0.6 -42.5 -0.2 -0.1 -0.2 0.1 -0.2Portugal 0.0 0.0 0.0 0.3 -13.2 0.0 -0.3 13.2 0.0 0.0 0.0 0.0 0.0Singapore 2.4 20.8 0.4 1.4 24.3 0.3 1.0 -3.5 0.1 0.2 0.0 0.0 0.1Spain 1.4 -39.2 -0.8 3.5 -17.7 -0.5 -2.1 -21.5 -0.3 0.3 -0.9 0.4 -0.2Sweden 1.5 8.0 0.1 2.6 10.3 0.3 -1.0 -2.2 -0.2 -0.1 -0.1 0.0 -0.1Switzerland 6.3 13.6 0.8 6.7 6.7 0.5 -0.3 6.9 0.3 -0.1 0.4 0.0 0.3United Kingdom 21.1 0.3 0.4 19.1 3.9 0.8 2.0 -3.7 -0.4 0.1 -0.7 0.0 -0.6Cash 2.6 -1.1 0.0 0.0 0.0 0.0 2.6 -1.1 0.0 0.0 0.0 0.0 0.0
Total 100.0% -3.8% -3.8% 100.0% -0.4% -0.4% 0.0% -3.5% -3.5% 0.0% -4.2% 0.7% -3.5%
Attribution AnalysisLADWP
September 1, 2009 – August 31, 2010
CountrySelection
EffectTotalEffect
InteractionEffect
PercentContribution
vs. IndexAllocation
Effect
RelativeWeight
vs. IndexExcessReturn
Return byCountry
PercentContribution
AverageCountryWeight
Return byCountry
PercentContribution
AverageCountryWeight
MSCI World ex-US IMI Variance
Performance history of less than two years may not provide an adequate basis from which to determine the performance of a strategy. Past performance ofsuch a strategy is not a guarantee of any future results. The information shown above is supplemental to a fully compliant GIPS presentation that can be found atthe end of this book along with other important disclosures. No investment strategy or risk management technique can guarantee returns or eliminate risk in anymarket environment.

LADWP10/13/10
Sector Attribution
29
Cons Discretionary 8.6% -4.4% -0.5% 10.1% 2.8% 0.1% -1.5% -7.2% -0.6% 0.0% -0.7% 0.1% -0.7%Consumer Staples 9.6 9.5 0.9 8.9 11.7 1.0 0.7 -2.1 -0.1 0.1 -0.2 0.0 -0.1Energy 11.0 -10.9 -1.3 9.5 -3.6 -0.3 1.6 -7.3 -1.0 -0.1 -0.7 -0.1 -0.9Financials 23.9 -9.4 -2.4 25.3 -9.1 -2.2 -1.5 -0.2 -0.2 0.2 -0.3 0.0 -0.1Health Care 10.2 -2.4 0.0 7.4 1.6 0.1 2.8 -3.9 -0.2 0.1 -0.2 0.0 -0.2Industrials 9.4 0.5 -0.1 12.5 3.4 0.3 -3.2 -2.9 -0.3 -0.1 -0.4 0.1 -0.4Information Technology 5.4 -14.7 -0.5 5.2 -7.1 -0.5 0.2 -7.6 0.0 0.2 -0.4 0.1 0.0Materials 8.2 1.7 0.2 11.1 9.8 1.0 -2.9 -8.1 -0.8 -0.2 -0.9 0.3 -0.8Telecom Services 4.8 2.6 0.2 4.9 5.0 0.3 -0.1 -2.4 -0.1 0.0 -0.1 0.0 -0.2Utilities 6.3 -8.1 -0.5 4.9 -6.4 -0.3 1.4 -1.8 -0.2 -0.1 0.0 0.0 -0.2Cash 2.6 -1.1 0.0 0.0 0.0 0.0 2.6 -1.1 0.0 0.0 0.0 0.0 0.0
Total 100.0% -3.8% -3.8% 100.0% -0.4% -0.4% 0.0% -3.5% -3.5% 0.0% -3.7% 0.2% -3.5%
Attribution Analysis
SectorSelection
EffectTotalEffect
InteractionEffect
PercentContribution
vs. IndexAllocation
Effect
RelativeWeight
vs. IndexExcessReturn
Return bySector
PercentContribution
AverageSectorWeight
Return bySector
PercentContribution
AverageSectorWeight
MSCI World ex-US IMI VarianceLADWP
Performance history of less than two years may not provide an adequate basis from which to determine the performance of a strategy. Past performance ofsuch a strategy is not a guarantee of any future results. The information shown above is supplemental to a fully compliant GIPS presentation that can be found atthe end of this book along with other important disclosures. No investment strategy or risk management technique can guarantee returns or eliminate risk in anymarket environment.
September 1, 2009 – August 31, 2010

LADWP10/13/10
Performance Attribution Analysis
30
Individual Stock Contributors to Equity Return — September 1, 2009 – August 31, 2010
LADWP
Added Value
Novartis AG 0.4% 15.9% 2.5%Vodafone Group PLC 0.4 18.5 1.6DBS Group Holdings Ltd. 0.3 21.5 1.9Canadian Imperial Bank of Comm. 0.3 20.6 1.0Centrica PLC 0.2 29.7 0.0Anglo American PLC 0.2 9.9 1.4Nestle S.A. 0.2 26.0 0.0BOC Hong Kong (Holdings) Ltd. 0.2 16.8 0.0Loblaw Cos. Ltd. 0.2 39.1 0.0Barrick Gold Corp. 0.2 28.1 0.4
2.6% 8.8%
Ending Weight
PercentContribution
StockReturn
Subtracted Value
Nokia Corp. -0.7% -36.3% 2.0%Nufarm Ltd. -0.6 -58.5 0.6Manulife Financial Corp. -0.5 -44.5 1.0BP PLC -0.5 -31.2 1.3Gamesa Corporacion Tecnolog. -0.5 -61.7 0.6Resolution Ltd. -0.5 -35.7 1.5E.ON AG -0.4 -30.4 1.3Sumitomo Mitsui Financial Group -0.4 -29.0 1.2Societe Generale S.A. (France) -0.4 -32.8 1.3Saras S.p.A. -0.3 -49.5 1.2
-4.8% 12.0%
Ending Weight
PercentContribution
StockReturn
Stock returns represent in-portfolio holdings. Performance history of less than two years may not provide an adequate basis from which to determine the performanceof a strategy. Past performance of such a strategy is not a guarantee of any future results. The information shown above is supplemental to a fully compliant GIPSpresentation that can be found at the end of this book along with other important disclosures. It should not be assumed that securities identified were or will beprofitable or that decisions we make in the future will be profitable. Certain securities may not remain in the portfolio at the time that you receive this report. A full list ofholdings is available upon request. No investment strategy or risk management technique can guarantee returns or eliminate risk in any market environment.
Added ValueEnding Weight
PercentContribution
StockReturn
Subtracted ValueEnding Weight
PercentContribution
StockReturn
MSCI World ex-US IMI
Nestle S.A. 0.3% 27.2% 1.5%Vodafone Group PLC 0.2 18.5 1.1Rio Tinto PLC 0.2 31.2 0.6Potash Corp. of Saskatchewan 0.1 66.9 0.4Novartis AG 0.1 15.9 0.9Barrick Gold Corp. 0.1 37.4 0.4British American Tobacco PLC 0.1 16.8 0.6Novo Nordisk A/S 0.1 42.7 0.3Standard Chartered PLC 0.1 21.2 0.5Commonwealth Bank of Australia 0.1 22.2 0.6
1.4% 6.9%
BP PLC -0.4% -31.2% 0.9%Toyota Motor Corp. -0.2 -19.9 0.8E.ON AG -0.2 -30.4 0.4Banco Santander S.A. -0.1 -20.0 0.8Mitsubishi UFJ Financial Group -0.1 -23.7 0.5Nokia Corp. -0.1 -36.3 0.3Banco Bilbao Vizcaya Argentaria -0.1 -29.9 0.4Research In Motion Ltd. -0.1 -41.4 0.2UniCredit S.p.A. -0.1 -31.2 0.3Roche Holding AG -0.1 -12.7 0.8
-1.5% 5.4%

LADWP10/13/10
31
World ex-US Value Equity: Valuation Factors Out of Favor3 months, ending August 31, 2010
* Average returns of the bottom two quintiles (least expensive) of the MSCI World ex US Index compared to the returns of the MSCI World ex US index. ISource: MSCI, FactsetNote: The MSCI World ex US Index is a free float-adjusted market capitalization weighted index that is designed to measure the equity marketperformance of developed markets. As of May 27, 2010 the MSCI World Index consisted of the following 23 developed market country indices: Australia,Austria, Belgium, Canada, Denmark, Finland, France, Germany, Greece, Hong Kong, Ireland, Israel, Italy, Japan, Netherlands, New Zealand, Norway,Portugal, Singapore, Spain, Sweden, Switzerland, and the United Kingdom . 736
*Returns (Annualized)through 8/31/10 Last 3 Months Full Market Cycle
(1989-2010)Head Wind
Price/Earnings (FY1 & FY2) (0.44) 0.42 (0.86)
Price/Book (1.91) 0.21 (2.12)
Price/Cash Flow (1.89) 0.34 (2.23)

LADWP10/13/10
32
World ex-US Value Equity: Price PerformanceSeptember 23, 2009 – September 23, 2010
Source: MSCI, Factset, TBCAM
745
Sep-10 Refining Complexity
Valuation EBIT Margin
PE 2011 PE 2012 P/B EV/Capacity 2010 2011 IBES 2011 IBES
Saras 10 9.3x 6.7x 1.0x 8.5x 1% 3% 4%
S Oil 6 9.9x 8.3x 1.9x 14.0x 3% 4% 4%
40.00
50.00
60.00
70.00
80.00
90.00
100.00
110.00
120.00
130.00
Inde
xed
Pric
e P
erfo
rman
ce (
Loca
l Cur
renc
y)
-2.0%
0.0%
2.0%
4.0%
6.0%
8.0%
10.0%
12.0%
14.0%
EB
IT M
argi
n %
Saras S oil

LADWP10/13/10
Country Attribution
33
Australia 3.5% -6.5% -0.4% 6.5% -4.6% -0.2% -3.0% -1.8% -0.3% -0.3% -0.1% 0.0% -0.3%Austria 0.0 0.0 0.0 0.5 -20.8 -0.1 -0.5 14.6 0.1 0.1 0.0 0.0 0.1Belgium 0.3 3.7 0.0 1.0 -21.0 -0.2 -0.6 17.5 0.1 -0.1 0.3 0.0 0.3Canada 5.6 -4.9 0.4 9.0 -2.4 0.1 -3.3 -2.4 0.3 -0.1 0.2 -0.2 -0.1Denmark 0.0 0.0 0.0 0.9 -9.2 -0.1 -0.9 7.8 0.1 0.0 0.0 0.0 0.0Finland 2.2 -27.4 -0.6 1.3 -19.8 -0.2 0.9 -4.7 -0.3 -0.1 -0.1 -0.1 -0.3France 11.0 -9.4 -0.4 8.9 -13.7 -1.1 2.1 3.3 0.7 -0.1 0.5 -0.1 0.3Germany 8.9 -7.7 -0.6 7.4 -11.8 -0.8 1.5 3.3 0.1 0.1 0.4 0.0 0.5Greece 1.1 -18.6 0.3 0.6 -33.1 -0.2 0.5 7.5 0.5 -0.1 0.1 0.5 0.6Hong Kong 2.6 5.1 0.0 2.1 -0.2 0.1 0.5 5.3 -0.1 0.0 0.1 0.0 0.1Ireland 0.1 -31.2 0.0 0.5 -35.5 -0.2 -0.4 1.9 0.1 0.1 -0.1 0.0 0.1Israel 0.0 -3.7 0.0 0.1 -0.8 0.0 0.0 -2.8 0.0 0.0 0.0 0.0 0.0Italy 4.1 -29.4 -1.5 3.2 -20.5 -0.7 0.9 -5.3 -0.7 0.0 -0.4 0.0 -0.4Japan 23.1 -7.8 -2.6 20.9 -10.1 -2.9 2.3 1.9 0.3 0.2 0.5 -0.2 0.5Luxembourg 0.0 0.0 0.0 0.3 -0.9 0.1 -0.3 0.9 -0.1 -0.1 0.0 0.0 -0.1Netherlands 1.3 -27.6 -0.4 2.4 -11.0 -0.3 -1.1 -12.3 -0.2 0.0 -0.3 0.0 -0.2New Zealand 0.0 0.0 0.0 0.1 -9.9 0.0 -0.1 8.2 0.0 0.0 0.0 0.0 0.0Norway 0.1 -12.0 0.0 0.9 -12.3 -0.1 -0.8 0.3 0.1 0.0 -0.1 0.0 0.0Portugal 0.0 0.0 0.0 0.3 -15.6 0.0 -0.3 11.8 0.0 0.0 0.0 0.0 0.0Singapore 1.9 1.8 0.2 1.2 1.9 0.1 0.7 0.0 0.1 0.1 0.0 0.0 0.1Spain 1.0 -19.9 -0.3 3.7 -10.0 -0.2 -2.7 -7.8 -0.1 -0.1 -0.2 0.1 -0.3Sweden 1.4 -11.6 -0.2 2.3 -7.2 0.1 -0.9 -3.7 -0.2 -0.1 0.0 0.0 -0.2Switzerland 7.4 -0.5 0.0 6.6 -4.4 -0.3 0.8 3.5 0.2 0.0 0.3 0.0 0.3United Kingdom 21.2 -10.3 -1.4 19.3 -11.0 -1.9 1.9 0.6 0.4 0.1 0.2 0.0 0.3Cash 3.1 1.9 0.0 0.0 0.0 0.0 3.1 1.9 0.0 0.4 0.0 0.0 0.4
Total 100.0% -8.2% -8.2% 100.0% -9.9% -9.9% 0.0% 1.3% 1.3% 0.0% 1.3% 0.0% 1.3%
Attribution AnalysisLADWP
September 1, 2007 – August 31, 2010
CountrySelection
EffectTotalEffect
InteractionEffect
PercentContribution
vs. IndexAllocation
Effect
RelativeWeight
vs. IndexExcessReturn
Return byCountry
PercentContribution
AverageCountryWeight
Return byCountry
PercentContribution
AverageCountryWeight
MSCI World ex-US IMI Variance
Performance history of less than two years may not provide an adequate basis from which to determine the performance of a strategy. Past performance ofsuch a strategy is not a guarantee of any future results. The information shown above is supplemental to a fully compliant GIPS presentation that can be found atthe end of this book along with other important disclosures. No investment strategy or risk management technique can guarantee returns or eliminate risk in anymarket environment.

LADWP10/13/10
Sector Attribution
34
Cons Discretionary 10.1% -11.3% -1.5% 10.1% -9.8% -0.6% 0.1% -1.2% -0.8% 0.0% -0.1% -0.2% -0.3%Consumer Staples 10.4 1.4 0.4 8.4 -0.9 0.0 2.0 2.3 0.4 0.2 0.3 0.1 0.5Energy 11.0 -8.6 -0.5 9.6 -7.8 -0.5 1.4 -0.7 -0.1 0.1 0.0 -0.1 0.0Financials 23.4 -17.0 -4.6 25.0 -16.5 -4.6 -1.7 -0.3 -0.1 0.2 -0.2 -0.2 -0.2Health Care 9.8 -3.9 -0.4 7.3 -4.0 -0.5 2.5 0.2 0.2 0.0 0.1 0.0 0.1Industrials 9.3 -6.7 -0.7 12.3 -10.2 -1.0 -3.0 2.9 0.3 0.0 0.4 -0.1 0.2Information Technology 4.8 -16.8 -0.3 5.4 -15.2 -0.8 -0.7 -1.2 0.4 0.1 0.0 0.0 0.2Materials 7.2 -1.4 0.0 10.4 -6.1 -0.2 -3.2 4.2 0.2 -0.1 0.5 -0.3 0.1Telecom Services 5.3 -7.0 -0.4 5.2 -4.3 -0.2 0.1 -2.5 -0.2 0.0 -0.1 0.0 -0.1Utilities 5.5 -0.5 0.2 5.3 -9.0 -0.7 0.1 7.2 0.9 -0.1 0.7 -0.1 0.5Cash 3.1 1.9 0.0 0.0 0.0 0.0 3.1 1.9 0.0 0.4 0.0 0.0 0.4
Total 100.0% -8.2% -8.2% 100.0% -9.9% -9.9% 0.0% 1.3% 1.3% 0.6% 1.9% -1.3% 1.3%
Attribution Analysis
SectorSelection
EffectTotalEffect
InteractionEffect
PercentContribution
vs. IndexAllocation
Effect
RelativeWeight
vs. IndexExcessReturn
Return bySector
PercentContribution
AverageSectorWeight
Return bySector
PercentContribution
AverageSectorWeight
MSCI World ex-US IMI VarianceLADWP
Performance history of less than two years may not provide an adequate basis from which to determine the performance of a strategy. Past performance ofsuch a strategy is not a guarantee of any future results. The information shown above is supplemental to a fully compliant GIPS presentation that can be found atthe end of this book along with other important disclosures. No investment strategy or risk management technique can guarantee returns or eliminate risk in anymarket environment.
September 1, 2007 – August 31, 2010

LADWP10/13/10
35
Country Weights and Portfolio Structure

LADWP10/13/10
36
Country Weights
Europe
Austria 0.0% 0.4%Belgium 0.0 0.9Denmark 0.0 1.0Finland 2.4 1.0France 12.5 7.9Germany 6.7 6.6Greece 0.0 0.3Ireland 0.0 0.3Italy 3.9 2.5Luxembourg 0.0 0.4Netherlands 0.5 2.3Norway 0.8 0.8Portugal 0.0 0.3Spain 1.3 3.1Sweden 1.4 2.6Switzerland 5.1 6.9United Kingdom 19.3 19.3
Total 53.9% 56.6%
Asia/Pacific
Australia 4.4% 7.5%Hong Kong 3.3 2.4Japan 24.9 20.5New Zealand 0.0 0.1Singapore 2.5 1.5
Total 35.1% 32.0%
The information shown above is supplemental to a fully compliant GIPS presentation that can be found at the end of this book along with other important disclosures. No investment strategy or risk management technique can guarantee returns or eliminate risk in any market environment.
As of August 31, 2009
Canada 7.6% 10.3%
Total 7.6% 10.3%
LADWP
North AmericaMSCI World
ex-US IMI
LADWP
LADWP
MSCI World ex-US IMI
MSCI World ex-US IMI
Israel 0.7% 0.8%
Total 0.7% 0.8%
Middle East/Africa
LADWP
Middle East/AfricaMSCI World
ex-US IMI
LADWP10/13/10
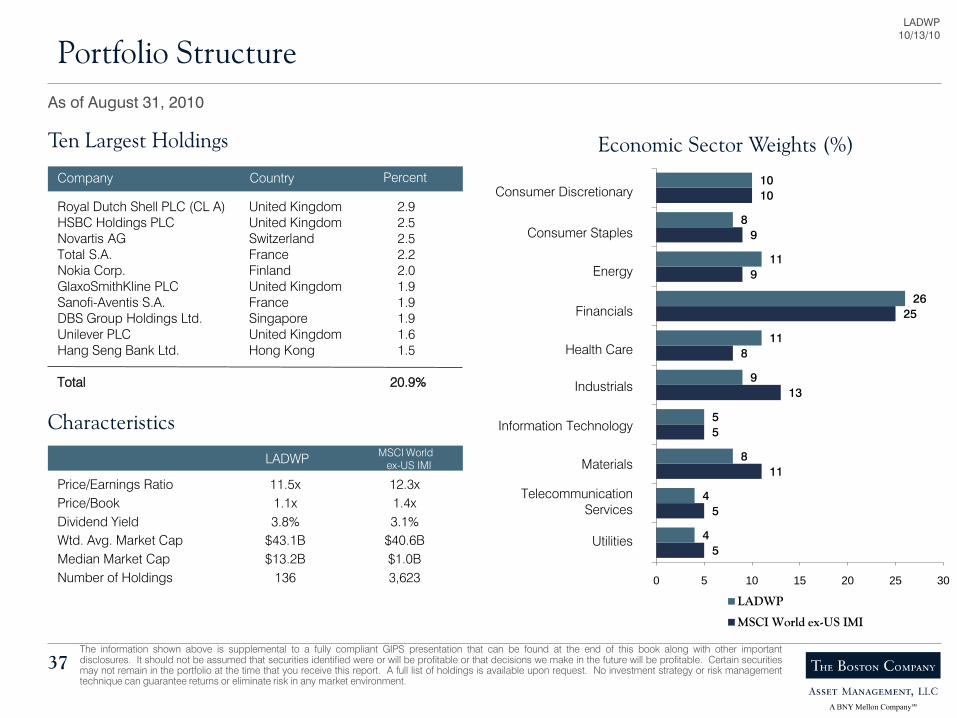
Portfolio Structure
37
5
5
11
5
13
8
25
9
9
10
4
4
8
5
9
11
26
11
8
10
0 5 10 15 20 25 30
LADWP
MSCI World ex-US IMI
Ten Largest Holdings
Company Country
Royal Dutch Shell PLC (CL A) United Kingdom 2.9HSBC Holdings PLC United Kingdom 2.5Novartis AG Switzerland 2.5Total S.A. France 2.2Nokia Corp. Finland 2.0GlaxoSmithKline PLC United Kingdom 1.9Sanofi-Aventis S.A. France 1.9DBS Group Holdings Ltd. Singapore 1.9Unilever PLC United Kingdom 1.6Hang Seng Bank Ltd. Hong Kong 1.5
Total 20.9%
Percent
Characteristics
LADWP
Price/Earnings Ratio 11.5x 12.3xPrice/Book 1.1x 1.4xDividend Yield 3.8% 3.1%Wtd. Avg. Market Cap $43.1B $40.6BMedian Market Cap $13.2B $1.0BNumber of Holdings 136 3,623
MSCI World ex-US IMI
Economic Sector Weights (%)
Consumer Discretionary
Consumer Staples
Energy
Financials
Health Care
Industrials
Information Technology
Materials
TelecommunicationServices
Utilities
The information shown above is supplemental to a fully compliant GIPS presentation that can be found at the end of this book along with other importantdisclosures. It should not be assumed that securities identified were or will be profitable or that decisions we make in the future will be profitable. Certain securitiesmay not remain in the portfolio at the time that you receive this report. A full list of holdings is available upon request. No investment strategy or risk managementtechnique can guarantee returns or eliminate risk in any market environment.
As of August 31, 2010

LADWP10/13/10
38
Portfolio Holdings, Fees, Disclosures & Exhibits
LADWP10/13/10
39
Los Angeles Department of Water & Power Fee Schedule
43 Basis Points on the First $250 Million
26 Basis Points Thereafter

LADWP10/13/10
Portfolio Holdings by Country
40
Asia/Pacific 35.1%Australia 4.4%
BlueScope Steel Ltd. 0.3Foster's Group Ltd. 0.7Insurance Australia Group Ltd. 0.7National Australia Bank Ltd. 1.1Nufarm Ltd. 0.6Primary Health Care Ltd. 0.5QBE Insurance Group Ltd. 0.5
Hong Kong 3.3%Esprit Holdings Ltd. 0.7Hang Seng Bank Ltd. 1.5Hutchison Whampoa Ltd. 0.9Techtronic Industries Co. Ltd. 0.1
Japan 24.9%Astellas Pharma Inc. 0.6Bridgestone Corp. 0.6Chuo Mitsui Trust Holdings Inc. 1.2Coca-Cola West Co. Ltd. 0.2Credit Saison Co. Ltd. 0.4Daiwa House Industry Co. Ltd. 0.8East Japan Railway Co. 1.0Inpex Corp. 0.7Kao Corp. 0.4KDDI Corp. 1.3Matsumotokiyoshi Holdings Co. Ltd. 0.6Medipal Holdings Corp. 0.4Mitsubishi Chemical Holdings Corp. 0.5Mitsubishi Gas Chemical Co. Inc. 0.6Mitsubishi UFJ Financial Group Inc. 1.4Murata Manufacturing Co. Ltd. 0.2NEC Corp. 0.4Nintendo Co. Ltd. 0.3Nippon Express Co. Ltd. 0.2Nomura Holdings Inc. 0.6Nomura Research Institute Ltd. 0.6Panasonic Corp. 0.7Rengo Co. Ltd. 0.5Ricoh Co. Ltd. 0.4Ryohin Keikaku Co. Ltd. 0.7Sankyo Co. Ltd. 0.5Secom Co. Ltd. 0.7Seven & I Holdings Co. Ltd. 1.2Shimachu Co. Ltd. 0.6Shimizu Corp. 0.6Shin-Etsu Chemical Co. Ltd. 0.6
Japan (continued)Sumitomo Corp. 0.2%Sumitomo Mitsui Financial Group Inc. 1.2Tokyo Electron Ltd. 0.5Tokyo Steel Manufacturing Co. Ltd. 0.8Toyoda Gosei Co. Ltd. 0.6Toyota Motor Corp. 1.1Trend Micro Inc. 0.1Ushio Inc. 0.5Yamato Holdings Co. Ltd. 0.4
Singapore 2.5%DBS Group Holdings Ltd. 1.9United Overseas Bank Ltd. 0.7
Europe 53.9%Finland 2.4%
Nokia Corp. 2.0UPM-Kymmene Oyj 0.4
France 12.5%Carrefour S.A. 1.0Credit Agricole S.A. 0.6Danone S.A. 0.7European Aeronautic Defence & Space 0.8France Telecom 1.1GDF Suez S.A. 1.2Lagardere S.C.A. 0.4Peugeot S.A. 0.3Sanofi-Aventis S.A. 1.9Societe Generale S.A. (France) 1.3Total S.A. 0.9Total S.A. ADS 1.2Vivendi S.A. 1.0
Germany 6.7%Allianz SE 0.6Bayer AG 0.8Celesio AG 0.4Daimler AG 0.6Deutsche Lufthansa AG 0.5Deutsche Telekom AG 0.3E.ON AG 1.3Muenchener Rueckversicherungs-Gesell 0.8RWE AG 0.5Siemens AG 0.7
Italy 3.9%Banco Popolare S.C. 0.2Buzzi Unicem S.p.A. 0.3ENI S.p.A. 0.5Finmeccanica S.p.A. 0.9Parmalat S.p.A. 0.3Saras S.p.A. 1.2Unipol Gruppo Finanziario S.p.A. 0.5
Netherlands 0.5%Aegon N.V. 0.5
Norway 0.8%Norsk Hydro ASA 0.8
Spain 1.3%Gamesa Corporacion Tecnologica S.A. 0.6Iberdrola S.A. 0.7
Sweden 1.4%Ericsson Sh B 0.7Investor AB 0.7
Switzerland 5.1%Clariant AG 0.4Novartis AG 2.5Roche Holding AG 1.2UBS AG 1.0
United Kingdom 19.3%Anglo American PLC 1.4BAE Systems PLC 0.7BP PLC 1.3Drax Group PLC 0.7GlaxoSmithKline PLC 1.9Home Retail Group PLC 0.7HSBC Holdings PLC 2.5Lonmin PLC 0.1QinetiQ Group PLC 0.4Reed Elsevier PLC 0.6Resolution Ltd. 1.5Rexam PLC 0.7Royal Dutch Shell PLC (CL A) 1.8Royal Dutch Shell PLC (CL A) 1.1Tesco PLC 0.4Unilever PLC 1.6Vodafone Group PLC 1.5Wellstream Holdings PLC 0.4
Middle East/Africa 0.7%Israel 0.7%
Teva Pharmaceutical Industries Ltd. 0.7
North America 7.6%Canada 7.6%
Barrick Gold Corp. 0.4Canadian Imperial Bank of Commerce 1.0EnCana Corp. 0.6Husky Energy Inc. 0.6Manulife Financial Corp. 1.0National Bank of Canada 0.6RONA inc. 0.5Shoppers Drug Mart Corp. 0.4Suncor Energy Inc. 0.9TMX Group Inc. 0.6Viterra Inc. 0.7
Cash 2.7%
The information shown above is supplemental to a fully compliant GIPS presentation that can be found at the end of this book along with other importantdisclosures. It should not be assumed that securities identified were or will be profitable or that decisions we make in the future will be profitable. Certainsecurities may not remain in the portfolio at the time that you receive this report. No investment strategy or risk management technique can guarantee returns oreliminate risk in any market environment.
As of August 31, 2010

LADWP10/13/10
Portfolio Holdings by Sector
41
Consumer Discretionary 10.0%Bridgestone Corp. 0.6Daimler AG 0.6Esprit Holdings Ltd. 0.7Home Retail Group PLC 0.7Lagardere S.C.A. 0.4Panasonic Corp. 0.7Peugeot S.A. 0.3Reed Elsevier PLC 0.6RONA inc. 0.5Ryohin Keikaku Co. Ltd. 0.7Sankyo Co. Ltd. 0.5Shimachu Co. Ltd. 0.6Techtronic Industries Co. Ltd. 0.1Toyoda Gosei Co. Ltd. 0.6Toyota Motor Corp. 1.1Vivendi S.A. 1.0
Consumer Staples 8.3%Carrefour S.A. 1.0Coca-Cola West Co. Ltd. 0.2Danone S.A. 0.7Foster's Group Ltd. 0.7Kao Corp. 0.4Matsumotokiyoshi Holdings Co. Ltd. 0.6Parmalat S.p.A. 0.3Seven & I Holdings Co. Ltd. 1.2Shoppers Drug Mart Corp. 0.4Tesco PLC 0.4Unilever PLC 1.6Viterra Inc. 0.7
Energy 11.3%BP PLC 1.3EnCana Corp. 0.6ENI S.p.A. 0.5Husky Energy Inc. 0.6Inpex Corp. 0.7Royal Dutch Shell PLC (CL A) 1.8Royal Dutch Shell PLC (CL A) 1.1Saras S.p.A. 1.2Suncor Energy Inc. 0.9Total S.A. 0.9Total S.A. ADS 1.2Wellstream Holdings PLC 0.4
Financials 25.6%Aegon N.V. 0.5Allianz SE 0.6Banco Popolare S.C. 0.2Canadian Imperial Bank of Commerce 1.0Chuo Mitsui Trust Holdings Inc. 1.2Credit Agricole S.A. 0.6Credit Saison Co. Ltd. 0.4Daiwa House Industry Co. Ltd. 0.8DBS Group Holdings Ltd. 1.9Hang Seng Bank Ltd. 1.5HSBC Holdings PLC 2.5Insurance Australia Group Ltd. 0.7Investor AB 0.7Manulife Financial Corp. 1.0Mitsubishi UFJ Financial Group Inc. 1.4Muenchener Rueckversicherungs-Gese. 0.8National Australia Bank Ltd. 1.1National Bank of Canada 0.6Nomura Holdings Inc. 0.6QBE Insurance Group Ltd. 0.5Resolution Ltd. 1.5Societe Generale S.A. (France) 1.3Sumitomo Mitsui Financial Group Inc. 1.2TMX Group Inc. 0.6UBS AG 1.0Unipol Gruppo Finanziario S.p.A. 0.5United Overseas Bank Ltd. 0.7
Health Care 11.0%Astellas Pharma Inc. 0.6Bayer AG 0.8Celesio AG 0.4GlaxoSmithKline PLC 1.9Medipal Holdings Corp. 0.4Novartis AG 2.5Primary Health Care Ltd. 0.5Roche Holding AG 1.2Sanofi-Aventis S.A. 1.9Teva Pharmaceutical Industries Ltd. ADS 0.7
Industrials 9.1%BAE Systems PLC 0.7Deutsche Lufthansa AG 0.5East Japan Railway Co. 1.0European Aeronautic Defence & Space Co. 0.8Finmeccanica S.p.A. 0.9Gamesa Corporacion Tecnologica S.A. 0.6Hutchison Whampoa Ltd. 0.9Nippon Express Co. Ltd. 0.2QinetiQ Group PLC 0.4Secom Co. Ltd. 0.7Shimizu Corp. 0.6Siemens AG 0.7Sumitomo Corp. 0.2Ushio Inc. 0.5Yamato Holdings Co. Ltd. 0.4
Information Technology 5.1%Ericsson Sh B 0.7Murata Manufacturing Co. Ltd. 0.2NEC Corp. 0.4Nintendo Co. Ltd. 0.3Nokia Corp. 2.0Nomura Research Institute Ltd. 0.6Ricoh Co. Ltd. 0.4Tokyo Electron Ltd. 0.5Trend Micro Inc. 0.1
Materials 8.2%Anglo American PLC 1.4Barrick Gold Corp. 0.4BlueScope Steel Ltd. 0.3Buzzi Unicem S.p.A. 0.3Clariant AG 0.4Lonmin PLC 0.1Mitsubishi Chemical Holdings Corp. 0.5Mitsubishi Gas Chemical Co. Inc. 0.6Norsk Hydro ASA 0.8Nufarm Ltd. 0.6Rengo Co. Ltd. 0.5Rexam PLC 0.7Shin-Etsu Chemical Co. Ltd. 0.6Tokyo Steel Manufacturing Co. Ltd. 0.8UPM-Kymmene Oyj 0.4
Telecommunication Services 4.2%
Deutsche Telekom AG 0.3France Telecom 1.1KDDI Corp. 1.3Vodafone Group PLC 1.5
Utilities 4.3%Drax Group PLC 0.7E.ON AG 1.3GDF Suez S.A. 1.2Iberdrola S.A. 0.7RWE AG 0.5
Cash 2.7%
The information shown above is supplemental to a fully compliant GIPS presentation that can be found at the end of this book along with other importantdisclosures. It should not be assumed that securities identified were or will be profitable or that decisions we make in the future will be profitable. Certainsecurities may not remain in the portfolio at the time that you receive this report. No investment strategy or risk management technique can guarantee returns oreliminate risk in any market environment.
As of August 31, 2010

LADWP10/13/10
Country Attribution
42
Australia 4.8% -17.0% -0.9% 7.6% -8.2% -0.7% -2.8% -8.8% -0.2% 0.0% -0.7% 0.3% -0.4%Austria 0.0 0.0 0.0 0.4 -12.2 -0.1 -0.4 12.2 0.1 0.0 0.0 0.0 0.0Belgium 0.0 0.0 0.0 0.9 -7.1 0.0 -0.9 7.1 0.0 0.0 0.0 0.0 0.0Canada 8.1 -4.6 -0.4 10.1 0.7 0.1 -2.0 -5.3 -0.5 -0.1 -0.5 0.1 -0.5Denmark 0.0 0.0 0.0 1.0 4.8 0.0 -1.0 -4.8 0.0 -0.1 0.0 0.0 -0.1Finland 2.6 -24.0 -0.6 1.1 -10.0 -0.1 1.5 -14.0 -0.5 0.0 -0.1 -0.2 -0.4France 12.5 -17.2 -2.0 8.3 -16.6 -1.4 4.2 -0.6 -0.6 -0.4 -0.1 0.0 -0.4Germany 6.4 -15.3 -0.9 6.8 -12.0 -0.8 -0.3 -3.3 -0.1 0.0 -0.3 0.0 -0.2Greece 0.3 -15.7 -0.1 0.4 -38.2 -0.2 -0.1 22.5 0.1 0.0 0.2 0.0 0.2Hong Kong 2.8 7.0 0.1 2.2 3.9 0.1 0.6 3.1 0.0 0.1 0.0 0.0 0.1Ireland 0.0 0.0 0.0 0.3 -25.2 -0.1 -0.3 25.2 0.1 0.1 0.0 0.0 0.1Israel 0.2 -10.7 0.0 0.3 -2.4 0.0 -0.1 -8.3 0.0 0.1 0.0 0.0 0.1Italy 3.1 -35.5 -1.2 2.7 -22.1 -0.6 0.5 -13.4 -0.6 0.0 -0.5 -0.1 -0.6Japan 23.7 3.6 0.2 20.7 -0.9 -0.8 3.0 4.5 1.0 0.2 0.8 0.1 1.1Luxembourg 0.0 0.0 0.0 0.5 -22.6 -0.1 -0.5 22.6 0.1 0.1 0.0 0.0 0.1Netherlands 0.6 -23.1 -0.1 2.4 -12.3 -0.3 -1.9 -10.8 0.1 0.1 -0.2 0.2 0.0New Zealand 0.0 0.0 0.0 0.1 -9.6 0.0 -0.1 9.6 0.0 0.0 0.0 0.0 0.0Norway 0.4 -39.6 -0.2 0.9 -13.5 -0.1 -0.4 -26.0 0.0 0.1 -0.3 0.1 -0.1Portugal 0.0 0.0 0.0 0.3 -19.9 0.0 -0.3 19.9 0.0 0.0 0.0 0.0 0.0Singapore 2.4 -3.2 -0.1 1.4 6.9 0.1 0.9 -10.1 -0.2 0.1 -0.1 -0.1 -0.1Spain 1.8 -43.4 -0.9 3.3 -22.5 -0.8 -1.5 -20.9 -0.1 0.3 -0.9 0.4 -0.2Sweden 1.5 2.1 0.1 2.6 3.3 0.1 -1.1 -1.3 0.0 -0.1 0.0 0.0 -0.1Switzerland 5.8 1.2 0.0 6.6 -0.7 0.0 -0.8 1.9 0.0 -0.1 0.1 0.0 0.0United Kingdom 20.0 -10.7 -2.2 19.0 -4.9 -0.9 1.0 -5.7 -1.3 0.0 -1.2 -0.1 -1.3Cash 2.9 -2.1 -0.1 0.0 0.0 0.0 2.9 -2.1 -0.1 0.0 0.0 0.0 0.0
Total 100.0% -9.0% -9.0% 100.0% -6.5% -6.5% 0.0% -2.5% -2.5% 0.7% -3.9% 0.8% -2.5%
Attribution AnalysisLADWP
January 1, 2010 – August 31, 2010
CountrySelection
EffectTotalEffect
InteractionEffect
PercentContribution
vs. IndexAllocation
Effect
RelativeWeight
vs. IndexExcessReturn
Return byCountry
PercentContribution
AverageCountryWeight
Return byCountry
PercentContribution
AverageCountryWeight
MSCI World ex-US IMI Variance
Performance history of less than two years may not provide an adequate basis from which to determine the performance of a strategy. Past performance ofsuch a strategy is not a guarantee of any future results. The information shown above is supplemental to a fully compliant GIPS presentation that can be found atthe end of this book along with other important disclosures. No investment strategy or risk management technique can guarantee returns or eliminate risk in anymarket environment.

LADWP10/13/10
Sector Attribution
43
Cons Discretionary 9.1% -4.7% -0.6% 10.2% -2.1% -0.3% -1.1% -2.7% -0.2% -0.1% -0.3% 0.0% -0.4%Consumer Staples 9.1 2.4 0.2 9.0 -0.2 0.1 0.1 2.7 0.1 0.1 0.2 0.1 0.3Energy 11.3 -21.0 -2.5 9.4 -15.1 -1.5 1.9 -5.9 -1.0 -0.1 -0.7 -0.1 -0.9Financials 24.2 -9.4 -2.5 25.0 -9.1 -2.2 -0.8 -0.3 -0.2 0.0 -0.2 0.0 -0.2Health Care 10.0 -14.6 -1.3 7.4 -7.2 -0.5 2.7 -7.4 -0.9 0.0 -0.5 -0.2 -0.7Industrials 9.4 -5.3 -0.6 12.7 -2.5 -0.4 -3.2 -2.8 -0.1 -0.1 -0.4 0.1 -0.4Information Technology 5.2 -13.0 -0.4 5.3 -8.0 -0.5 -0.1 -5.1 0.2 0.2 -0.2 0.2 0.2Materials 8.3 -10.4 -0.8 11.3 -6.6 -0.7 -3.1 -3.8 -0.1 0.0 -0.6 0.2 -0.4Telecom Services 4.5 -1.5 0.0 4.8 -1.6 0.0 -0.3 0.1 0.0 -0.1 0.0 0.0 0.0Utilities 5.8 -11.1 -0.7 4.8 -9.6 -0.4 1.0 -1.5 -0.3 -0.1 0.0 0.0 -0.1Cash 2.9 -2.1 -0.1 0.0 0.0 0.0 2.9 -2.1 -0.1 0.0 0.0 0.0 0.0
Total 100.0% -9.0% -9.0% 100.0% -6.5% -6.5% 0.0% -2.5% -2.5% -0.1% -2.7% 0.3% -2.5%
Attribution Analysis
SectorSelection
EffectTotalEffect
InteractionEffect
PercentContribution
vs. IndexAllocation
Effect
RelativeWeight
vs. IndexExcessReturn
Return bySector
PercentContribution
AverageSectorWeight
Return bySector
PercentContribution
AverageSectorWeight
MSCI World ex-US IMI VarianceLADWP
Performance history of less than two years may not provide an adequate basis from which to determine the performance of a strategy. Past performance ofsuch a strategy is not a guarantee of any future results. The information shown above is supplemental to a fully compliant GIPS presentation that can be found atthe end of this book along with other important disclosures. No investment strategy or risk management technique can guarantee returns or eliminate risk in anymarket environment.
January 1, 2010 – August 31, 2010

LADWP10/13/10
Performance Attribution Analysis
44
Individual Stock Contributors to Equity Return — January 1, 2010 – August 31, 2010
LADWP
Added Value
Seven & I Holdings Co. Ltd. 0.2% 15.2% 1.2%Lihir Gold Ltd. 0.2 59.0 0.0Loblaw Cos. Ltd. 0.1 29.0 0.0UBS AG 0.1 9.1 1.0European Aero. Defence & Space 0.1 9.2 0.8Mitsui O.S.K. Lines Ltd. 0.1 39.2 0.0Aeon Co. Ltd. 0.1 38.5 0.0Canadian Imperial Bank of Comm. 0.1 6.4 1.0Vodafone Group PLC 0.1 8.4 1.6Nintendo Co. Ltd. 0.1 19.9 0.3
1.2% 5.9%
Ending Weight
PercentContribution
StockReturn
Subtracted Value
BP PLC -0.9% -39.4% 1.3%Nokia Corp. -0.6 -30.7 2.0Nufarm Ltd. -0.6 -58.5 0.6Gamesa Corporacion Tecnolog. -0.5 -61.7 0.6Sanofi-Aventis S.A. -0.5 -24.4 1.9Manulife Financial Corp. -0.5 -38.5 1.0E.ON AG -0.4 -29.7 1.3Resolution Ltd. -0.4 -29.2 1.5Total S.A. ADS -0.3 -25.3 1.2Finmeccanica S.p.A. -0.3 -35.1 0.9
-5.0% 12.3%
Ending Weight
PercentContribution
StockReturn
Stock returns represent in-portfolio holdings. Performance history of less than two years may not provide an adequate basis from which to determine the performanceof a strategy. Past performance of such a strategy is not a guarantee of any future results. The information shown above is supplemental to a fully compliant GIPSpresentation that can be found at the end of this book along with other important disclosures. It should not be assumed that securities identified were or will beprofitable or that decisions we make in the future will be profitable. Certain securities may not remain in the portfolio at the time that you receive this report. A full list ofholdings is available upon request. No investment strategy or risk management technique can guarantee returns or eliminate risk in any market environment.
Added ValueEnding Weight
PercentContribution
StockReturn
Subtracted ValueEnding Weight
PercentContribution
StockReturn
MSCI World ex-US IMI
Nestle S.A. 0.1% 9.0% 1.5%Vodafone Group PLC 0.1 8.4 1.1Potash Corp. of Saskatchewan 0.1 35.2 0.4Novo Nordisk A/S 0.1 36.1 0.3Lloyds Banking Group PLC 0.1 30.5 0.4AstraZeneca PLC 0.1 11.1 0.6British American Tobacco PLC 0.1 9.5 0.6Barrick Gold Corp. 0.1 19.1 0.4UBS AG 0.0 9.1 0.5Hennes & Mauritz AB 0.0 20.7 0.3
0.8% 6.1%
BP PLC -0.6% -39.4% 0.9%Total S.A. -0.3 -25.8 0.8Banco Santander S.A. -0.2 -26.2 0.8Toyota Motor Corp. -0.2 -17.8 0.8E.ON AG -0.2 -29.7 0.4Roche Holding AG -0.2 -18.2 0.8HSBC Holdings PLC -0.2 -11.3 1.5Banco Bilbao Vizcaya Argentaria -0.2 -32.5 0.4Sanofi-Aventis S.A. -0.2 -24.4 0.5Telefonica S.A. -0.1 -18.0 0.8
-2.4% 7.7%

Minimum Account Size To Be Included In CompositeTo be included in the Composite, portfolios must meet the minimum account size requirement of $1 million.
World ex US Value Equity: Disclosure
Total Firm Assets
(USD Million)
Total Composite Assets
(USD Million)
InternalDispersion
Number ofPortfolios
BenchmarkReturn
Net-of-FeesReturn
Gross-of-FeesReturnPeriod
* $483 $59,997N/M217.39%13.40%14.04%2005
$357 $72,747N/M125.71%22.24%23.26%2006
$374 $53,308N/M112.44%3.89%4.77%2007
$238 $26,213N/M1-43.56%-36.89%-36.33%2008
$1,580 $34,783N/M533.67%32.35%33.45%2009
* Partial period represents data from 5/1/2005
Compliance StatementThe Boston Company Asset Management, LLC has prepared and presented this report in compliance with the Global Investment Performance Standards (GIPS®).
Definition of the FirmThe firm is defined as The Boston Company Asset Management, LLC (TBCAM), a registered investment advisor established in 1970 and wholly-owned indirect subsidiaryof The Bank of New York Mellon Corporation. Effective January 1, 2008, The Boston Company Asset Management, LLC includes the following subsidiary, The BostonCompany Asset Management NY, LLC. The Boston Company Asset Management NY, LLC was formed in 2007. Prior to 2007 the employees were part of The BostonCompany Asset Management, LLC. This Composite may also include assets managed by TBCAM personnel serving as dual officers of affiliated companies other thanwrap accounts managed in a dual officer capacity. As of December 31, 2009, total firm assets were $34.8 billion of which $19.3 billion represented assets managed in adual officer capacity.
Composite DescriptionThe World ex US Value Equity Composite creation date is May 1, 2005. The Composite is composed of all fee-paying, discretionary accounts managed by TBCAM in thisinvestment style. The World ex US Value Equity Composite represents an equity strategy that primarily invests in value companies from developed market countries aroundthe world, excluding the United States.Effective January 1, 2006, portfolios that come under management on the twenty-first day of the month or earlier join the Composite the following month; portfolios thatcome under management after the twenty-first day of the month join the Composite after one full calendar month under management. Prior to January 1, 2006, newportfolios were included in the Composite after one full calendar month under management. Terminated portfolios remain in the historical record through the last fullcalendar month under management.Returns include realized and unrealized gains and losses plus accrued income. The performance of the Composite is based in U.S. dollars and is net of withholding taxeson dividends and interest income where applicable. Additional information regarding policies for calculating and reporting returns is available upon request.The Composite does not include the performance of accounts with investment restrictions that significantly hinder TBCAM from fully implementing its intended strategy. Acomplete list and description of the firm’s composites is available upon request.BenchmarkThe Composite’s benchmark is the MSCI EAFE plus Canada Index. The benchmark is used for comparative purposes only and is not covered by the Report ofIndependent Accountants. The MSCI EAFE plus Canada Index measures the performance of global developed equity markets excluding the U.S. and is presented net ofwithholding taxes.
Internal DispersionThe internal dispersion of annual returns is measured by the standard deviation of asset-weighted portfolio returns represented within the Composite for the full year. Astandard deviation is not presented for periods with fewer than six portfolios participating for the full year.
N/M = not meaningful

World ex US Value Equity: DisclosurecontinuedTo be included in the Composite, portfolios must meet the minimum account size requirement of $1 million.
Fee ScheduleExcept where noted, performance is stated gross of management fees. For all time periods, net performance is calculated by subtracting the highest publishedmanagement fee for the strategy (since inception) from the gross performance, on a monthly basis. The highest published management fee is 85 basis points. The currentstandard fee schedule for the World ex US Value Equity strategy is as follows:
80 Basis Points on the first $20 million70 Basis Points on the next $20 million60 Basis Points on the next $60 million40 Basis Points thereafter
VerificationTBCAM has been verified for the years 2003 - 2008 by an independent verifier. A copy of the verification report is available upon request.
Other Information(The following information is not covered by the Report of Independent Accountants.)BNY Mellon Asset Management is the umbrella organization of The Bank of New York Mellon Corporation’s affiliated investment management firms and global distributioncompanies. To derive Ten Largest Holdings, Characteristics, Economic Sector Weightings, Country Weightings and Portfolio Holdings for presentation purposes, theportfolio manager has identified a representative institutional account to be used as a proxy for the strategy. This portfolio data should not be relied upon as a completelisting of the Account’s holdings (or of an Account’s top holdings) as information on particular holdings may be withheld if it is in the Account’s best interest to do so. Portfolioholdings and allocations are subject to change without notice and may not represent current or future portfolio composition. The Account data is “as of” the date indicated.The information provided in this document should not be considered a recommendation to purchase or sell any particular security. There is no assurance that any securitiesdiscussed herein will remain in an account’s portfolio at the time you receive this report or that securities sold have not been repurchased. The securities discussed do notrepresent an account’s entire portfolio and in the aggregate may represent only a small percentage of an account’s portfolio holdings. It should not be assumed that any ofthe securities transactions or holdings discussed were or will prove to be profitable, or that the investment recommendations or decisions we make in the future will beprofitable or will equal the investment performance of the securities discussed herein.Investments made by TBCAM for the portfolios it manages may differ significantly in terms of security holdings, industry weightings and asset allocation from those of thebenchmark. Accordingly, investment results and volatility of the portfolios may differ from those of the benchmark. Also, unlike the portfolios, the indices noted in thispresentation are unmanaged, are not available for direct investment, and are not subject to management fees, transaction costs or other types of expenses that theportfolios may incur. Because of these differences, investors should carefully consider these limitations when evaluating the performance in comparison to benchmark dataas provided herein. The impact of fees on performance can be significant. A $125 million account with a fee schedule of the following: .008 for the first $20 million, .007 onthe next $20 million, .006 on the next $60 million and .004 on the next $25 million, assuming an annual gross of fee return of 12%, would realize an annual net of fee returnof 11.39%. This assumes that 1/12 of the annual fee is deducted on a monthly basis from the monthly account rate of return.This presentation or any portion thereof may not be copied or distributed without TBCAM’s prior written approval. Statements are correct as of the date of the material only.This document may not be used for the purpose of an offer or solicitation in any jurisdiction or in any circumstances in which such offer or solicitation is unlawful or notauthorized. The use of corporate names or logos in this presentation, other than those of The Boston Company Asset Management, LLC or its affiliates, is for illustrativepurposes only and rights to any logos, trademarks or servicemarks are owned by their respective entities. It is not known whether the listed companies endorse ordisapprove of TBCAM or any advisory services provided.Some information contained herein has been obtained from third-party sources that are believed to be reliable, but the information has not been independently verified byTBCAM. TBCAM makes no representations as to the accuracy or the completeness of such information and has no obligation to revise or update any statement herein forany reason.