SMALL BUSINESS CREDIT SURVEY - Federal … small business credit survey report on startup firms...
34
SMALL BUSINESS CREDIT SURVEY REPORT ON STARTUP FIRMS 2016 Published August 2017
Transcript of SMALL BUSINESS CREDIT SURVEY - Federal … small business credit survey report on startup firms...
SMALL BUSINESS CREDIT SURVEY
REPORT ON STARTUP FIRMS
2016
Published August 2017

2016 SMALL BUSINESS CREDIT SURVEY | REPORT ON STARTUP FIRMS
TABLE OF CONTENTS
i ACKNOWLEDGMENTS
iii EXECUTIVE SUMMARY
1 DEMOGRAPHICS
5 PERFORMANCE
6 FINANCIAL CHALLENGES
7 FINANCING AND DEBT
9 NONAPPLICANTS
12 DEMAND FOR FINANCING
13 CREDIT APPLICATIONS
15 CREDIT SOURCES
16 FINANCING APPROVAL
19 FINANCING SHORTFALLS
20 LENDER SATISFACTION
21 METHODOLOGY
23 PARTNER ORGANIZATIONS
i2016 SMALL BUSINESS CREDIT SURVEY | REPORT ON STARTUP FIRMS
ACKNOWLEDGMENTS
This Small Business Credit Survey (SBCS) is made possible through collaboration with more than 400 business organizations in communities across the United States. The Federal Reserve Banks thank the national, regional, and community partners who share valuable insights about small business financing needs and collaborate with us to promote and distribute the survey.1 We also thank the National Opinion Research Center (NORC) at the University of Chicago for assistance with weighting the survey data to be statistically representative of the nation’s small business population.2
Special thanks to colleagues within the Federal Reserve System, particularly the Community Affairs Officers,3 and representatives from the U.S. Department of the Treasury, U.S. Small Business Administration, the Association for Enterprise Opportunity (AEO), and The Aspen Institute for their support for this project. Thanks also to our SBCS team, including Ellyn Terry, Shannon McKay, Karen Leone de Nie, Brett Barkley, Anne Marie Wiersch, and Emily Wavering for their incisive feedback.
We particularly thank the following individuals:
Daniel Davis, Community Development Officer, Federal Reserve Bank of St. Louis
Menna Demessie, Vice President, Policy Analysis & Research, Congressional Black Caucus Foundation
Annie Donovan, Director, CDFI Fund, U.S. Department of the Treasury
Ingrid Gorman, Research and Insights Director, Association for Enterprise Opportunity
Tammy Halevy, Senior Vice President, New Initiatives, Association for Enterprise Opportunity
Kausar Hamdani, Senior Vice President, Federal Reserve Bank of New York
Gina Harman, Chief Executive Officer, Accion USA
Brian Headd, Chief Economic Advisor, U.S. Small Business Administration
Joyce Klein, Director, FIELD, The Aspen Institute
Joy Lutes, Vice President of External Affairs, National Association of Women Business Owners
John Moon, District Manager, Community Development, Federal Reserve Bank of San Francisco
Chad Moutray, Chief Economist, National Association of Manufacturers
Robin Prager, Senior Adviser, Federal Reserve Board of Governors
Alicia Robb, Chief Executive Officer, Next Wave Ventures
Lauren Rosenbaum, Communications Manager, U.S. Network, Accion
Lauren Stebbins, Vice President, Small Business Initiatives, Opportunity Finance Network
Jeffrey Stout, Director, State Small Business Credit Initiative, U.S. Department of the Treasury
Storm Taliaferrow, Manager of Membership & Impact Assessment, National Association for Latino Community Asset Builders (NALCAB)
Richard Todd, Vice President, Federal Reserve Bank of Minneapolis
Holly Wade, Director of Research and Policy Analysis, National Federation of Independent Business
Eric Weaver, Chief Executive Officer, Opportunity Fund
Kristin Westmoreland, Vice President, Center for Capital Markets Competitiveness, U.S. Chamber of Commerce
Allison Kroeger Zeller, Director of Research, National Retail Federation
1 For a full list of community partners, please see p. 23.2 For complete information about the Survey Methodology, please see p. 21.3 Joseph Firschein, Board of Governors of the Federal Reserve System; Todd Greene, Federal Reserve Bank of Atlanta; Prabal Chakrabarti, Federal Reserve Bank
of Boston; Alicia Williams, Federal Reserve of Chicago; Paul Kaboth, Federal Reserve Bank of Cleveland; Roy Lopez, Federal Reserve Bank of Dallas; Tammy Edwards, Federal Reserve Bank of Kansas City; Michael Grover, Federal Reserve Bank of Minneapolis; Theresa Singleton, Federal Reserve Bank of Philadelphia; Sandy Tormoen, Federal Reserve Bank of Richmond; Yvonne Sparks, Federal Reserve Bank of St. Louis; and David Erickson, Federal Reserve Bank of San Francisco.

ii2016 SMALL BUSINESS CREDIT SURVEY | REPORT ON STARTUP FIRMS
ACKNOWLEDGMENTS (CONTINUED)
This report is the result of the collaborative effort, input, and analysis of the following teams:
REPORT TEAMJessica Battisto, Federal Reserve Bank of New York
Claire Kramer Mills, Federal Reserve Bank of New York
Scott Lieberman, Federal Reserve Bank of New York
SURVEY DATA AND METHODOLOGY MANAGER Ellyn Terry, Federal Reserve Bank of Atlanta
SURVEY DATA AND METHODOLOGY TEAMBrett Barkley, Federal Reserve Bank of Cleveland
Jessica Battisto, Federal Reserve Bank of New York
Scott Lieberman, Federal Reserve Bank of New York
Emily Wavering, Federal Reserve Bank of Richmond
PARTNERSHIPS MANAGEREmily Mitchell, Federal Reserve Bank of Atlanta
SURVEY OUTREACH TEAMLeilani Barnett, Federal Reserve Bank of San Francisco
Bonnie Blankenship, Federal Reserve Bank of Cleveland
Jeanne Milliken Bonds, Federal Reserve Bank of Richmond
Nathaniel Borek, Federal Reserve Bank of Philadelphia
Laura Choi, Federal Reserve Bank of San Francisco
Brian Clarke, Federal Reserve Bank of Boston
Joselyn Cousins, Federal Reserve Bank of San Francisco
Chelsea Cruz, Federal Reserve Bank of New York
Peter Dolkart, Federal Reserve Bank of Richmond
Ian Galloway, Federal Reserve Bank of San Francisco
Dell Gines, Federal Reserve Bank of Kansas City
Jennifer Giovannitti, Federal Reserve Bank of Richmond
Melody Head, Federal Reserve Bank of San Francisco
Michou Kokodoko, Federal Reserve Bank of Minneapolis
Lisa Locke, Federal Reserve Bank of St. Louis
Shannon McKay, Federal Reserve Bank of Richmond
Emily Mitchell, Federal Reserve Bank of Atlanta
Craig Nolte, Federal Reserve Bank of San Francisco
Drew Pack, Federal Reserve Bank of St. Louis
Emily Perlmeter, Federal Reserve Bank of Dallas
E. Kathleen Ranalli, Federal Reserve Bank of Cleveland
Javier Silva, Federal Reserve Bank of New York
We thank all of the above for their contributions to this successful national effort.
Claire Kramer Mills, PhD Assistant Vice President and Community Affairs Officer Federal Reserve Bank of New YorkThe views expressed in the following pages are those of the authors and do not necessarily represent the views of the Federal Reserve System.

iii2016 SMALL BUSINESS CREDIT SURVEY | REPORT ON STARTUP FIRMS
EXECUTIVE SUMMARY
This report is the second in a series of reports based on the 2016 Small Business Credit Survey (SBCS), a national collabora-tion of the Community Development Offices of the 12 Federal Reserve Banks. As a follow-up to the Report on Employer Firms issued in April 2017, the Report on Startup Firms provides an in-depth look at the financ-ing and credit experiences of startups with employees—which we define as small busi-nesses that were five years old or younger in 2016 and had full- or part-time employees.
Startups1 are of particular interest since they account for 34% of all small employer firms and play an outsized role in U.S. innovation and productivity.2 Young firms are the drivers of job growth in the United States, account-ing for nearly all net new job creation and almost 20% of gross job creation.3 Yet, even as their importance has become more widely recognized, the rate of startup creation has been decreasing for years.4 And, of those ventures that launch, failure rates are high. Approximately one-third of new establish-ments fail within their first two years, and half fail within five years.5
Given the importance of startups for the economy, the question of startup capital needs is of central importance. Access to capital is important for both firm formation and growth. While funding is the lifeblood of every company, capital is especially critical for startups. To reach scale, startups need to be able to secure expansion capital. The Report on Startup Firms offers detailed intelligence on startups’ financing needs and challenges, asking questions about capital requests, borrowing qualifications, applica-tions and success levels.
The SBCS offers a unique dataset to examine the financing realities of firms that launched after the Great Recession, amid a challenging and changing financial landscape.6 Even though most small firms seek small amounts of financing (55% of 2016 SBCS respondents sought $100,000 or less), small dollar credit is difficult to obtain. The small-dollar loan share of lending has fallen from 33% in 2008 to 22% in 2016, and continues to decline.7 Instead, firms may be turning to other financing sources. Product-wise, credit card lending has been rising since the recession, with implications for borrowing costs. In ad-dition, a variety of online alternative lenders have introduced new lending products and services. The SBCS enables us to examine the interplay between these broader market trends and small business borrowers’ experi-ences.
This report addresses several important borrower-centric questions:
� How strong is demand for financing among startups?
� Are startup firms seeking financing and credit from traditional lenders, or are younger firms attracted to new capital sources?
� How successful are new firms in obtain-ing financing, and how do they rate their experiences with lenders?
OVERALL, THE SURVEY FINDS:
Startup firms have stronger growth and optimism than mature small employer firms (called “mature firms” throughout), but also have greater credit risk
� Startup firms are twice as likely as mature
firms to be growing firms (adding jobs and growing revenues): 43% compared to 22%.
� 70% of startup applicants sought funding for expansion, compared to 60% of mature applicants.
� Most startup firms are optimistic about their future growth, with net majorities (the share of firms expecting an increase minus the share expecting a decrease) anticipating revenue and/or employment growth in the next 12 months.
� Startup expectations are notably stronger than those of mature firms. For example, a net 61% of 0-2 year old and net 54% of 3-5 year old firms expect to add jobs, compared to 29% of mature firms.
� Despite these positives, only 32% of 0-2 year old firms and 49% of 3-5 year old firms report being profitable, compared to 60% of mature firms.
� 44% of startup firms self-identify as medium and high credit risk, compared to 30% of mature firms. Roughly half of the firms who reported credit risk scores used personal – instead of business – scores.
Startups have strong demand for financing yet smaller financing needs than mature firms
� Half of startup firms are seeking external financing; 52% of startup firms applied for financing in 2016, compared to 42% of mature firms.
� 63% of startup applicants sought $100,000 or less in financing, compared to 49% of mature applicants.
1 Defined in our analysis as firms five years old or younger.2 Small innovative firms have historically produced fifteen times as many patents per employee as large innovative firms. See: Anthony Breitzman. “Patent Trends
among Small and Large Innovative Firms during the 2007-2009 Recession.” SBA Office of Advocacy. May 2013.3 “The Importance of Young Firms for Economic Growth,” Jason Wiens and Chris Jackson. Kauffman Foundation Entrepreneurship Policy Digest, September 2015; “Who
Creates Jobs? Small Versus Large Versus Young,” John Haltiwanger, Ron S. Jarmin, and Javier Miranda. The Review of Economics and Statistics, May 2013, 95(2): 347-361.
4 “Declining Business Dynamism: It’s For Real,” Ian Hathaway and Robert E. Litan, Brookings Institution, May 2014.5 Bureau of Labor Statistics, Business Employment Dynamics.6 The most mature startups (5 years old) in this report were launched in 2011.7 “Loans to Small Businesses and Small Farms.” In Federal Deposit Insurance Corporation, Quarterly Banking Profile. Available at: https://www.fdic.gov/bank/analyti-
cal/qbp/. Accessed 7/31/2017.8 “Small Business Use of Credit Cards in the U.S. Market,” Susan Herbst-Murphy, Federal Reserve Bank of Philadelphia Payment Cards Center, December 2012.
iv2016 SMALL BUSINESS CREDIT SURVEY | REPORT ON STARTUP FIRMS
EXECUTIVE SUMMARY (CONTINUED)
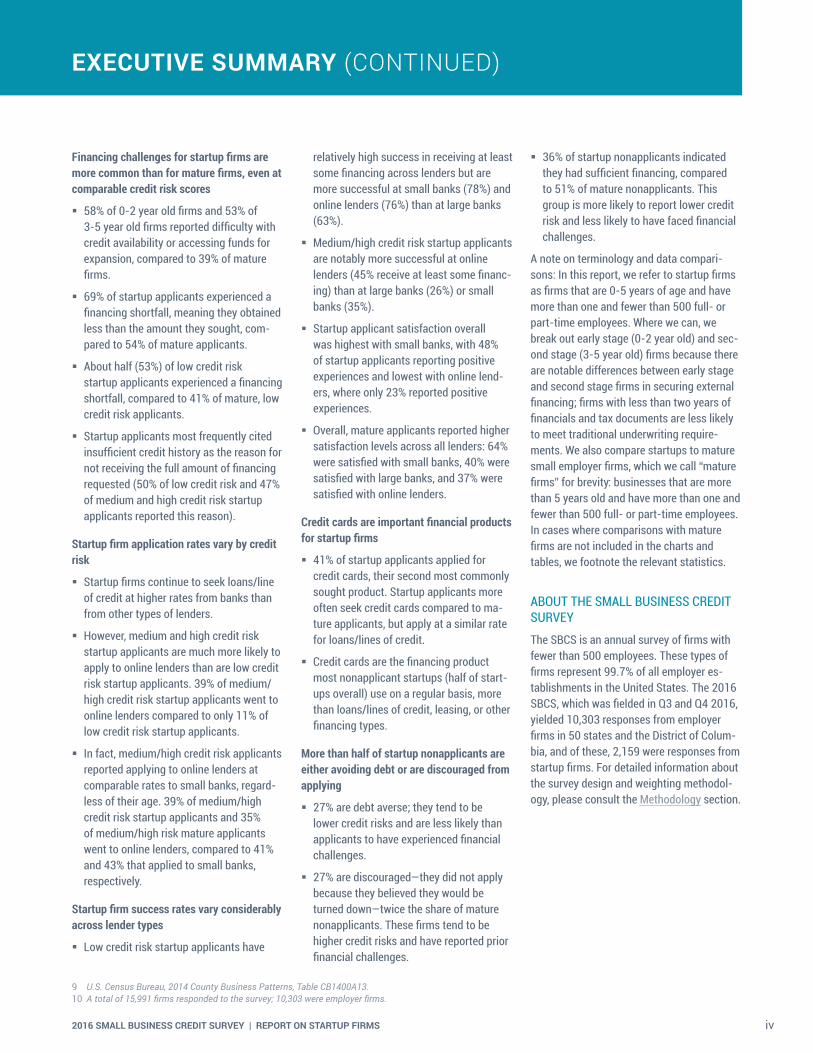
Financing challenges for startup firms are more common than for mature firms, even at comparable credit risk scores
� 58% of 0-2 year old firms and 53% of 3-5 year old firms reported difficulty with credit availability or accessing funds for expansion, compared to 39% of mature firms.
� 69% of startup applicants experienced a financing shortfall, meaning they obtained less than the amount they sought, com-pared to 54% of mature applicants.
� About half (53%) of low credit risk startup applicants experienced a financing shortfall, compared to 41% of mature, low credit risk applicants.
� Startup applicants most frequently cited insufficient credit history as the reason for not receiving the full amount of financing requested (50% of low credit risk and 47% of medium and high credit risk startup applicants reported this reason).
Startup firm application rates vary by credit risk
� Startup firms continue to seek loans/line of credit at higher rates from banks than from other types of lenders.
� However, medium and high credit risk startup applicants are much more likely to apply to online lenders than are low credit risk startup applicants. 39% of medium/high credit risk startup applicants went to online lenders compared to only 11% of low credit risk startup applicants.
� In fact, medium/high credit risk applicants reported applying to online lenders at comparable rates to small banks, regard-less of their age. 39% of medium/high credit risk startup applicants and 35% of medium/high risk mature applicants went to online lenders, compared to 41% and 43% that applied to small banks, respectively.
Startup firm success rates vary considerably across lender types
� Low credit risk startup applicants have
relatively high success in receiving at least some financing across lenders but are more successful at small banks (78%) and online lenders (76%) than at large banks (63%).
� Medium/high credit risk startup applicants are notably more successful at online lenders (45% receive at least some financ-ing) than at large banks (26%) or small banks (35%).
� Startup applicant satisfaction overall was highest with small banks, with 48% of startup applicants reporting positive experiences and lowest with online lend-ers, where only 23% reported positive experiences.
� Overall, mature applicants reported higher satisfaction levels across all lenders: 64% were satisfied with small banks, 40% were satisfied with large banks, and 37% were satisfied with online lenders.
Credit cards are important financial products for startup firms
� 41% of startup applicants applied for credit cards, their second most commonly sought product. Startup applicants more often seek credit cards compared to ma-ture applicants, but apply at a similar rate for loans/lines of credit.
� Credit cards are the financing product most nonapplicant startups (half of start-ups overall) use on a regular basis, more than loans/lines of credit, leasing, or other financing types.
More than half of startup nonapplicants are either avoiding debt or are discouraged from applying
� 27% are debt averse; they tend to be lower credit risks and are less likely than applicants to have experienced financial challenges.
� 27% are discouraged—they did not apply because they believed they would be turned down—twice the share of mature nonapplicants. These firms tend to be higher credit risks and have reported prior financial challenges.
� 36% of startup nonapplicants indicated they had sufficient financing, compared to 51% of mature nonapplicants. This group is more likely to report lower credit risk and less likely to have faced financial challenges.
A note on terminology and data compari-sons: In this report, we refer to startup firms as firms that are 0-5 years of age and have more than one and fewer than 500 full- or part-time employees. Where we can, we break out early stage (0-2 year old) and sec-ond stage (3-5 year old) firms because there are notable differences between early stage and second stage firms in securing external financing; firms with less than two years of financials and tax documents are less likely to meet traditional underwriting require-ments. We also compare startups to mature small employer firms, which we call “mature firms” for brevity: businesses that are more than 5 years old and have more than one and fewer than 500 full- or part-time employees. In cases where comparisons with mature firms are not included in the charts and tables, we footnote the relevant statistics.
ABOUT THE SMALL BUSINESS CREDIT SURVEYThe SBCS is an annual survey of firms with fewer than 500 employees. These types of firms represent 99.7% of all employer es-tablishments in the United States. The 2016 SBCS, which was fielded in Q3 and Q4 2016, yielded 10,303 responses from employer firms in 50 states and the District of Colum-bia, and of these, 2,159 were responses from startup firms. For detailed information about the survey design and weighting methodol-ogy, please consult the Methodology section.
9 U.S. Census Bureau, 2014 County Business Patterns, Table CB1400A13.10 A total of 15,991 firms responded to the survey; 10,303 were employer firms.
12016 SMALL BUSINESS CREDIT SURVEY | REPORT ON STARTUP FIRMS Source: Small Business Credit Survey, Federal Reserve Banks
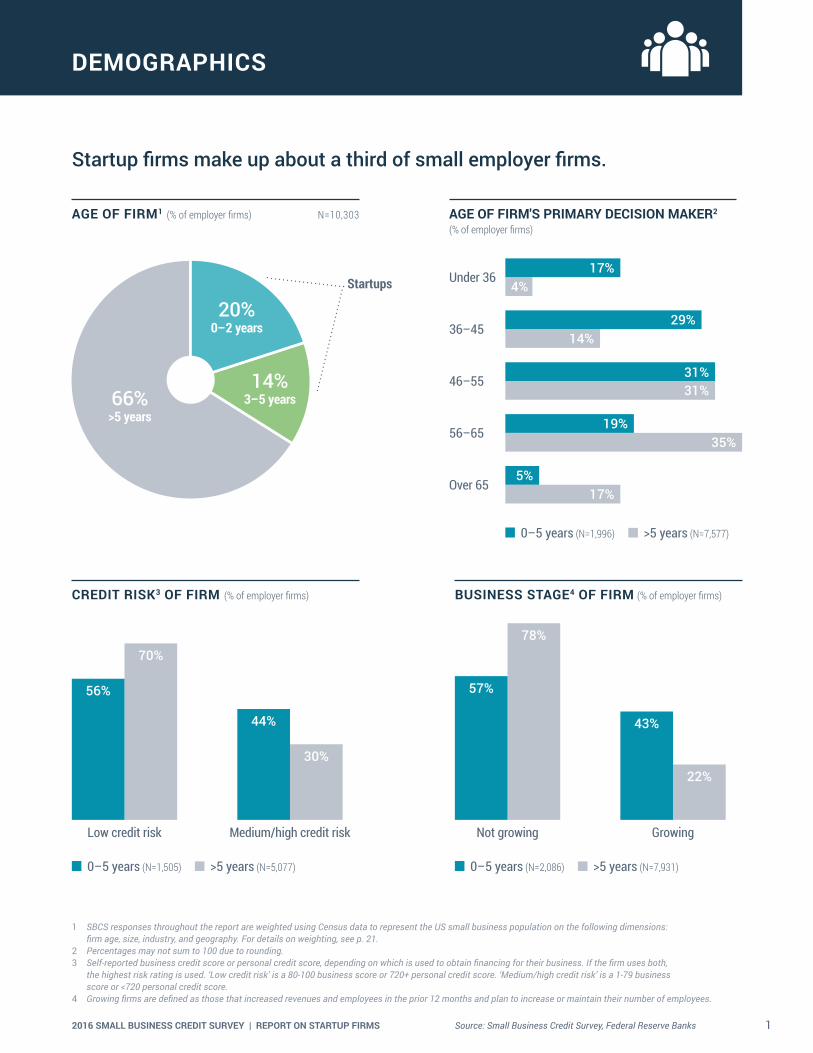
DEMOGRAPHICS
Startup firms make up about a third of small employer firms.
AGE OF FIRM1 (% of employer firms) N=10,303
66%>5 years
14%3–5 years
20%0–2 years
AGE OF FIRM'S PRIMARY DECISION MAKER2
Under 36
36–45
46–55
56–65
Over 65
17%4%
14%
31%
35%
17%
29%
31%
19%
5%
0–5 years (N=1,996) >5 years (N=7,577)
CREDIT RISK3 OF FIRM (% of employer firms) BUSINESS STAGE4 OF FIRM (% of employer firms)
0–5 years (N=1,505) >5 years (N=5,077)
Low credit risk Medium/high credit risk
56%
70%
44%
30%
0–5 years (N=2,086) >5 years (N=7,931)
Not growing Growing
57%
78%
43%
22%
1 SBCS responses throughout the report are weighted using Census data to represent the US small business population on the following dimensions: firm age, size, industry, and geography. For details on weighting, see p. 21.
2 Percentages may not sum to 100 due to rounding.3 Self-reported business credit score or personal credit score, depending on which is used to obtain financing for their business. If the firm uses both,
the highest risk rating is used. ‘Low credit risk’ is a 80-100 business score or 720+ personal credit score. ‘Medium/high credit risk’ is a 1-79 business score or <720 personal credit score.
4 Growing firms are defined as those that increased revenues and employees in the prior 12 months and plan to increase or maintain their number of employees.
Startups
(% of employer firms)

22016 SMALL BUSINESS CREDIT SURVEY | REPORT ON STARTUP FIRMS Source: Small Business Credit Survey, Federal Reserve Banks
1 SBCS responses throughout the report are weighted using Census data to represent the US small business population on the following dimensions: firm age, size, industry, and geography. For details on weighting, see p. 21.
2 Percentages may not sum to 100 due to rounding.3 Among firms >5 years, 18% are headquartered in rural zip codes and 82% are headquartered in urban zip codes (N=8,144).
CENSUS DIVISION1,2 (% of employer firms)
17% | 16%Pacific
11% | 11%West South
Central6% | 5%
East South Central
9% | 7%Mountain
7% | 8%West North
Central
11% | 15%East North
Central13% | 15%
Middle Atlantic
5% | 5%New England
22% | 18%South
Atlantic
DEMOGRAPHICS (CONTINUED)
0–5 years (N=2,159) >5 years (N=8,144)
GEOGRAPHIC LOCATION1,3 (% of startup firms) N=2,159
84% Urban 16% Rural
32016 SMALL BUSINESS CREDIT SURVEY | REPORT ON STARTUP FIRMS Source: Small Business Credit Survey, Federal Reserve Banks
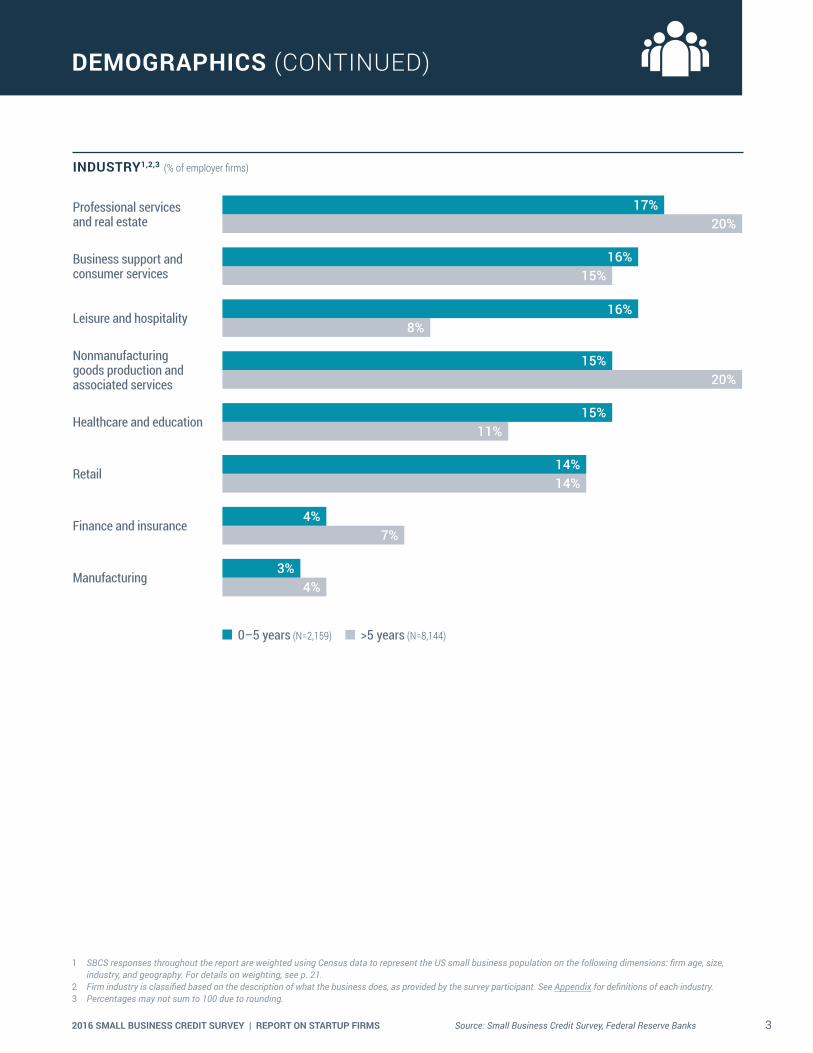
DEMOGRAPHICS (CONTINUED)
INDUSTRY1,2,3 (% of employer firms)
Professional services and real estate
Business support and consumer services
Leisure and hospitality
Nonmanufacturing goods production and associated services
Healthcare and education
Retail
Finance and insurance
Manufacturing
17%20%
15%
8%
20%
11%
16%
16%
15%
15%
14%14%
7%4%
4%3%
0–5 years (N=2,159) >5 years (N=8,144)
1 SBCS responses throughout the report are weighted using Census data to represent the US small business population on the following dimensions: firm age, size, industry, and geography. For details on weighting, see p. 21.
2 Firm industry is classified based on the description of what the business does, as provided by the survey participant. See Appendix for definitions of each industry.3 Percentages may not sum to 100 due to rounding.
42016 SMALL BUSINESS CREDIT SURVEY | REPORT ON STARTUP FIRMS Source: Small Business Credit Survey, Federal Reserve Banks
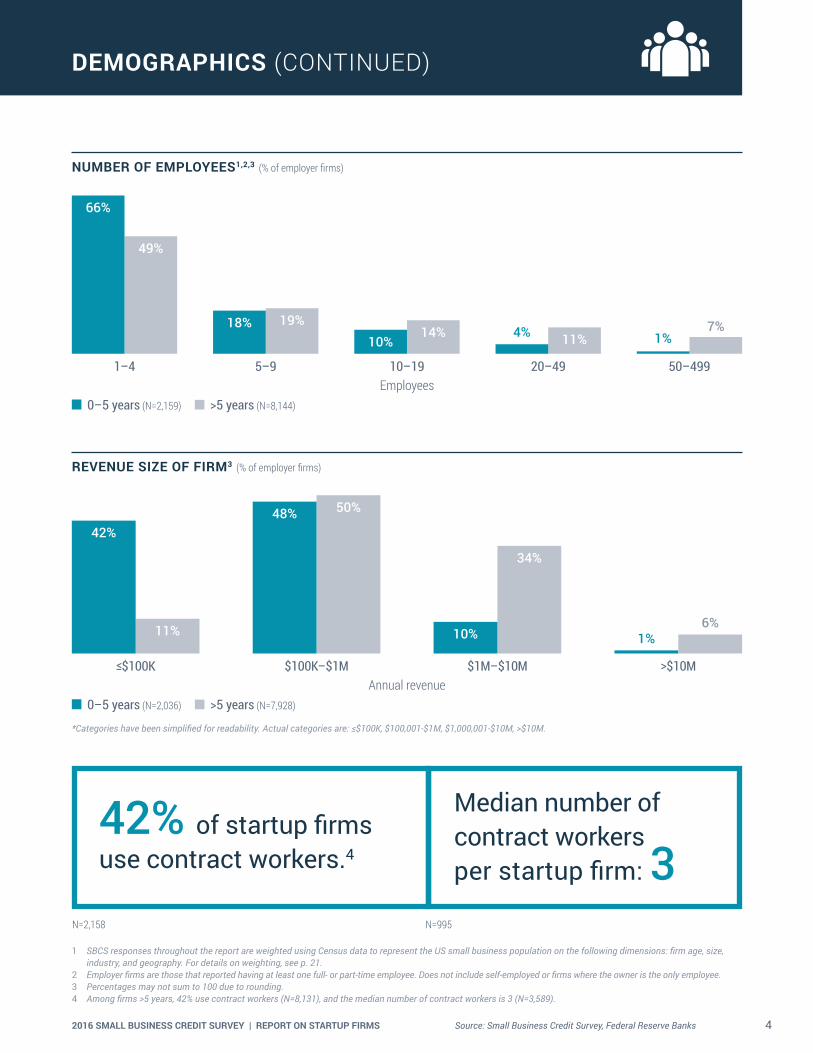
DEMOGRAPHICS (CONTINUED)
42% of startup firms use contract workers.4
Median number of contract workers per startup firm: 3
N=2,158 N=995
NUMBER OF EMPLOYEES1,2,3 (% of employer firms)
Employees1–4
66%
49%
5–9
18% 19%
10–19
10%14%
20–49
4% 11%
50–499
1%7%
0–5 years (N=2,159) >5 years (N=8,144)
REVENUE SIZE OF FIRM3 (% of employer firms)
≤$100K
42%
11%
$100K–$1M
48% 50%
$1M–$10M
10%
34%
>$10M
1%6%
Annual revenue
* Categories have been simplified for readability. Actual categories are: ≤$100K, $100,001-$1M, $1,000,001-$10M, >$10M.
0–5 years (N=2,036) >5 years (N=7,928)
1 SBCS responses throughout the report are weighted using Census data to represent the US small business population on the following dimensions: firm age, size, industry, and geography. For details on weighting, see p. 21.
2 Employer firms are those that reported having at least one full- or part-time employee. Does not include self-employed or firms where the owner is the only employee.3 Percentages may not sum to 100 due to rounding.4 Among firms >5 years, 42% use contract workers (N=8,131), and the median number of contract workers is 3 (N=3,589).
52016 SMALL BUSINESS CREDIT SURVEY | REPORT ON STARTUP FIRMS Source: Small Business Credit Survey, Federal Reserve Banks
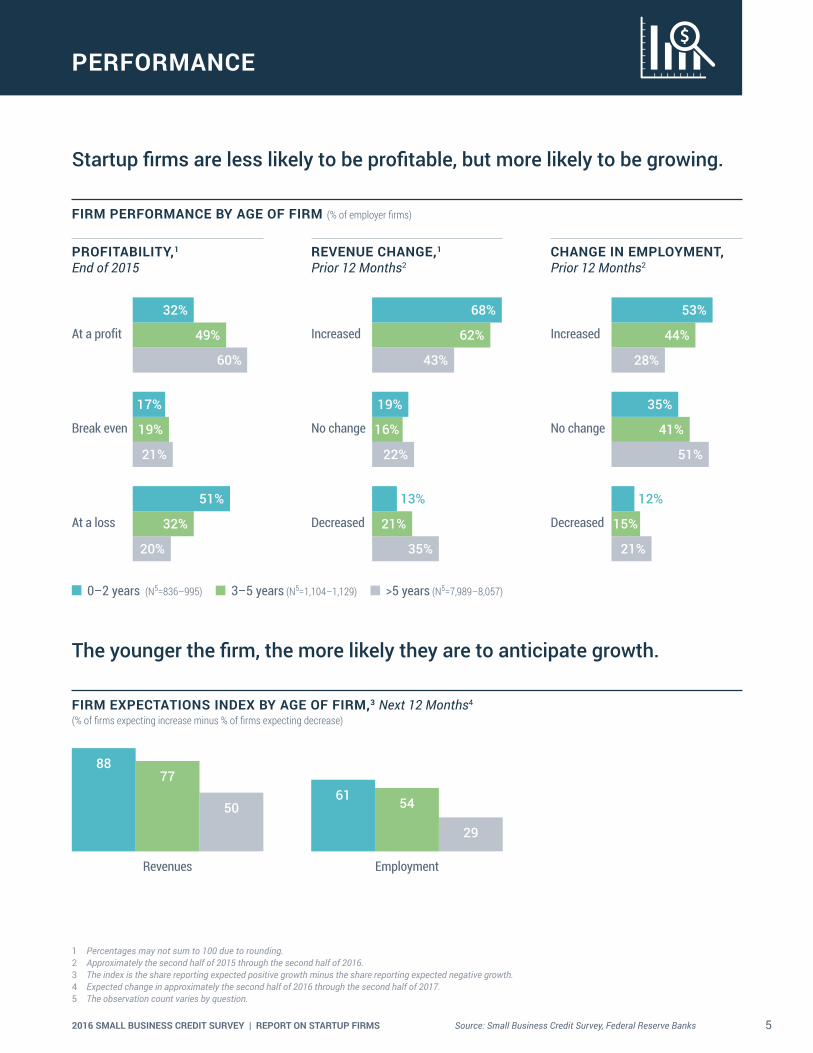
The younger the firm, the more likely they are to anticipate growth.
FIRM EXPECTATIONS INDEX BY AGE OF FIRM,3 Next 12 Months4 (% of firms expecting increase minus % of firms expecting decrease)
Revenues
54
29
77
50
88
61
Employment
PERFORMANCE
Startup firms are less likely to be profitable, but more likely to be growing.
FIRM PERFORMANCE BY AGE OF FIRM (% of employer firms)
PROFITABILITY,1 End of 2015
REVENUE CHANGE,1 Prior 12 Months2
CHANGE IN EMPLOYMENT, Prior 12 Months2
At a profit
Break even
At a loss
32%
60%
49%
17%
21%
19%
51%
20%
32%
Increased
No change
Decreased
68%
43%
62%
19%
22%
16%
13%
35%
21%
Increased
No change
Decreased
0–2 years (N5=836–995) 3–5 years (N5=1,104–1,129) >5 years (N5=7,989–8,057)
53%
44%
28%
35%
41%
51%
12%
15%
21%
1 Percentages may not sum to 100 due to rounding.2 Approximately the second half of 2015 through the second half of 2016.3 The index is the share reporting expected positive growth minus the share reporting expected negative growth.4 Expected change in approximately the second half of 2016 through the second half of 2017.5 The observation count varies by question.

62016 SMALL BUSINESS CREDIT SURVEY | REPORT ON STARTUP FIRMS Source: Small Business Credit Survey, Federal Reserve Banks
FINANCIAL CHALLENGES
SHARE OF FIRMS WITH FINANCIAL CHALLENGES1 BY AGE OF FIRM, Prior 12 Months (% of employer firms)
0–2 years N=1,009
3–5 years N=1,122
>5 years N=7,998
72% of 0–2 year old firms faced financial challenges in the prior 12 months.2
69%56%
72%
Credit availability is a top challenge among employer firms, but notably more so for startup firms.
TYPES OF FINANCIAL CHALLENGES BY AGE OF FIRM,3 Prior 12 Months (% of employer firms)
Credit availability or funds for expansion
Debt paymentsOperating expenses Purchasing inventory to fulfill contracts
None of the above
53%
39%
58%
40%34%
41%
28% 24%26%20%
15%23%
31%
44%
28%
0–2 years (N=1,009) 3–5 years (N=1,122) >5 years (N=7,998)
1 Financial challenges are listed in the “Types of Financial Challenges” chart below.2 Approximately the second half of 2015 through the second half of 2016.3 Respondents could select multiple options.4 Response options ‘negotiated terms with lender,’ ‘did not pay—debt went to collections,’ ‘unsure,’ and ‘other’ not shown in chart. See Appendix for more detail.5 Among firms >5 years, 73% used personal funds, 44% took out additional debt, 44% made a late payment, and 44% cut staff, hours,
and/or downsized operations (N=3,050).
ACTIONS4 TAKEN AS A RESULT OF FINANCIAL CHALLENGES,3,5 Prior 12 Months N=1,091(% of startup firms reporting financial challenges)
Used personal funds
Made a late payment
Took out additional debt
Cut staff, hours, and/or downsized operations
81%
45% 43% 42%
72016 SMALL BUSINESS CREDIT SURVEY | REPORT ON STARTUP FIRMS Source: Small Business Credit Survey, Federal Reserve Banks
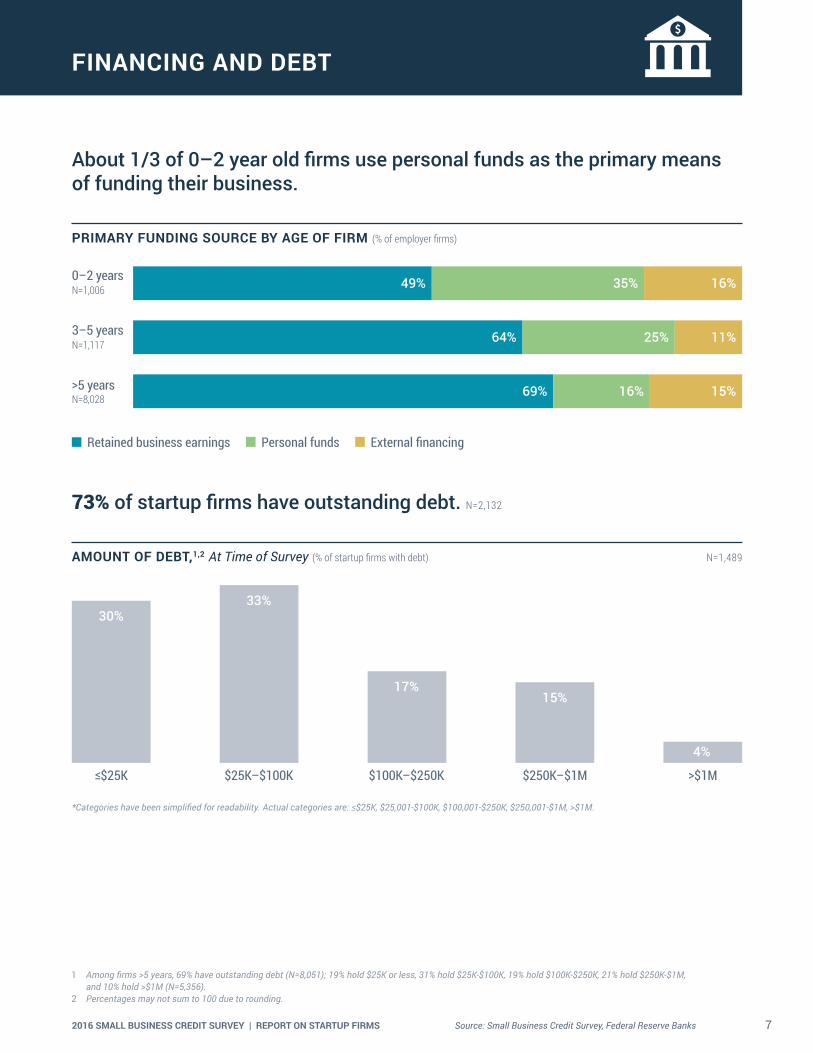
About 1/3 of 0–2 year old firms use personal funds as the primary means of funding their business.
15%16%69%
11%25%64%
PRIMARY FUNDING SOURCE BY AGE OF FIRM (% of employer firms)
3–5 yearsN=1,117
0–2 yearsN=1,006
>5 yearsN=8,028
Retained business earnings Personal funds External financing
16%35%49%
FINANCING AND DEBT
73% of startup firms have outstanding debt. N=2,132
AMOUNT OF DEBT,1,2 At Time of Survey (% of startup firms with debt) N=1,489
30%33%
17%15%
4%
≤$25K $25K–$100K $100K–$250K $250K–$1M >$1M
*Categories have been simplified for readability. Actual categories are: ≤$25K, $25,001-$100K, $100,001-$250K, $250,001-$1M, >$1M.
1 Among firms >5 years, 69% have outstanding debt (N=8,051); 19% hold $25K or less, 31% hold $25K-$100K, 19% hold $100K-$250K, 21% hold $250K-$1M, and 10% hold >$1M (N=5,356).
2 Percentages may not sum to 100 due to rounding.
82016 SMALL BUSINESS CREDIT SURVEY | REPORT ON STARTUP FIRMS Source: Small Business Credit Survey, Federal Reserve Banks
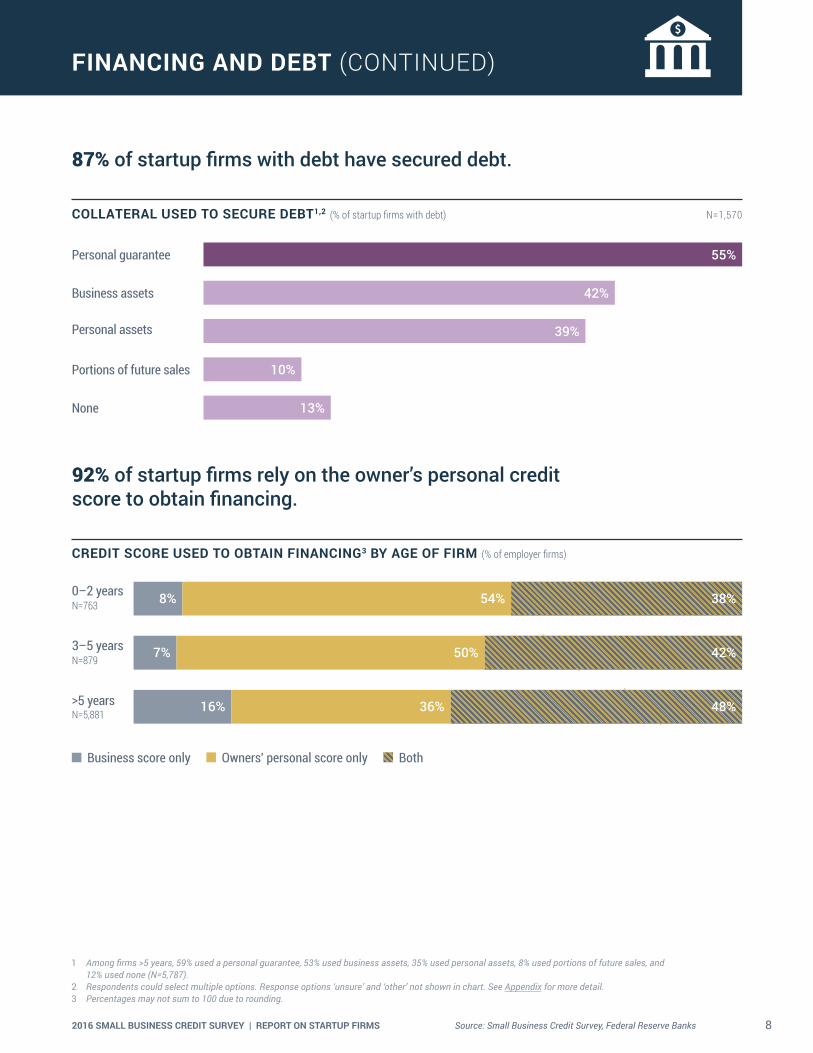
92% of startup firms rely on the owner’s personal credit score to obtain financing.
CREDIT SCORE USED TO OBTAIN FINANCING3 BY AGE OF FIRM (% of employer firms)
Business score only Owners' personal score only Both
3–5 yearsN=879
0–2 yearsN=763
>5 yearsN=5,881
48%36%16%
42%50%7%
38%54%8%
87% of startup firms with debt have secured debt.
FINANCING AND DEBT (CONTINUED)
COLLATERAL USED TO SECURE DEBT1,2 (% of startup firms with debt) N=1,570
Personal guarantee
Personal assets
55%
42%
39%
10%
13%
Business assets
Portions of future sales
None
1 Among firms >5 years, 59% used a personal guarantee, 53% used business assets, 35% used personal assets, 8% used portions of future sales, and 12% used none (N=5,787).
2 Respondents could select multiple options. Response options ‘unsure’ and ‘other’ not shown in chart. See Appendix for more detail.3 Percentages may not sum to 100 due to rounding.

92016 SMALL BUSINESS CREDIT SURVEY | REPORT ON STARTUP FIRMS Source: Small Business Credit Survey, Federal Reserve Banks
NONAPPLICANTS
Among startup firms, nonapplicants were less likely to have financial challenges than applicants.
PERFORMANCE OF NONAPPLICANTS AND APPLICANTS5 (% of startup firms)
62%50%
Low credit risk6
41% 37%
Operated at a profit7
39%46%
Growing8 Experienced no financial challenges9
42%
18%
Nonapplicants (N10=628–961) Applicants (N10=877–1,170)
48% of startup firms did not apply for financing.
DEMAND FOR FINANCING1 N = 2,159 (% of startup firms)
PRIMARY REASON FOR NOT APPLYING3 (% of nonapplicants)
Prior 12 Months2
52%Applied
48%Did not apply
0–5 years N=919
>5 years N=4,162
36% Sufficient financing
27% Debt averse
27% Discouraged4
51% Sufficient financing
27% Debt averse
13% Discouraged4
Credit cost high/ search too difficult
1 Among firms >5 years, 58% did not apply for financing (N=8,144).2 Approximately the second half of 2015 through the second half of 2016.3 Response option ‘other’ not shown. See Appendix for detail.4 Discouraged firms are those that did not apply for financing because they believed they would be turned down.5 Among nonapplicant firms >5 years, 77% are low credit risks, 62% are profitable, 18% are growing, and 56% experienced no financial challenges (N=2,503-4,340).
Among applicant firms >5 years, 61% are low credit risks, 56% are profitable, 26% are growing, and 28% experienced no financial challenges (N=2,574-3,658).6 Self-reported business credit score or personal credit score, depending on which is used to obtain financing for their business. If the firm uses both, the highest risk rating is
used. ‘Low credit risk’ is a 80-100 business score or 720+ personal credit score. ‘Medium/high credit risk’ is a 1-79 business score or <720 personal credit score.7 At the end of 2015.8 Firms that increased revenues and employees in the prior 12 months and that plan to increase or maintain their number of employees.9 Firms that did not experiences any of the following financial challenges in the past 12 months: Making payments on debt, paying operating expenses, purchasing
inventory or supplies to fulfill contracts, credit availability or securing funds for expansion.10 The observation count varies by question.

102016 SMALL BUSINESS CREDIT SURVEY | REPORT ON STARTUP FIRMS Source: Small Business Credit Survey, Federal Reserve Banks
NONAPPLICANTS (CONTINUED)
Startup nonapplicants face different challenges, which may play a role in their reasons for not applying.
CREDIT RISK1 OF STARTUP NONAPPLICANTS (% of startup nonapplicants selecting each reason)
69% of discouraged2 startup firms are medium or high credit risks.
Sufficient financing (N=204) Debt averse (N=176) Discouraged2 (N=171)
Low credit risk
72%
31%
83%
28%
69%
17%
Medium/high credit risk
Startup nonapplicants with sufficient financing were less likely to have experienced recent challenges compared to mature nonapplicants.
FINANCIAL CHALLENGES3 OF STARTUP NONAPPLICANTS (% of startup nonapplicants selecting each reason)
Sufficient financing (N=336) Debt averse (N=259) Discouraged2 (N=221)
Credit availability or funds for expansion
Debt paymentsOperating expenses Purchasing inventory to fulfill contracts
None of the above
37% 36%
22%
12%
36%
81%
55%
36%
27%
8%10% 11%5% 5%
80%
1 Self-reported business credit score or personal credit score, depending on which is used to obtain financing for their business. If the firm uses both, the highest risk rating is used. ‘Low credit risk’ is a 80-100 business score or 720+ personal credit score. ‘Medium/high credit risk’ is a 1-79 business score or <720 personal credit score.
2 Discouraged firms are those that did not apply for financing because they believed they would be turned down.3 Respondents could select multiple options.
112016 SMALL BUSINESS CREDIT SURVEY | REPORT ON STARTUP FIRMS Source: Small Business Credit Survey, Federal Reserve Banks
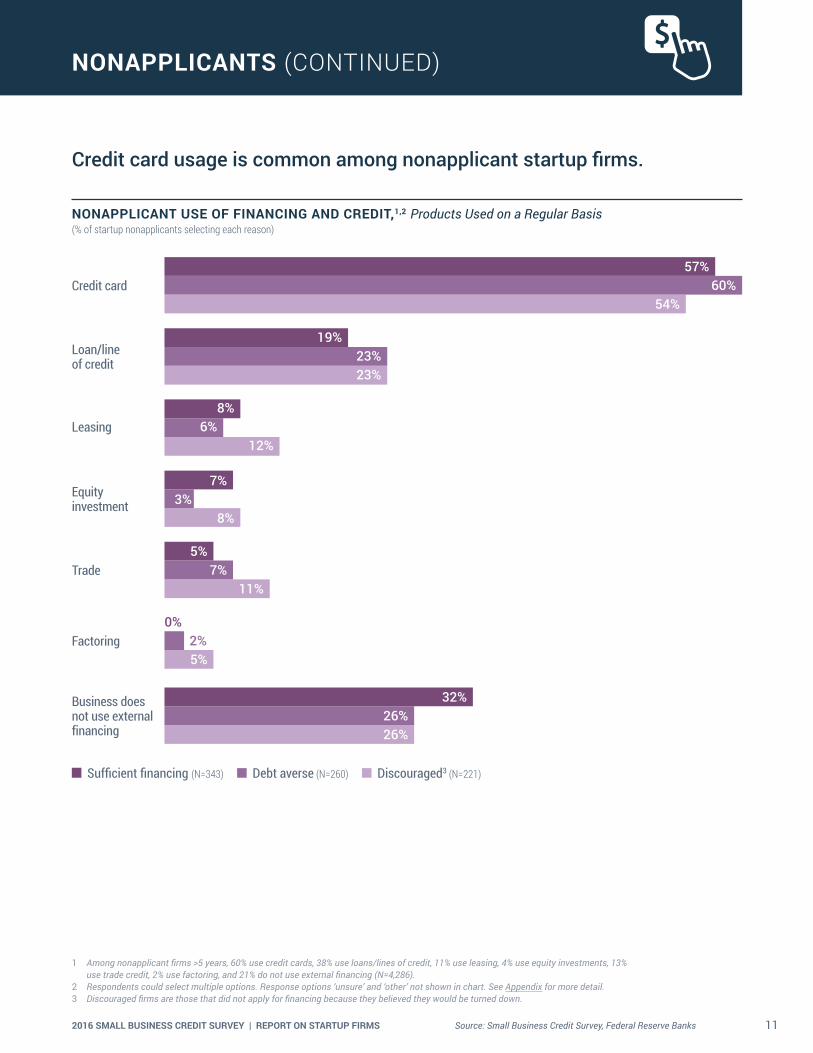
Credit card usage is common among nonapplicant startup firms.
NONAPPLICANTS (CONTINUED)
NONAPPLICANT USE OF FINANCING AND CREDIT,1,2 Products Used on a Regular Basis (% of startup nonapplicants selecting each reason)
Credit card
Equity investment
Loan/line of credit
Trade
Leasing
Factoring
Business does not use external financing
57%
7%
54%
8%
60%
3%
19%
5%
23%
11%
23%
7%
8%
0%
32%
12%
5%
26%
6%
2%
26%
Sufficient financing (N=343) Debt averse (N=260) Discouraged3 (N=221)
1 Among nonapplicant firms >5 years, 60% use credit cards, 38% use loans/lines of credit, 11% use leasing, 4% use equity investments, 13% use trade credit, 2% use factoring, and 21% do not use external financing (N=4,286).
2 Respondents could select multiple options. Response options ‘unsure’ and ‘other’ not shown in chart. See Appendix for more detail.3 Discouraged firms are those that did not apply for financing because they believed they would be turned down.

122016 SMALL BUSINESS CREDIT SURVEY | REPORT ON STARTUP FIRMS Source: Small Business Credit Survey, Federal Reserve Banks
DEMAND FOR FINANCING
DEMAND FOR FINANCING1 N = 2,159 (% of startup firms)
REASONS FOR APPLYING BY AGE OF FIRM3
(% of applicants)
Prior 12 Months2
48%Did not apply
52%Applied
52% of startup firms applied for financing.
0–5 years N=1,158
70% Expand business/
new opportunity
49% Operating expenses
7% Other4 20% Refinance
>5 years N=3,638
60% Expand business/
new opportunity
42% Operating expenses
8% Other4
27% Refinance
63% of startup applicants sought $100K or less.
TOTAL AMOUNT OF FINANCING SOUGHT (% of startup applicants) N = 1,136
25%
38%
18%15%
4%≤$25K $25K–$100K $100K–$250K $250K–$1M >$1M
*Categories have been simplified for readability. Actual categories are: ≤$25K, $25,001-$100K, $100,001-$250K, $250,001-$1M, >$1M.
1 Among firms >5 years, 42% applied for financing (N=8,144); 16% sought $25K or less, 33% sought $25K-$100K, 20% sought $100K-$250K, 20% sought $250K-$1M, and 11% sought >$1M (N=3,563).
2 Approximately the second half of 2015 through the second half of 2016.3 Respondents could select multiple options.4 Respondents who selected ‘other’ were asked to explain their reason for applying. They often indicated that they were looking to start
a business or to obtain a credit line in case they needed it.

132016 SMALL BUSINESS CREDIT SURVEY | REPORT ON STARTUP FIRMS Source: Small Business Credit Survey, Federal Reserve Banks
CREDIT APPLICATIONS
FINANCING AND CREDIT PRODUCTS SOUGHT1,2 (% of startup applicants) N=1,161
Loan/line of credit
Equity investment
86%
41%
11%
10%
9%
7%
Credit card
Leasing
Trade
Factoring
1 Among firms >5 years, 86% applied for a loan/line of credit, 24% applied for a credit card, 9% applied for an equity investment, 9% applied for leasing, 10% applied for trade credit, and 6% applied for factoring (N=3,639).
2 Respondents could select multiple options. Response option ‘other’ not shown in chart. See Appendix for more detail.3 Self-reported business credit score or personal credit score, depending on which is used to obtain financing for their business. If the firm uses both, the
highest risk rating is used. ‘Low credit risk’ is a 80-100 business score or 720+ personal credit score. ‘Medium/high credit risk’ is a 1-79 business score or <720 personal credit score.
86% of startup applicants sought a loan or line of credit.
Startup firms and higher credit risk firms seek credit cards at a higher rate than older or lower risk firms. Loans and lines of credit are commonly sought across all firm segments.
FINANCING AND CREDIT PRODUCTS SOUGHT BY AGE AND CREDIT RISK,3 Select Products (% of applicants)
CREDIT CARD LOAN/LINE OF CREDIT
0–5 years (N=410–465) >5 years (N=808–1,766)
Low credit risk Medium/high credit risk
38%
19%
47%
36%
0–5 years (N=410–465) >5 years (N=808–1,766)
Low credit risk Medium/high credit risk
84% 87% 90%84%
142016 SMALL BUSINESS CREDIT SURVEY | REPORT ON STARTUP FIRMS Source: Small Business Credit Survey, Federal Reserve Banks
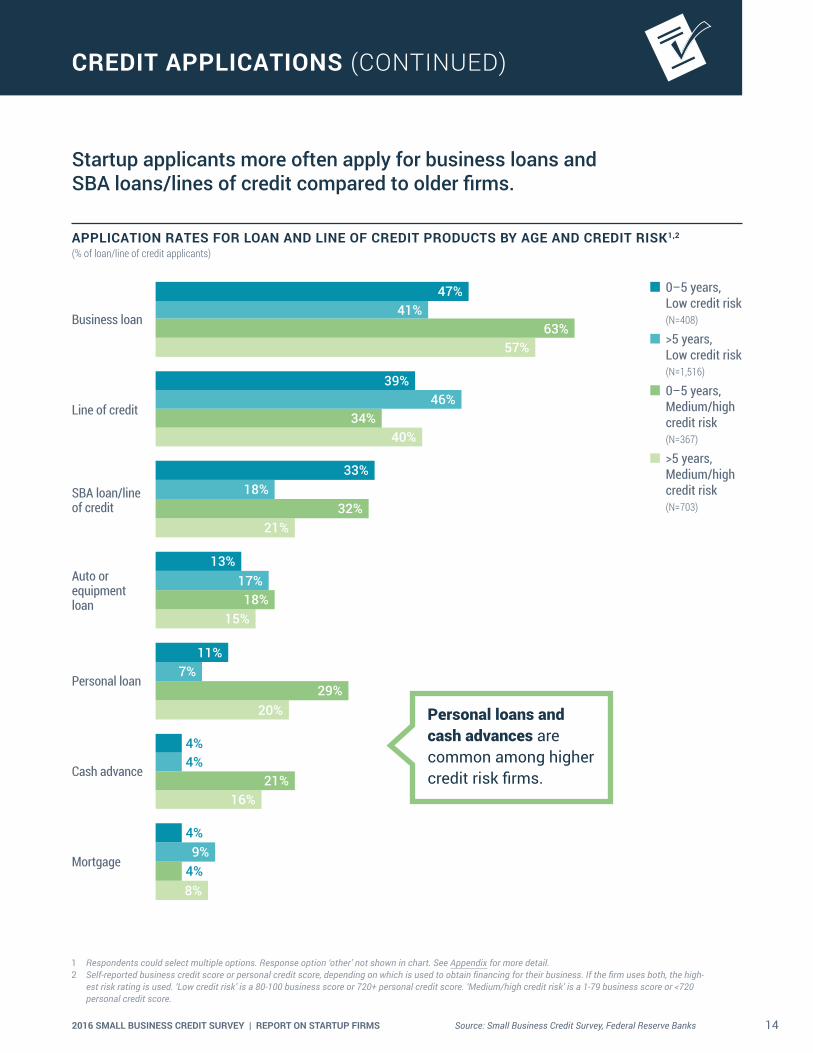
CREDIT APPLICATIONS (CONTINUED)
Startup applicants more often apply for business loans and SBA loans/lines of credit compared to older firms.
APPLICATION RATES FOR LOAN AND LINE OF CREDIT PRODUCTS BY AGE AND CREDIT RISK1,2 (% of loan/line of credit applicants)
Business loan
Line of credit
SBA loan/line of credit
Auto or equipment loan
Personal loan
Cash advance
Mortgage
47%
63%57%
41%
39%
34%40%
46%
33%
32%21%
18%
13%
11%
9%
8%
16%
4%
4%
4%
4%
18%
29%
15%
20%
21%
17%
7%
0–5 years, Low credit risk (N=408)
>5 years, Low credit risk (N=1,516)
0–5 years, Medium/high credit risk (N=367)
>5 years, Medium/high credit risk (N=703)
Personal loans and cash advances are common among higher credit risk firms.
1 Respondents could select multiple options. Response option ‘other’ not shown in chart. See Appendix for more detail.2 Self-reported business credit score or personal credit score, depending on which is used to obtain financing for their business. If the firm uses both, the high-
est risk rating is used. ‘Low credit risk’ is a 80-100 business score or 720+ personal credit score. ‘Medium/high credit risk’ is a 1-79 business score or <720 personal credit score.

152016 SMALL BUSINESS CREDIT SURVEY | REPORT ON STARTUP FIRMS Source: Small Business Credit Survey, Federal Reserve Banks
CREDIT SOURCES
Startup firms are most likely to make application decisions based on their perceived chance of being approved for financing.
TOP TWO FACTORS1 INFLUENCING WHERE FIRMS APPLY (% of applicants)
0–5 yearsN=1,150
>5 yearsN=3,643
1
2
Perceived chance of being fundedExisting relationship with lender
Medium and high credit risk firms often seek funding from online lenders.
CREDIT SOURCES APPLIED TO BY AGE AND CREDIT RISK2,3 (% of loan/line of credit applicants)
0–5 years, Low credit risk (N=408) >5 years, Low credit risk (N=1,516)
0–5 years, Medium/high credit risk (N=367) >5 years, Medium/high credit risk (N=703)
Large bank4 Small bank Online lender5 Credit union CDFI6
57%50% 53%
10%
45%
11%
49%
41% 39%
49%43%
35%
7% 7% 2% 7%12%9%
20%13%
1 Response options ‘price,’ ‘ease of application process,’ ‘speed of decision,’ ‘flexibility of product offerings,’ ‘referral,’ and ‘other’ not shown in table. See Appendix for more detail. Respondents could select multiple options.
2 Respondents could select multiple options. Response option ‘other’ not shown in chart. See Appendix for more detail. Respondents who selected ‘other’ were asked to describe the source. They most frequently cited auto/equipment dealers, farm-lending institutions, friends/family/owner, nonprofit organizations, and private investors.
3 Self-reported business credit score or personal credit score, depending on which is used to obtain financing for their business. If the firm uses both, the highest risk rating is used. ‘Low credit risk’ is a 80-100 business score or 720+ personal credit score. ‘Medium/high credit risk’ is a 1-79 business score or <720 personal credit score.
4 Respondents were provided a list of large banks (those with at least $10B in total deposits) operating in their state.5 ‘Online lenders’ are defined as nonbank alternative and marketplace lenders, including Lending Club, OnDeck, CAN Capital, and PayPal Working Capital.6 Community development financial institutions (CDFIs) are financial institutions that provide credit and financial services to underserved markets and populations.
CDFIs are certified by the CDFI Fund at the U.S. Department of the Treasury.
162016 SMALL BUSINESS CREDIT SURVEY | REPORT ON STARTUP FIRMS Source: Small Business Credit Survey, Federal Reserve Banks
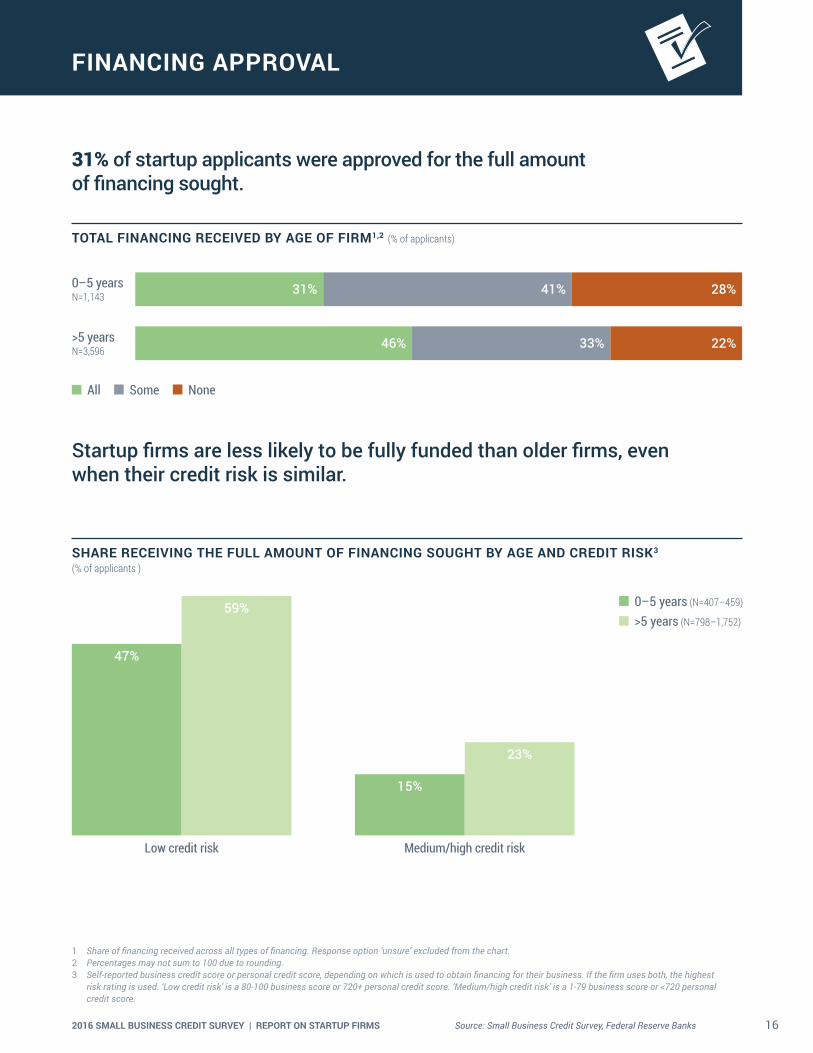
FINANCING APPROVAL
Startup firms are less likely to be fully funded than older firms, even when their credit risk is similar.
SHARE RECEIVING THE FULL AMOUNT OF FINANCING SOUGHT BY AGE AND CREDIT RISK3 (% of applicants )
0–5 years (N=407–459)
>5 years (N=798–1,752)
47%
59%
Low credit risk Medium/high credit risk
15%
23%
31% of startup applicants were approved for the full amount of financing sought.
TOTAL FINANCING RECEIVED BY AGE OF FIRM1,2 (% of applicants)
0–5 yearsN=1,143 28%41%31%
22%33%46%>5 yearsN=3,596
All Some None
1 Share of financing received across all types of financing. Response option ‘unsure’ excluded from the chart.2 Percentages may not sum to 100 due to rounding.3 Self-reported business credit score or personal credit score, depending on which is used to obtain financing for their business. If the firm uses both, the highest
risk rating is used. ‘Low credit risk’ is a 80-100 business score or 720+ personal credit score. ‘Medium/high credit risk’ is a 1-79 business score or <720 personal credit score.
172016 SMALL BUSINESS CREDIT SURVEY | REPORT ON STARTUP FIRMS Source: Small Business Credit Survey, Federal Reserve Banks
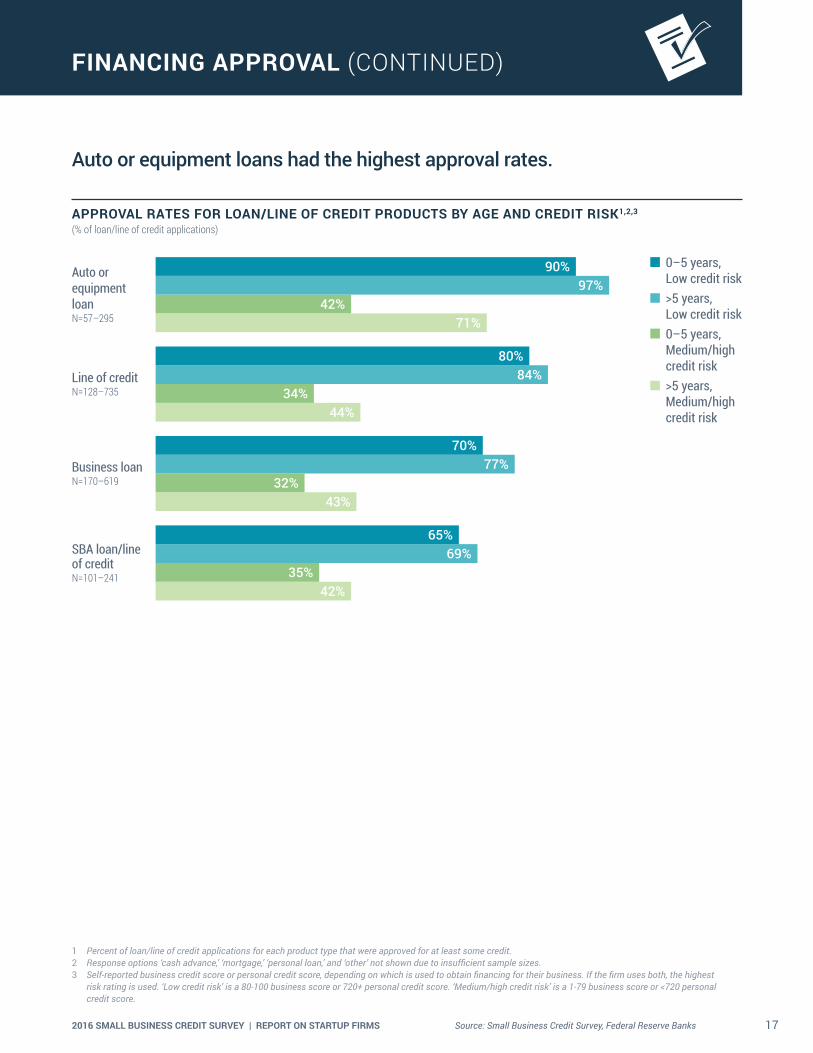
FINANCING APPROVAL (CONTINUED)
Auto or equipment loans had the highest approval rates.
APPROVAL RATES FOR LOAN/LINE OF CREDIT PRODUCTS BY AGE AND CREDIT RISK1,2,3 (% of loan/line of credit applications)
Auto or equipment loan N=57–295
Line of creditN=128–735
Business loanN=170–619
SBA loan/line of creditN=101–241
90%
42%71%
97%
80%
34%44%
84%
70%
32%43%
77%
65%
35%42%
69%
0–5 years, Low credit risk
>5 years, Low credit risk
0–5 years, Medium/high credit risk
>5 years, Medium/high credit risk
1 Percent of loan/line of credit applications for each product type that were approved for at least some credit.2 Response options ‘cash advance,’ ‘mortgage,’ ‘personal loan,’ and ‘other’ not shown due to insufficient sample sizes.3 Self-reported business credit score or personal credit score, depending on which is used to obtain financing for their business. If the firm uses both, the highest
risk rating is used. ‘Low credit risk’ is a 80-100 business score or 720+ personal credit score. ‘Medium/high credit risk’ is a 1-79 business score or <720 personal credit score.
182016 SMALL BUSINESS CREDIT SURVEY | REPORT ON STARTUP FIRMS Source: Small Business Credit Survey, Federal Reserve Banks
FINANCING APPROVAL (CONTINUED)
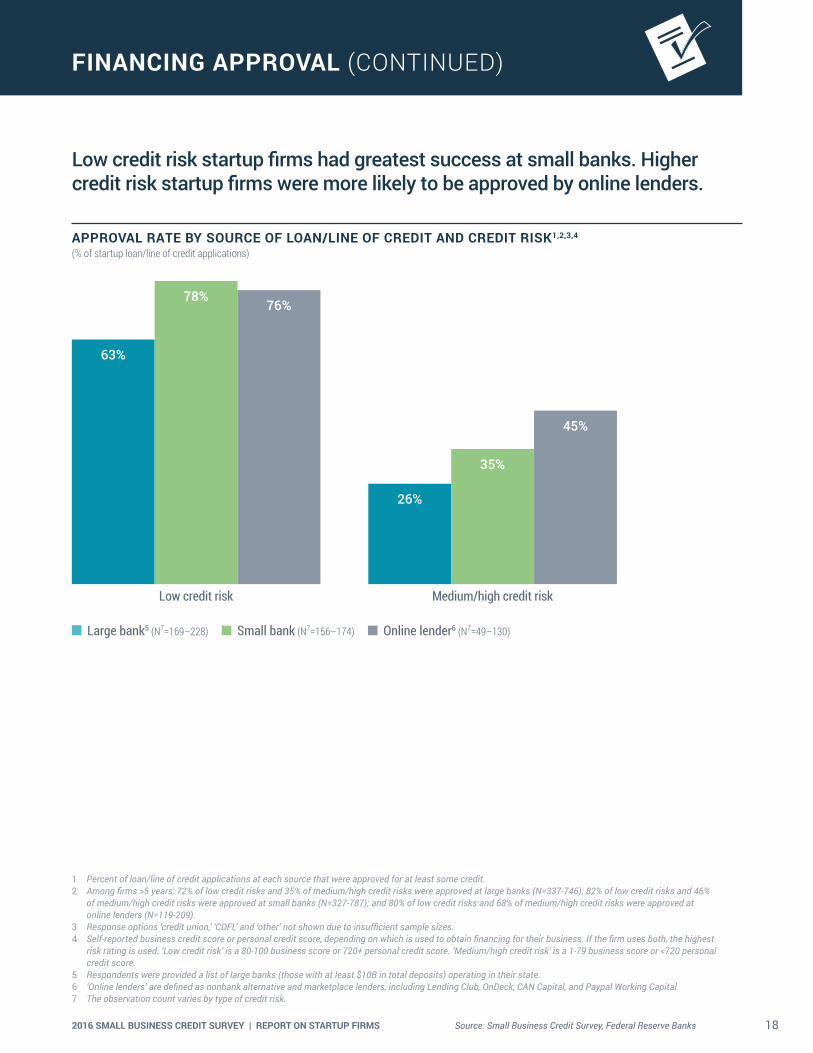
Low credit risk startup firms had greatest success at small banks. Higher credit risk startup firms were more likely to be approved by online lenders.
APPROVAL RATE BY SOURCE OF LOAN/LINE OF CREDIT AND CREDIT RISK1,2,3,4 (% of startup loan/line of credit applications)
Low credit risk
78%76%
63%
Medium/high credit risk
35%
45%
26%
Large bank5 (N7=169–228) Small bank (N7=156–174) Online lender6 (N7=49–130)
1 Percent of loan/line of credit applications at each source that were approved for at least some credit.2 Among firms >5 years, 72% of low credit risks and 35% of medium/high credit risks were approved at large banks (N=337-746); 82% of low credit risks and 46%
of medium/high credit risks were approved at small banks (N=327-787); and 80% of low credit risks and 68% of medium/high credit risks were approved at online lenders (N=119-209).
3 Response options ‘credit union,’ ‘CDFI,’ and ‘other’ not shown due to insufficient sample sizes.4 Self-reported business credit score or personal credit score, depending on which is used to obtain financing for their business. If the firm uses both, the highest
risk rating is used. ‘Low credit risk’ is a 80-100 business score or 720+ personal credit score. ‘Medium/high credit risk’ is a 1-79 business score or <720 personal credit score.
5 Respondents were provided a list of large banks (those with at least $10B in total deposits) operating in their state.6 ‘Online lenders’ are defined as nonbank alternative and marketplace lenders, including Lending Club, OnDeck, CAN Capital, and Paypal Working Capital.7 The observation count varies by type of credit risk.

192016 SMALL BUSINESS CREDIT SURVEY | REPORT ON STARTUP FIRMS Source: Small Business Credit Survey, Federal Reserve Banks
FINANCING SHORTFALLS
28% of startup applicants were not approved for any financing.69% of applicants had a financing shortfall, meaning they obtained less than the amount they sought.
SHARE WITH A FINANCING SHORTFALL BY CREDIT RISK1,2 (% of startup applicants)
85%
53%0-5 years, Low credit riskN=459
All startup firms (0–5 years)N=1,143
0-5 years, Medium/high credit riskN=407
69%
REASONS FOR CREDIT DENIAL BY AGE AND CREDIT RISK2,3 (% of applicants with a financing shortfall)
0–5 years Medium/high
credit riskN=290
>5 years Medium/high
credit riskN=500
>5 years Low credit risk
N=512
0–5 years Low credit risk
N=196
Insufficient collateral
Weak business performance
Low credit score
Too much debt already
Insufficient credit history
27%
21%
0%
16%
50%
28%
55%
47%
27%
36%
11%
36%
30%
2%
25%
40%
15%
34%
34%
48%
1 Among firms >5 years, 54% experienced a financing shortfall (N=3,596); 41% of low credit risks experienced a financing shortfall (N=1,752) and 77% of medium/high credit risks experienced a financing shortfall (N=798).
2 Self-reported business credit score or personal credit score, depending on which is used to obtain financing for their business. If the firm uses both, the highest risk rating is used. ‘Low credit risk’ is a 80-100 business score or 720+ personal credit score. ‘Medium/high credit risk’ is a 1-79 business score or <720 personal credit score.
3 Respondents could select multiple options. Response options ‘unfair lending practices,’ ‘unsure,’ and ‘other’ not shown in chart. See Appendix for more detail.

202016 SMALL BUSINESS CREDIT SURVEY | REPORT ON STARTUP FIRMS Source: Small Business Credit Survey, Federal Reserve Banks
LENDER SATISFACTION
Startup applicants are more satisfied with small banks, and often feel neutral about online lenders.
LENDER SATISFACTION1,2,3 (% of startup applicants at source)
Satisfied Neutral Dissatisfied
Small banksN=359
Large banks4
N=414
24%28%48%
40%29%31%
40% 37%23%Online lenders5
N=170
Reasons for dissatisfaction vary across credit sources. However, lack of transparency is a common concern among startup firms.
REASONS FOR DISSATISFACTION2,6,7,8 (% of startup applicants dissatisfied with lender)
Large banks4
N=170Small banks
N=105Online lenders5
N=68
High interest rate Unfavorable repayment terms Long wait for credit decision Difficult application process Lack of transparency
51%
25%14%18%
32%
50%
49%
46%
2%, 2%7%, 6%
50%
46%
37%
1 Among firms >5 years that applied at small banks, 64% were satisfied, 17% were neutral, and 19% were dissatisfied (N=1,332); at large banks, 40% were satisfied, 21% were neutral, and 39% were dissatisfied (N=1,330); and at online lenders, 37% were satisfied, 36% were neutral, and 27% were dissatisfied (N=317).
2 Response options ‘credit union,’ ‘CDFI,’ and ‘other’ not shown due to insufficient sample sizes.3 The values for lender satisfaction presented in the 2016 Report on Employer Firms include applicants that were approved at the source. Because of small sample
sizes, values presented here include applicants who were approved or denied at the source. For this reason, the reported lender satisfaction is not comparable across reports.
4 Respondents were provided a list of large banks (those with at least $10B in total deposits) operating in their state.5 ‘Online lenders’ are defined as nonbank alternative and marketplace lenders, including Lending Club OnDeck, CAN Capital, and PayPal Working Capital.6 Respondents could select multiple options. This question is not comparable to the 2015 survey because in the 2016 survey the response options of denied
applicants were limited to ‘long wait for credit decision,’ ‘difficult application process,’ and ‘lack of transparency.’7 Response option ‘other’ not shown in chart. See Appendix for more detail.8 Firms >5 years were dissatisfied at large banks for the following reasons: 5% high interest rate, 7% unfavorable terms, 48% long wait, 43% difficult process, 47% lack
of transparency (N=458); at small banks: 3% high interest rate, 4% unfavorable terms, 44% long wait, 37% difficult process, 45% lack of transparency (N=209); and at online lenders: 35% high interest rate, 20% unfavorable terms, 21% long wait, 27% difficult process, 48% lack of transparency (N=101).

212016 SMALL BUSINESS CREDIT SURVEY | REPORT ON STARTUP FIRMS
METHODOLOGY
DATA COLLECTION The Small Business Credit Survey (SBCS) uses a convenience sample of establishments. Businesses are contacted by email through a diverse set of organizations that serve the small business community.1 Prior SBCS participants and small businesses on pub-licly available email lists2 are also contacted directly by one of the Federal Reserve Banks. The survey instrument is an online question-naire that typically takes 6 to 12 minutes to complete, depending upon the intensity of a firm’s search for financing. The question-naire uses question branching and flows based upon responses to survey questions. For example, financing applicants receive a different line of questioning than nonappli-cants. Therefore, the number of observations for each question varies according to how many firms receive and complete a particular question.
WEIGHTING A sample for the SBCS is not selected randomly; thus, the SBCS may be subject to biases not present with surveys that do select firms randomly. For example, there are likely small employer firms not on one of our contact lists and this may lead to a noncoverage bias. We control for potential biases by weighting the sample data so that the weighted distribution of firms in the SBCS matches the distribution of the small (1 to 499 employees) firm population in the United States by number of employees, age, industry,
and geographic location (census division and urban or rural location). We collaborate with the National Opinion Research Center (NORC) in order to calculate these weights. The data used for weighting come from data collected by the U.S. Census Bureau.3 While weighting the data makes the sample considerably more representative of the small firm population, the SBCS is still potentially affected by nonresponse bias, something that should be taken into consideration when interpreting the results.
COMPARISONS TO PAST REPORTS Because previous SBCS reports have varied in terms of the population scope, geographic coverage, and weighting methodology, the survey reports are not directly comparable across time.
For example, both employer and nonem-ployer firm results from the 2014 survey are combined into one report (published in 2015) while employers and nonemployers are divided into separate reports for the 2015 and 2016 surveys (published in 2016 and 2017,4 respectively).
Moreover, geographic coverage and weighting strategies varied from year to year. In the employer/nonemployer combined report using 2014 survey data, geographic coverage includes only 10 states and data are weighted by firm age, nonemployer/employer, number of employees (if employer firm), state, and industry. The employer report using 2015
survey data covers 26 states and is weighted by firm age, number of employees, and indus-try. The employer report using 2016 survey data includes respondents from all 50 states and the District of Columbia. The data are weighted by firm age, number of employees, industry, and geographic location (census di-vision and urban or rural location). In addition to being weighted by different firm charac-teristics over time, the categories used within each characteristic have also differed across survey years (there were three employee size categories in 2015, and five employee size categories in 2016). Further, respondents are weighted according to the composition of firms in the geographic area of coverage.
In addition to population scope, geographic coverage, and weighting differences, some of the survey questions have also changed slightly from year to year, making some ques-tion comparisons impossible even when using a time-consistent weighting approach.
Finally, this report on startup firms focuses on employer firms that have been established for five years or less, whereas past reports have used the term “startup” to refer to those firms less than three years in age. For these reasons, data in this report cannot be com-pared to past reports (those published prior to 2017). However, this report does use a weighting approach consistent with that of the 2016 Small Business Credit Survey Report on Employer Firms,5 and therefore the two reports can be compared, unless indicated otherwise.
1 For a full list of community partners, please see p. 23.2 System for Award Management (SAM) Entity Management Extracts Public Data Package, Small Business Association (SBA) Dynamic Small Business
Search (DSBS), state-maintained lists of certified disadvantaged business enterprises (DBEs), state and local government Procurement Vendor Lists , state and local government-maintained lists of small or disadvantaged small businesses, a list of veteran-owned small businesses maintained by the Department of Veterans Affairs.
3 Age of firm data come from the 2014 Business Dynamics Statistics. Industry, employee size, and geographic location data are from the 2014 County Business Patterns. We use data from the Center for Medicare and Medicaid Services to classify a business’s zip code as urban or rural. In subsequent reports, we will compare businesses by the gender and race of the owner(s). When we do this, we will also weight the data by demographic data collected in the 2012 Survey of Business Owners.
4 The 2016 nonemployer report will be released later this year.5 Federal Reserve Banks, 2016 Small Business Credit Survey Report on Employer Firms.
222016 SMALL BUSINESS CREDIT SURVEY | REPORT ON STARTUP FIRMS
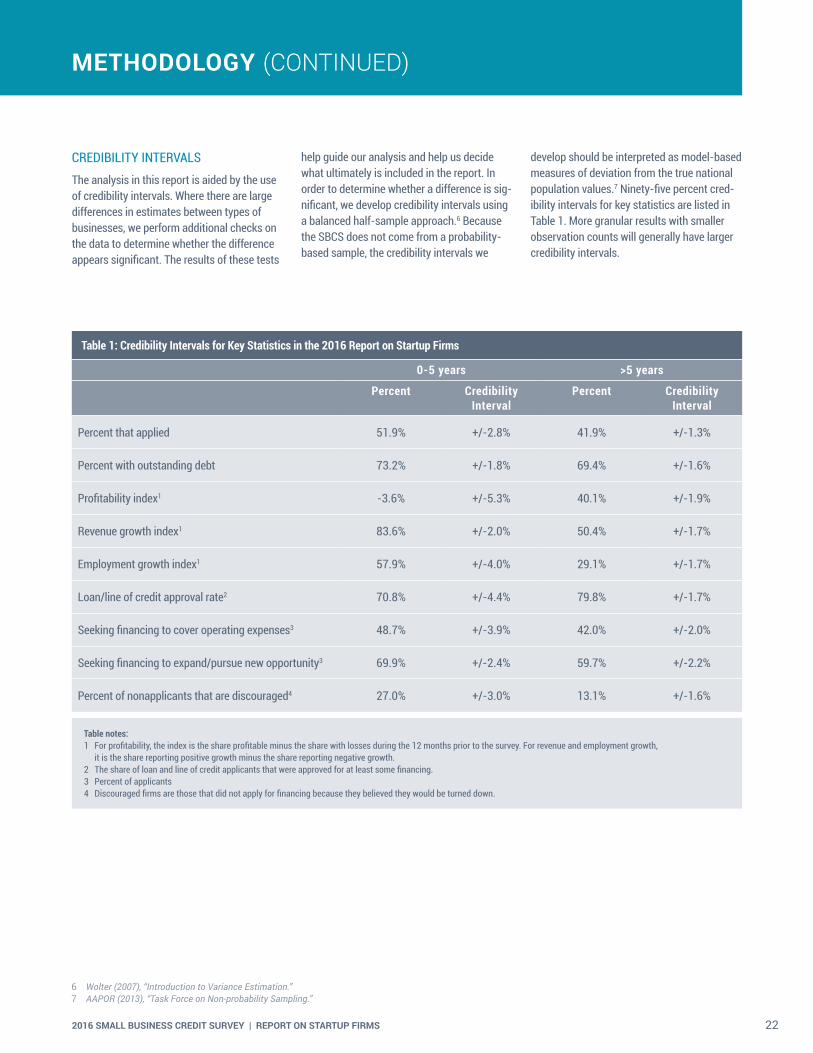
CREDIBILITY INTERVALS The analysis in this report is aided by the use of credibility intervals. Where there are large differences in estimates between types of businesses, we perform additional checks on the data to determine whether the difference appears significant. The results of these tests
help guide our analysis and help us decide what ultimately is included in the report. In order to determine whether a difference is sig-nificant, we develop credibility intervals using a balanced half-sample approach.6 Because the SBCS does not come from a probability-based sample, the credibility intervals we
develop should be interpreted as model-based measures of deviation from the true national population values.7 Ninety-five percent cred-ibility intervals for key statistics are listed in Table 1. More granular results with smaller observation counts will generally have larger credibility intervals.
6 Wolter (2007), “Introduction to Variance Estimation.”7 AAPOR (2013), “Task Force on Non-probability Sampling.”
METHODOLOGY (CONTINUED)
Table 1: Credibility Intervals for Key Statistics in the 2016 Report on Startup Firms
0-5 years >5 years
Percent Credibility Interval
Percent Credibility Interval
Percent that applied 51.9% +/-2.8% 41.9% +/-1.3%
Percent with outstanding debt 73.2% +/-1.8% 69.4% +/-1.6%
Profitability index1 -3.6% +/-5.3% 40.1% +/-1.9%
Revenue growth index1 83.6% +/-2.0% 50.4% +/-1.7%
Employment growth index1 57.9% +/-4.0% 29.1% +/-1.7%
Loan/line of credit approval rate2 70.8% +/-4.4% 79.8% +/-1.7%
Seeking financing to cover operating expenses3 48.7% +/-3.9% 42.0% +/-2.0%
Seeking financing to expand/pursue new opportunity3 69.9% +/-2.4% 59.7% +/-2.2%
Percent of nonapplicants that are discouraged4 27.0% +/-3.0% 13.1% +/-1.6%
Table notes:1 For profitability, the index is the share profitable minus the share with losses during the 12 months prior to the survey. For revenue and employment growth,
it is the share reporting positive growth minus the share reporting negative growth.2 The share of loan and line of credit applicants that were approved for at least some financing.3 Percent of applicants4 Discouraged firms are those that did not apply for financing because they believed they would be turned down.

232016 SMALL BUSINESS CREDIT SURVEY | REPORT ON STARTUP FIRMS
PARTNER ORGANIZATIONS
NATIONAL PARTNER ORGANIZATIONS � Accion U.S. Network
� Association for Enterprise Opportunity (AEO)
� National Association for Latino Community Asset Building
� National Association of Manufacturers
� National Association of Women Business Owners
� NFIB Research Foundation
� National League of Cities
� National Retail Federation
� Opportunity Finance Network (OFN)
� U.S. Chamber of Commerce
AFFILIATES OF NATIONAL PARTNER ORGANIZATIONS � Accion Chicago
� Accion New Mexico
� Alabama MicroEnterprise Network (AMEN)
� AltCap
� Anchor Financial Services
� Asian Pacific Islander Small Business Program
� Avenida Guadalupe Association
� BBIF Florida
� CAP Services Inc.
� CDC Small Business Finance
� CIELO
� City First Enterprises
� City of Austin Small Business Program
� City of Chicago
� City of Dallas—Office of Economic Development
� City of San Diego
� Colorado Enterprise Fund
� Common Capital
� Community Business Partnership
� Community Concepts Finance Corporation
� Community Investment Corporation
� Community Loan Fund of the Capital Region, Inc.
� Cooperative Fund of New England
� DC Department of Small & Local Business Development
� Economic and Community Development Institute
� Entrepreneur Works Fund
� FINANTA
� Fresno CDFI
� Golden State Certified Development Corporation
� Green America's Green Business Network
� Gulf Coast Renaissance Corporation
� HAP
� Hispanic Economic Development Corporation
� IICDC
� Jefferson Economic Development Institute
� Kansas City, Missouri Business Customer Service Center
� LAUNCH
� Lower 9th Ward Neighborhood Empowerment Network Association (NENA)
� MACED
� Main Street Launch
� Main Street Project
� Maryland Capital Enterprises, Inc.
� Microenterprise Resources, Initiatives and Training (MERIT)
� National Coalition of 100 Black Women Central Florida Chapter
� Natural Capital Investment Fund
� Neighborhood Lending Partners
� NeighborWorks of Western Vermont
� Northern Initiatives
� Northwest Pennsylvania Regional Planning and Development Commission
� Ohio Council of Retail Merchants
� Opportunities Credit Union
� Opportunity Fund
� Pacific Coast Regional Small Business Development Corporation
� Pacific Community Ventures
� Pacific Island Knowledge 2 Action Resources
� Partners for the Common Good
� Pathway Lending
� PIDC
� PPEP Microbusiness & Housing Development Corporation
� Rural Enterprise Assistance Project-REAP
� San Antonio for Growth on the Eastside, Inc. (SAGE)
� Santa Cruz Community Credit Union
� SBCP
� SF OEWD
� South Dakota Retailers Association
� Start Small Think Big
� Tampa Bay BBIC
� The Community Economic Development Fund Foundation, Inc.
� The Enterprise Center Capital Corporation
242016 SMALL BUSINESS CREDIT SURVEY | REPORT ON STARTUP FIRMS
PARTNER ORGANIZATIONS (CONTINUED)
� The Wright Way Up Of Atlanta, Inc.
� Tierra del Sol Housing Corporation
� TILT Forward Network
� TruFund Financial Services, Inc.
� Uptima Business Bootcamp
� Women's Opportunities Resource Center
� WORC
� World Beyond Boundaries
FEDERAL RESERVE BANK OF ATLANTA � Alabama Chamber of Commerce
� Alabama Department of Commerce
� Alabama Department of Economic and Community Affairs
� Alabama Micro Enterprise Network (AMEN)
� Alabama SBDC Network
� Albany Business League
� American Sugar Cane League
� BancorpSouth
� Chatham Business Association
� Chattanooga Area Chamber of Commerce
� Cherokee County Chamber of Commerce
� Citizens National Bank
� Clarksville Area Chamber of Commerce
� Coastal Alabama Business Chamber
� Coastal Georgia Indicators Coalition
� Committee of 100
� Community Bank of Mississippi
� Community Enterprise Investments, Inc.
� Economic Development Commission of Florida's Space Coast
� Florida Bank of Commerce
� Florida Capital Bank
� Florida Chamber of Commerce
� Florida SBDC at FIU
� Florida SBDC at University of West Florida College of Business
� Florida SBDC Network
� Gainesville Area Chamber of Commerce
� Georgia Council for Arts
� Georgia Department of Community Affairs
� Georgia Florida Alliance
� Georgia Hispanic Chamber
� Georgia Micro Enterprise Network (GMEN)
� Georgia Minority Supplier Development Council
� Georgia SBDC
� Greater Fort Lauderdale Convention and Visitors Bureau
� Greater New Orleans, Inc.
� Gulf Coast Business Council
� Hispanic Chamber of Commerce of Louisiana
� Home Builders Association of Greater Knoxville
� Home Builders Association of Tennessee
� Hope Enterprise Corporation
� Huntsville Chamber of Commerce
� Jackson State SBDC
� Jackson State University
� Jeff Davis Parish Economic Development & Tourism Commission
� Kingsport Chamber
� Louisiana Chamber of Commerce
� Louisiana Economic Development
� Louisiana SBDC
� Meridian East Mississippi Business Development Corp.
� Metro Atlanta Chamber
� Middle Tennessee Association of Realtors
� Mississippi Manufacturing Association
� Mississippi Minority Business Alliance, Inc.
� Mississippi SBA
� Mobile Area Chamber of Commerce
� Montgomery Chamber of Commerce
� New Orleans Chamber of Commerce
� New Orleans Metropolitan Convention and Visitors Bureau
� New Orleans Regional Committee of Business Economists
� North Alabama Revolving Loan Fund
� Northeast Florida Association of Realtors
� NOW Corp
� Pathway Lending
� Regions Bank, Jackson, MS
� South Florida Manufacturers Association
� Southern Region Minority Supplier Development Council
� Southern University at New Orleans SBDC Management Institute
� SW Louisiana Economic Development Alliance
� Tech Square Labs
� Technology Association of Georgia
� Tennessee Chamber of Commerce
� The New Orleans Board of Trade
252016 SMALL BUSINESS CREDIT SURVEY | REPORT ON STARTUP FIRMS
� United Bank, Atmore, AL
� United Way of Southeast Louisiana
� University of Georgia SBDC
� University of Georgia SBDC Network
� USDA
� Village Micro Fund
� Wells Fargo
� Women's Business Enterprise Council South
FEDERAL RESERVE BANK OF BOSTON � Cape Cod Chamber of Commerce
� City of Boston
� Commonwealth of Massachusetts, Operational Services Division
� Greater Boston Chamber of Commerce
� Greater Concord Chamber of Commerce
� Greater Manchester Chamber of Commerce
� Greater Nashua Chamber of Commerce
� Greater Providence Chamber of Commerce
� HarborOneU
� Interise
� Massachusetts Small Business Development Center
� Metro South Chamber of Commerce
� Middlesex County Chamber of Commerce
� New Bedford Area Chamber
� New Hampshire Business & Industry Association
� North Central Massachusetts Chamber of Commerce
� Plymouth Area Chamber of Commerce
� Retailers Association of Massachusetts
� Rhode Island Small Business Development Center
� Souhegan Valley Chamber of Commerce
� Worcester Regional Chamber of Commerce
FEDERAL RESERVE BANK OF CLEVELAND � CityWide Development Corp
� Commerce Lexington
� Dayton Area Chamber of Commerce
� Dayton HRC
� Gannon University SBDC
� Indiana County Chamber of Commerce
� Kentucky Small Business Development Center
� Manufacturer & Business Association
� Youngstown/Warren Regional Chamber
FEDERAL RESERVE BANK OF KANSAS CITY � Adams County Economic Development
� Albuquerque Hispano Chamber of Commerce
� Boulder SBDC
� Catholic Charities
� CML Collective, LLC
� Denver Metro Chamber of Commerce
� Fab Lab ICC at Independence Community College
� Greater Fremont Development Council
� Greater Kansas City Hispanic Chamber Commerce
� Greater Oklahoma City Chamber of Commerce
� Greater Omaha Chamber
� Kauffman Foundation
� KC SourceLink
� McPherson Chamber of Commerce
� Missouri Chamber of Commerce and Industry
� Mountain Plains MSDC
� Nebraska Enterprise Fund
� Nebraska Extension
� NetWork Kansas
� NM Economic Development Department
� North Kansas City Business Council
� Office of Minority and Women Business, Kansas Department of Commerce
� OK Dept. of Career & Technology Education
� Overland Park Chamber of Commerce
� REI Oklahoma
� Santa Fe Business Incubator
� Southeast Missouri State University-Institute for Regional Innovation and Entrepreneurship
� The Colorado Office of Economic Development and International Trade
� The Finance New Mexico project (Holly Co publishers)
� Wichita Hispanic Chamber of Commerce
� Wichita Metro Chamber of Commerce
� Women's Business Center
� Wyoming Business Council
PARTNER ORGANIZATIONS (CONTINUED)
262016 SMALL BUSINESS CREDIT SURVEY | REPORT ON STARTUP FIRMS
FEDERAL RESERVE BANK OF MINNEAPOLIS � Affinity Plus Federal Credit Union
� African Development Center of Minnesota
� Bemidji Area Chamber of Commerce
� Central (CERT) Certification Program, The City of Saint Paul
� Community Reinvestment Fund, USA
� Dakota Resources
� Entrepreneur Fund
� Four Band Community Fund
� Initiative Foundation
� Iverson Corner Drug
� Metro Independent Business Alliance
� MetroNorth Chamber
� Metropolitan Consortium of Community Developers
� Metropolitan Economic Development Association (MEDA)
� Minnesota American Indian Chamber of Commerce
� Minnesota Chamber of Commerce
� Minnesota District, U.S. Small Business Administration
� Minnesota Indian Business Alliance (MNIBA)
� MJB home center
� Neighborhood Development Center
� New Ulm Area Chamber of Commerce
� North 65 Chamber of Commerce
� Northwest Minnesota Foundation
� Park Rapids Lakes Area Chamber of Commerce
� PGC
� Pinnacle
� Progress Plus
� Quarks American Bento
� RP Broadcasting, Inc.
� The Dive Depot
� Top Shelf Hockey Shop
� Vadnais Heights Economic Development Corporation
� Wisconsin Indian Business Alliance
� Worthington Area Chamber of Commerce
FEDERAL RESERVE BANK OF NEW YORK � BOC Capital Corp.
� Bridgeport Regional Business Council
� Capital for Change
� Connecticut Business and Industry Association
� Connecticut Economic Resource Center (CERC)
� Connecticut Office of Business and Industry Development
� Connecticut Small Business Development Center
� Dept. of Economic and Comm. Dev., Connecticut Office of Small Business Affairs
� Empire State Development
� Endeavor
� Greater Bridgeport Latino Network
� Greater Newark Enterprise Corp.
� Intersect Fund
� Metro Hartford Alliance
� New Jersey Community Capital (NJCC)
� New Jersey Innovation Institute @ NJIT
� New Jersey Institute of Technology
� NJ Economic Development Authority
� NYC Department of Small Business Services
� Polsky Center for Entrepreneurship and Innovation
� reSET
� Rising Tide Capital
� Rutgers University Graduate School
� Statewide Hispanic Chamber of Commerce of New Jersey
� Statewide Hispanic Chamber of Commerce of NJ
� The Business Council of Fairfield County
� The WorkPlace
� UCEDC, a nonprofit economic development corporation
� USDA Rural Development
� Women's Center for Entrepreneurship
FEDERAL RESERVE BANK OF PHILADELPHIA � Delaware Small Business Development Center
� Latin American Economic Development Association
� Pennsylvania SBDC Lead Office
� SEDA-Council of Governments
� Upper Bucks Chamber of Commerce
PARTNER ORGANIZATIONS (CONTINUED)

272016 SMALL BUSINESS CREDIT SURVEY | REPORT ON STARTUP FIRMS
FEDERAL RESERVE BANK OF RICHMOND � Asheville Area Chamber of Commerce
� Baltimore Community Lending
� Blowing Rock Chamber of Commerce
� Botetourt County Chamber of Commerce
� Carolina Small Business Development Fund
� CommunityWorks
� Danville Pittsylvania County Chamber of Commerce
� Falls Church Chamber of Commerce
� Franklin-Southampton Area Chamber of Commerce
� Garrett County Chamber of Commerce
� Greater Raleigh Chamber of Commerce
� Greater Winston-Salem Chamber of Commerce
� Greensboro Chamber of Commerce
� Henderson County Chamber of Commerce
� Howard County Chamber of Commerce
� Latino Economic Development Center
� Leadership Maryland
� Loudoun County Chamber of Commerce
� Maryland Capital Enterprises, Inc.
� Maryland Economic Development Association (MEDA)
� Maryland Governor's Office of Minority Affairs
� Maryland Hispanic Chamber of Commerce
� Maryland Southern Region Small Business Development Center
� Natural Capital Investment Fund (NCIF)
� Neighborhood BusinessWorks, Maryland Department of Housing and Community Development
� North Carolina District Office, U.S. Small Business Administration
� North Carolina Small Business and Technology Development Center (NC SBTDC)
� North Carolina Small Business Center Network, North Carolina Community College System (SBCN)
� Northern Virginia Chamber of Commerce
� Richmond SCORE
� Roxboro Area Chamber of Commerce
� RVA Works
� South Carolina Association for Community Economic Development (SCACED)
� South Carolina Department of Commerce
� State Delegation District and State Directors, Congressional Offices
� Unlimited Future, Inc.
� Virginia Peninsula Chamber of Commerce
� Virginia Small Business Development Center Network
� Virginia Small Business Financing Authority
� West Virginia Small Business Development Center
� Windsor-Bertie County Chamber of Commerce
� Women Presidents' Educational Organization—DC (WPEO-DC)
� Yadkin County Chamber of Commerce
FEDERAL RESERVE BANK OF ST. LOUIS � Arkansas Innovation Hub
� Arkansas Small Business and Technology Development Center
� Arkansas State Chamber of Commerce
� Communities Unlimited
� Community Services Microbusiness Program
� Community Ventures
� eFactory-Missouri State University Business Incubator
� Entrepreneur Center at Mississippi Development Authority
� Green River Area Development District
� Justine Peterson (CDFI)
� LiftFund
� Mid-South Minority Business Continuum
� Office of Entrepreneurship-KY Cabinet for Economic Development
� Southern Illinois University—Office of Economic & Regional Development
� Tennessee Small Business Development Center-Memphis
� Winrock International
PARTNER ORGANIZATIONS (CONTINUED)
282016 SMALL BUSINESS CREDIT SURVEY | REPORT ON STARTUP FIRMS
FEDERAL RESERVE BANK OF SAN FRANCISCO � Accion San Diego
� California Small Business Association
� Chamber of Commerce Hawaii
� College of the Canyons Small Business Development Center
� Clearinghouse CDFI
� Council for Native Hawaiian Advancement
� Enterprise Honolulu (Oahu Economic Development Board)
� Fresno SBA Office
� Hawaii Alliance for Community Based Economic Development
� Hawaii Green Infrastructure Authority
� Hawaii Small Business Development Center
� Honolulu Business Network
� Local First Arizona
� Los Angeles Regional SBDC
� Main Street BIDCO Capital
� Maricopa Small Business Development Center
� Maui Economic Development Board
� National Development Council—Greater Salt Lake Area
� Nevada Small Business Development Center
� Northern Nevada SCORE
� Orange County / Inland Empire Regional SBDC
� Orange County SBDC
� Pacific Asian Consortium in Employment (PACE)
� Patsy T. Mink Center for Business & Leadership
� SBA, Hawaii District Office
� State of Hawaii Department of Commerce and Consumer Affairs Business Action Center
� State of Hawaii, Department of Business, Economic Development & Tourism
� The Kohala Center
� University of La Verne SBDC
� USDA Rural Development
� Valley Small Business Development Corporation
� Women's Economic Ventures
PARTNER ORGANIZATIONS (CONTINUED)